The supplemental figures here are the full set of the maps of spatial residuals for each of the five ground-motion prediction equations (GMPEs) discussed in the main article (Abrahamson et al., 2014; Boore et al., 2014; Campbell and Bozorgnia, 2014; Chiou and Youngs, 2014; and Graizer and Kalkan, 2015) and for all five periods considered (peak ground acceleration [PGA], peak ground velocity [PGV], and pseudospectral acceleration [PSA] at 0.3, 1.0, and 3.0 s). We also show the comparison of using the direct-point parameter (DPP) in the Chiou and Youngs (2014) GMPE.
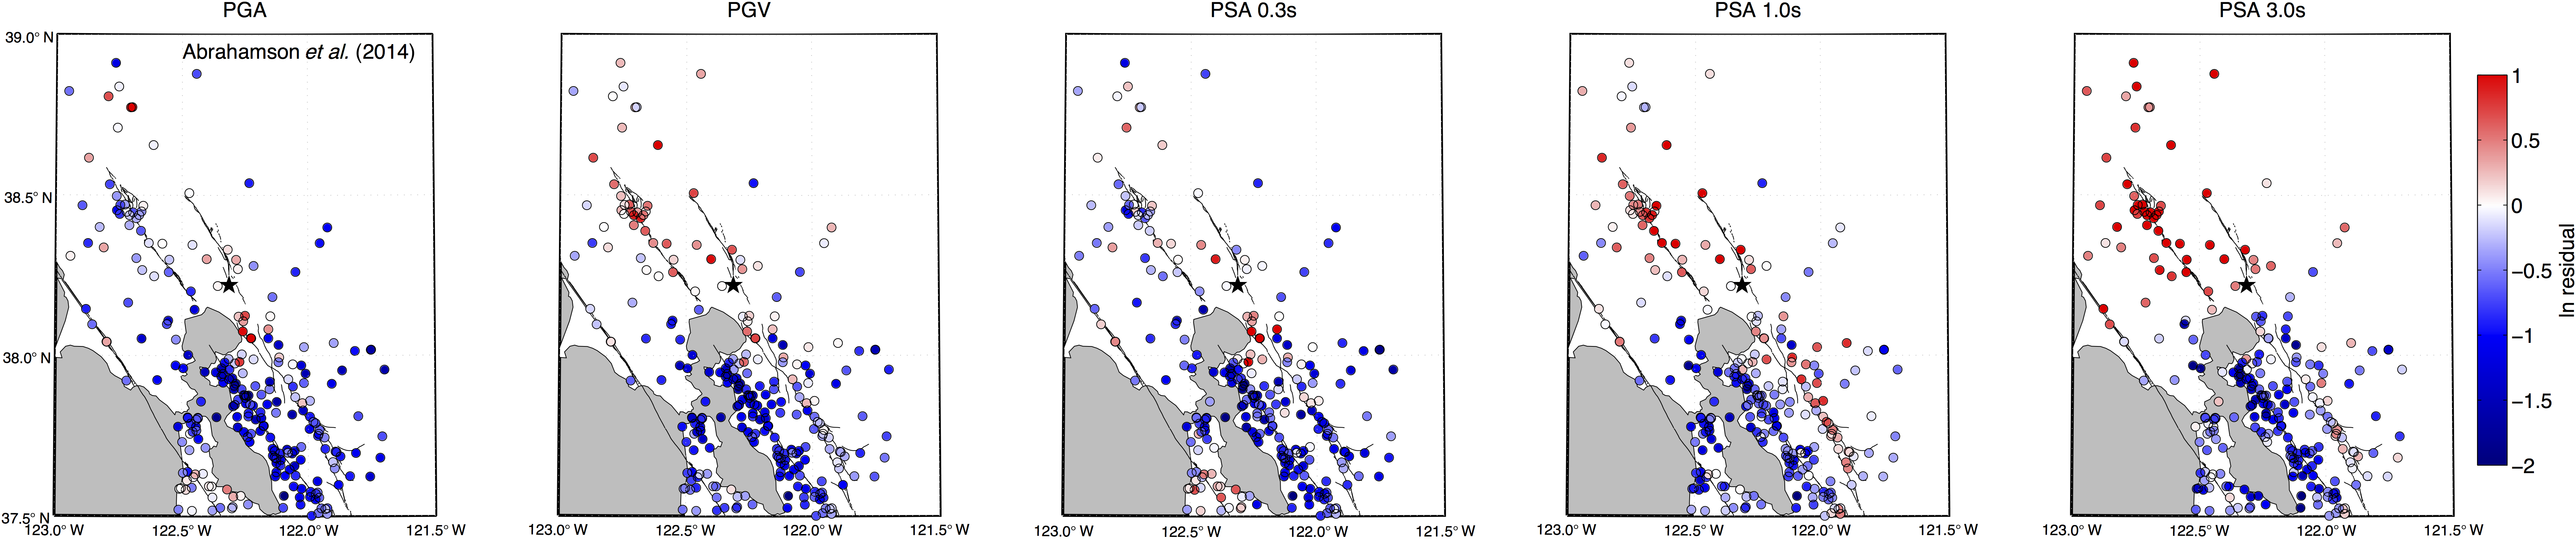
Figure S1. Map of residuals from the median ground motion at each station (from left to right) for the Abrahamson et al. (2014) GMPE for PGA, PGV, PSA 0.3 s, PSA 1.0 s, and PSA 3.0 s. The location of the epicenter is marked by a star. Each circle marks the station location, color-coded by the residual.
Figure S2. Map of residuals from the median ground motion at each station (from left to right) for the Boore et al. (2014) GMPE for PGA, PGV, PSA 0.3 s, PSA 1.0 s, and PSA 3.0 s. The location of the epicenter is marked by a star. Each circle marks the station location, color-coded by the residual.
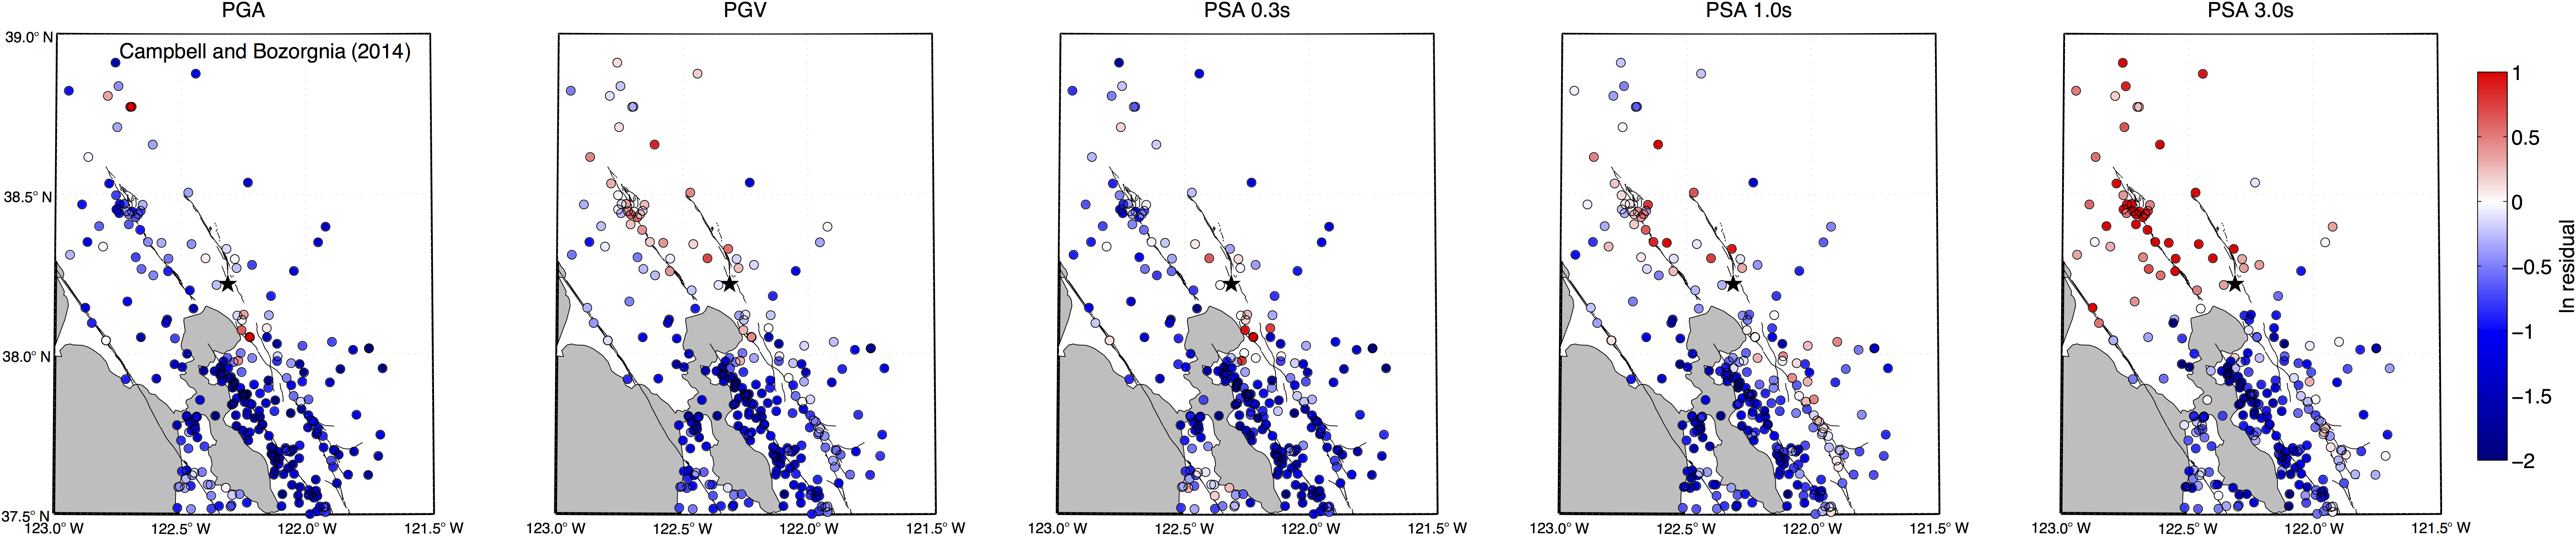
Figure S3. Map of residuals from the median ground motion at each station (from left to right) for the Campbell and Bozorgnia (2014) GMPE for PGA, PGV, PSA 0.3 s, PSA 1.0 s, and PSA 3.0 s. The location of the epicenter is marked by a star. Each circle marks the station location, color-coded by the residual.
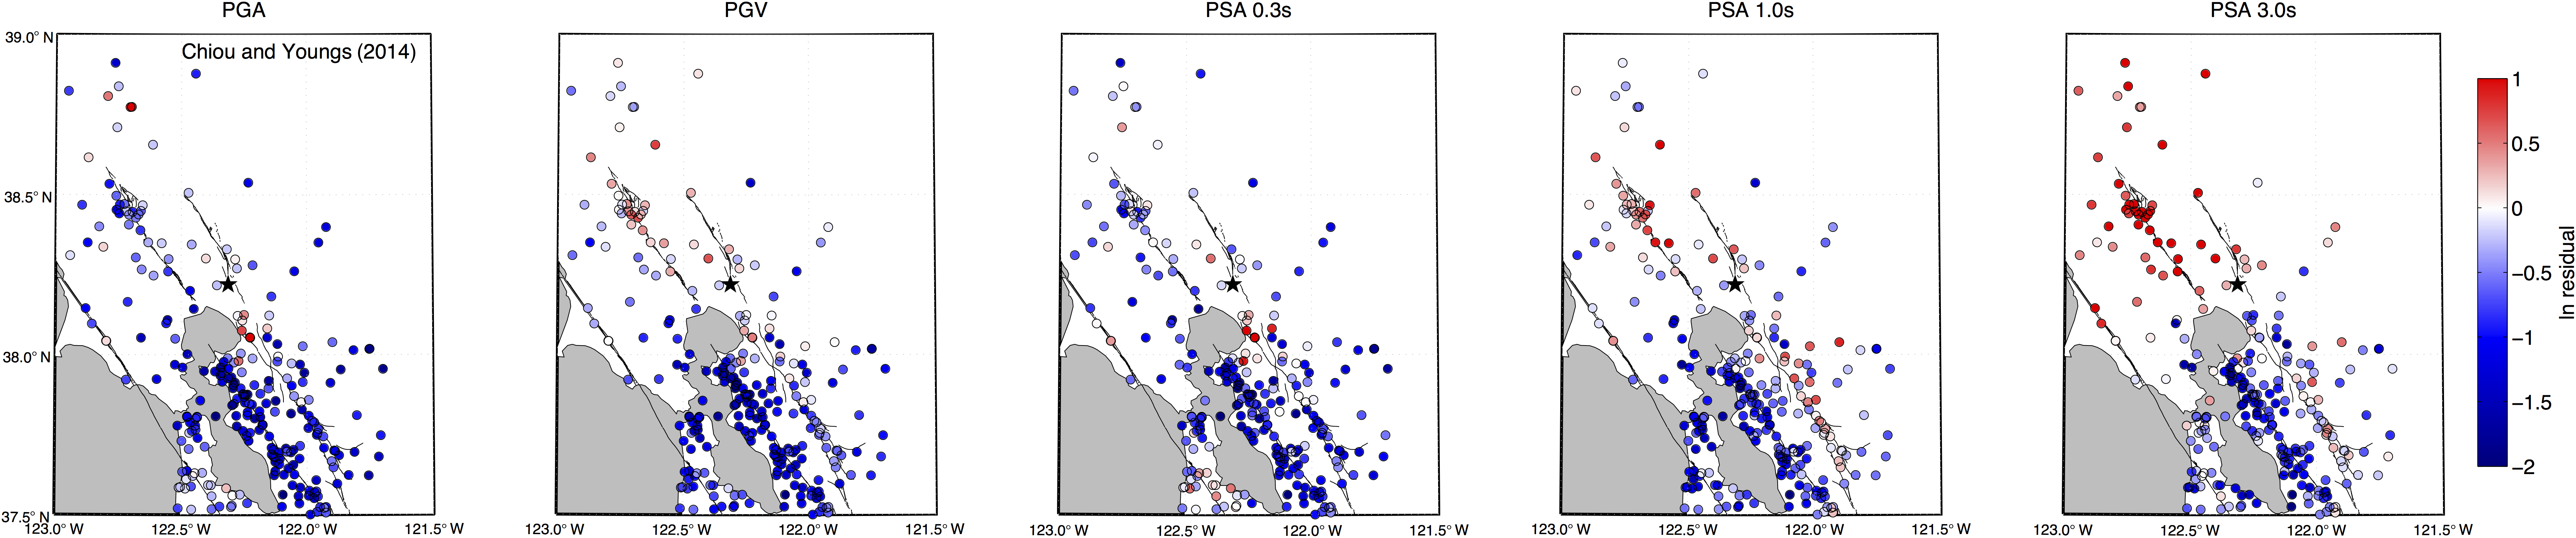
Figure S4. Map of residuals from the median ground motion at each station (from left to right) for the Chiou and Youngs (2014) GMPE for PGA, PGV, PSA 0.3 s, PSA 1.0 s, and PSA 3.0 s. The effect of directivity (the DPP) is included in this model. The location of the epicenter is marked by a star. Each circle marks the station location, color-coded by the residual.
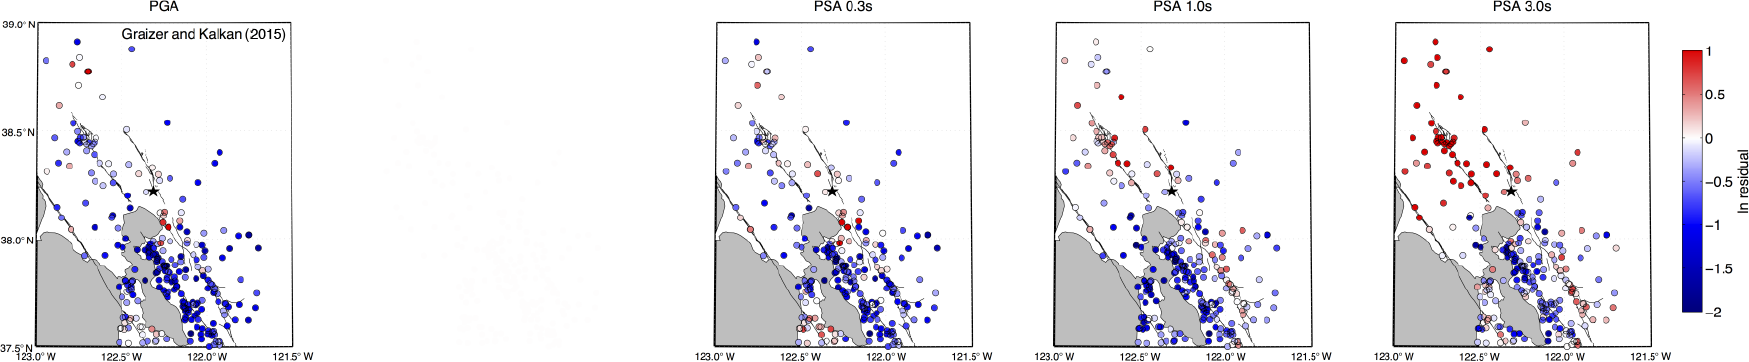
Figure S5. Map of residuals from the median ground motion at each station (from left to right) for the Graizer and Kalkan (2015) GMPE for PGA, PSA 0.3 s, PSA 1.0 s, and PSA 3.0 s. The location of the epicenter is marked by a star. Each circle marks the station location, color-coded by the residual.
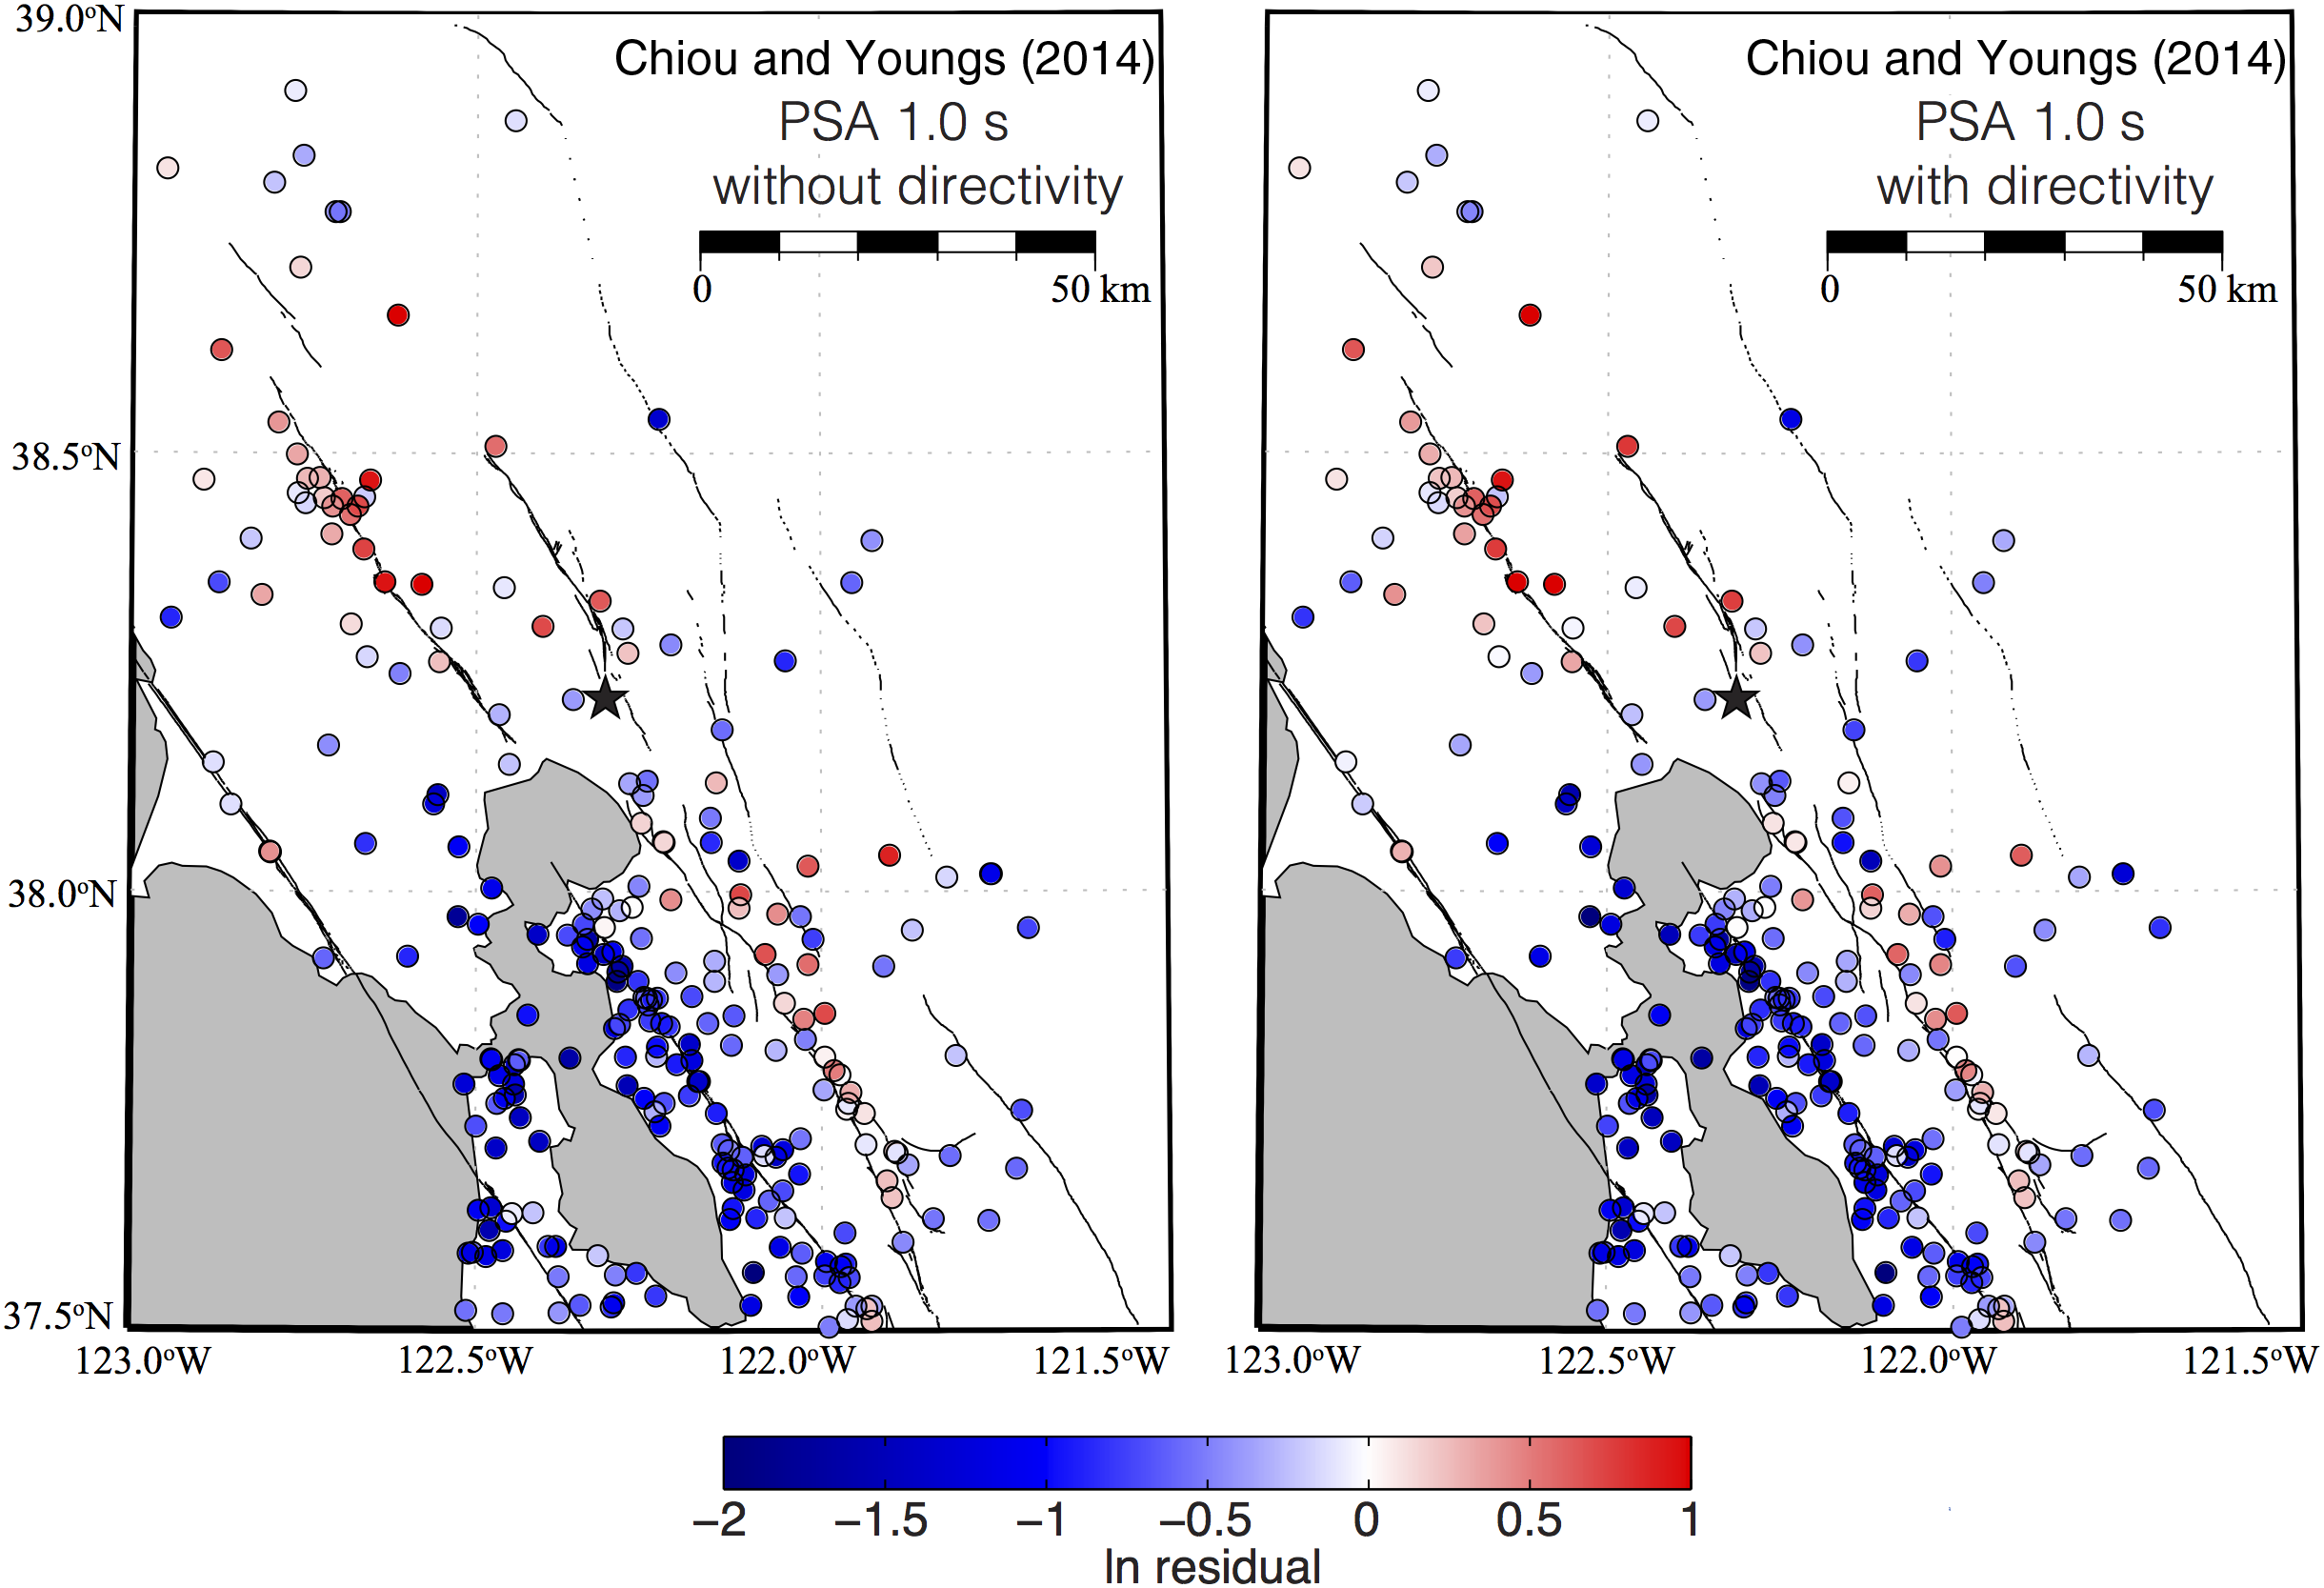
Figure S6. Comparison of spatial residuals for the Chiou and Youngs (2014) GMPE (left) without implementing directivity and (right) with the DPP directivity implemented for each station location. The difference between the two maps is minimal, implying that the DPP directivity does not account for the spatial pattern in the residuals, particularly the strongly positive residuals in the north.
Abrahamson, N. A., W. J. Silva, and R. Kamai (2014), Summary of the ASK14 ground-motion relation for active crustal regions, Earthq. Spectra 30, no. 3, 1025–1055, doi: 10.1193/070913EQS198M.
Boore, D. M., J. P. Stewart, E. Seyhan, and G. M. Atkinson (2014), NGA-West2 equations for predicting PGA, PGV, and 5%-damped PSA for shallow crustal earthquakes, Earthq. Spectra 30, no. 3, 1057–1085, doi: 10.1193/070113EQS184M.
Campbell, K. W., and Y. Bozorgnia, (2014), NGA-West2 ground motion model for the average horizontal components of PGA, PGV, and 5%-damped linear acceleration response spectra, Earthq. Spectra 30, no. 3, 1087–1115, doi: 10.1193/062913EQS175M.
Chiou, B. S. J., and R. R. Youngs (2014), Update of the Chiou and Youngs NGA model for the average horizontal component of peak ground motion and response spectra, Earthq. Spectra 30, no. 3, 1117–1153, doi: 10.1193/072813EQS219M.
Graizer, V. and E. Kalkan (2015). Update of the Graizer-Kalkan Ground-Motion Prediction Equations for Shallow Crustal Continental Earthquakes, U.S. Geol. Surv. Open-File Rept. OF-2015-1009, 98 pp.
[ Back ]