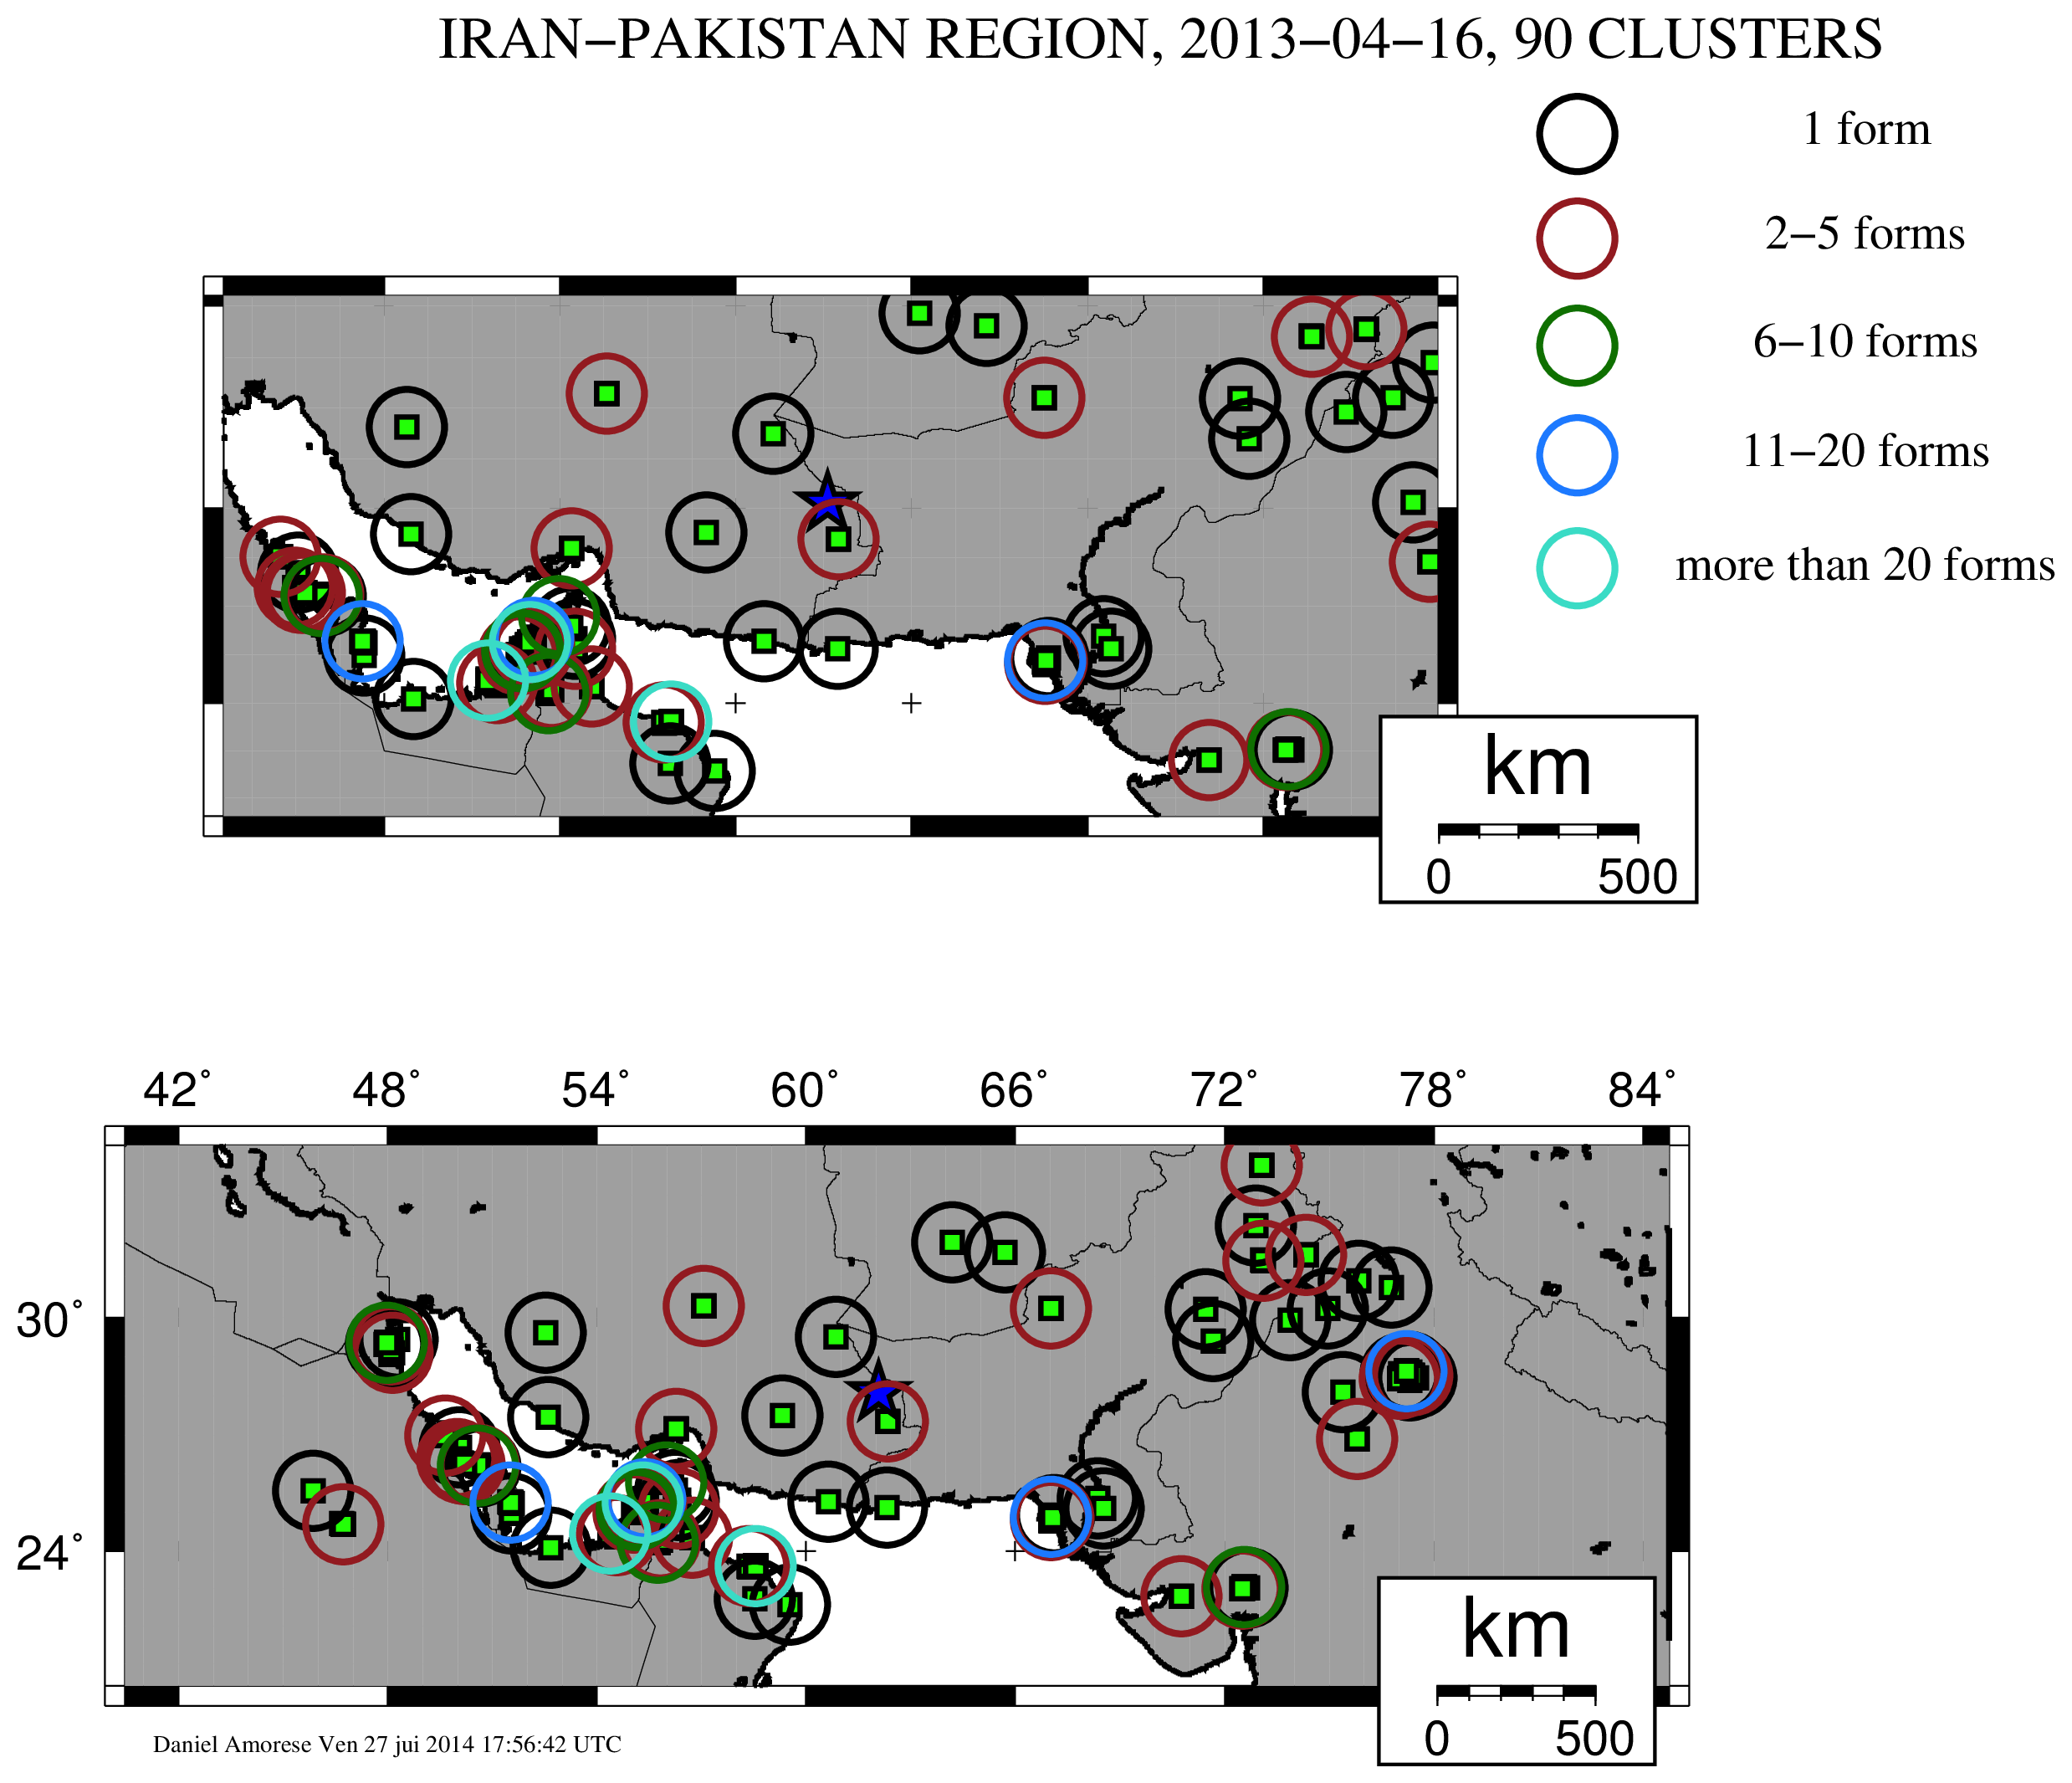
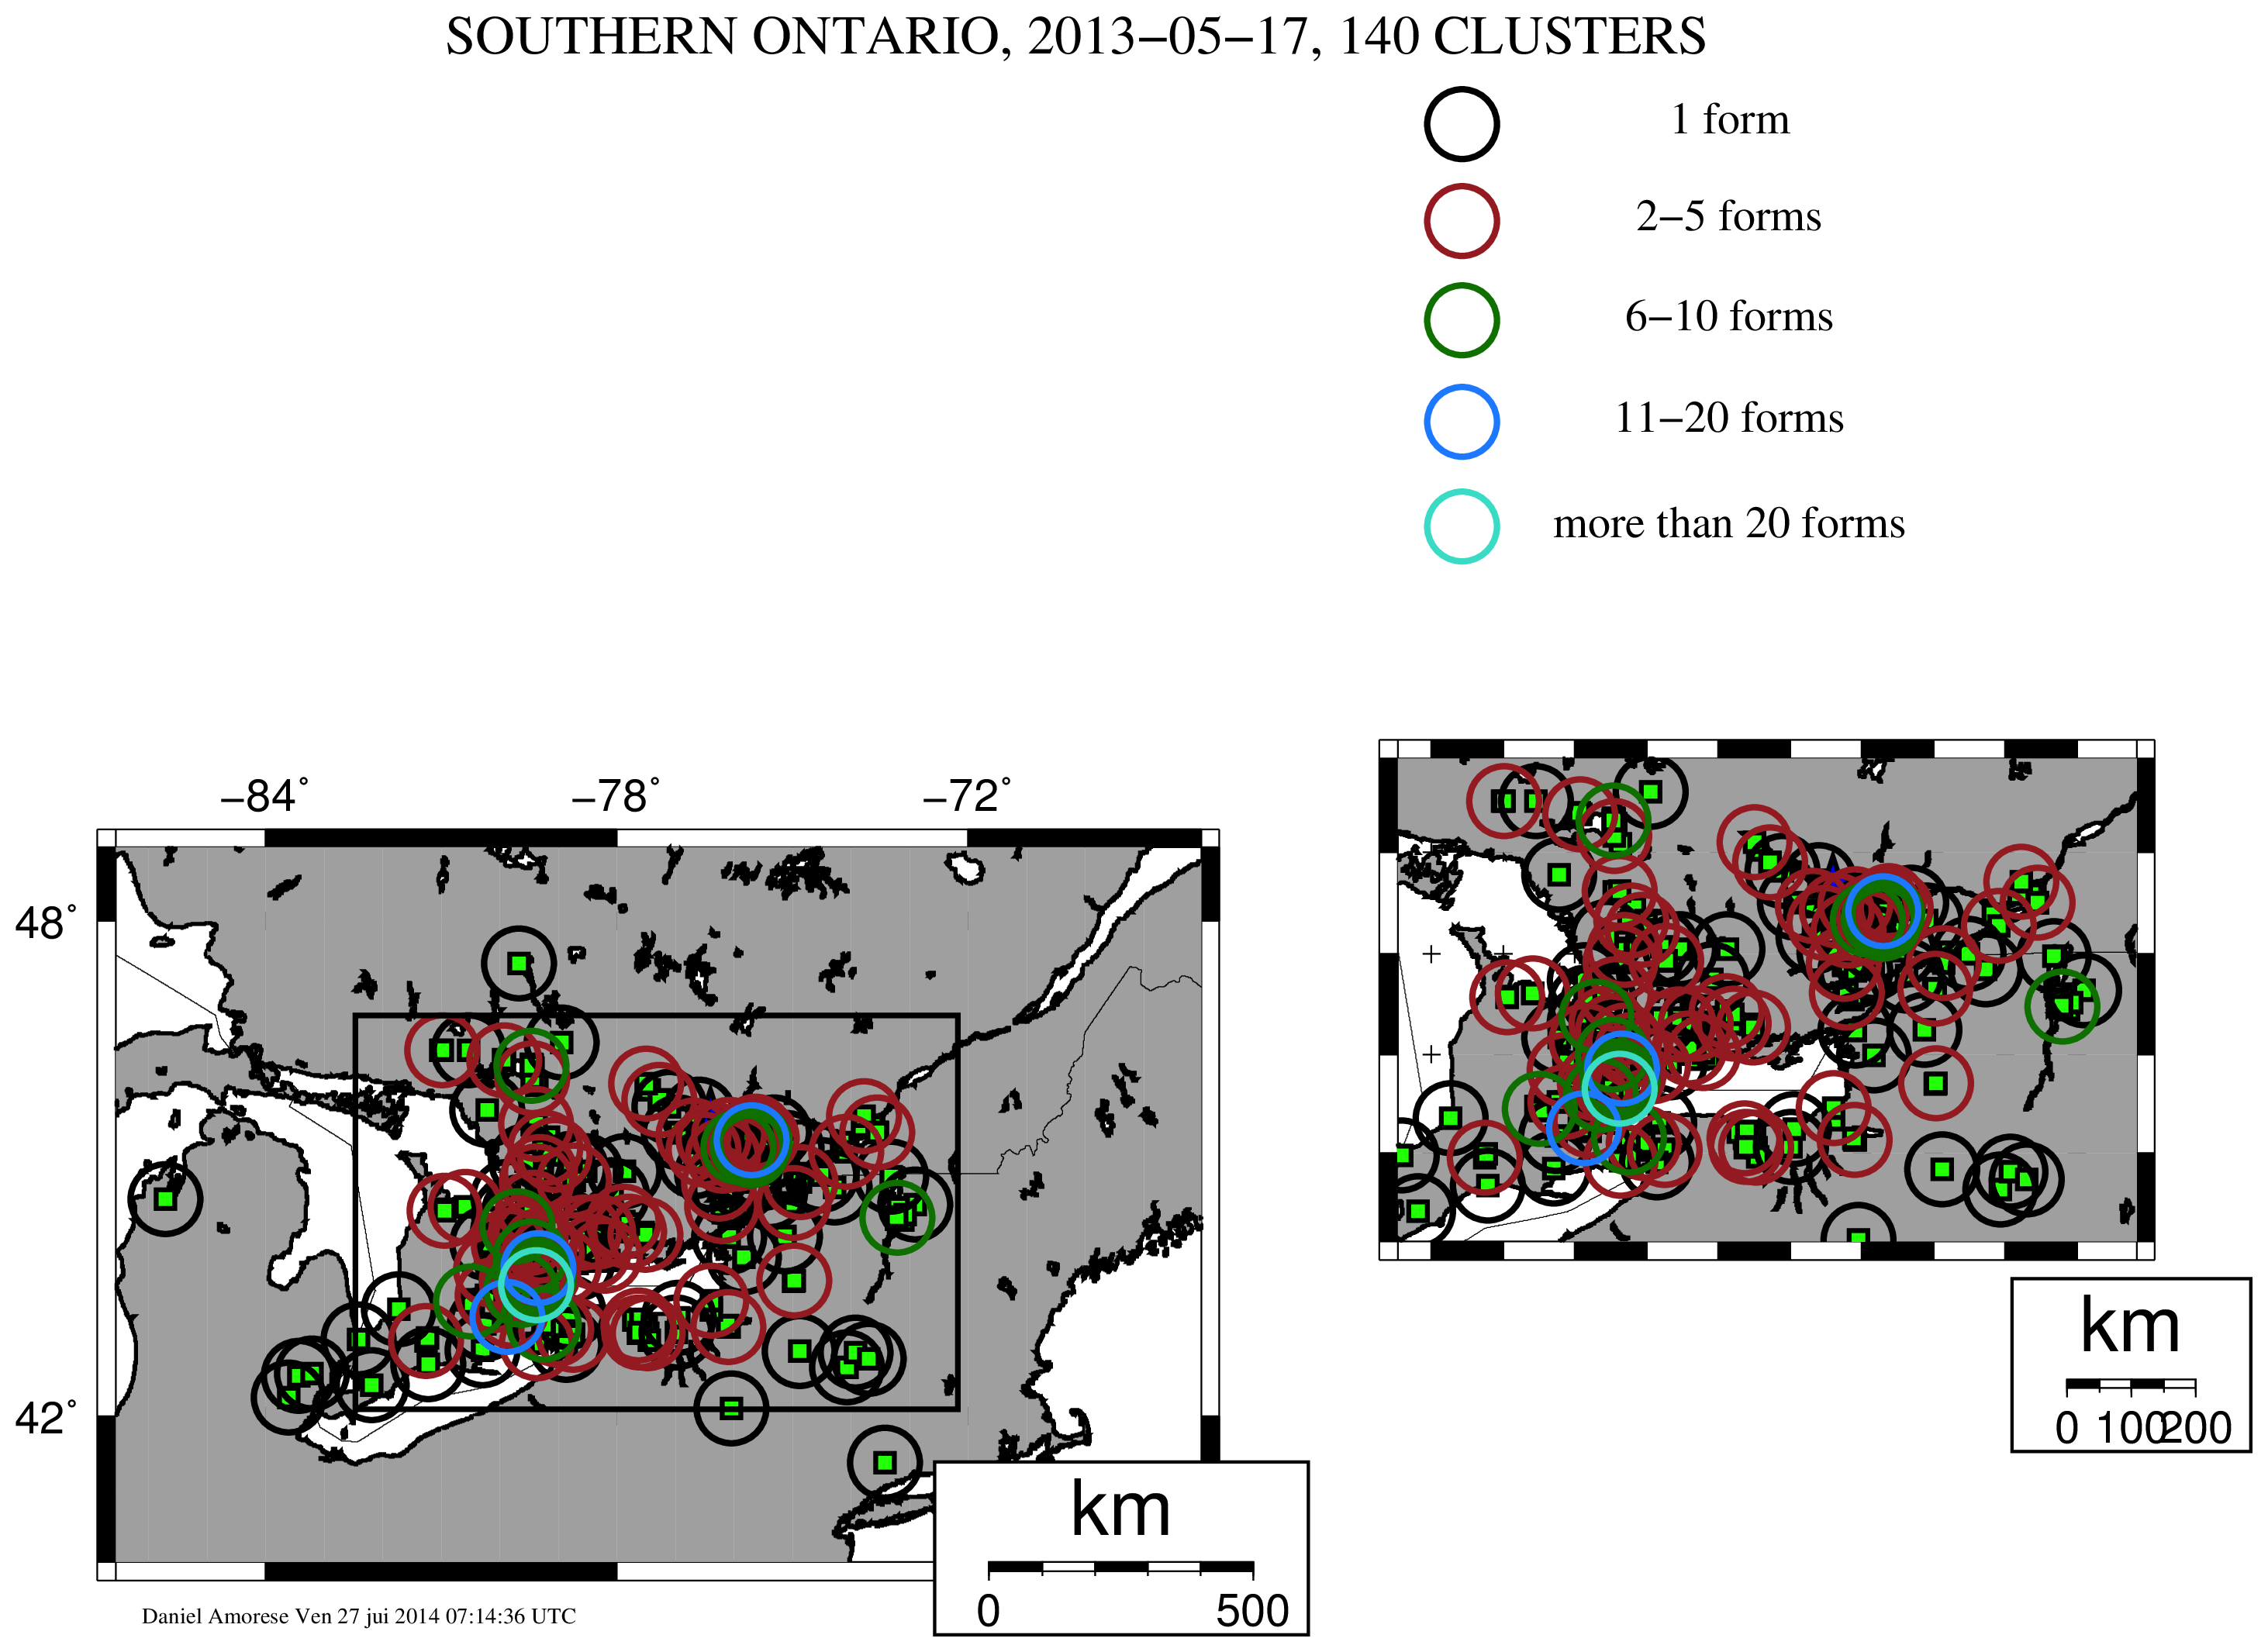
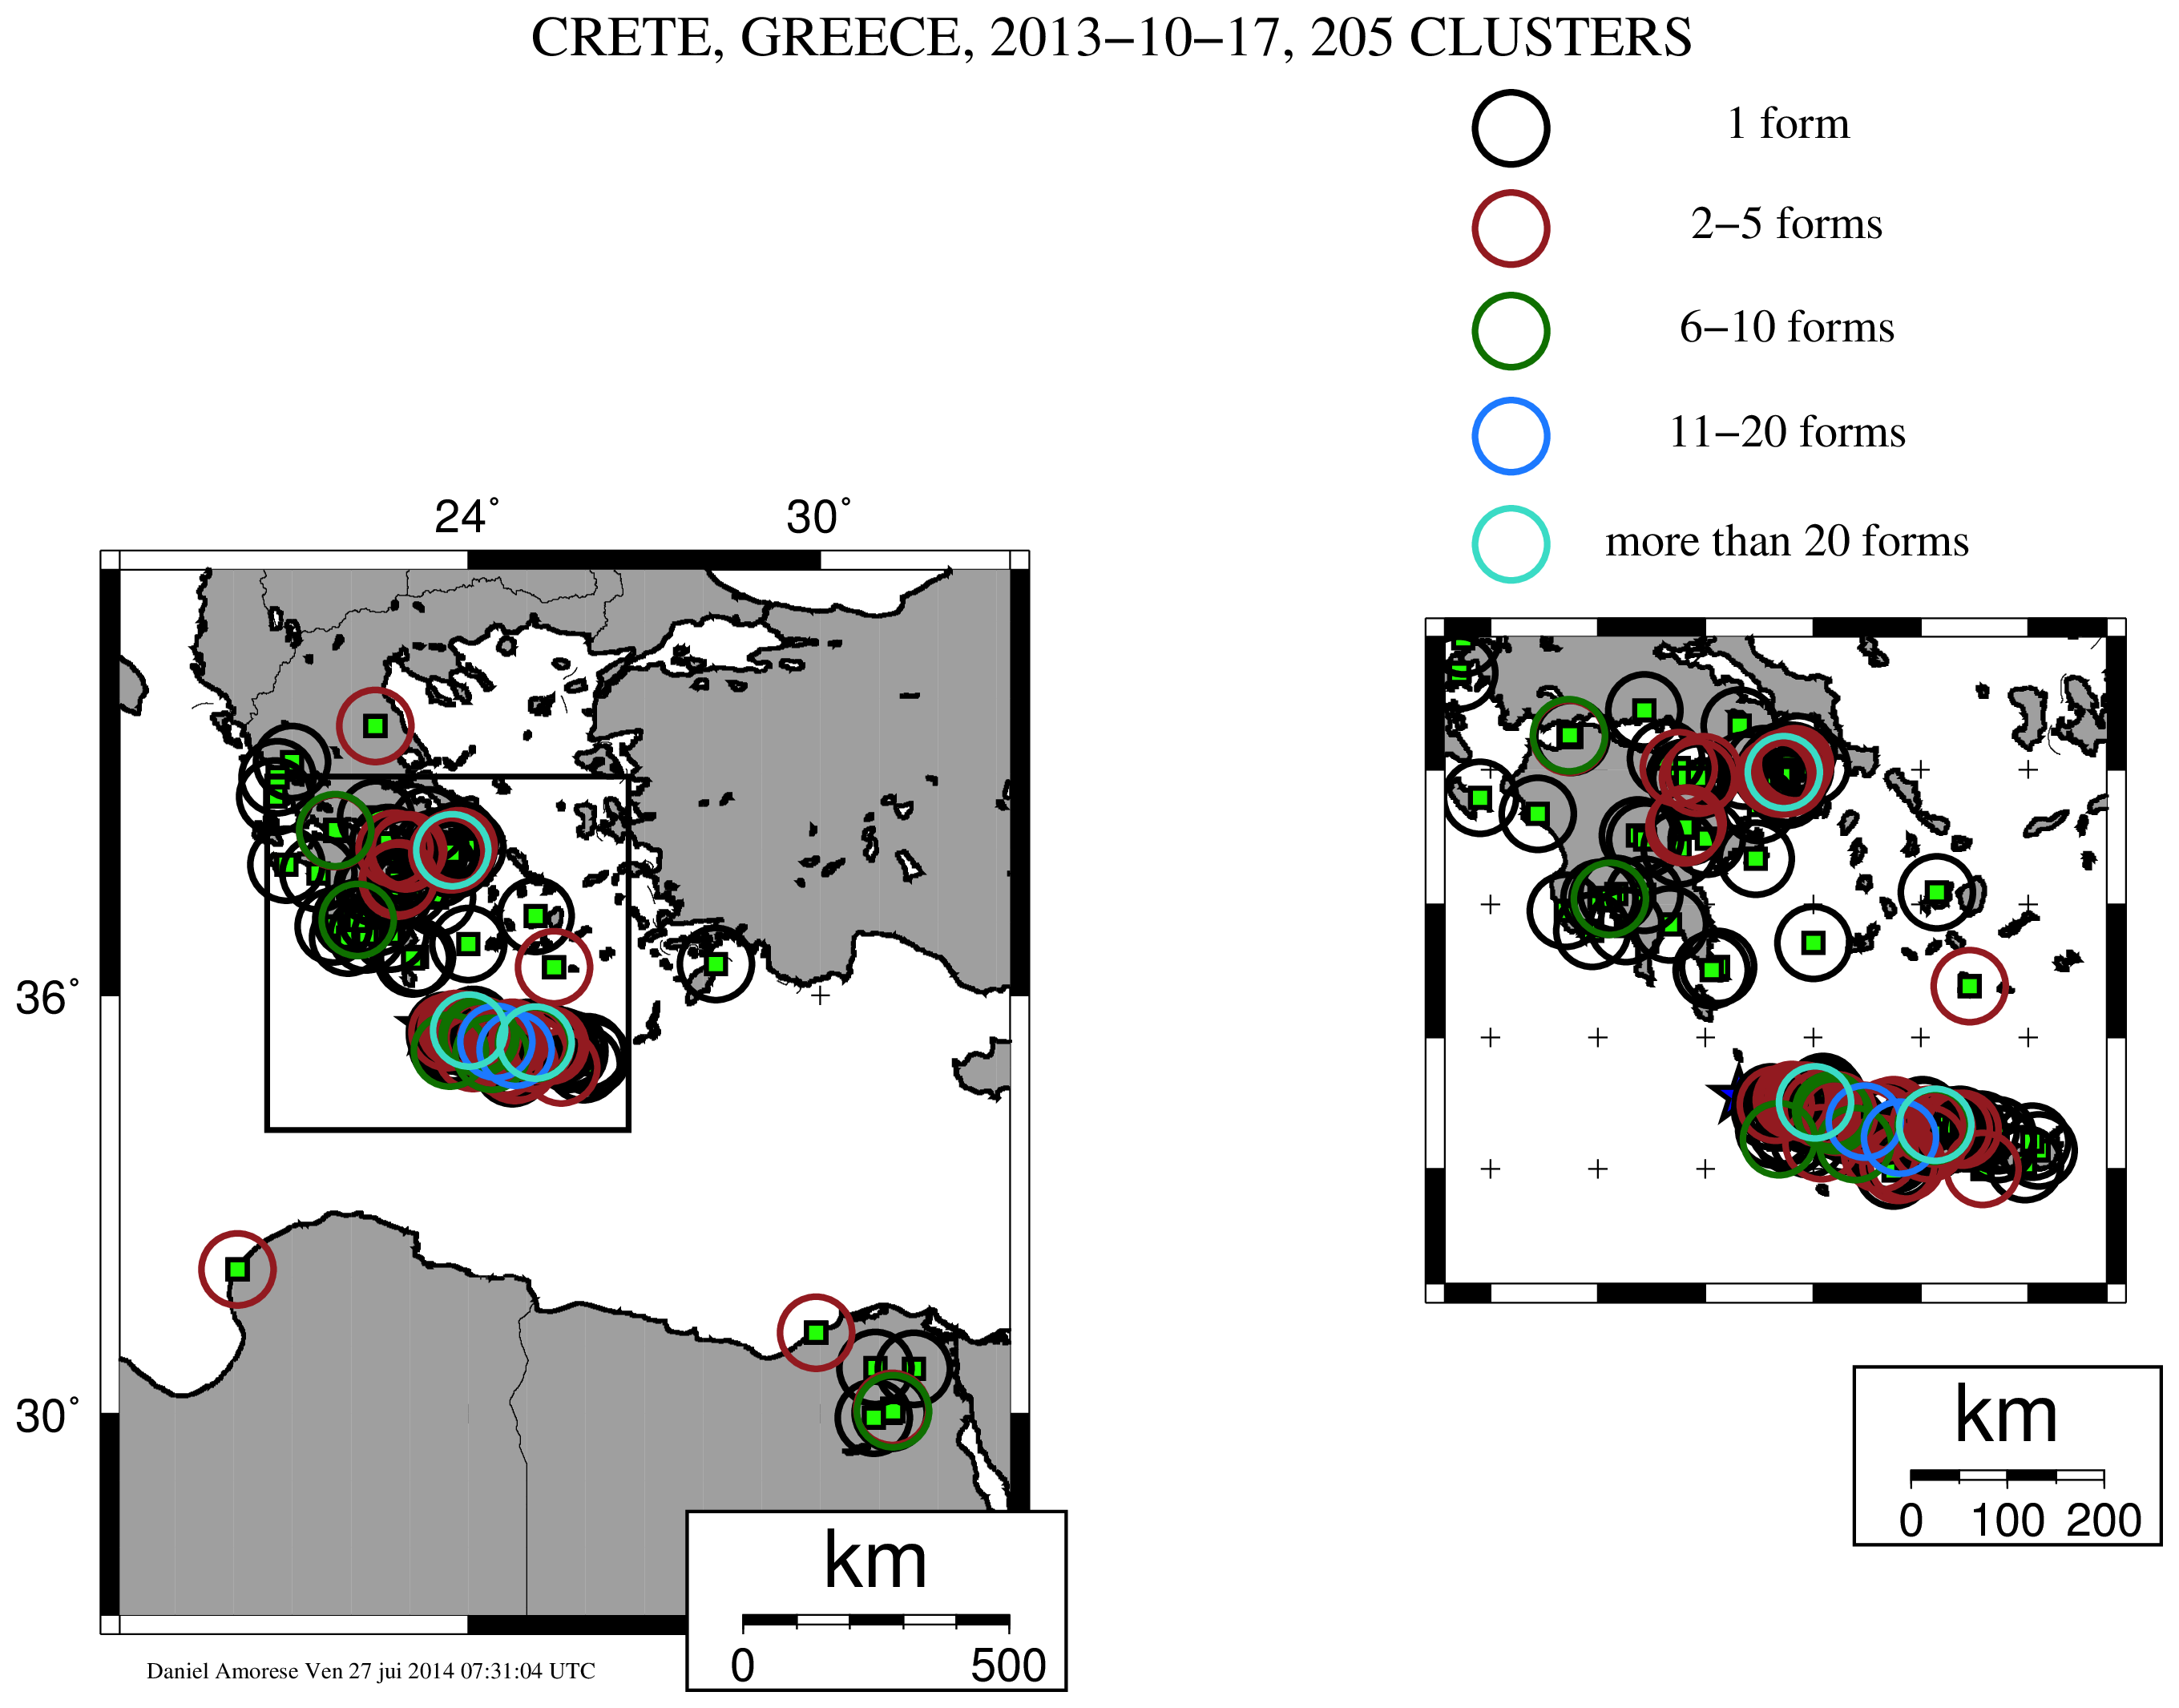
This electronic supplement contains tables of earthquakes and clustering results, maps of questionnaire clustering results, an animation showing the evolution of the Barcelonnette event questionnaire clustering with time, and a zipped archive of figures showing clustering comparisons.
Table S1. Parameters of the study events. Events are sorted by increasing number of questionnaires (Nquest) from the top to the bottom of the table.
Table S2. Clustering results and validation. The diameter of a cluster is the maximum distance between any two of its points. The zone size is the length of the diagonal of the rectangular zone encompassing the questionnaires. Sim is the clustering similarity with human-based clustering; this value is defined by equation 2.
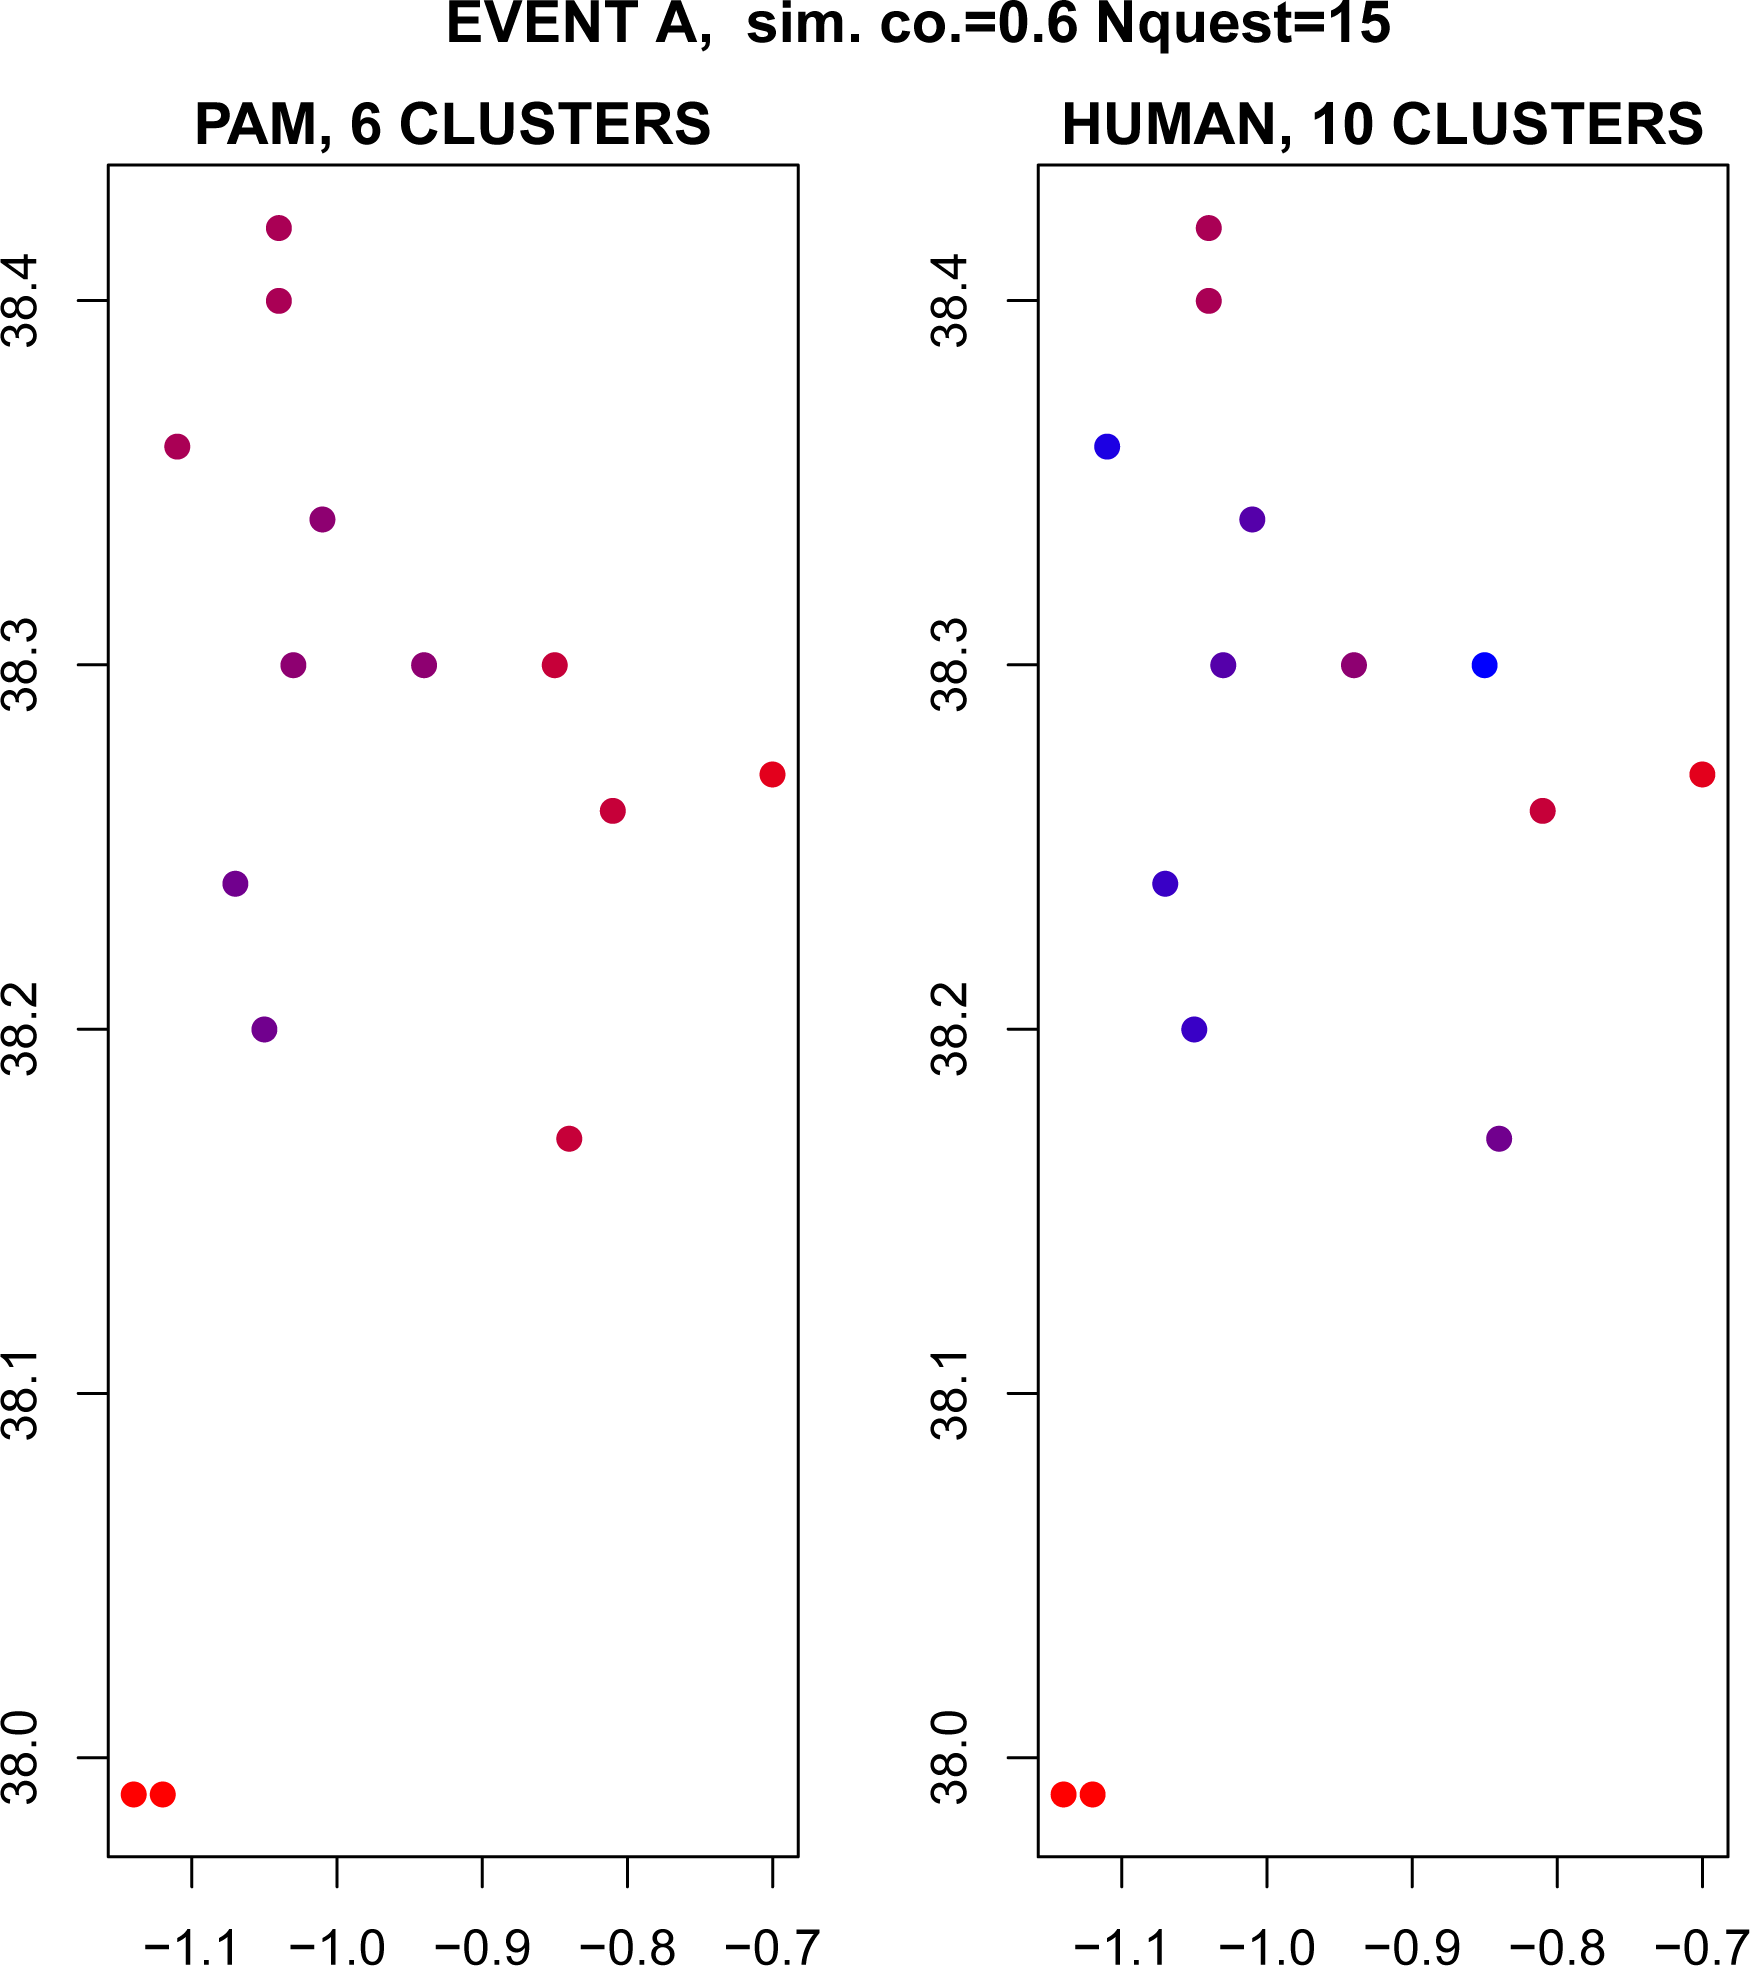
Figure S1. Clustering results for event A. Each green square locates an individual questionnaire (15 questionnaires are available for this event). The blue star is the instrumental epicenter.
Figure S2. Clustering results for event B. Each green square locates an individual questionnaire (19 questionnaires are available for this event). The blue star is the instrumental epicenter.
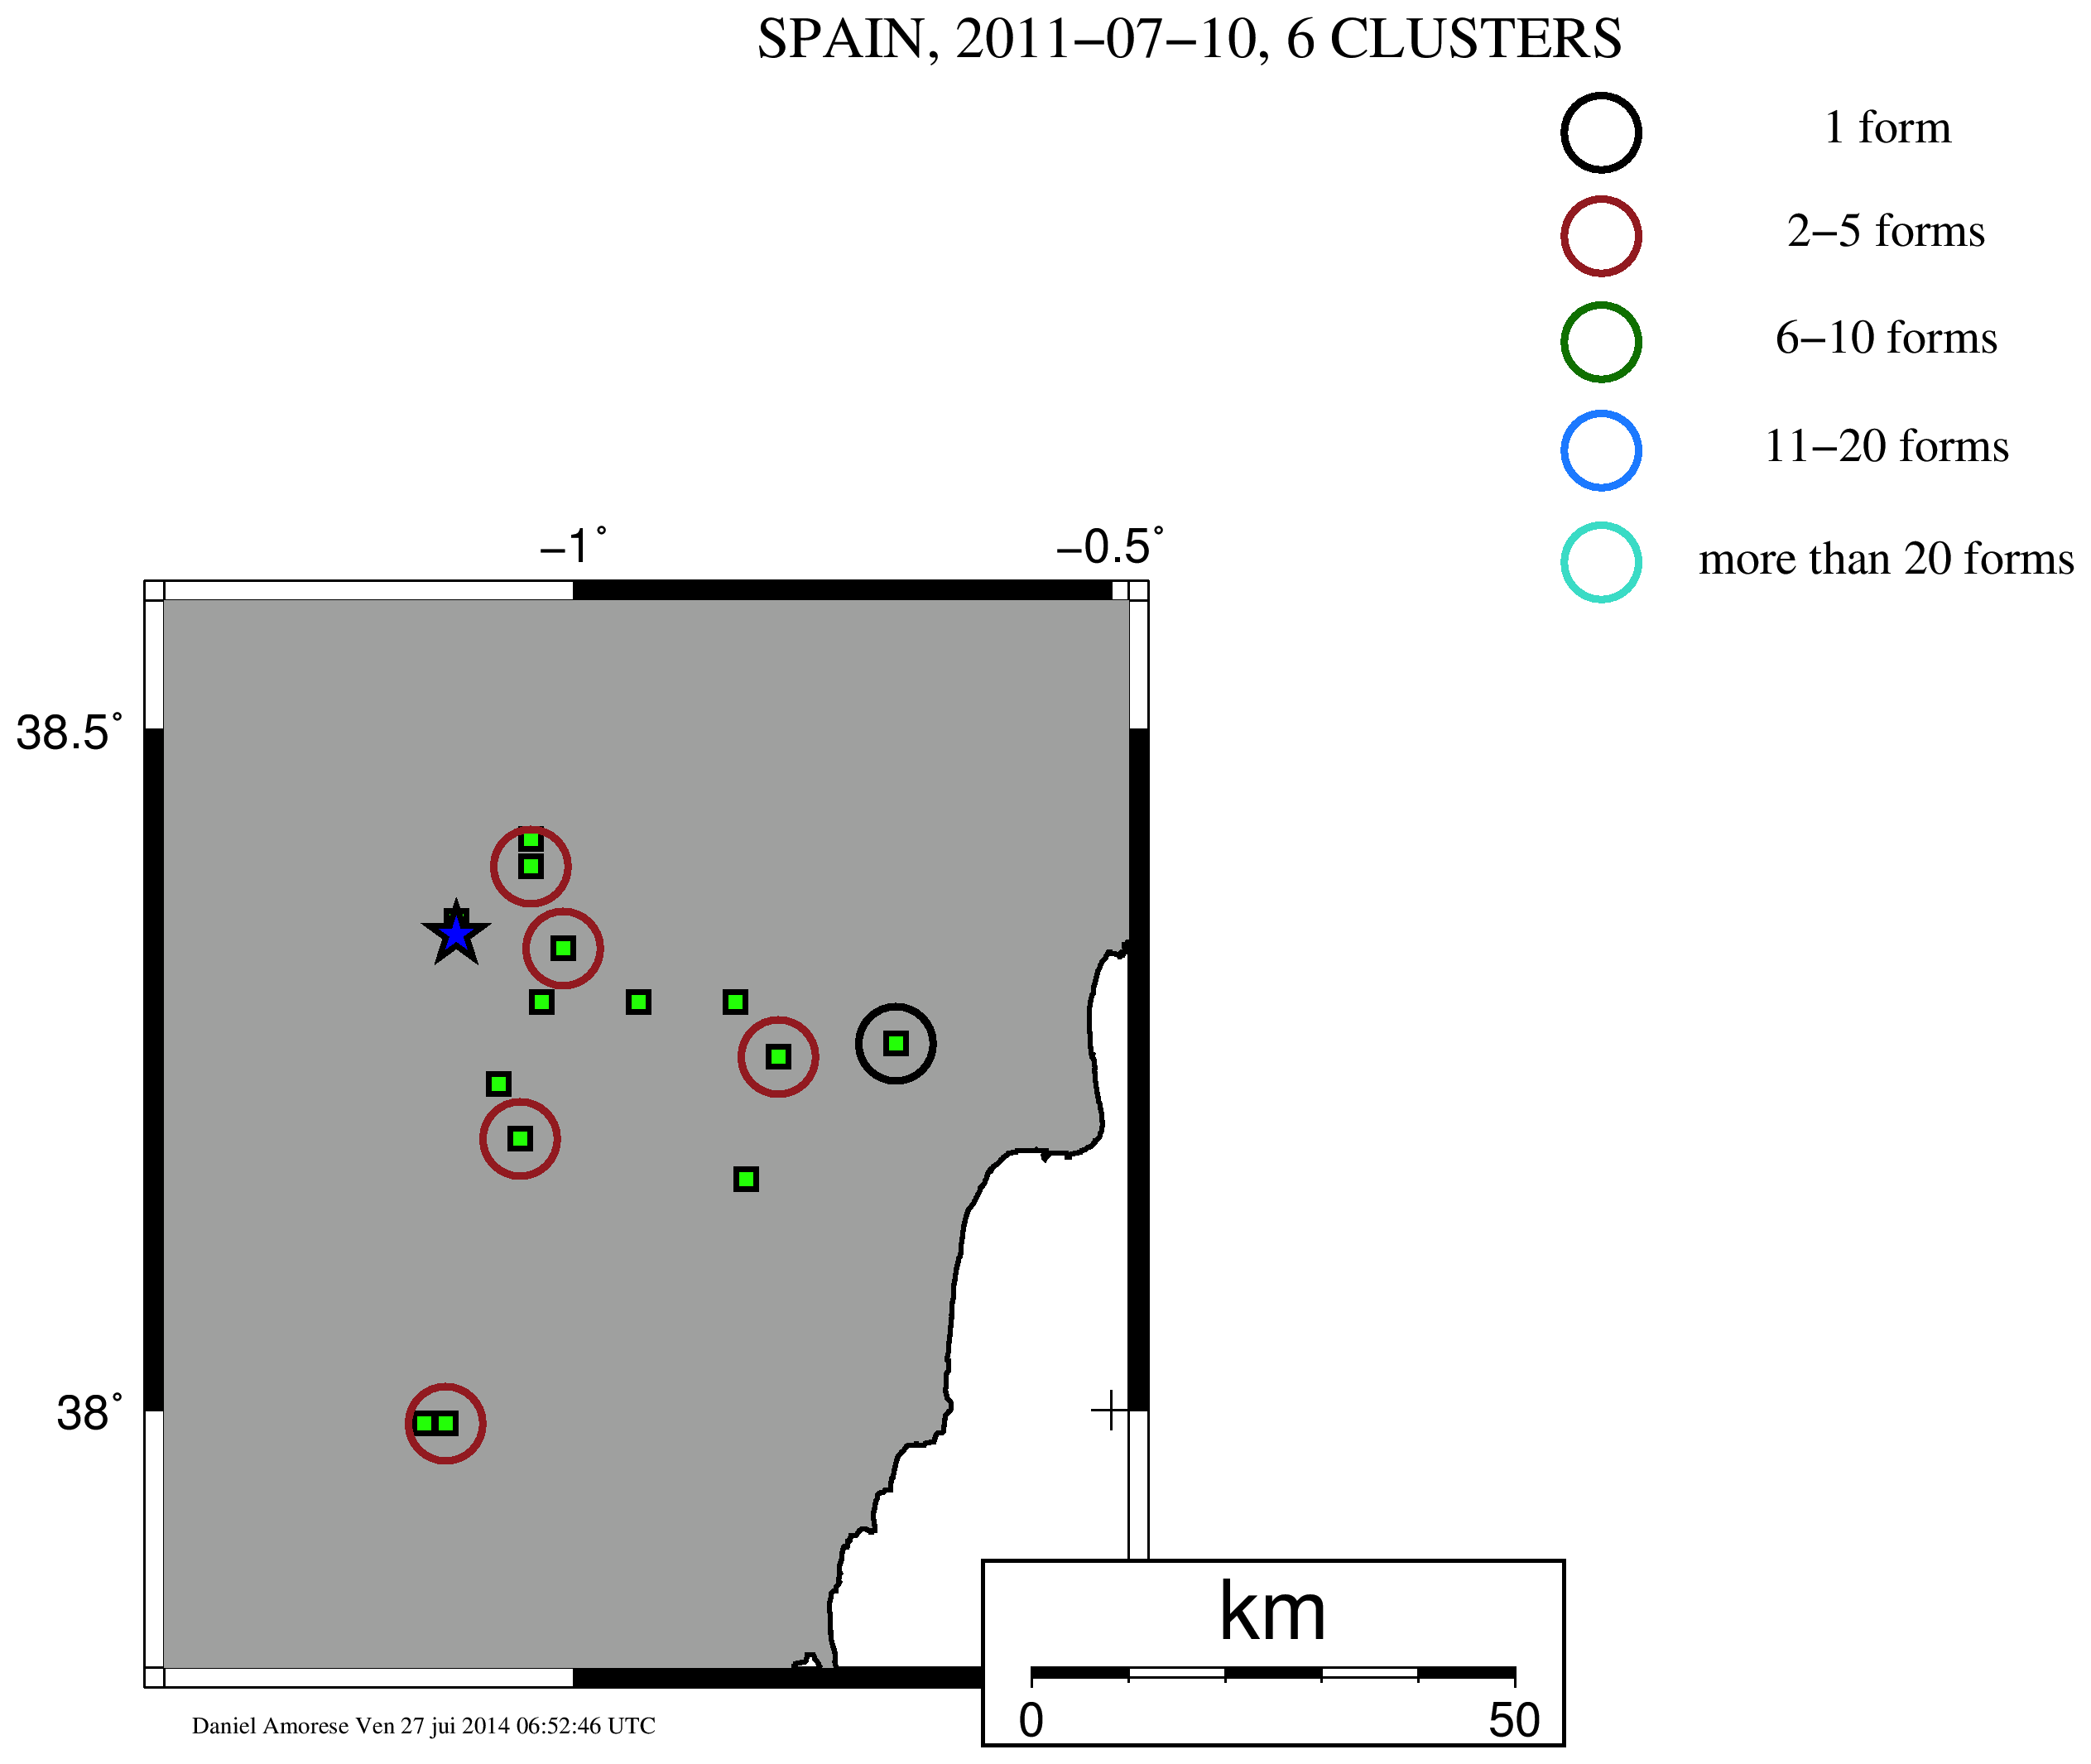
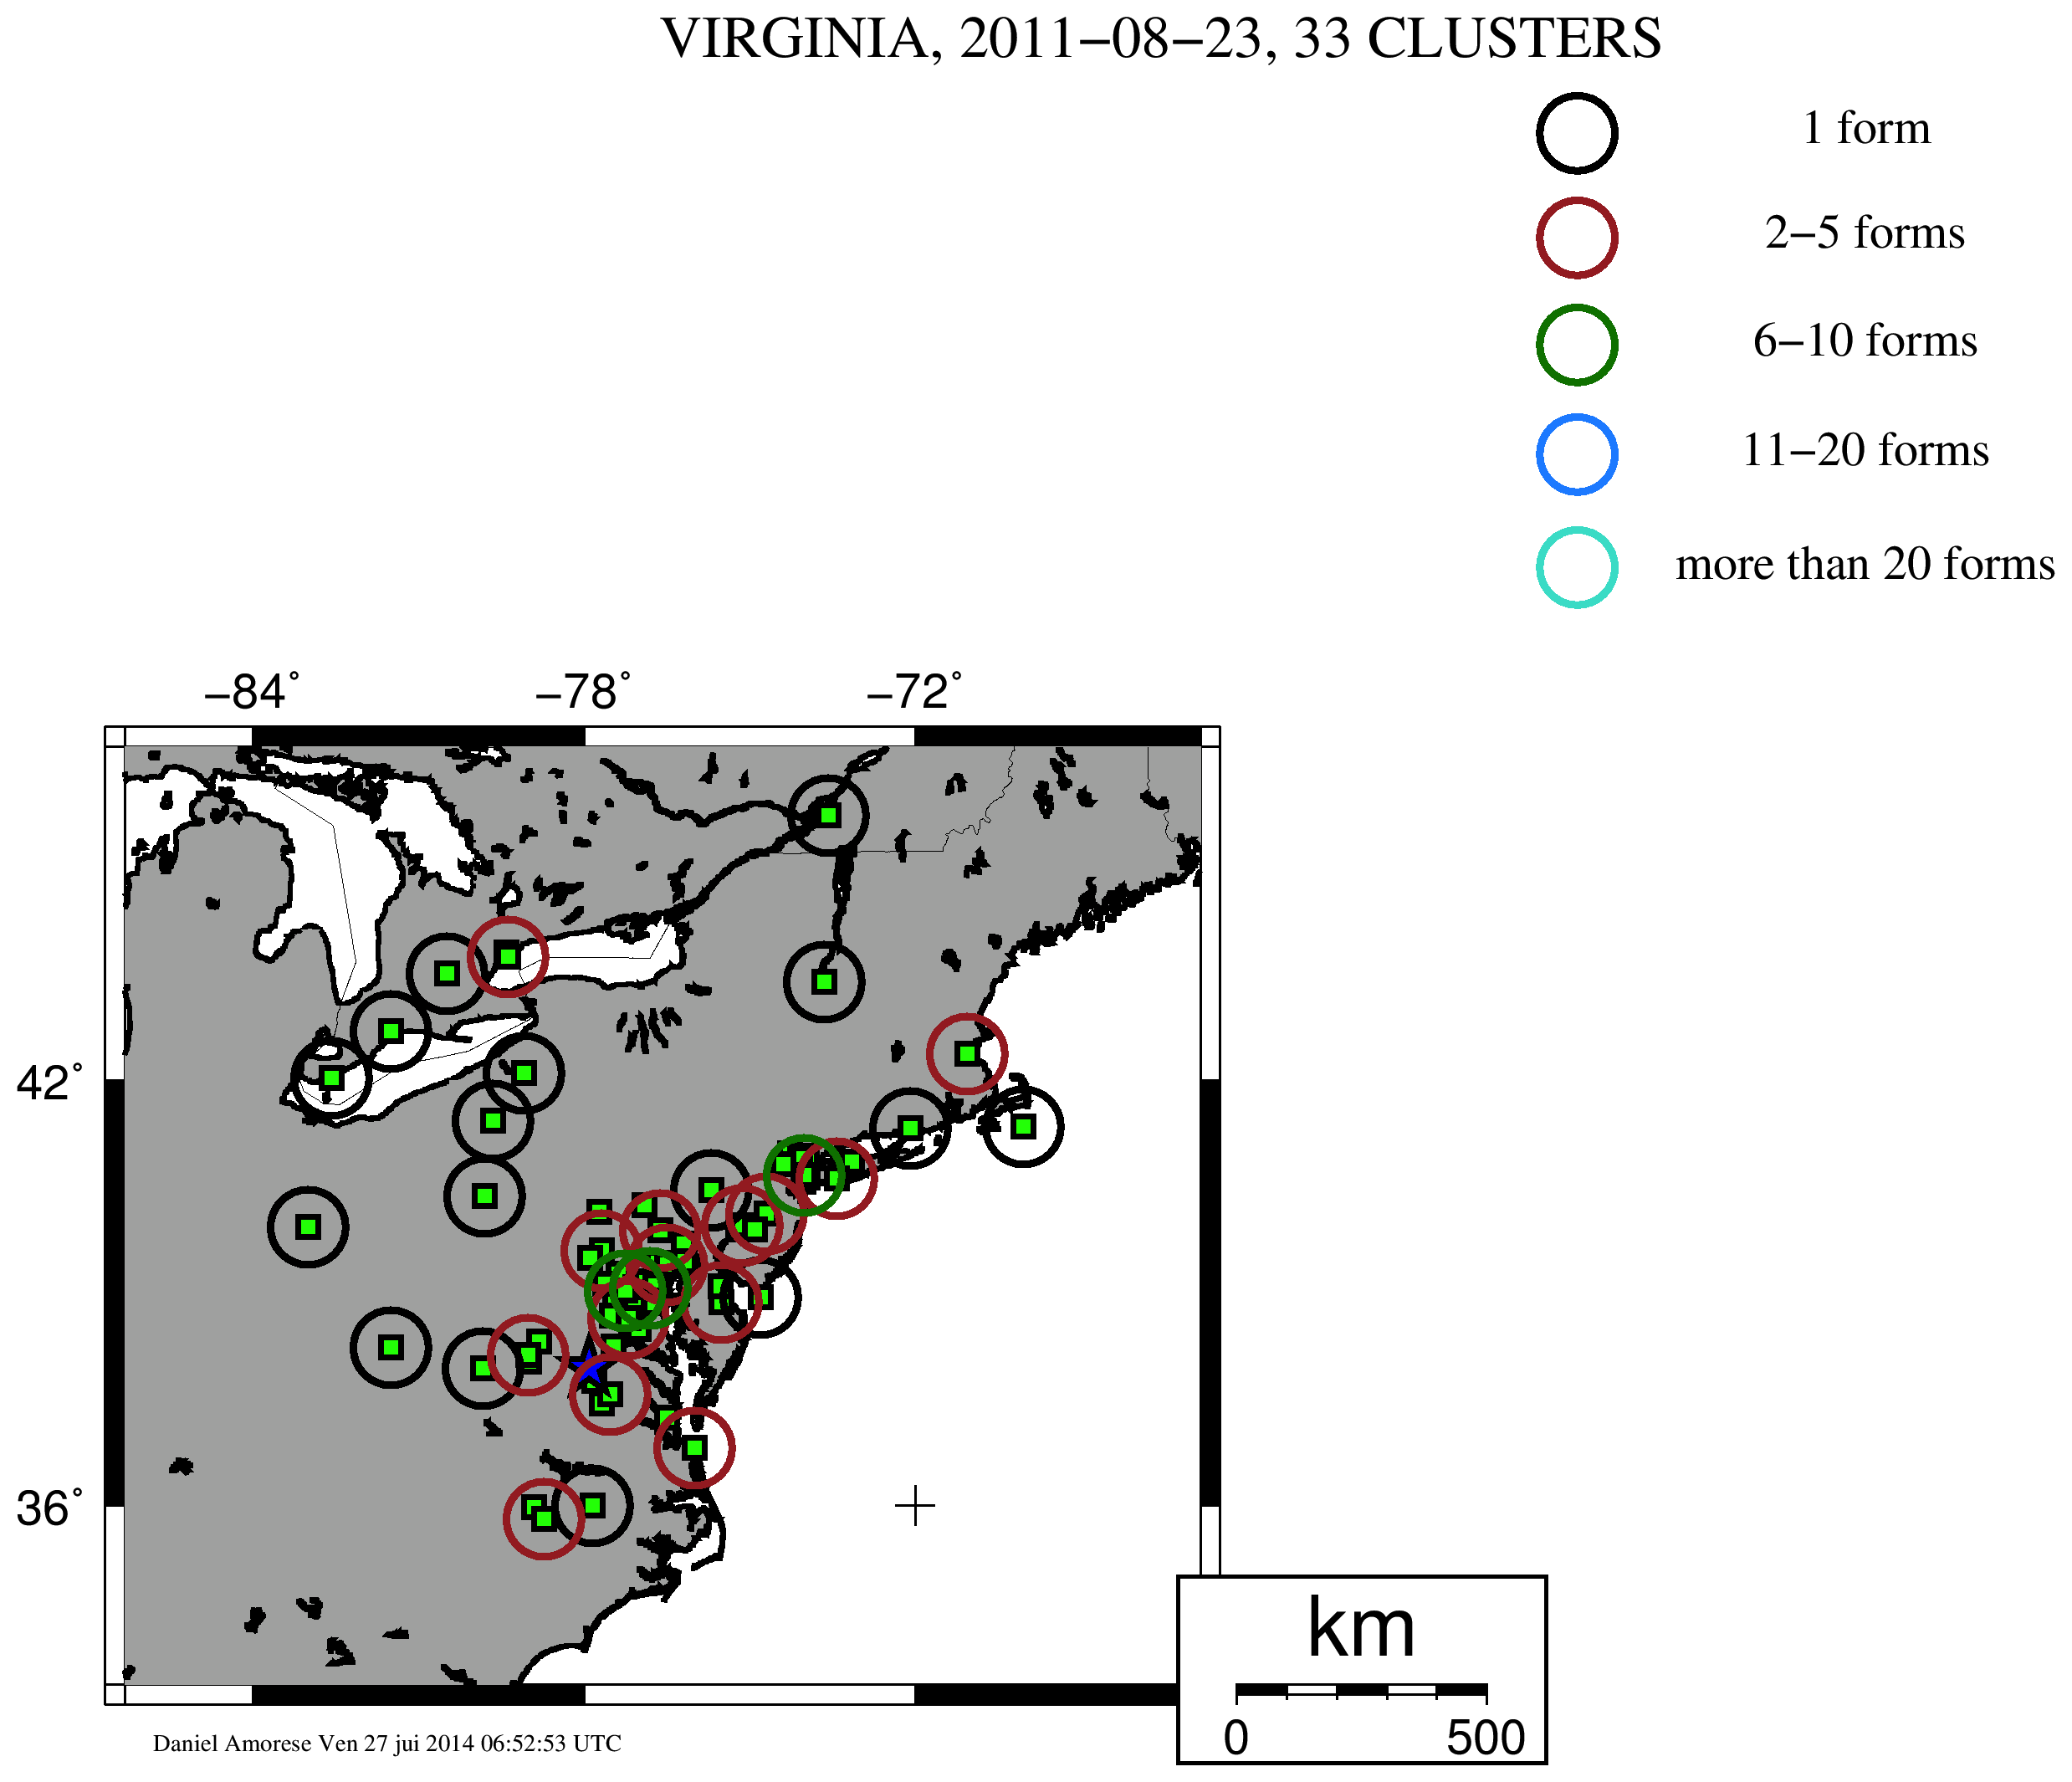
Figure S3. Clustering results for event C. Each green square locates an individual questionnaire (24 questionnaires are available for this event). The blue star is the instrumental epicenter.
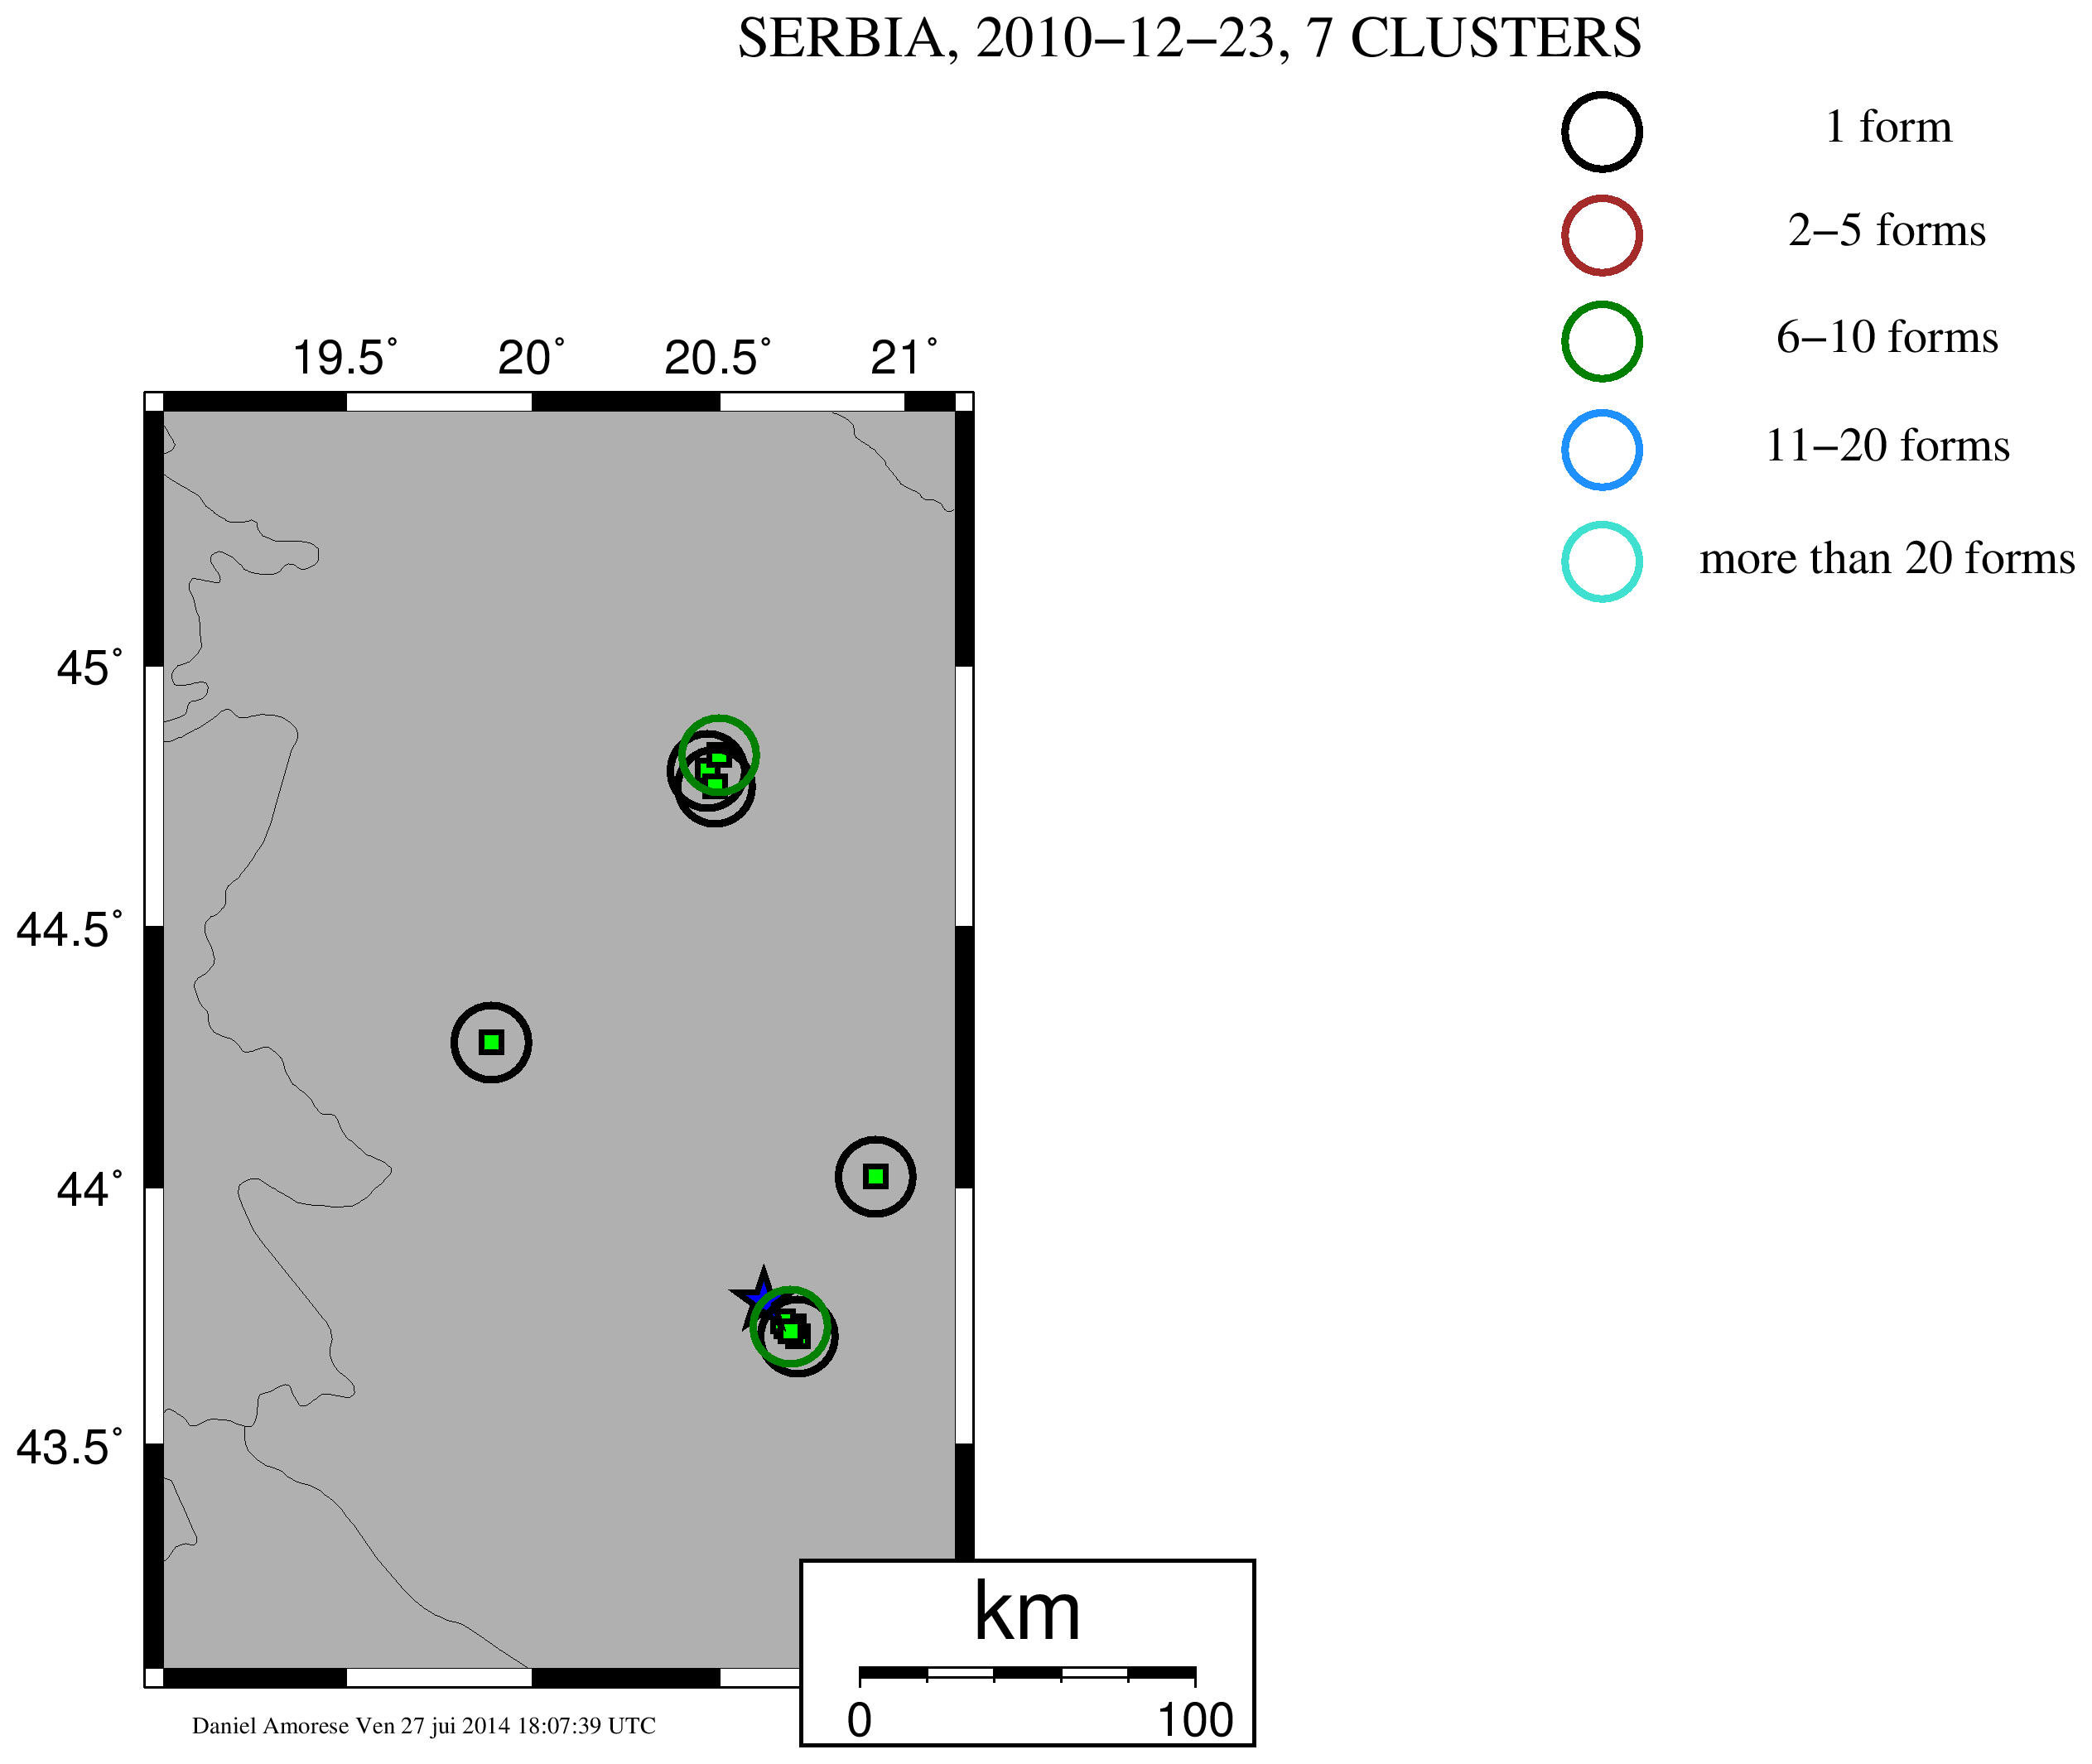
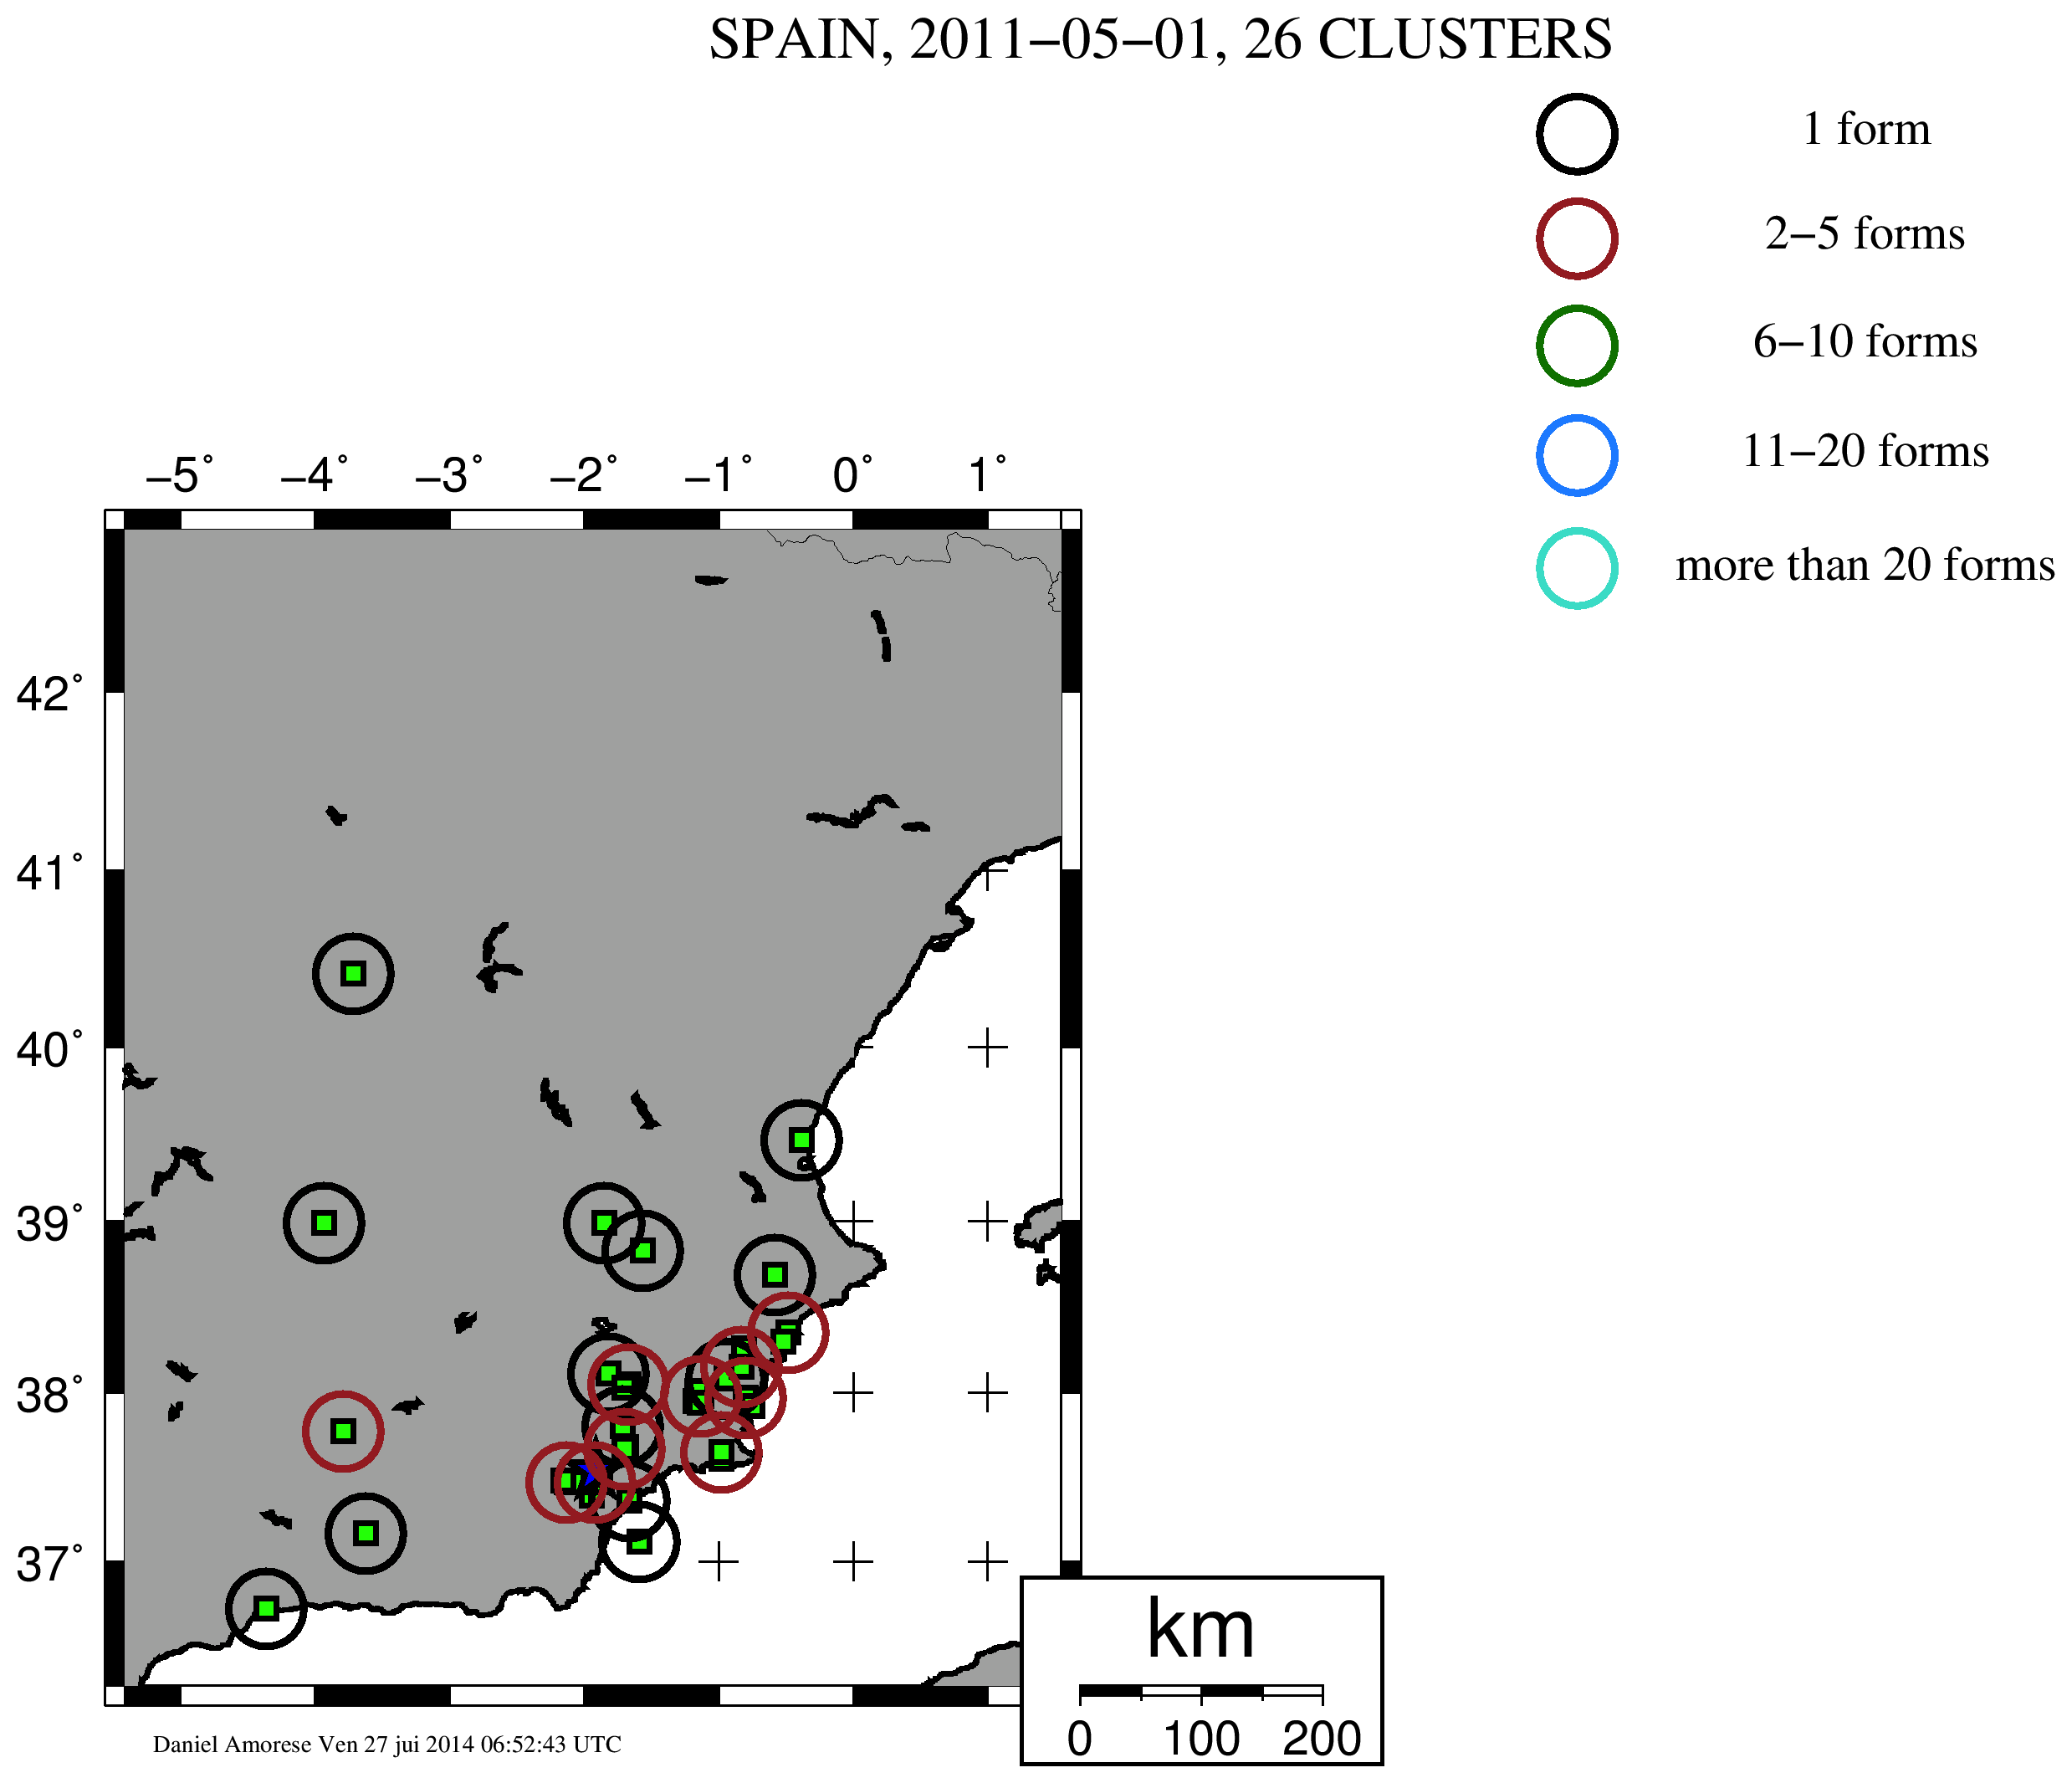
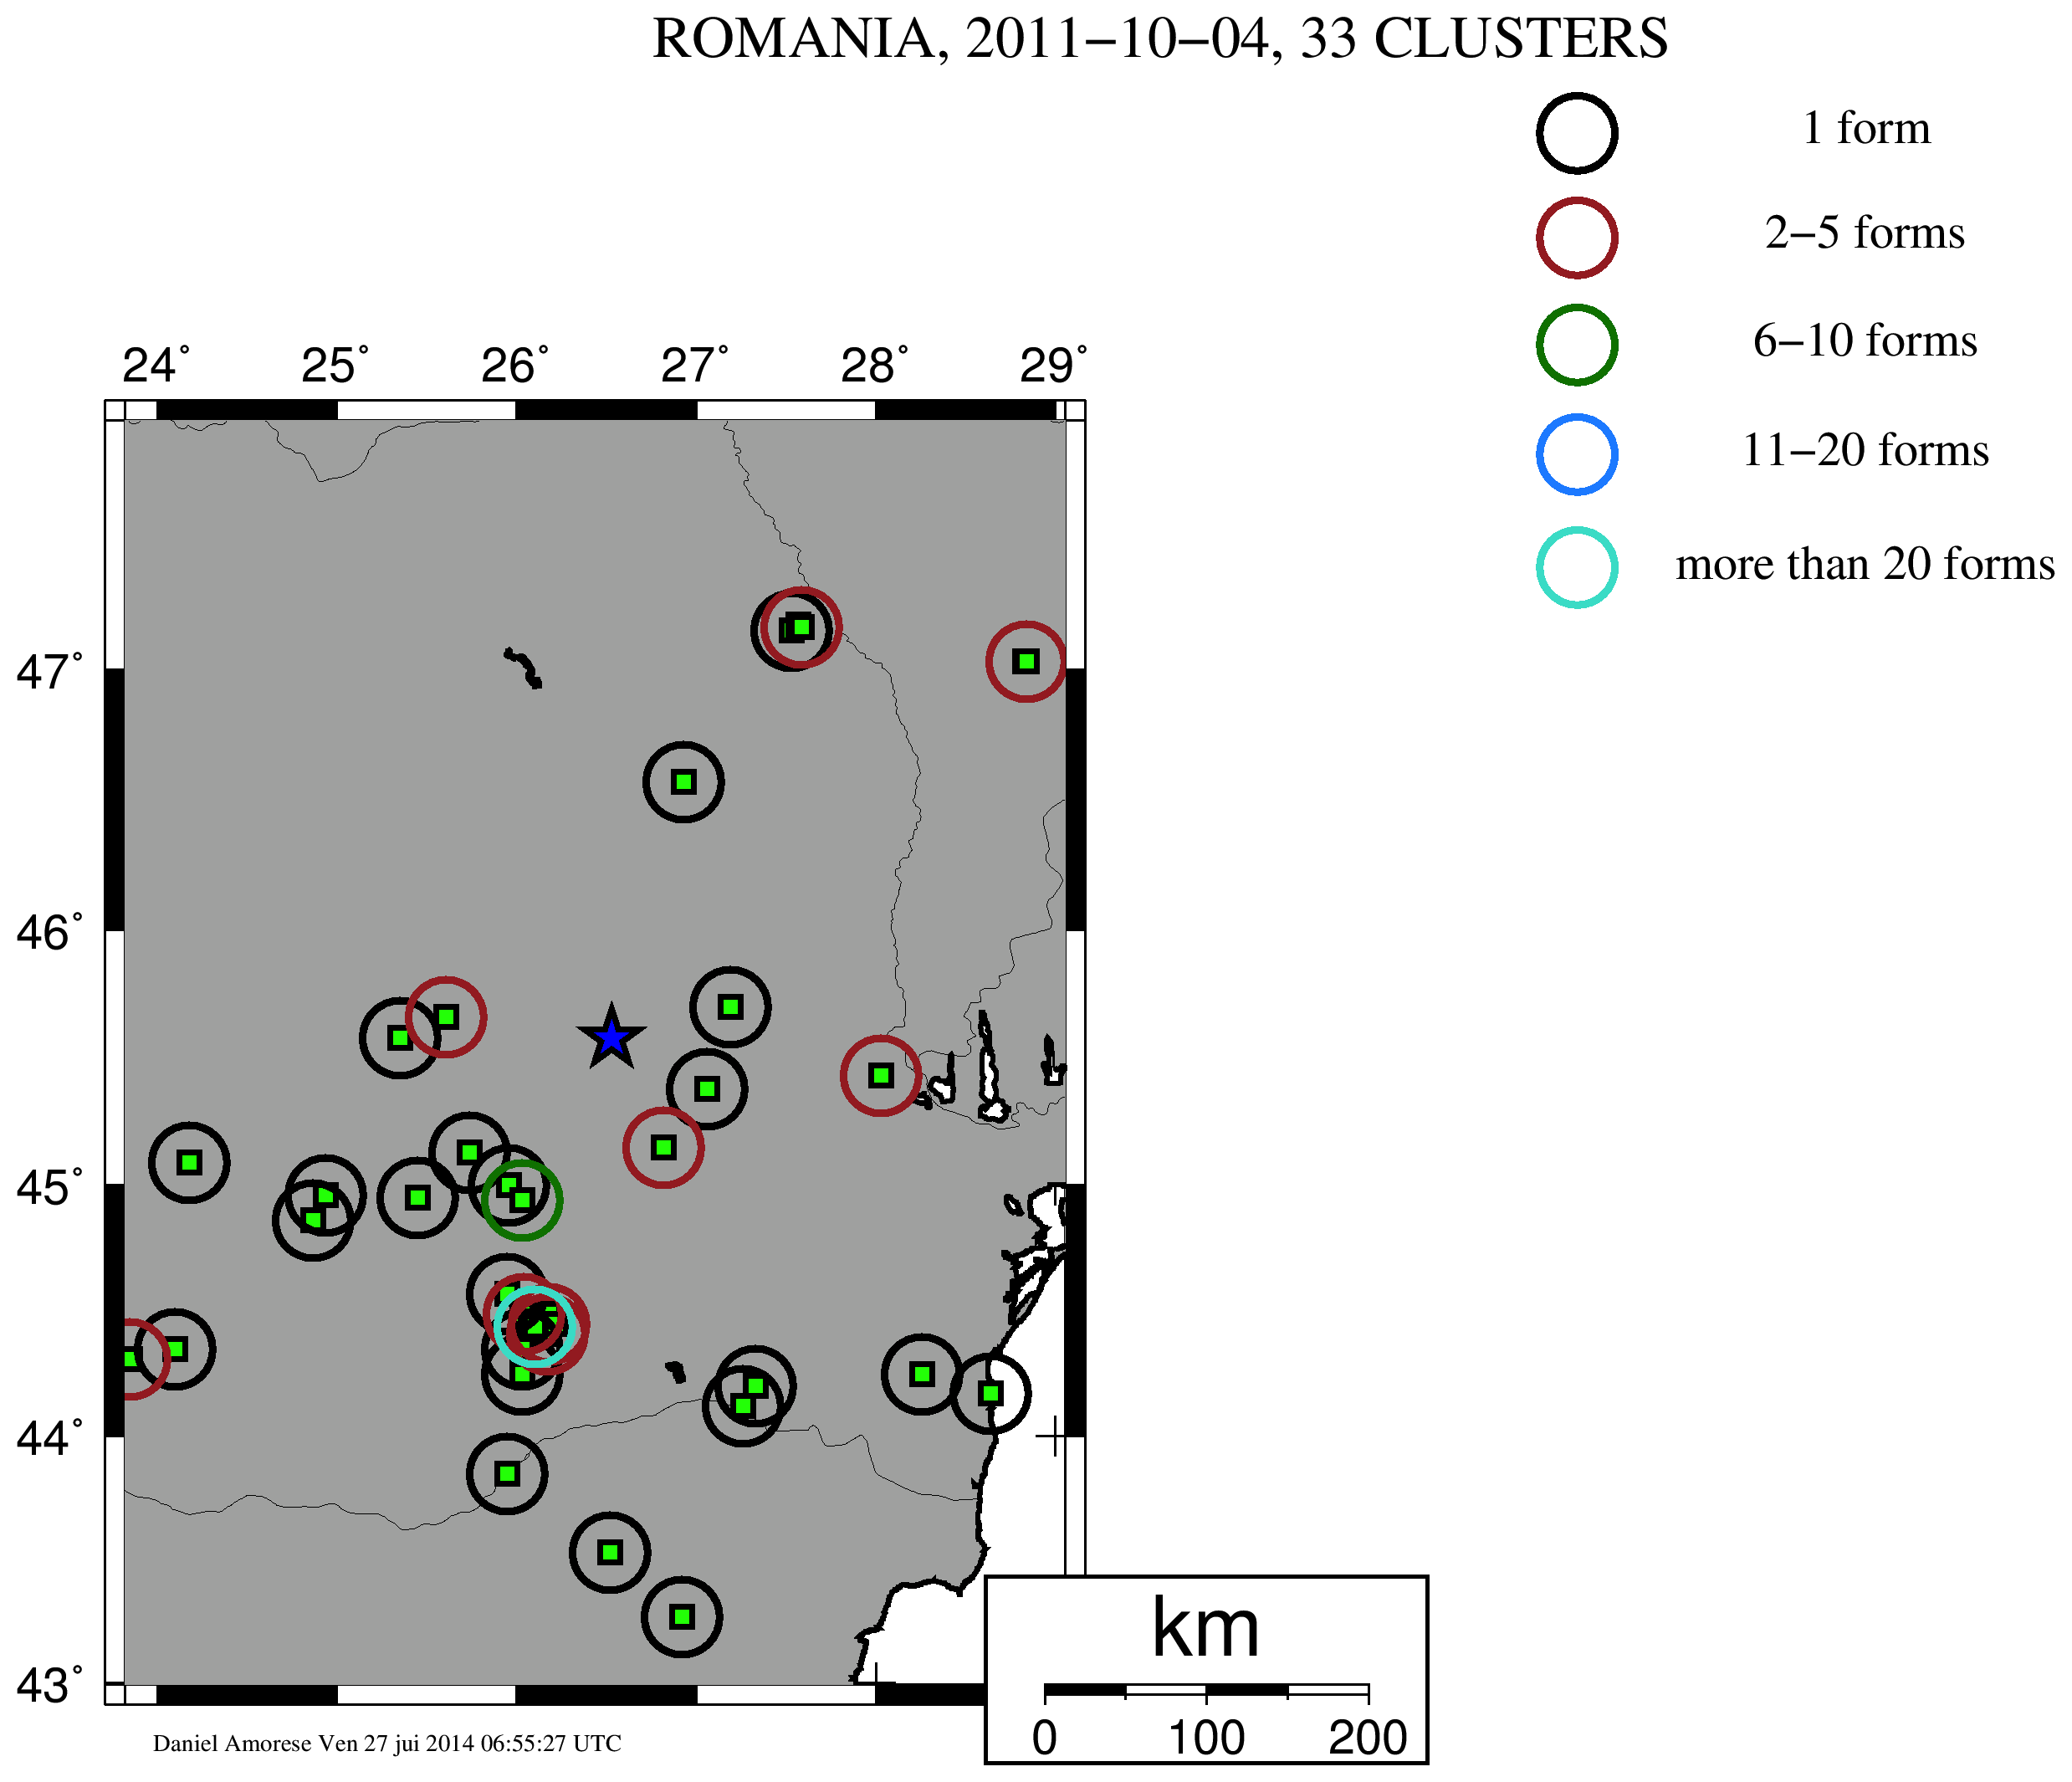
Figure S4. Clustering results for event D. Each green square locates an individual questionnaire (25 questionnaires are available for this event). The blue star is the instrumental epicenter.
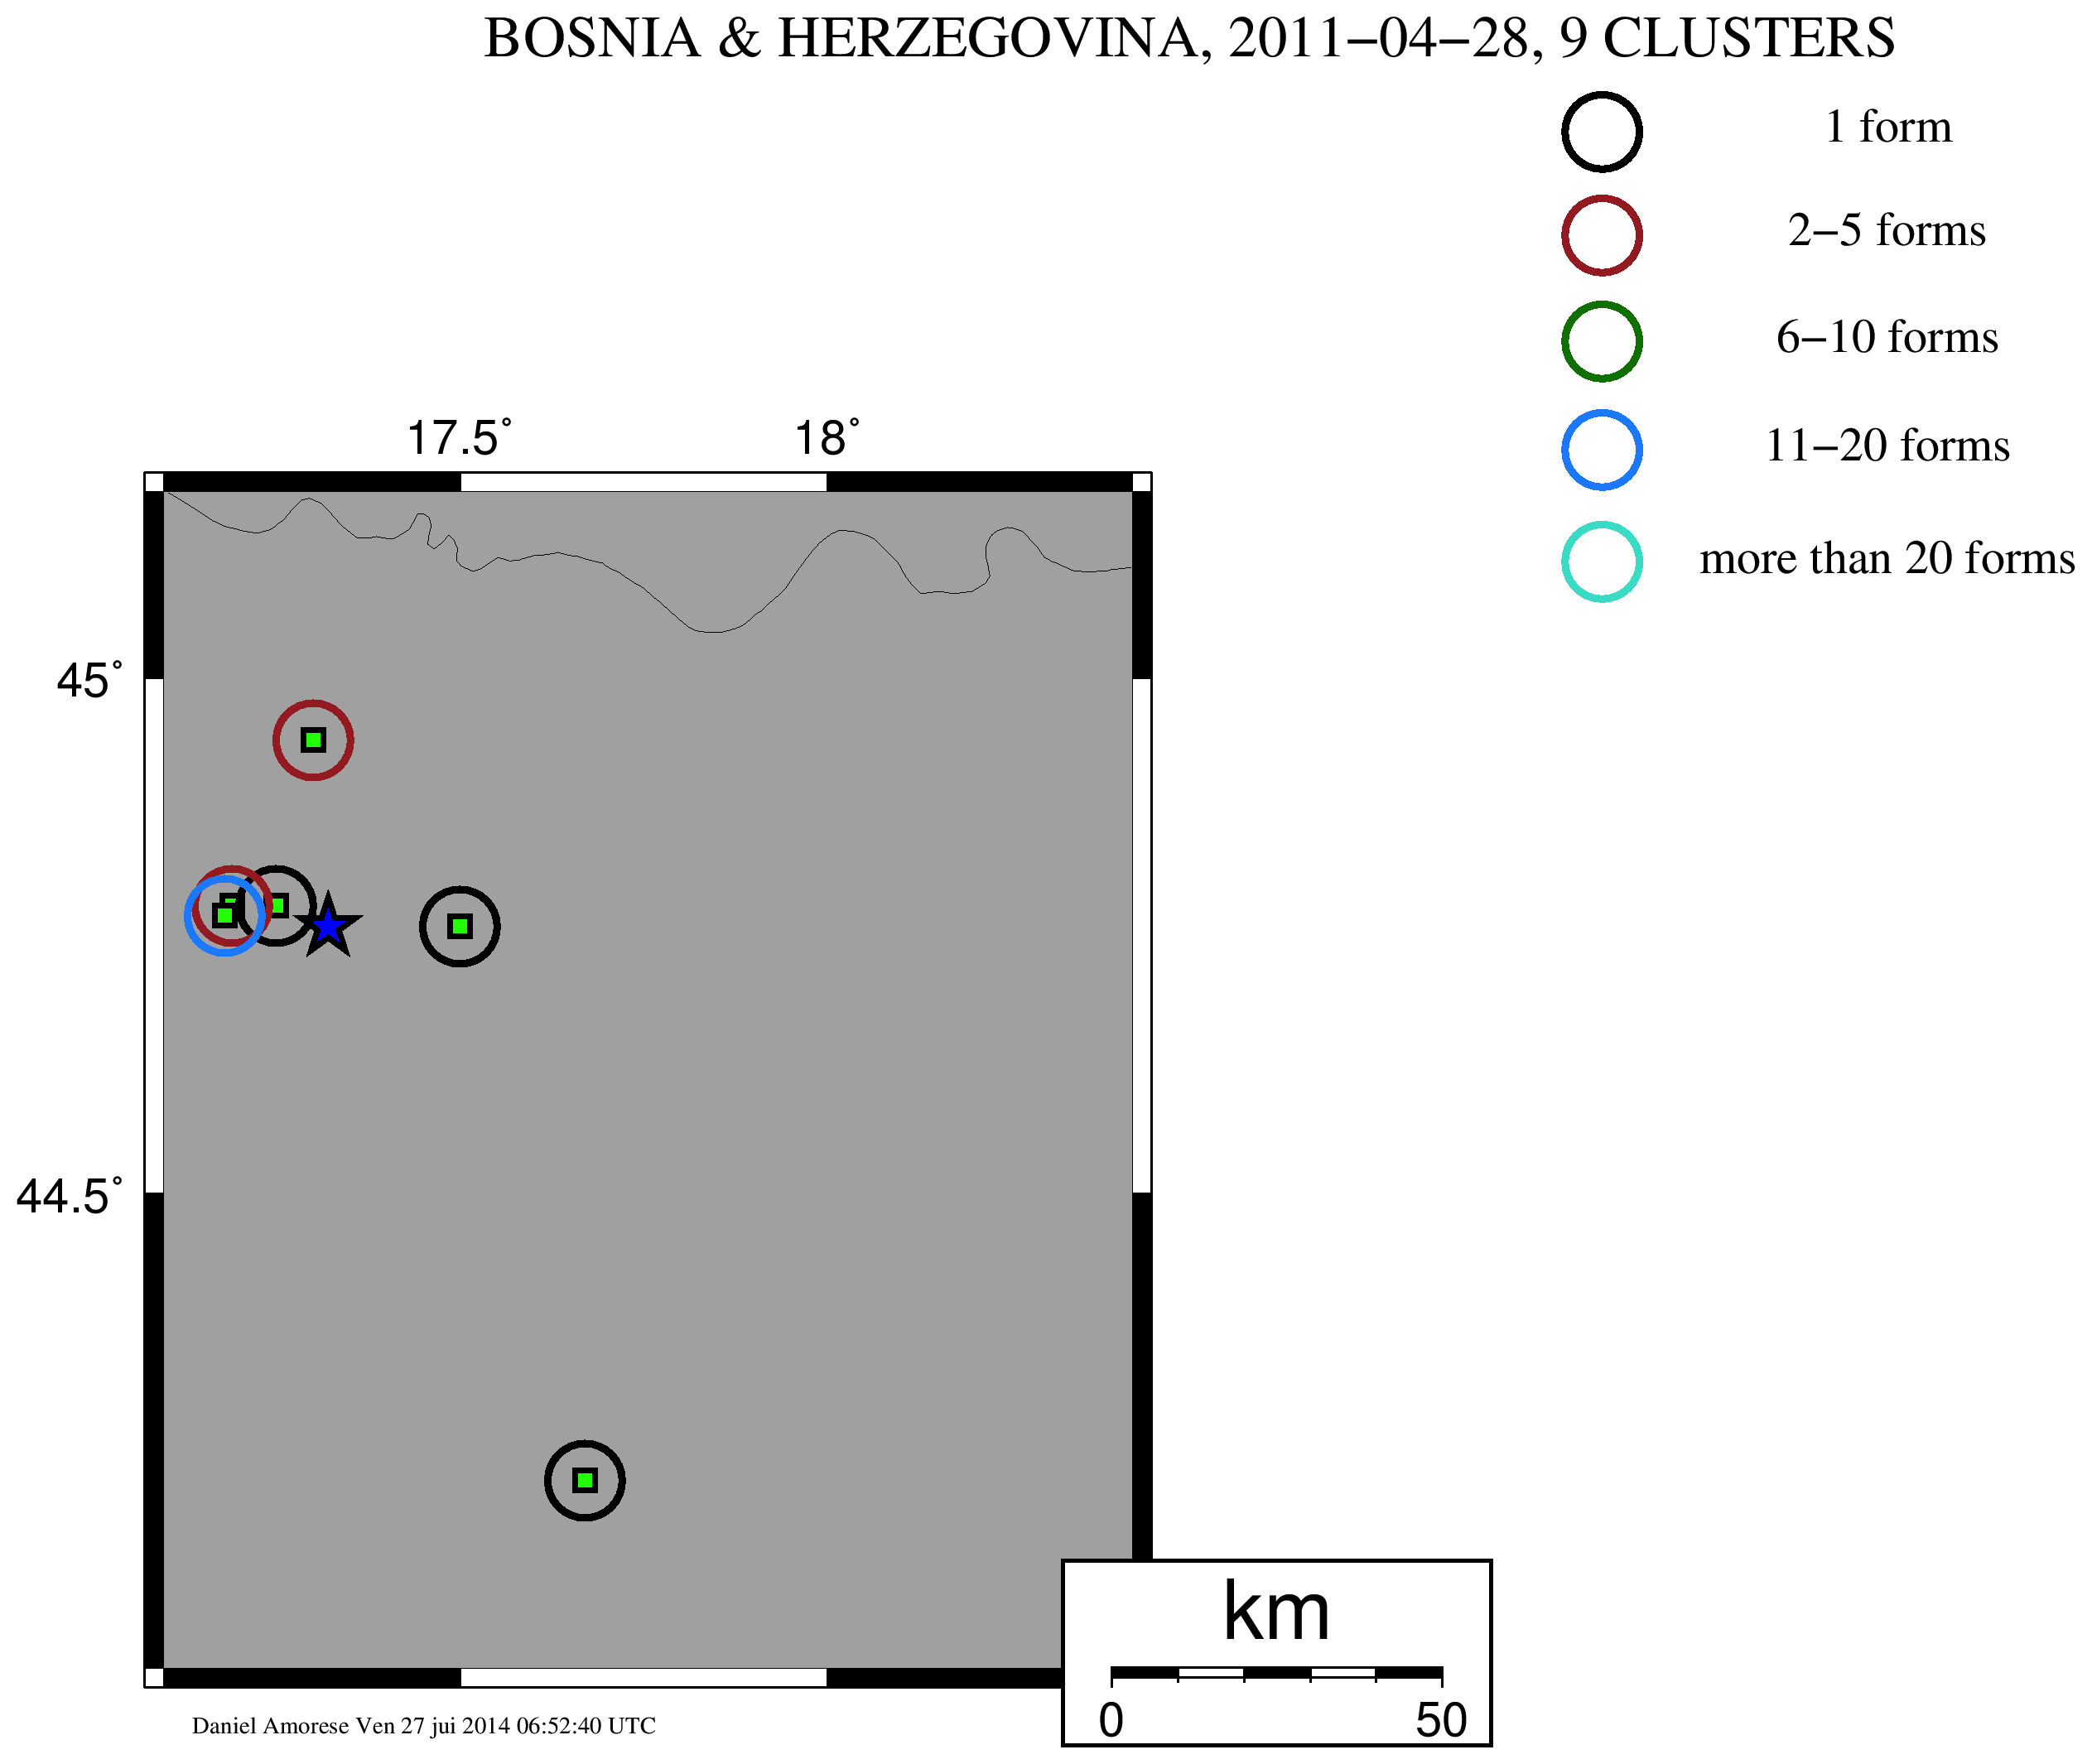
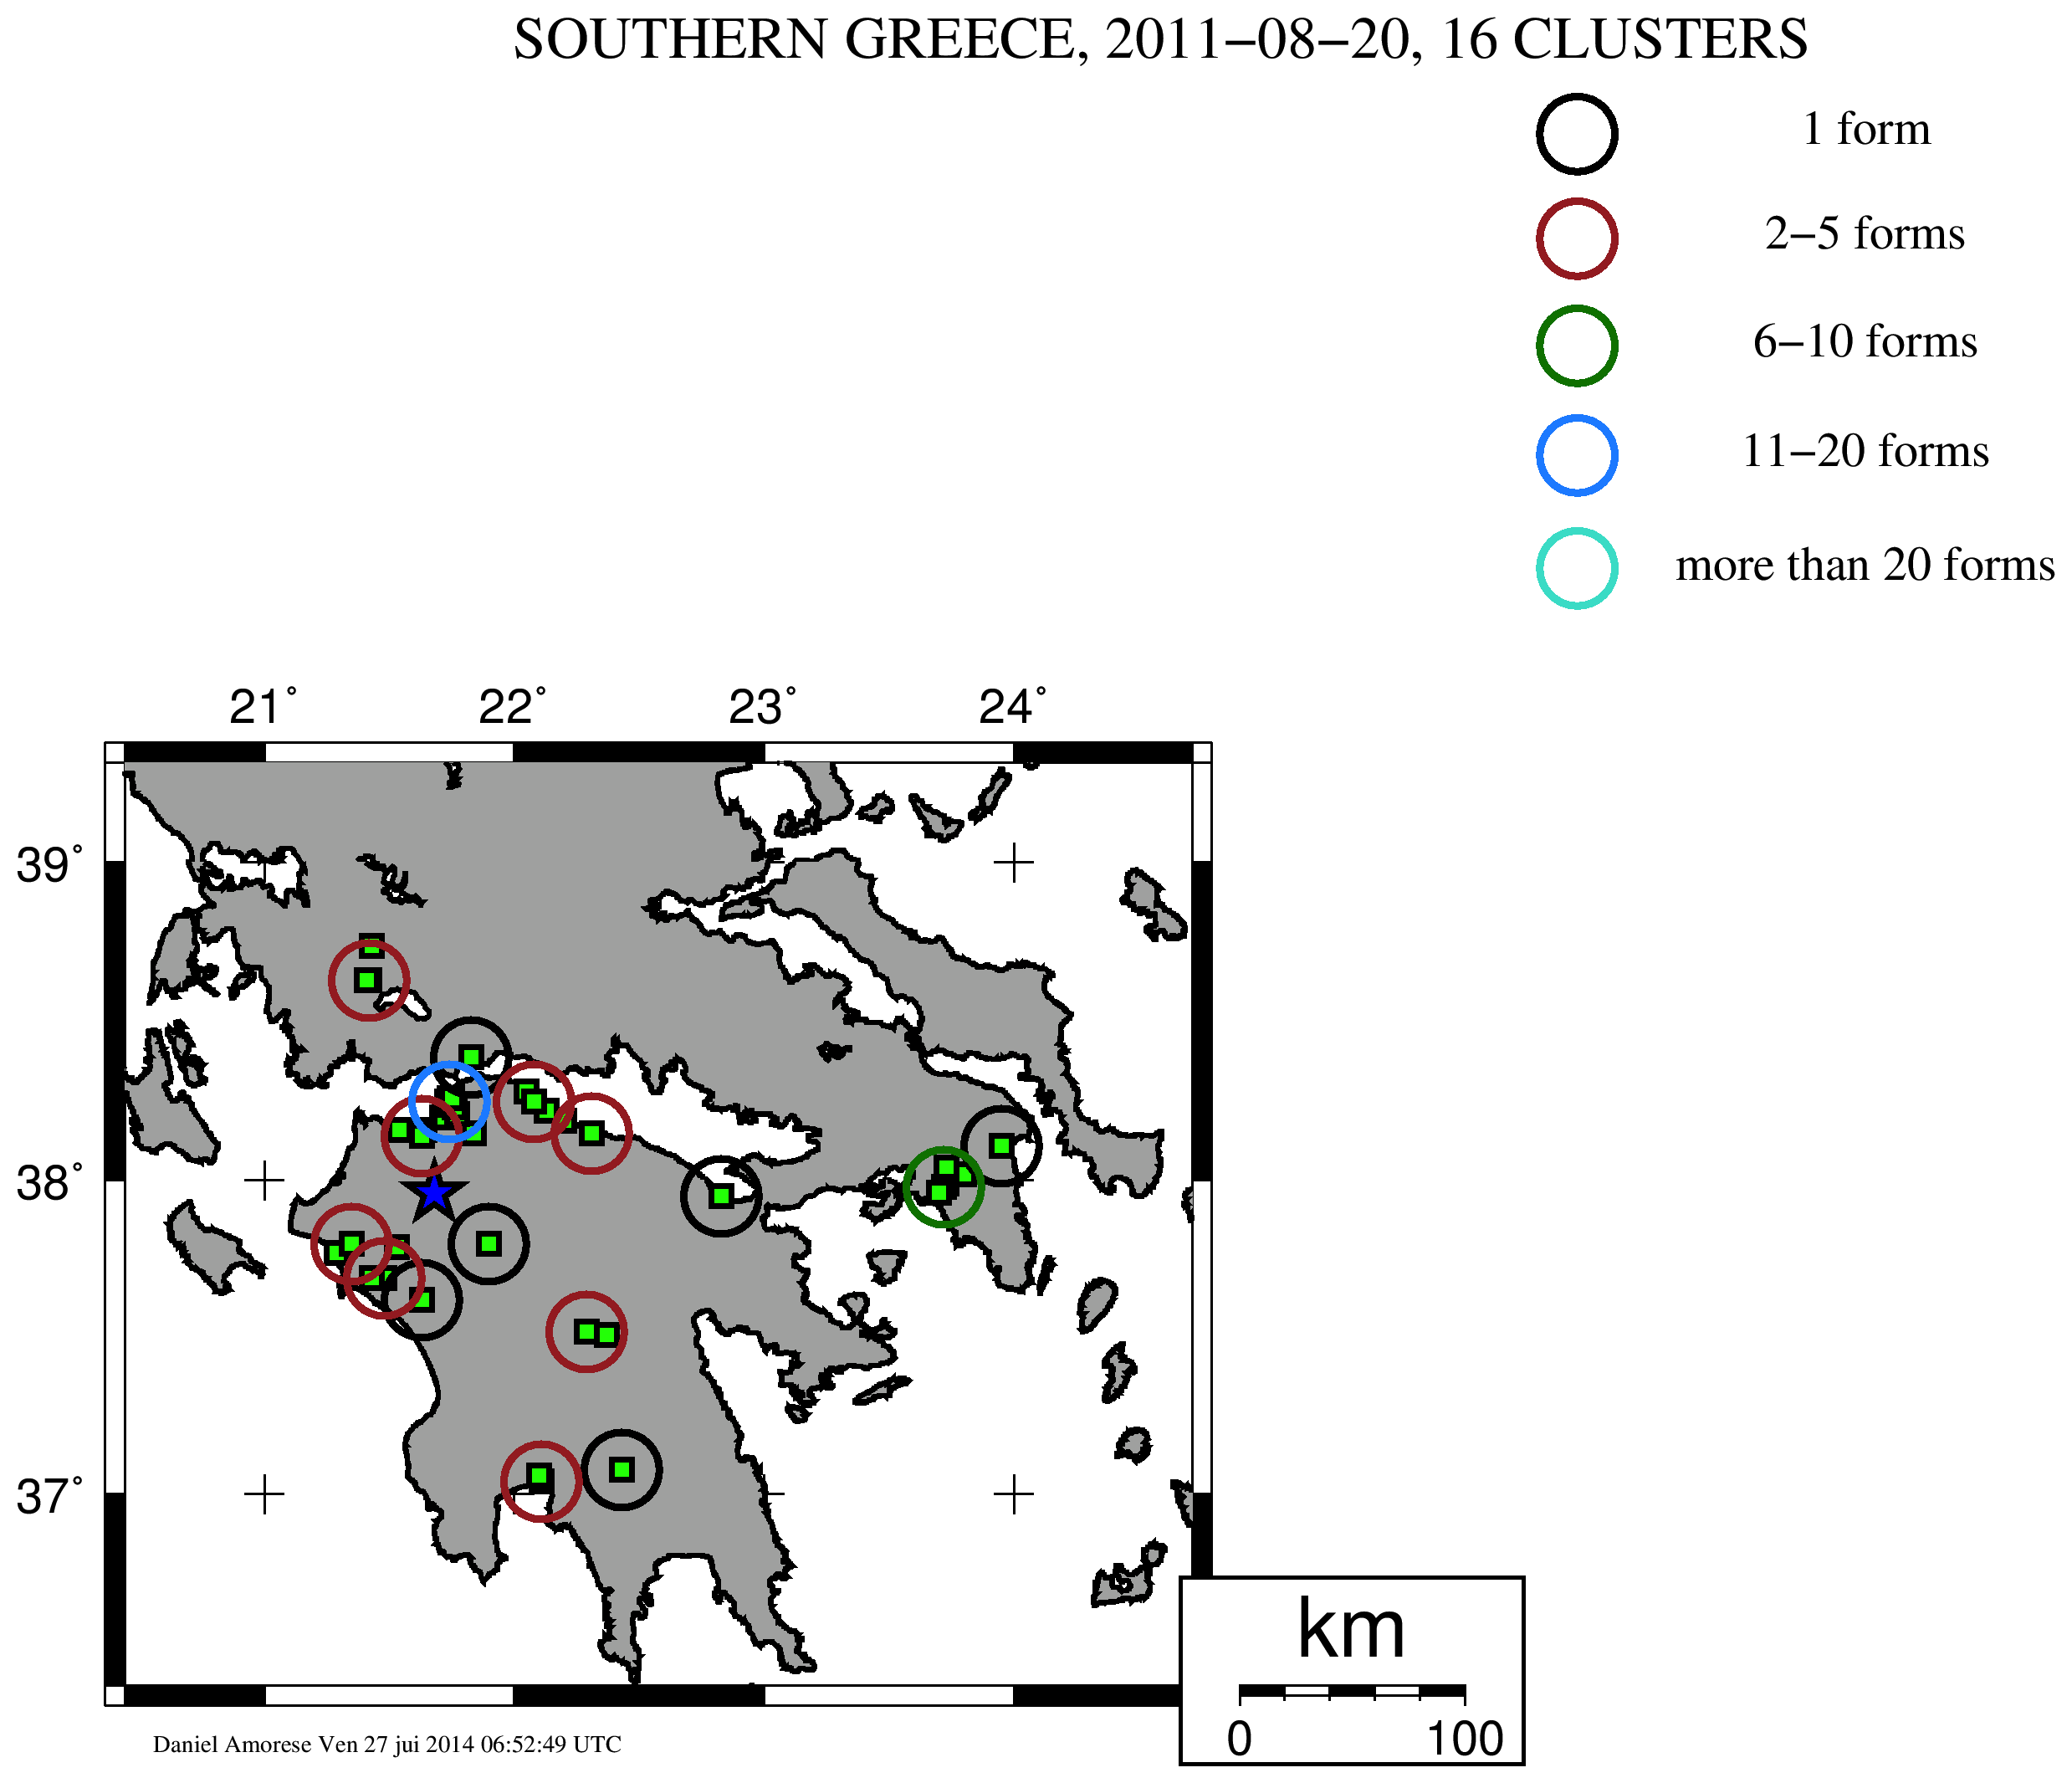
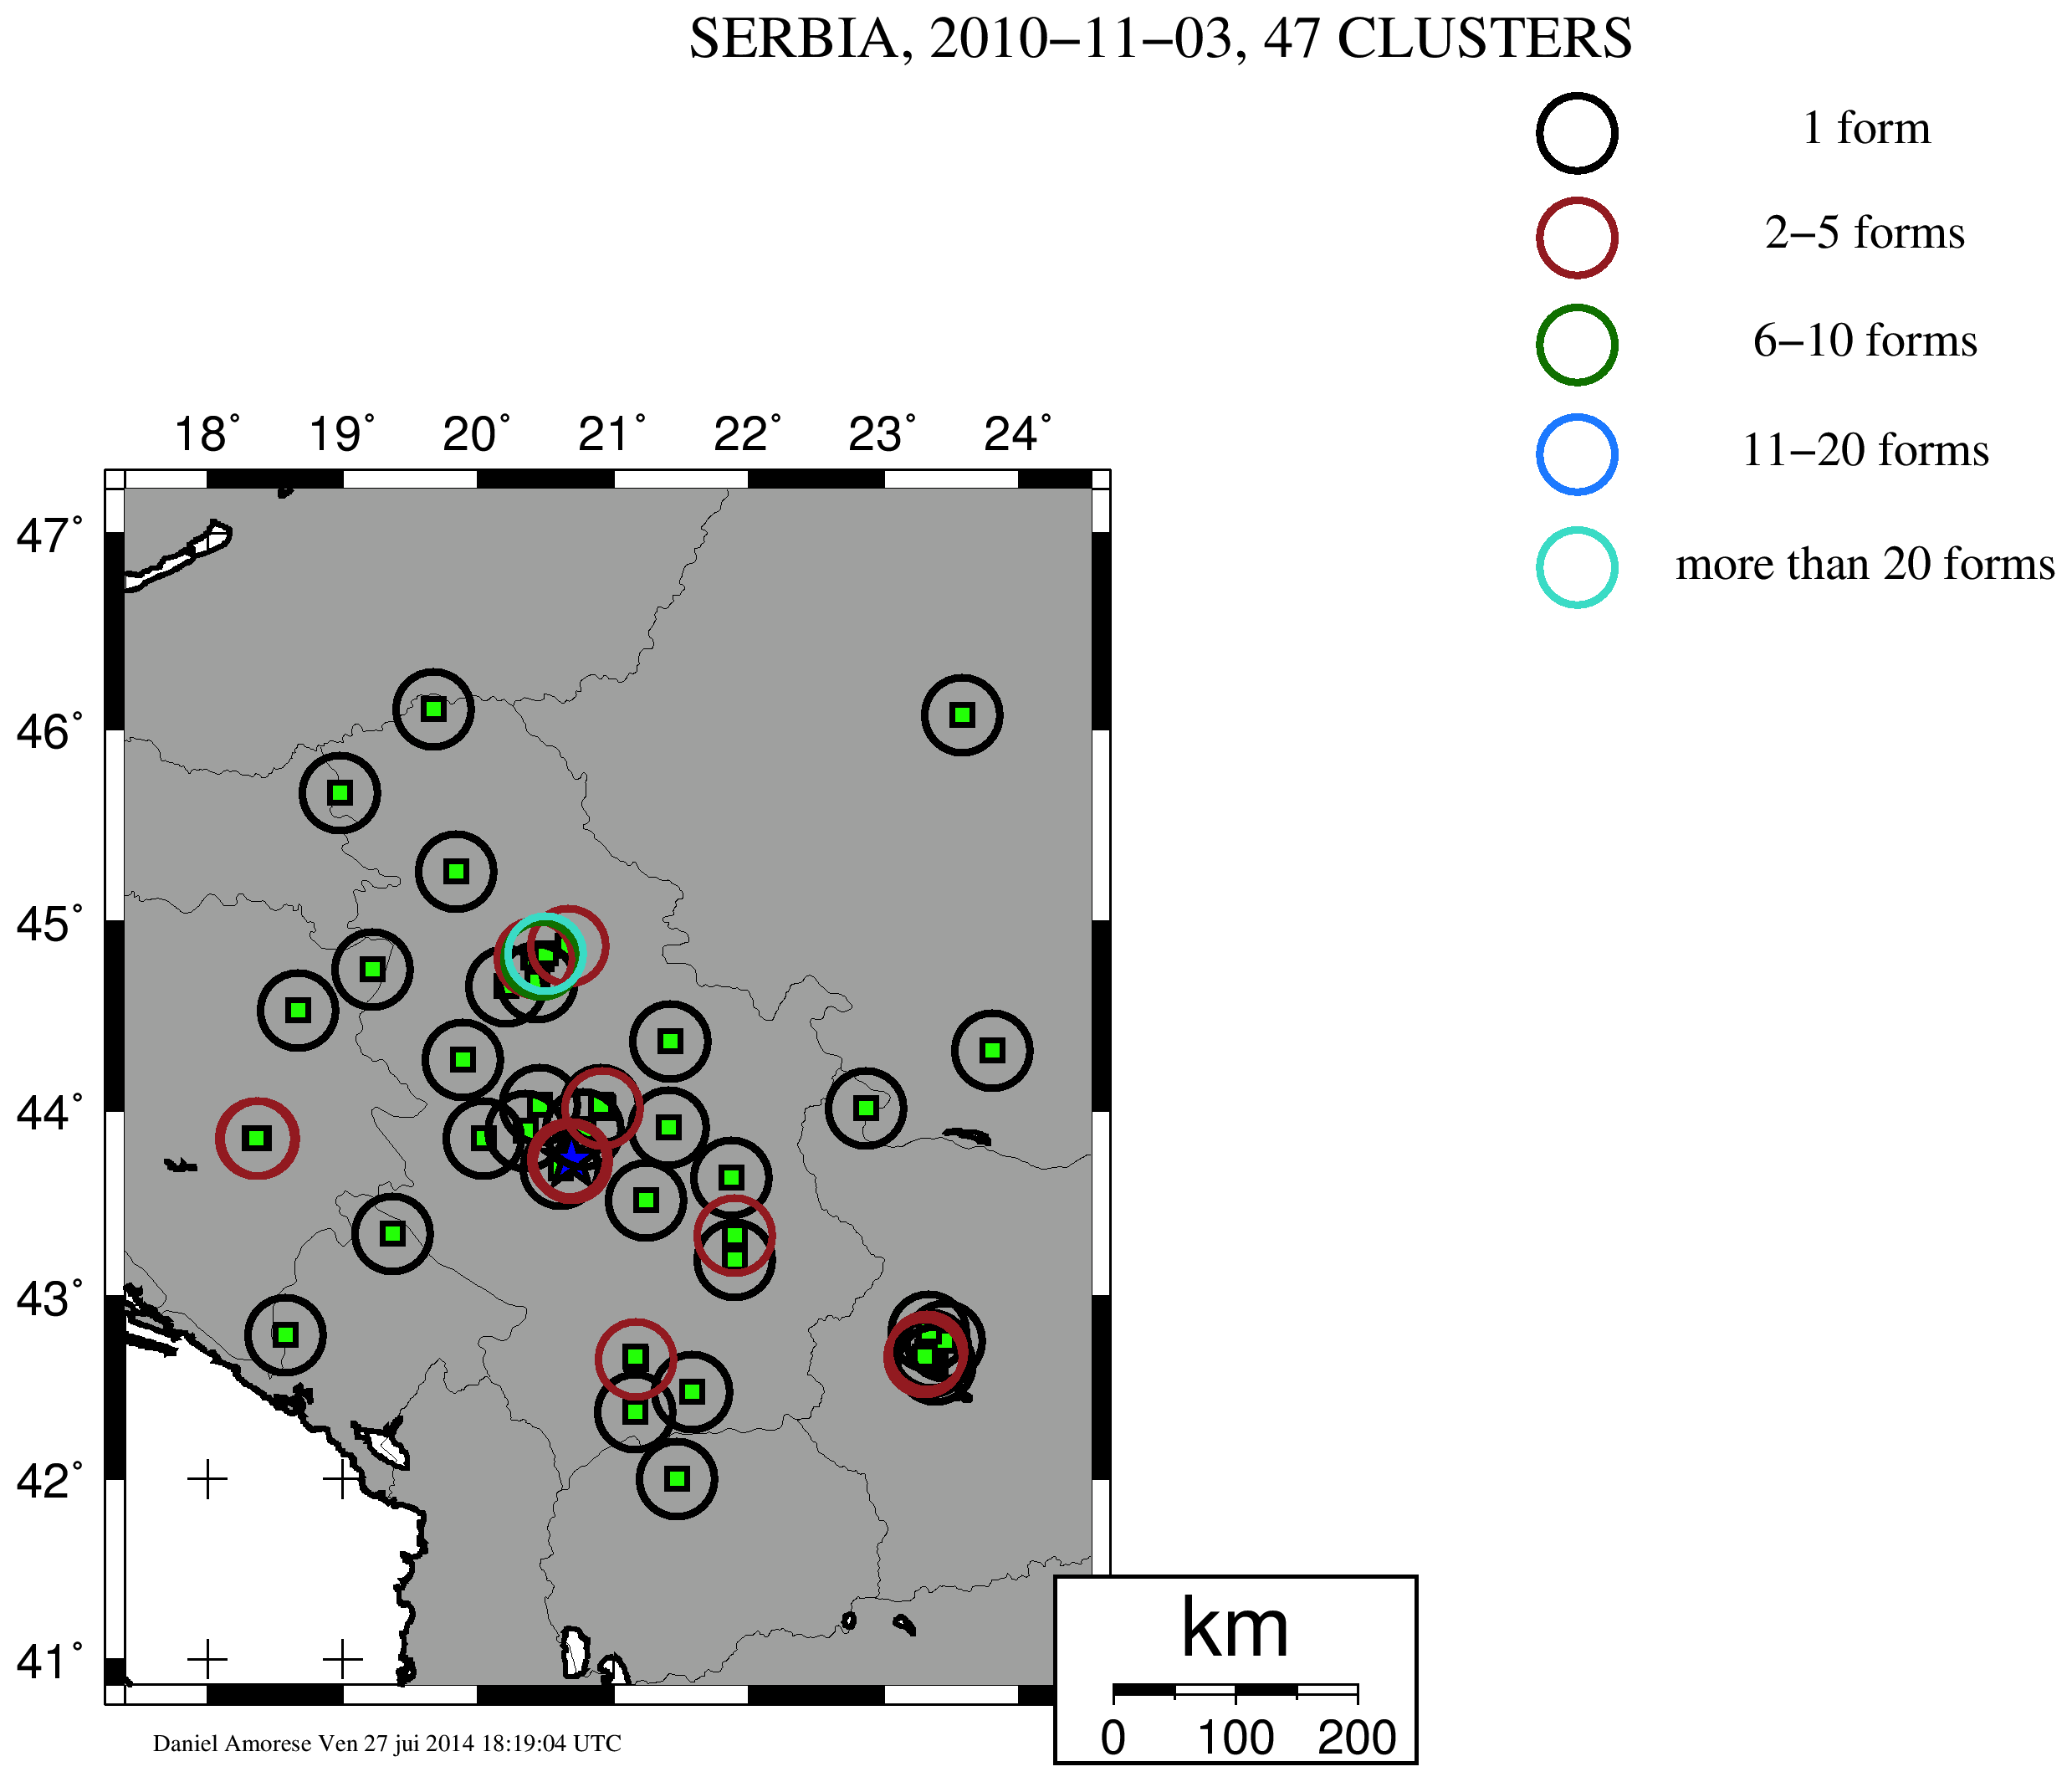
Figure S5. Clustering results for event E. Each green square locates an individual questionnaire (45 questionnaires are available for this event). The blue star is the instrumental epicenter.
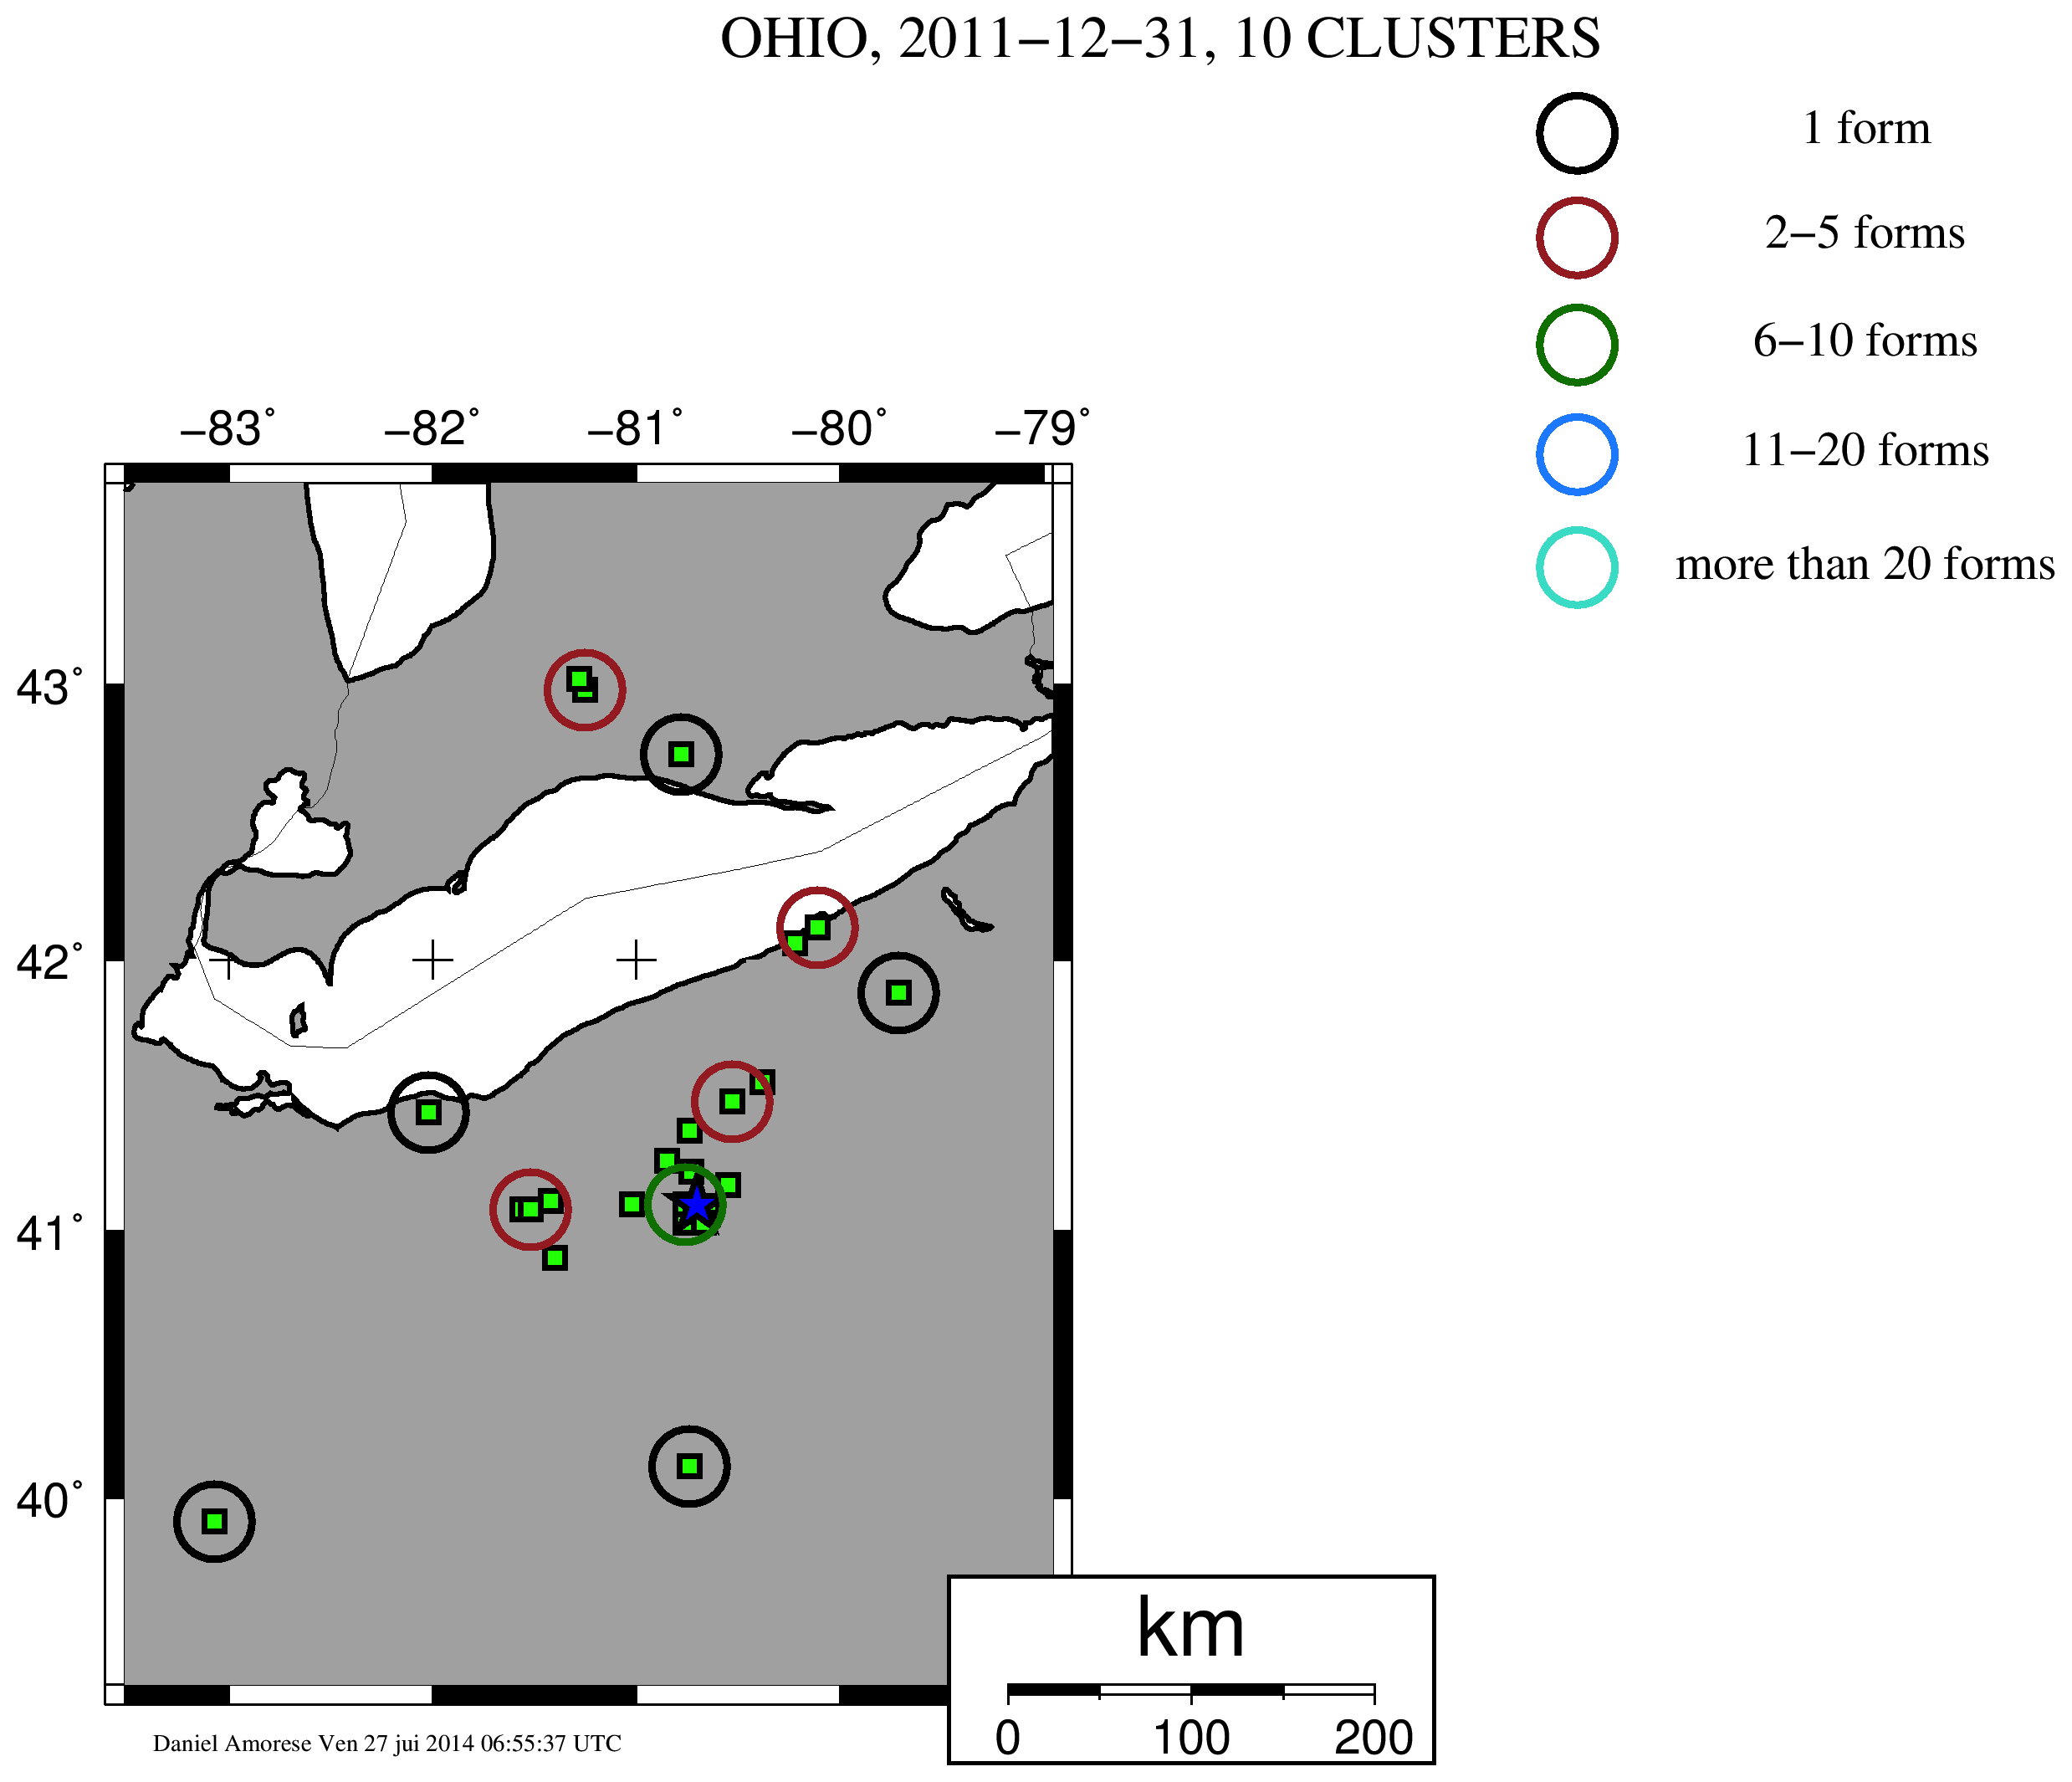
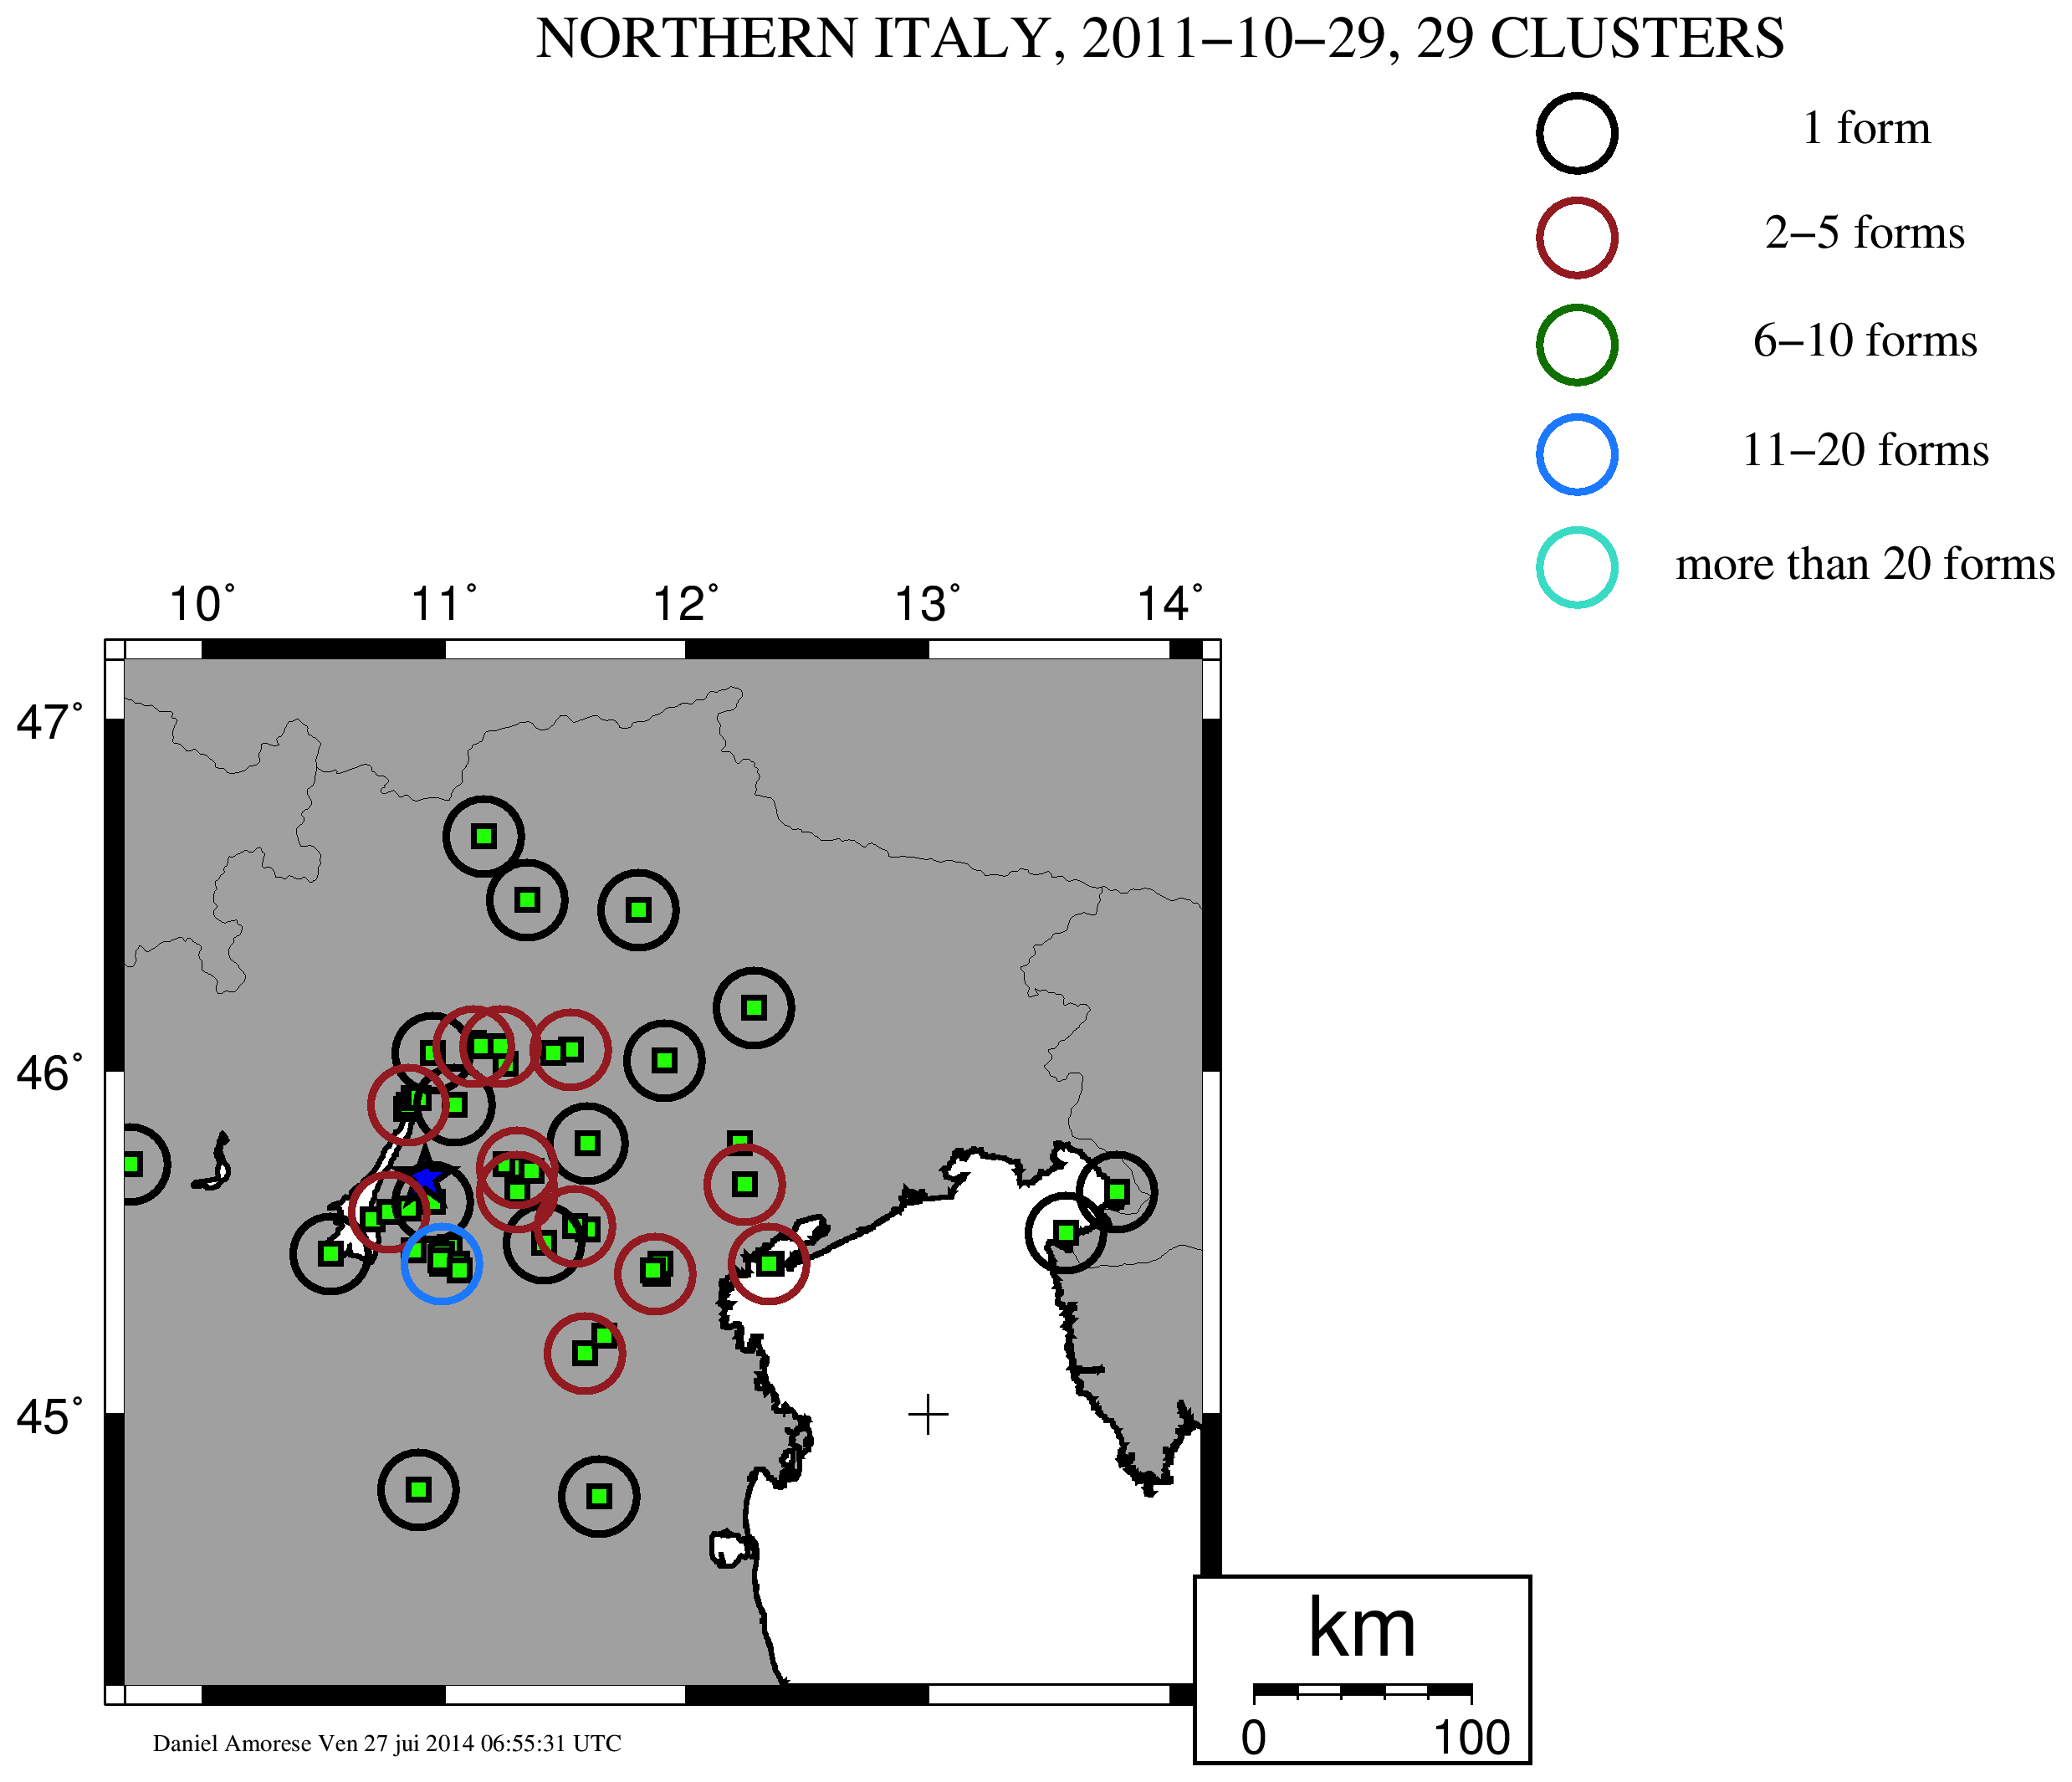
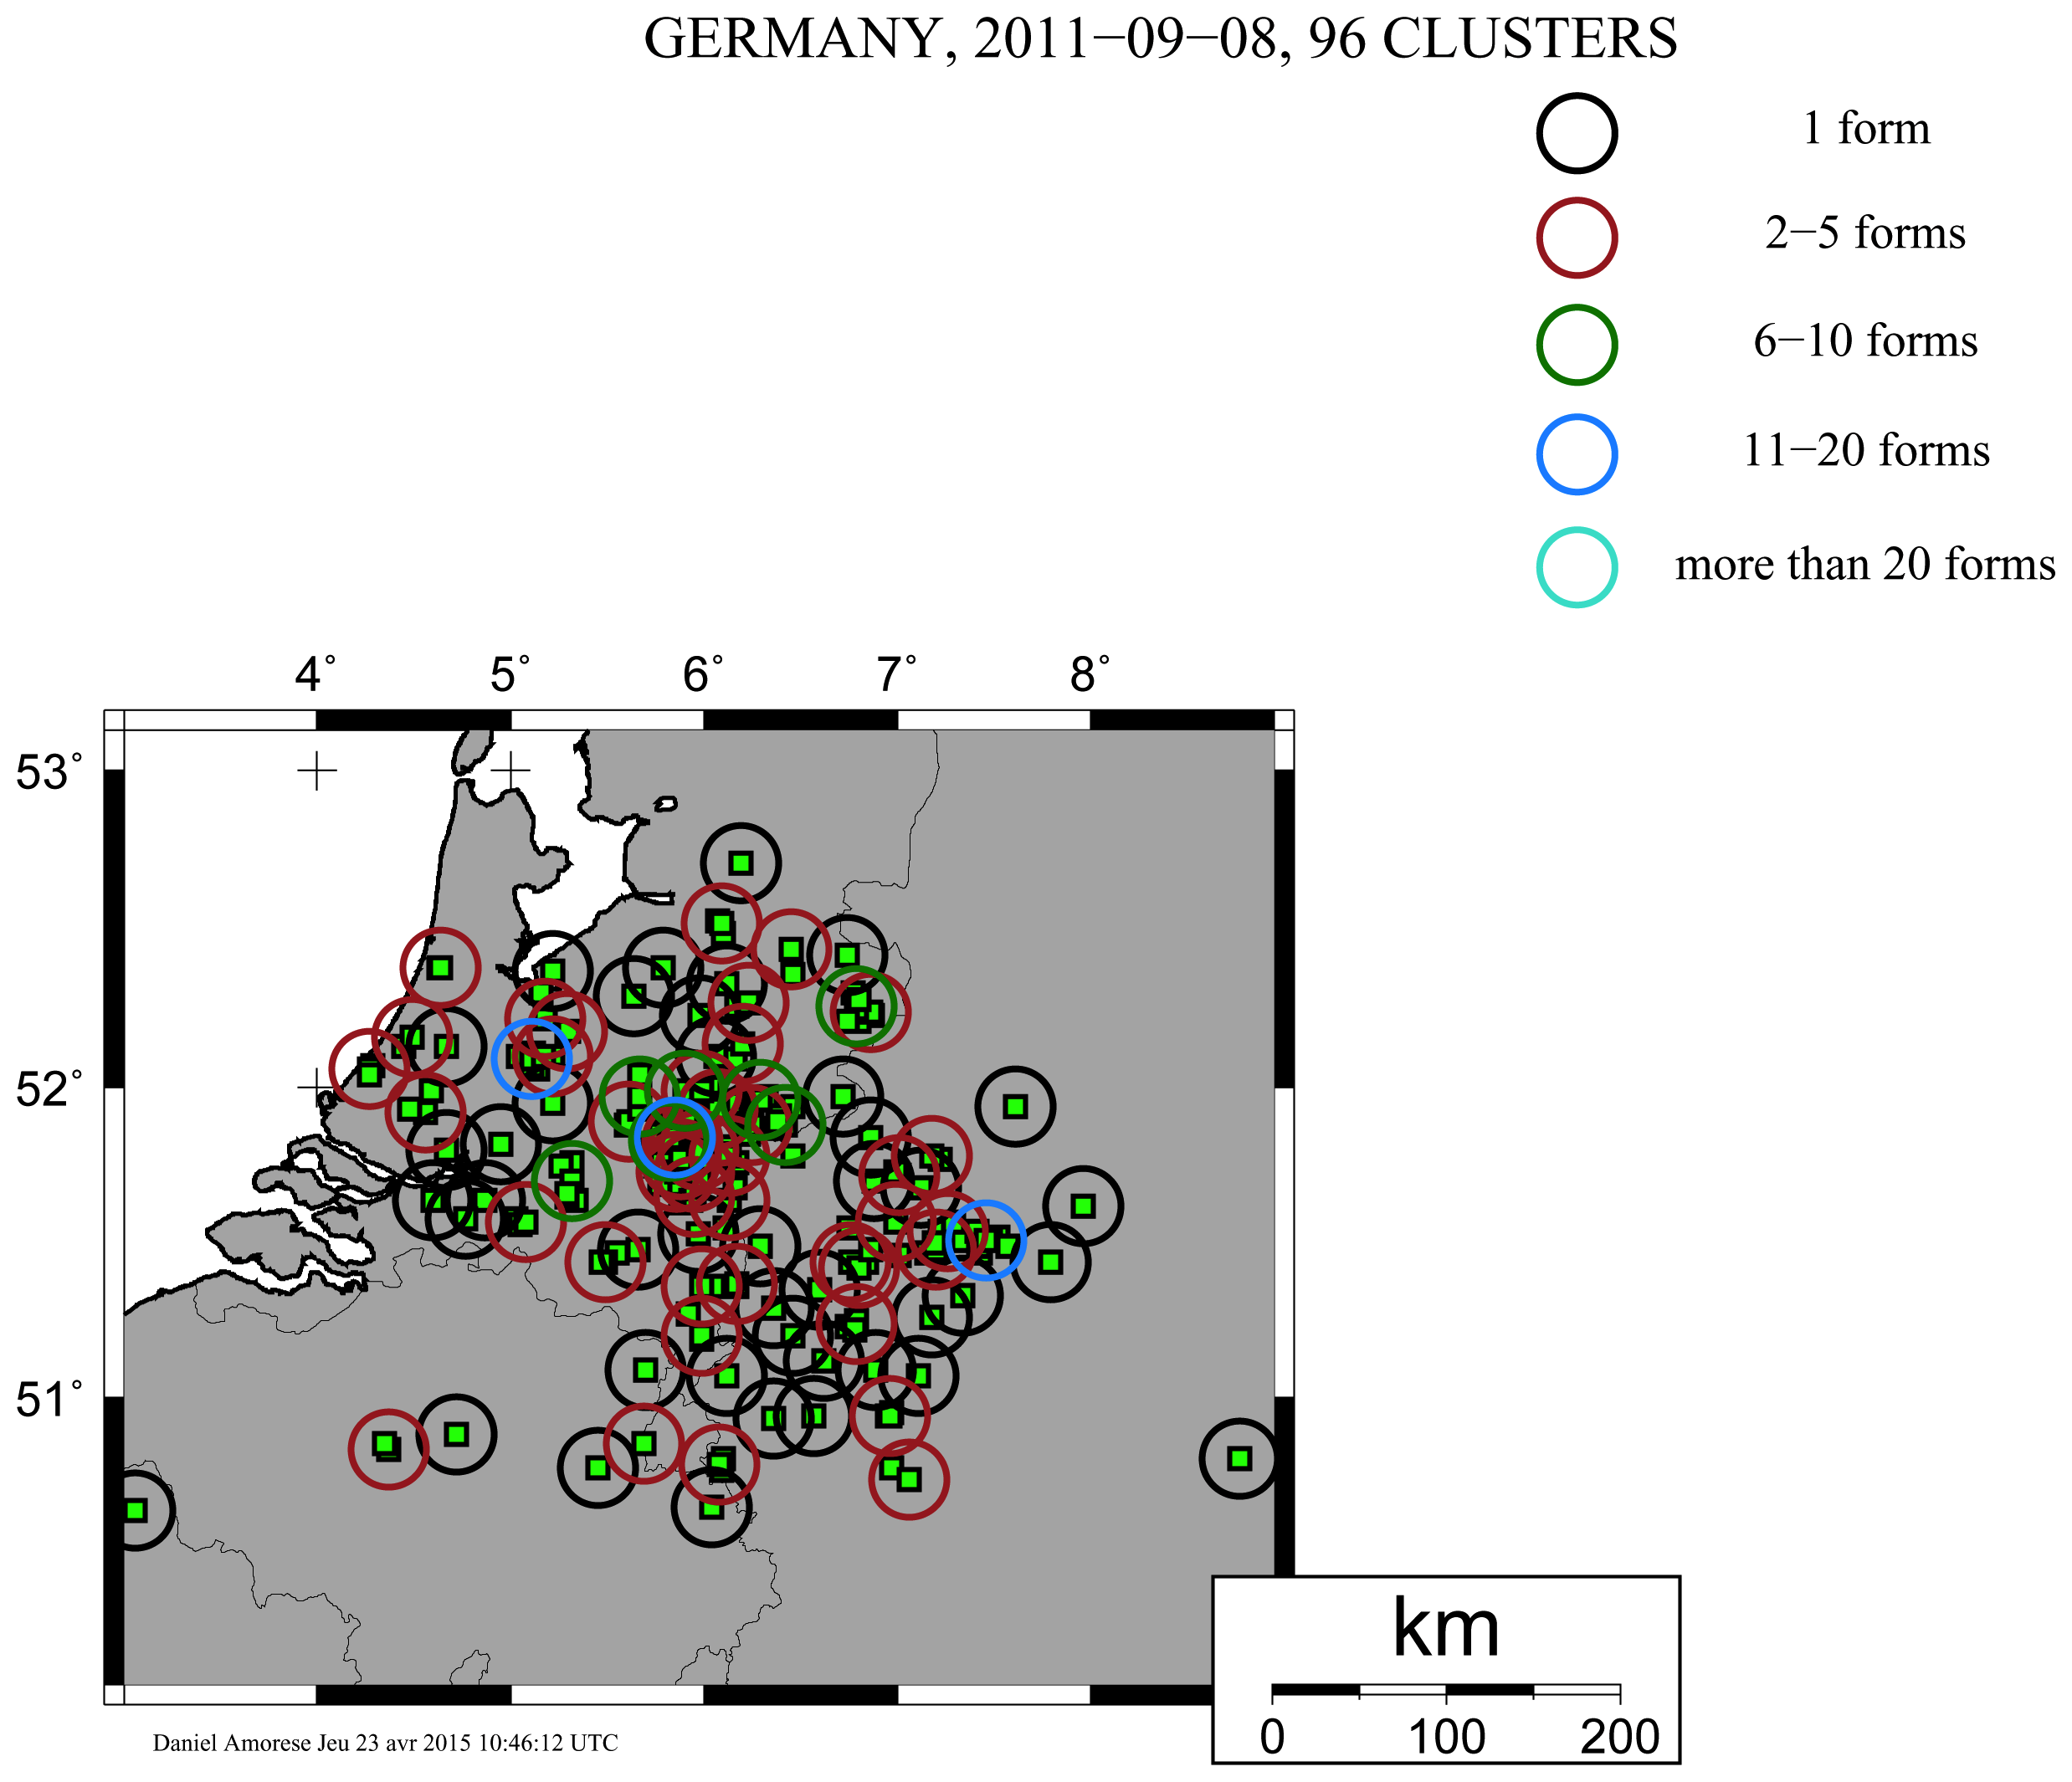
Figure S6. Clustering results for event F. Each green square locates an individual questionnaire (48 questionnaires are available for this event). The blue star is the instrumental epicenter.
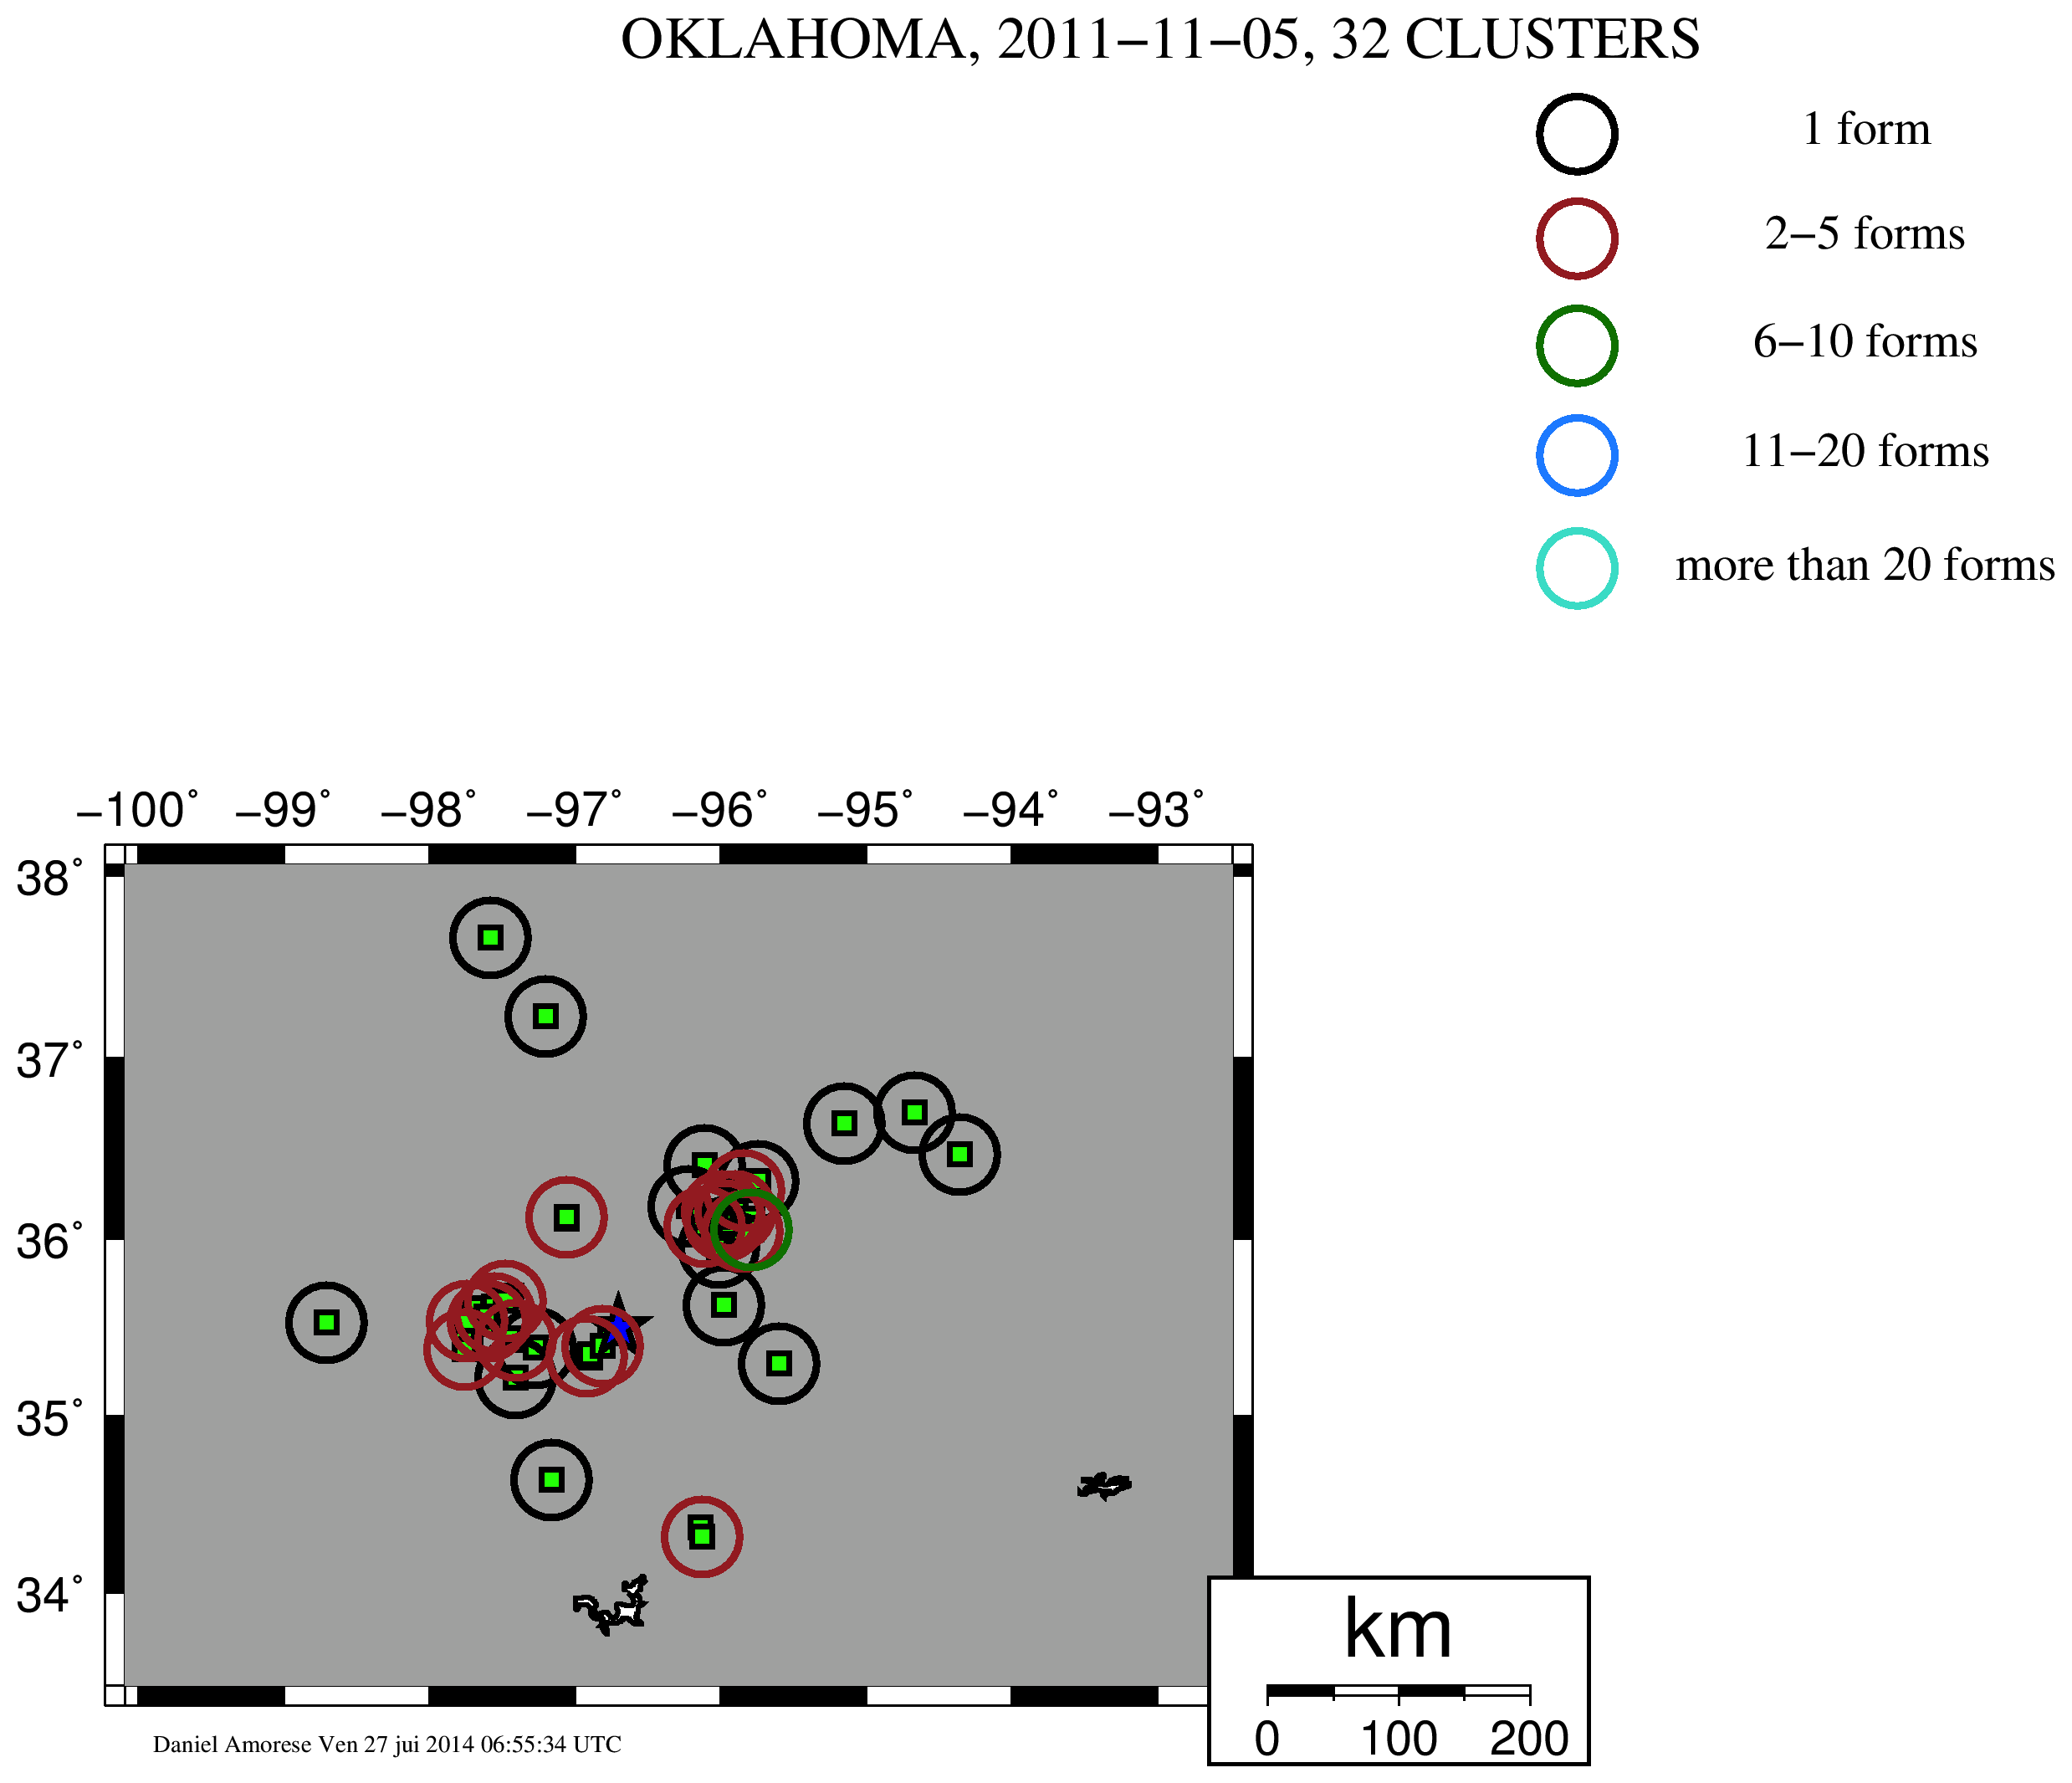
Figure S7. Clustering results for event G. Each green square locates an individual questionnaire (65 questionnaires are available for this event). The blue star is the instrumental epicenter.
Figure S8. Clustering results for event H. Each green square locates an individual questionnaire (67 questionnaires are available for this event). The blue star is the instrumental epicenter.
Figure S9. Clustering results for event I. Each green square locates an individual questionnaire (74 questionnaires are available for this event). The blue star is the instrumental epicenter.
Figure S10. Clustering results for event J. Each green square locates an individual questionnaire (91 questionnaires are available for this event). The blue star is the instrumental epicenter.
Figure S11. Clustering results for event K. Each green square locates an individual questionnaire (117 questionnaires are available for this event). The blue star is the instrumental epicenter.
Figure S12. Clustering results for event L. Each green square locates an individual questionnaire (269 questionnaires are available for this event). The blue star is the instrumental epicenter.
Figure S13. Clustering results for event M. Each green square locates an individual questionnaire (391 questionnaires are available for this event). The blue star is the instrumental epicenter.
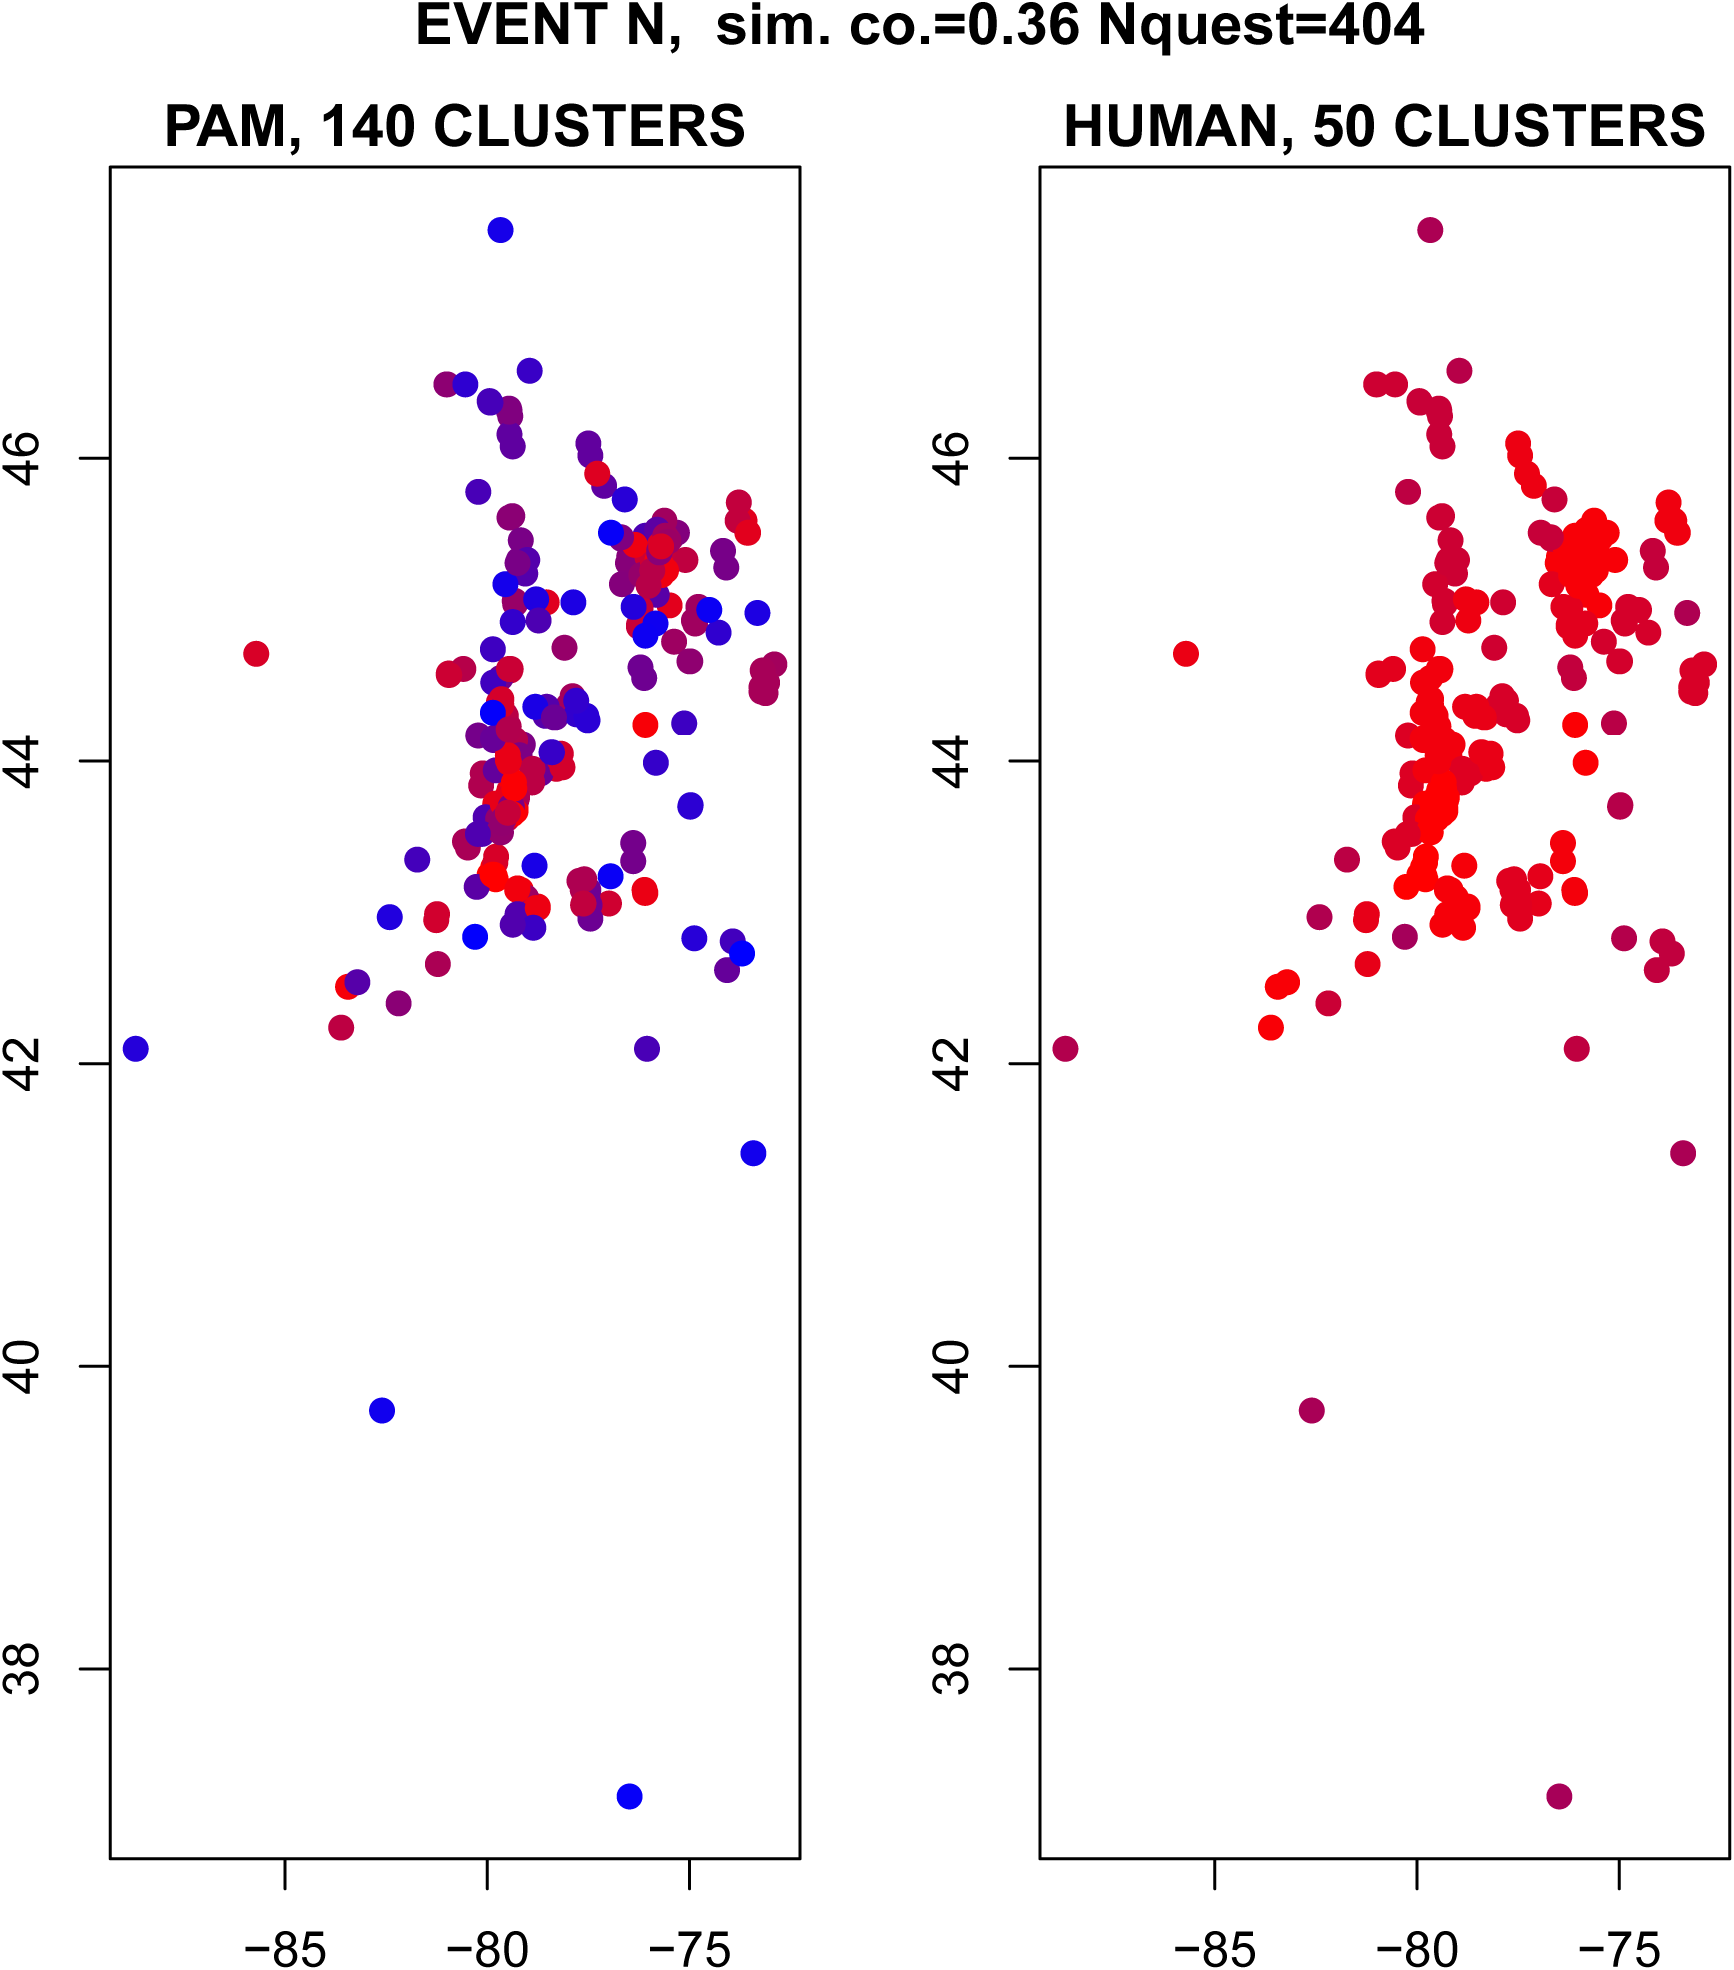
Figure S14. Clustering results for event N. Each green square locates an individual questionnaire (404 questionnaires are available for this event). The blue star is the instrumental epicenter.
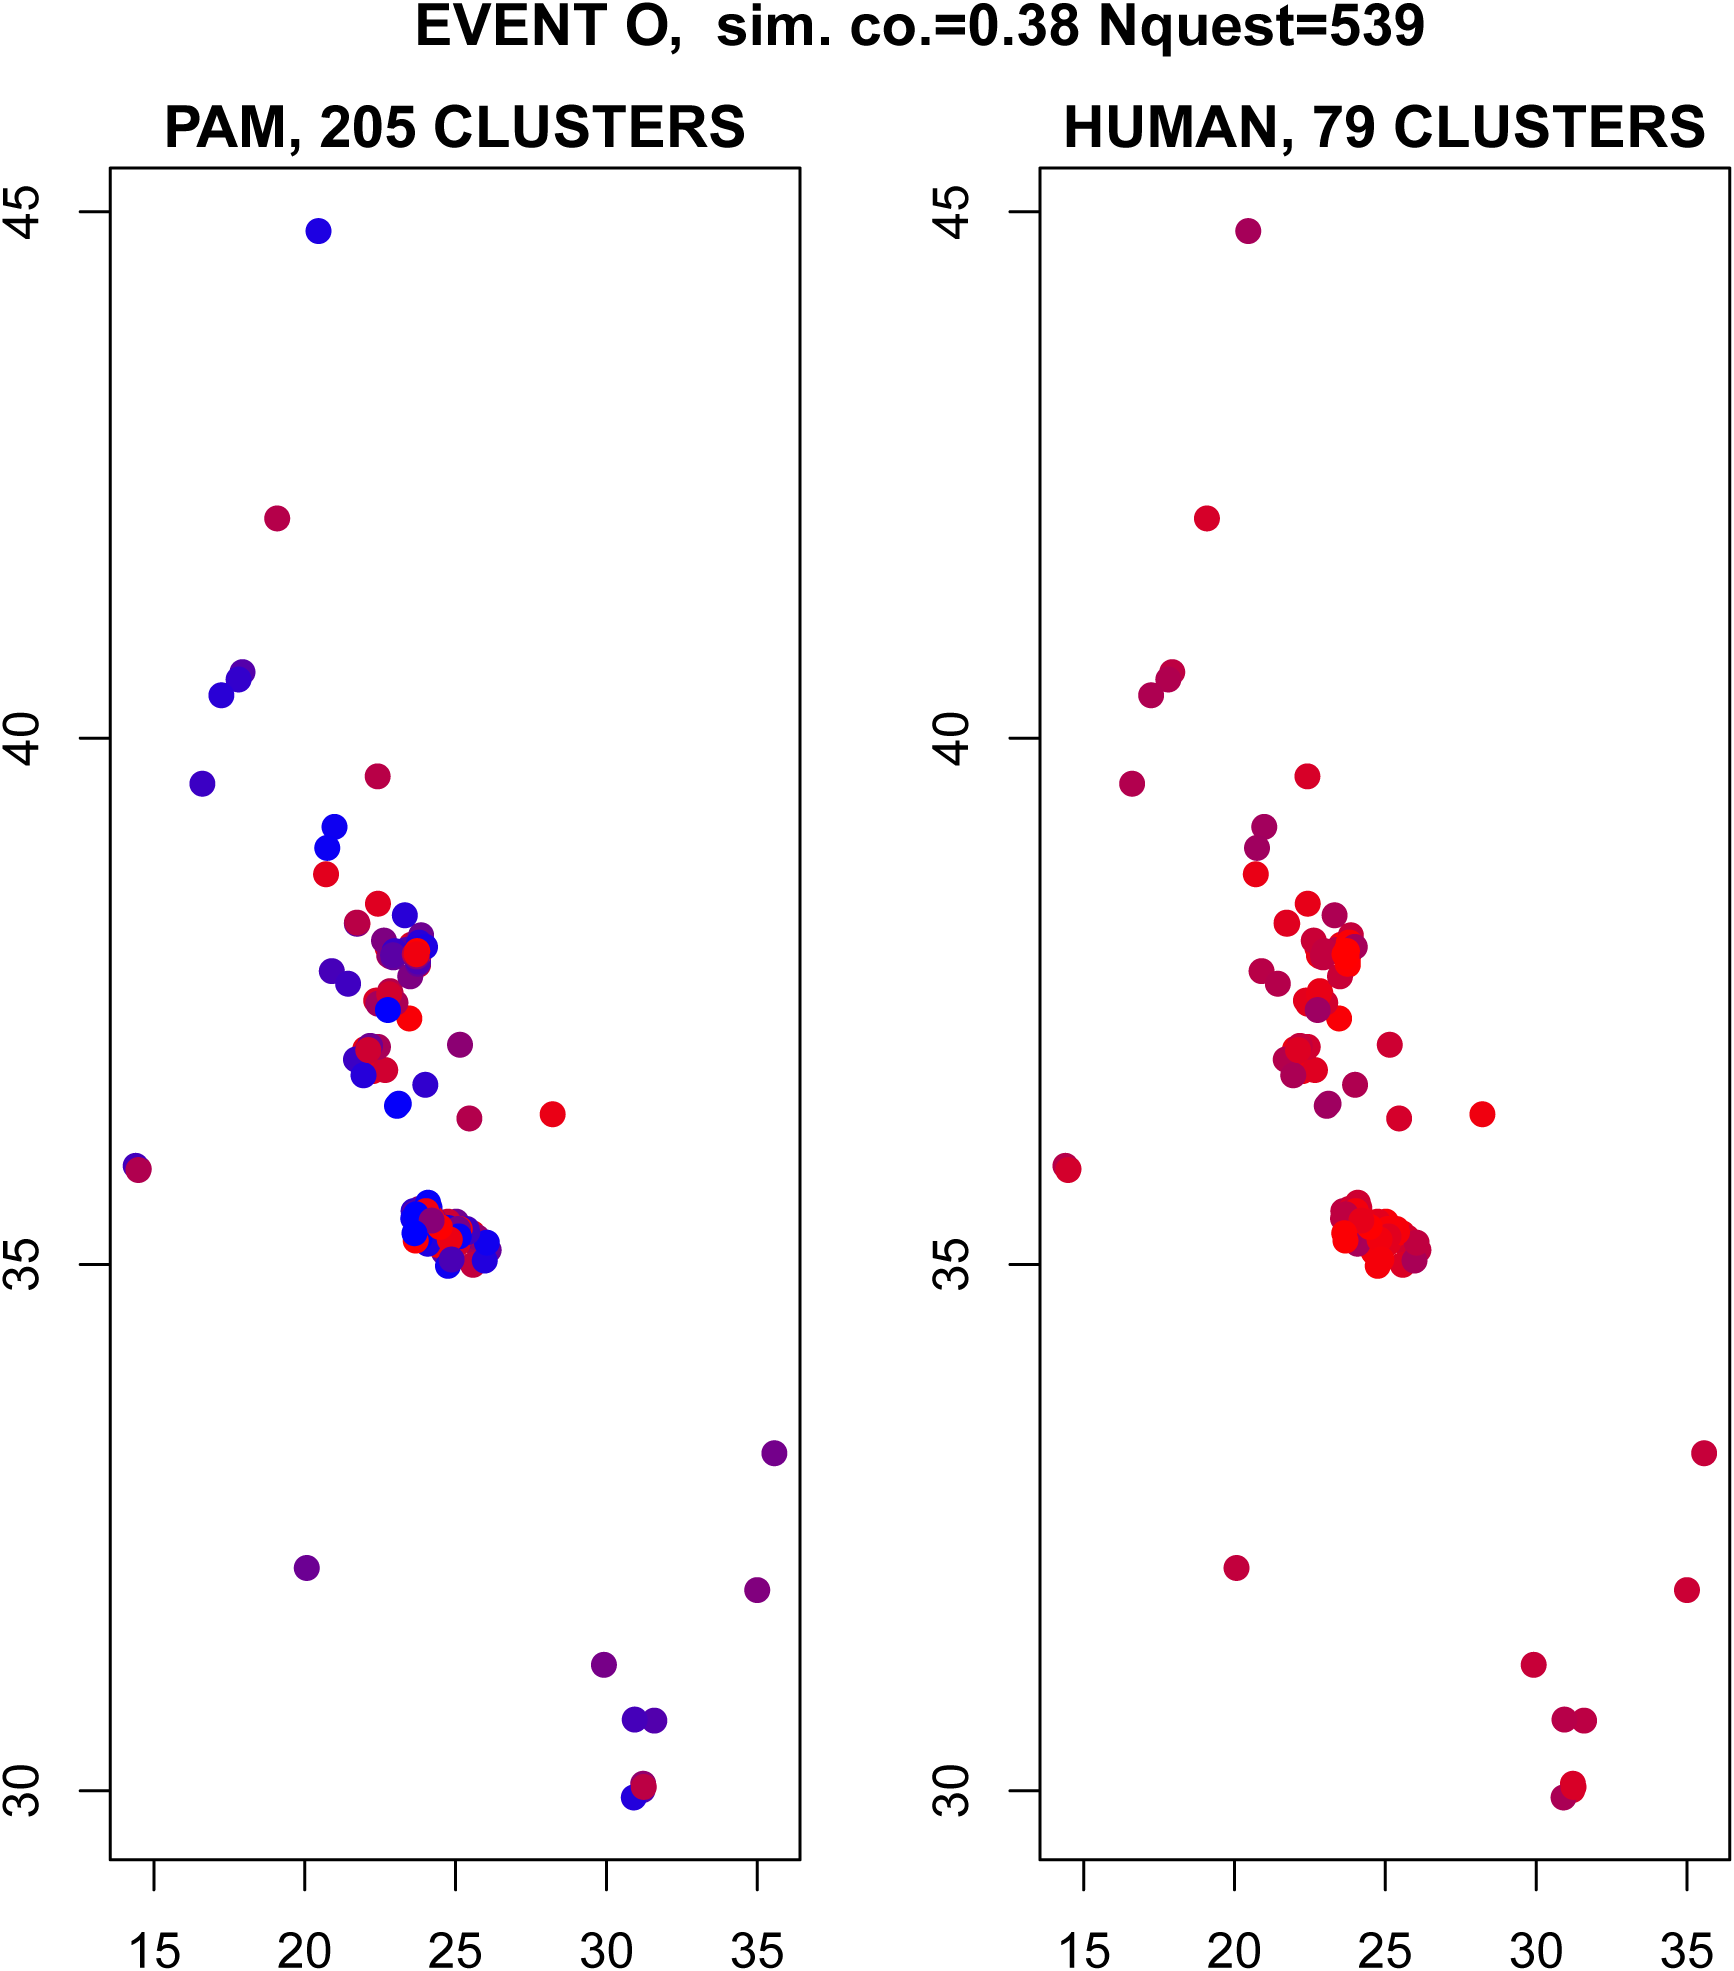
Figure S15. Clustering results for event O. Each green square locates an individual questionnaire (539 questionnaires are available for this event). The blue star is the instrumental epicenter.
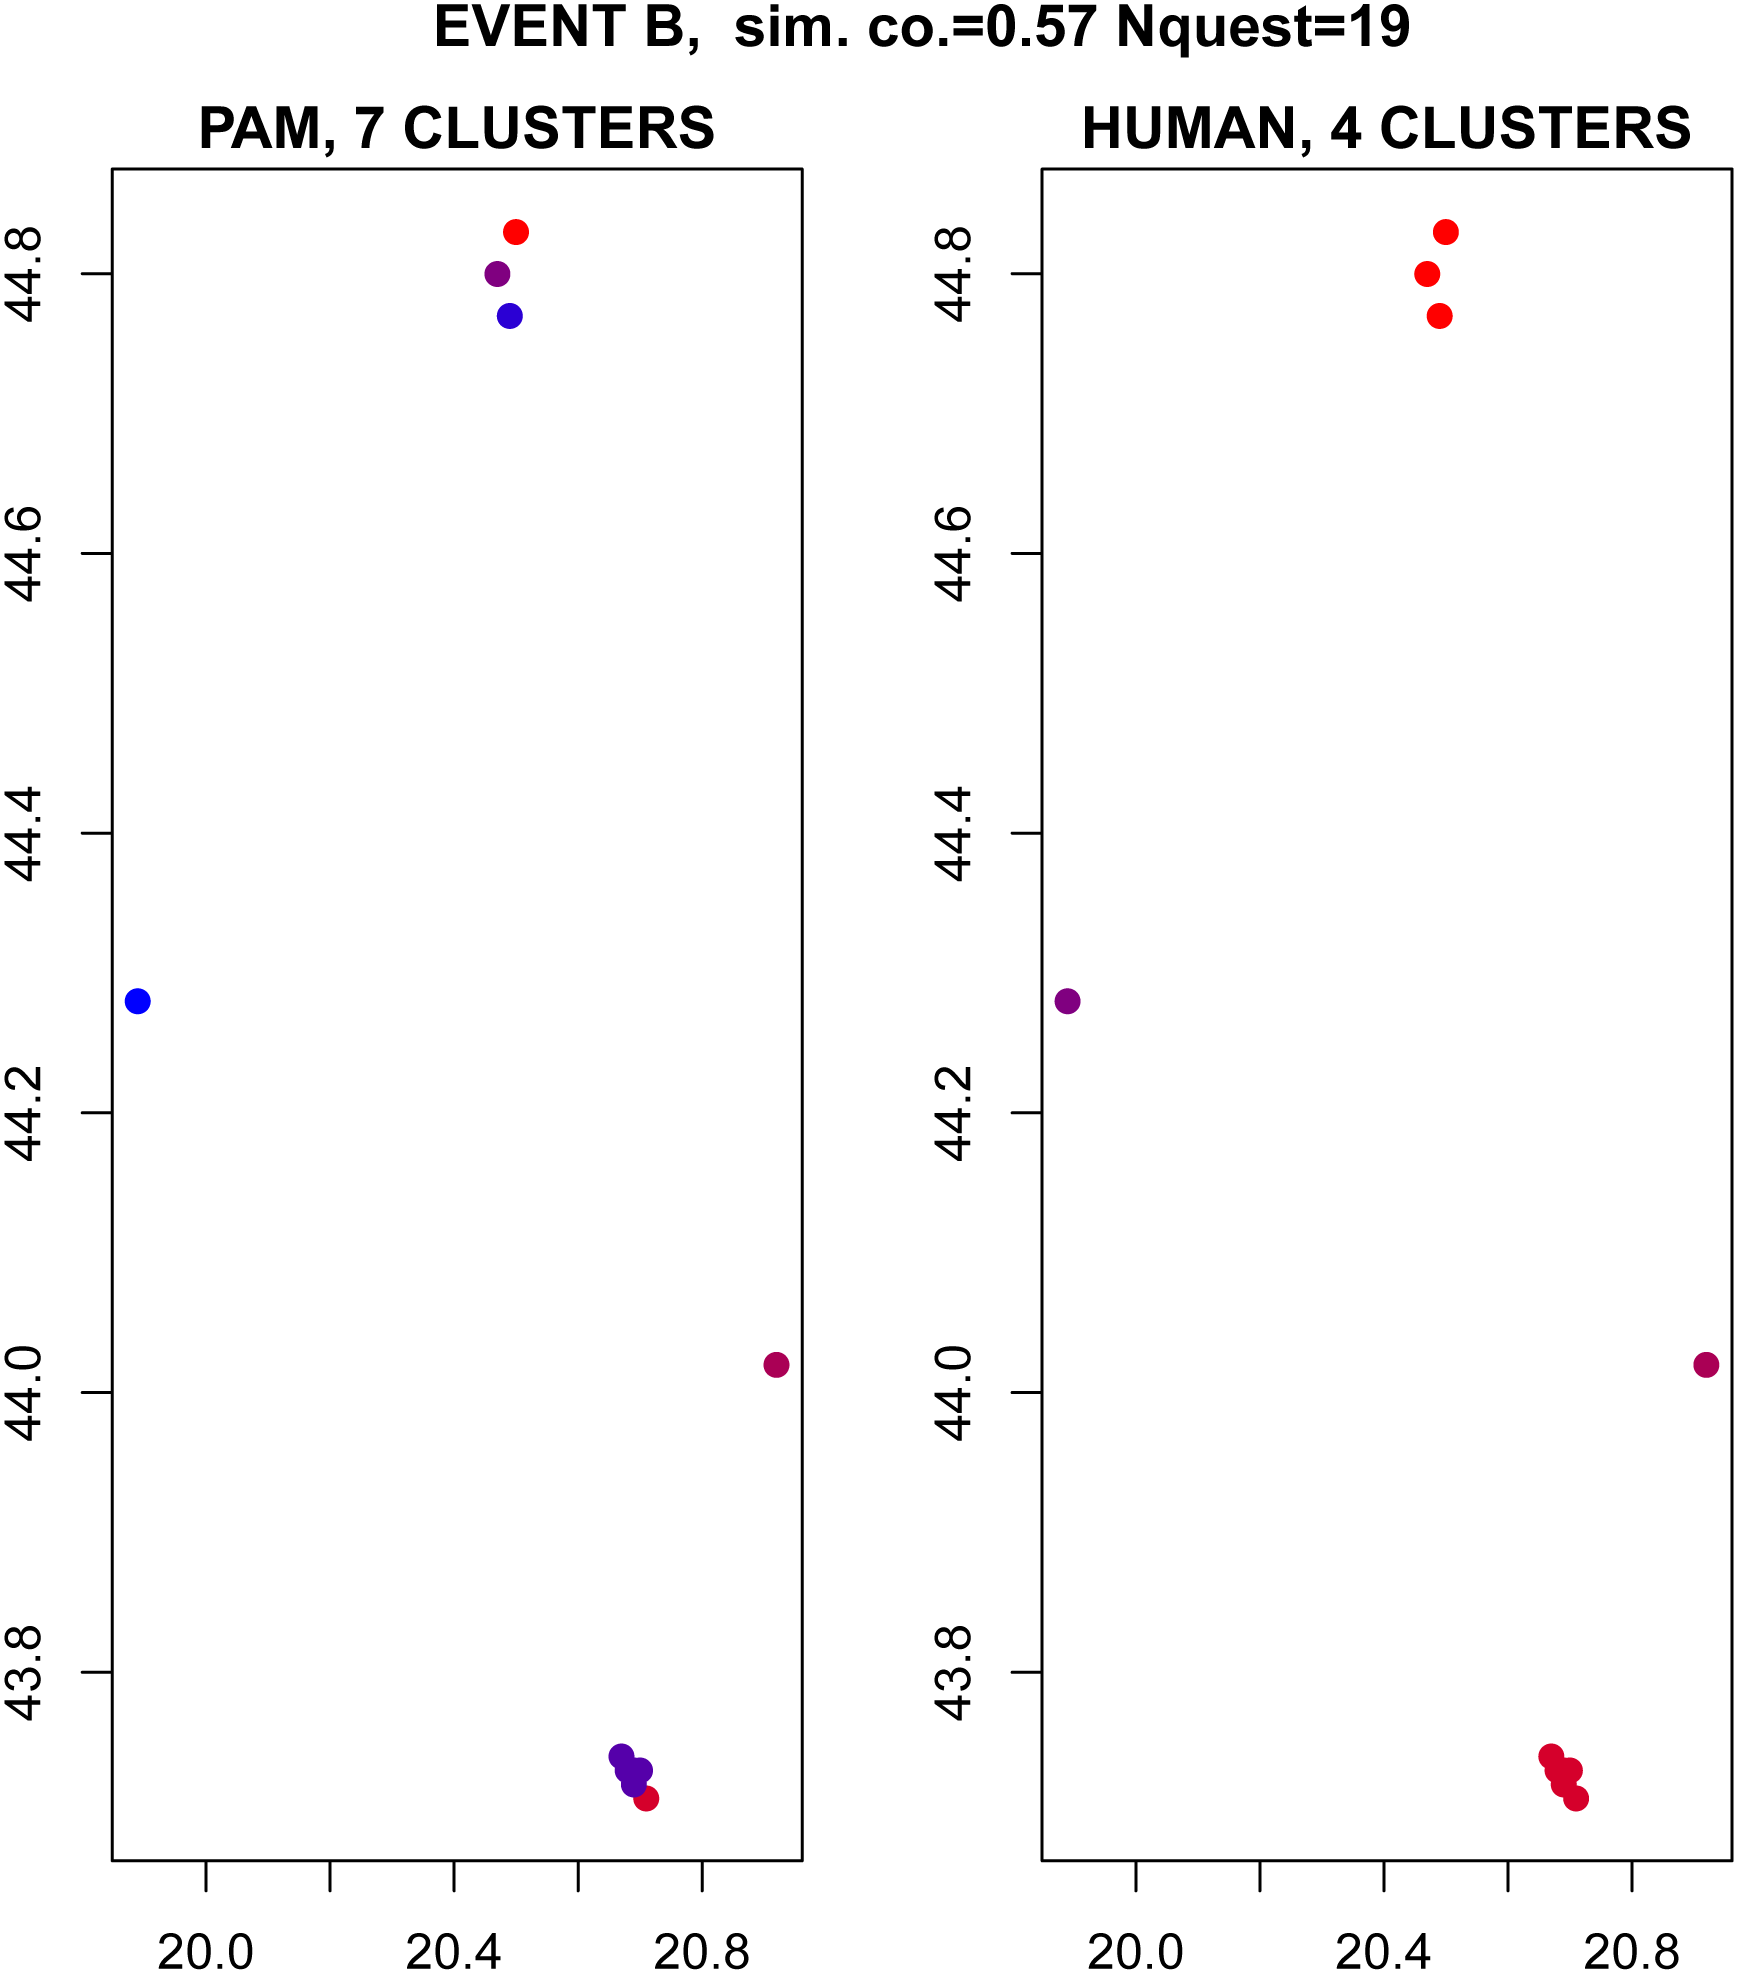
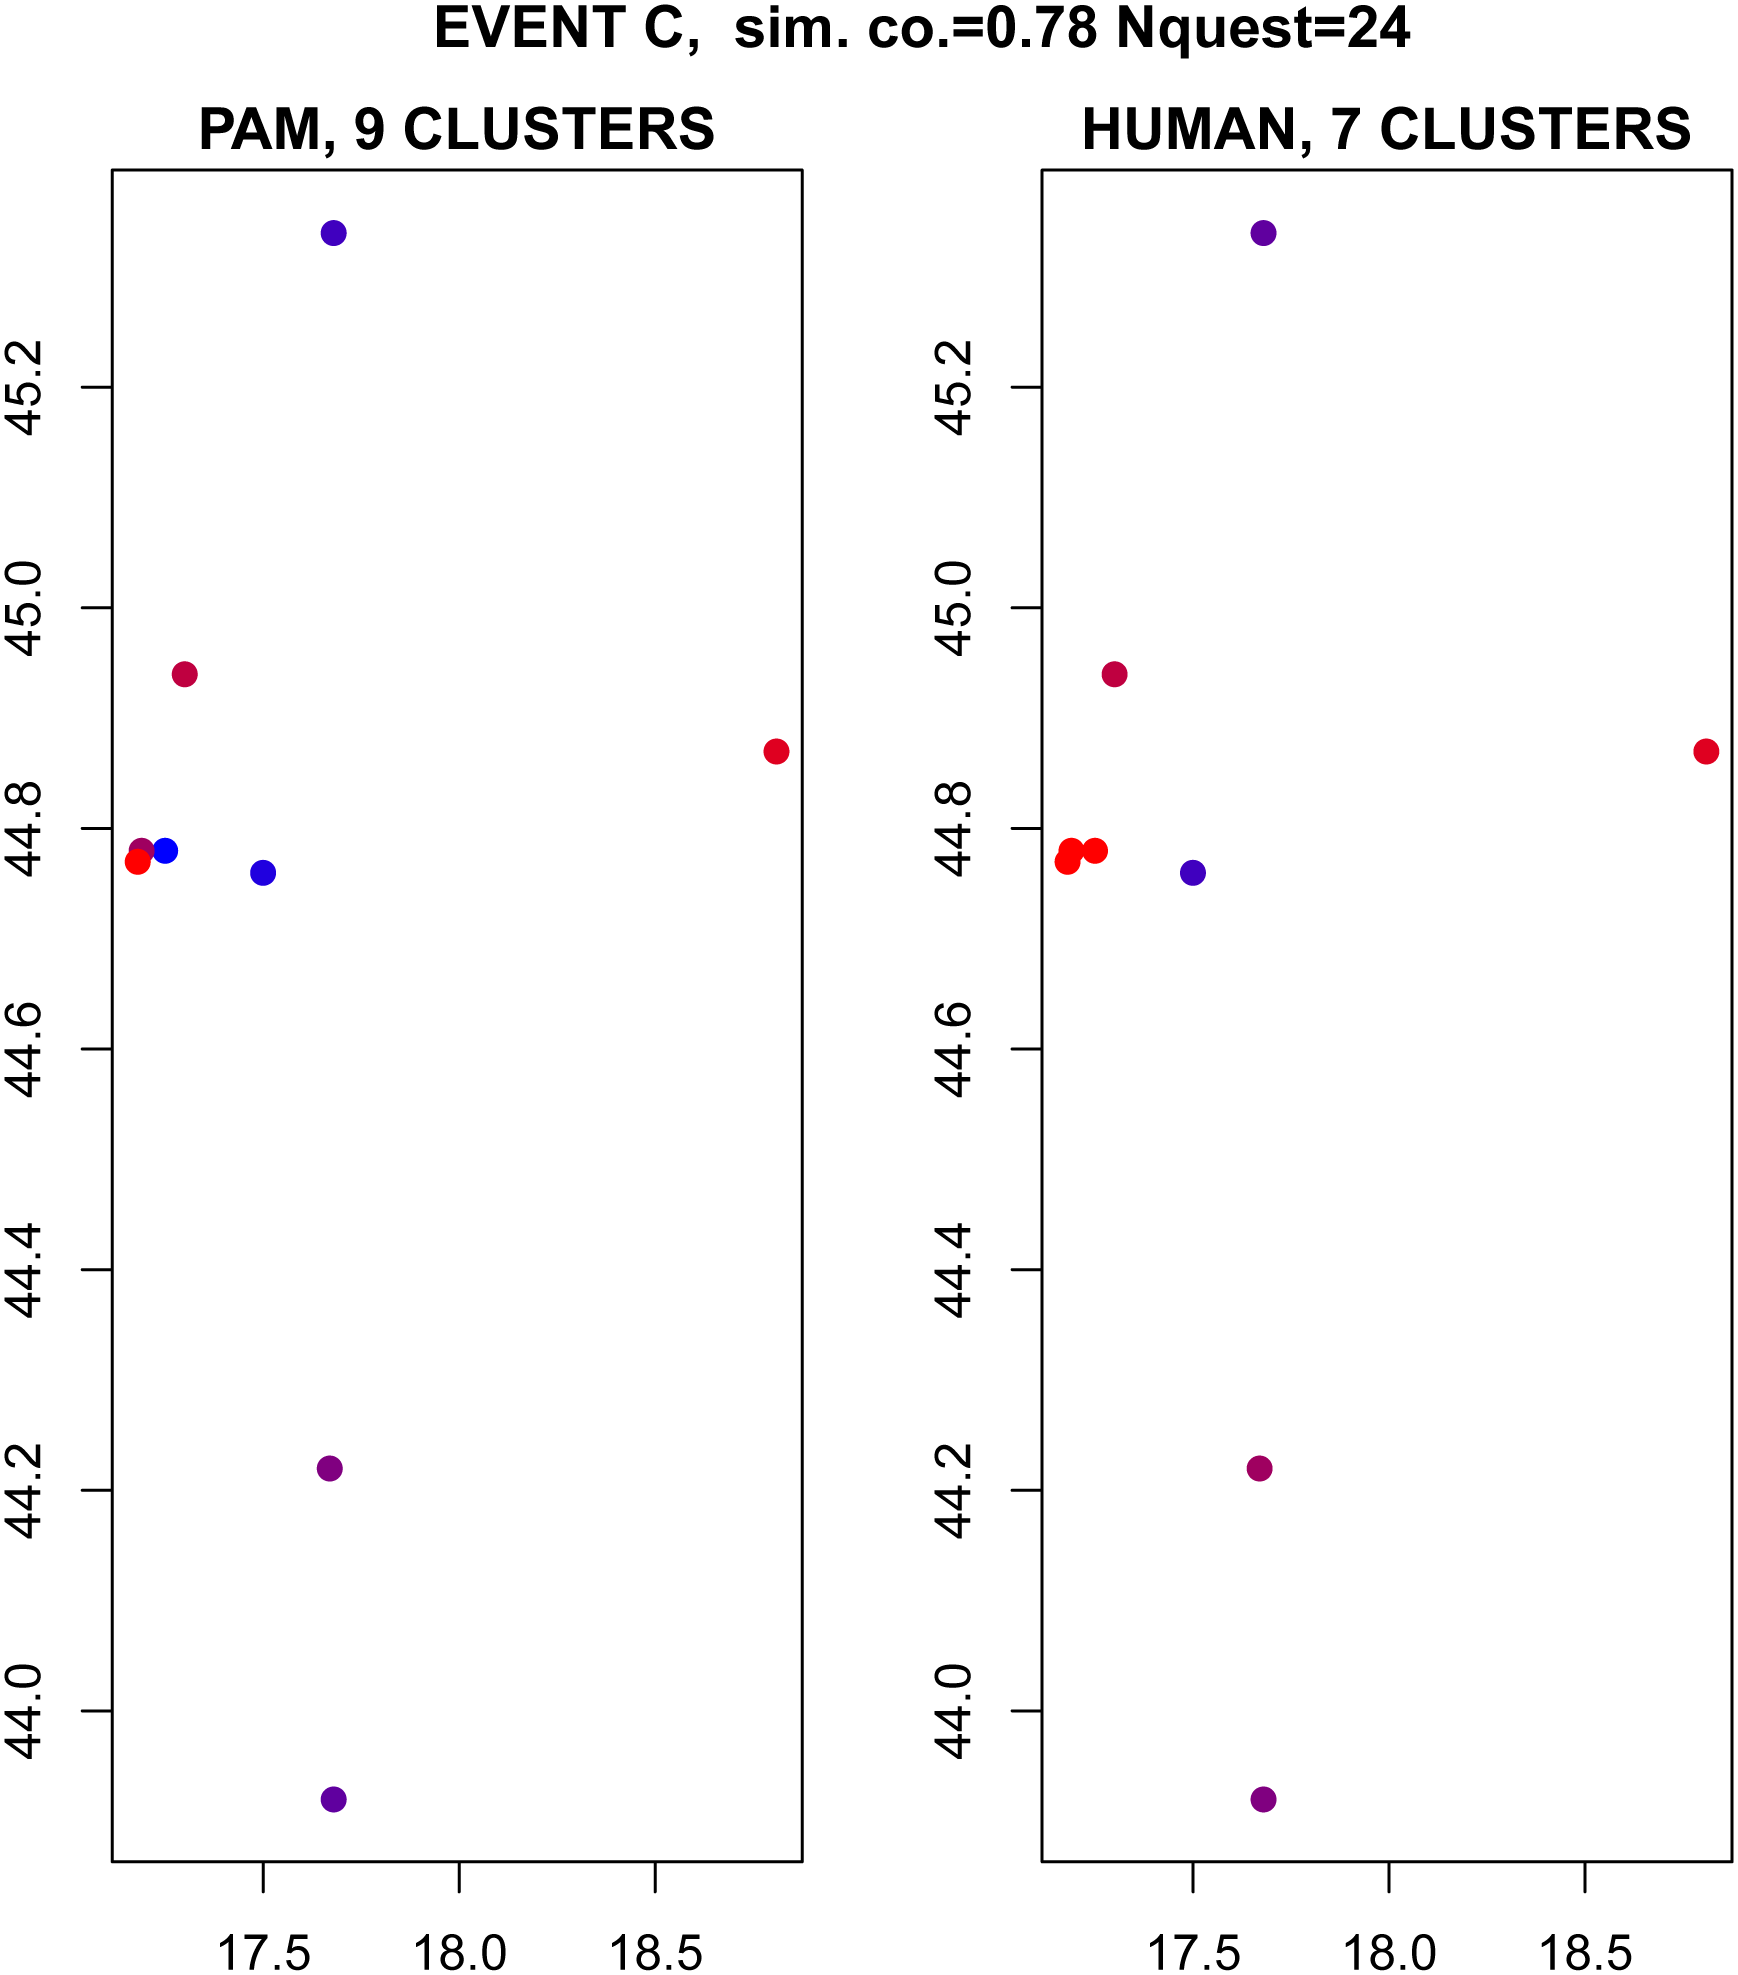
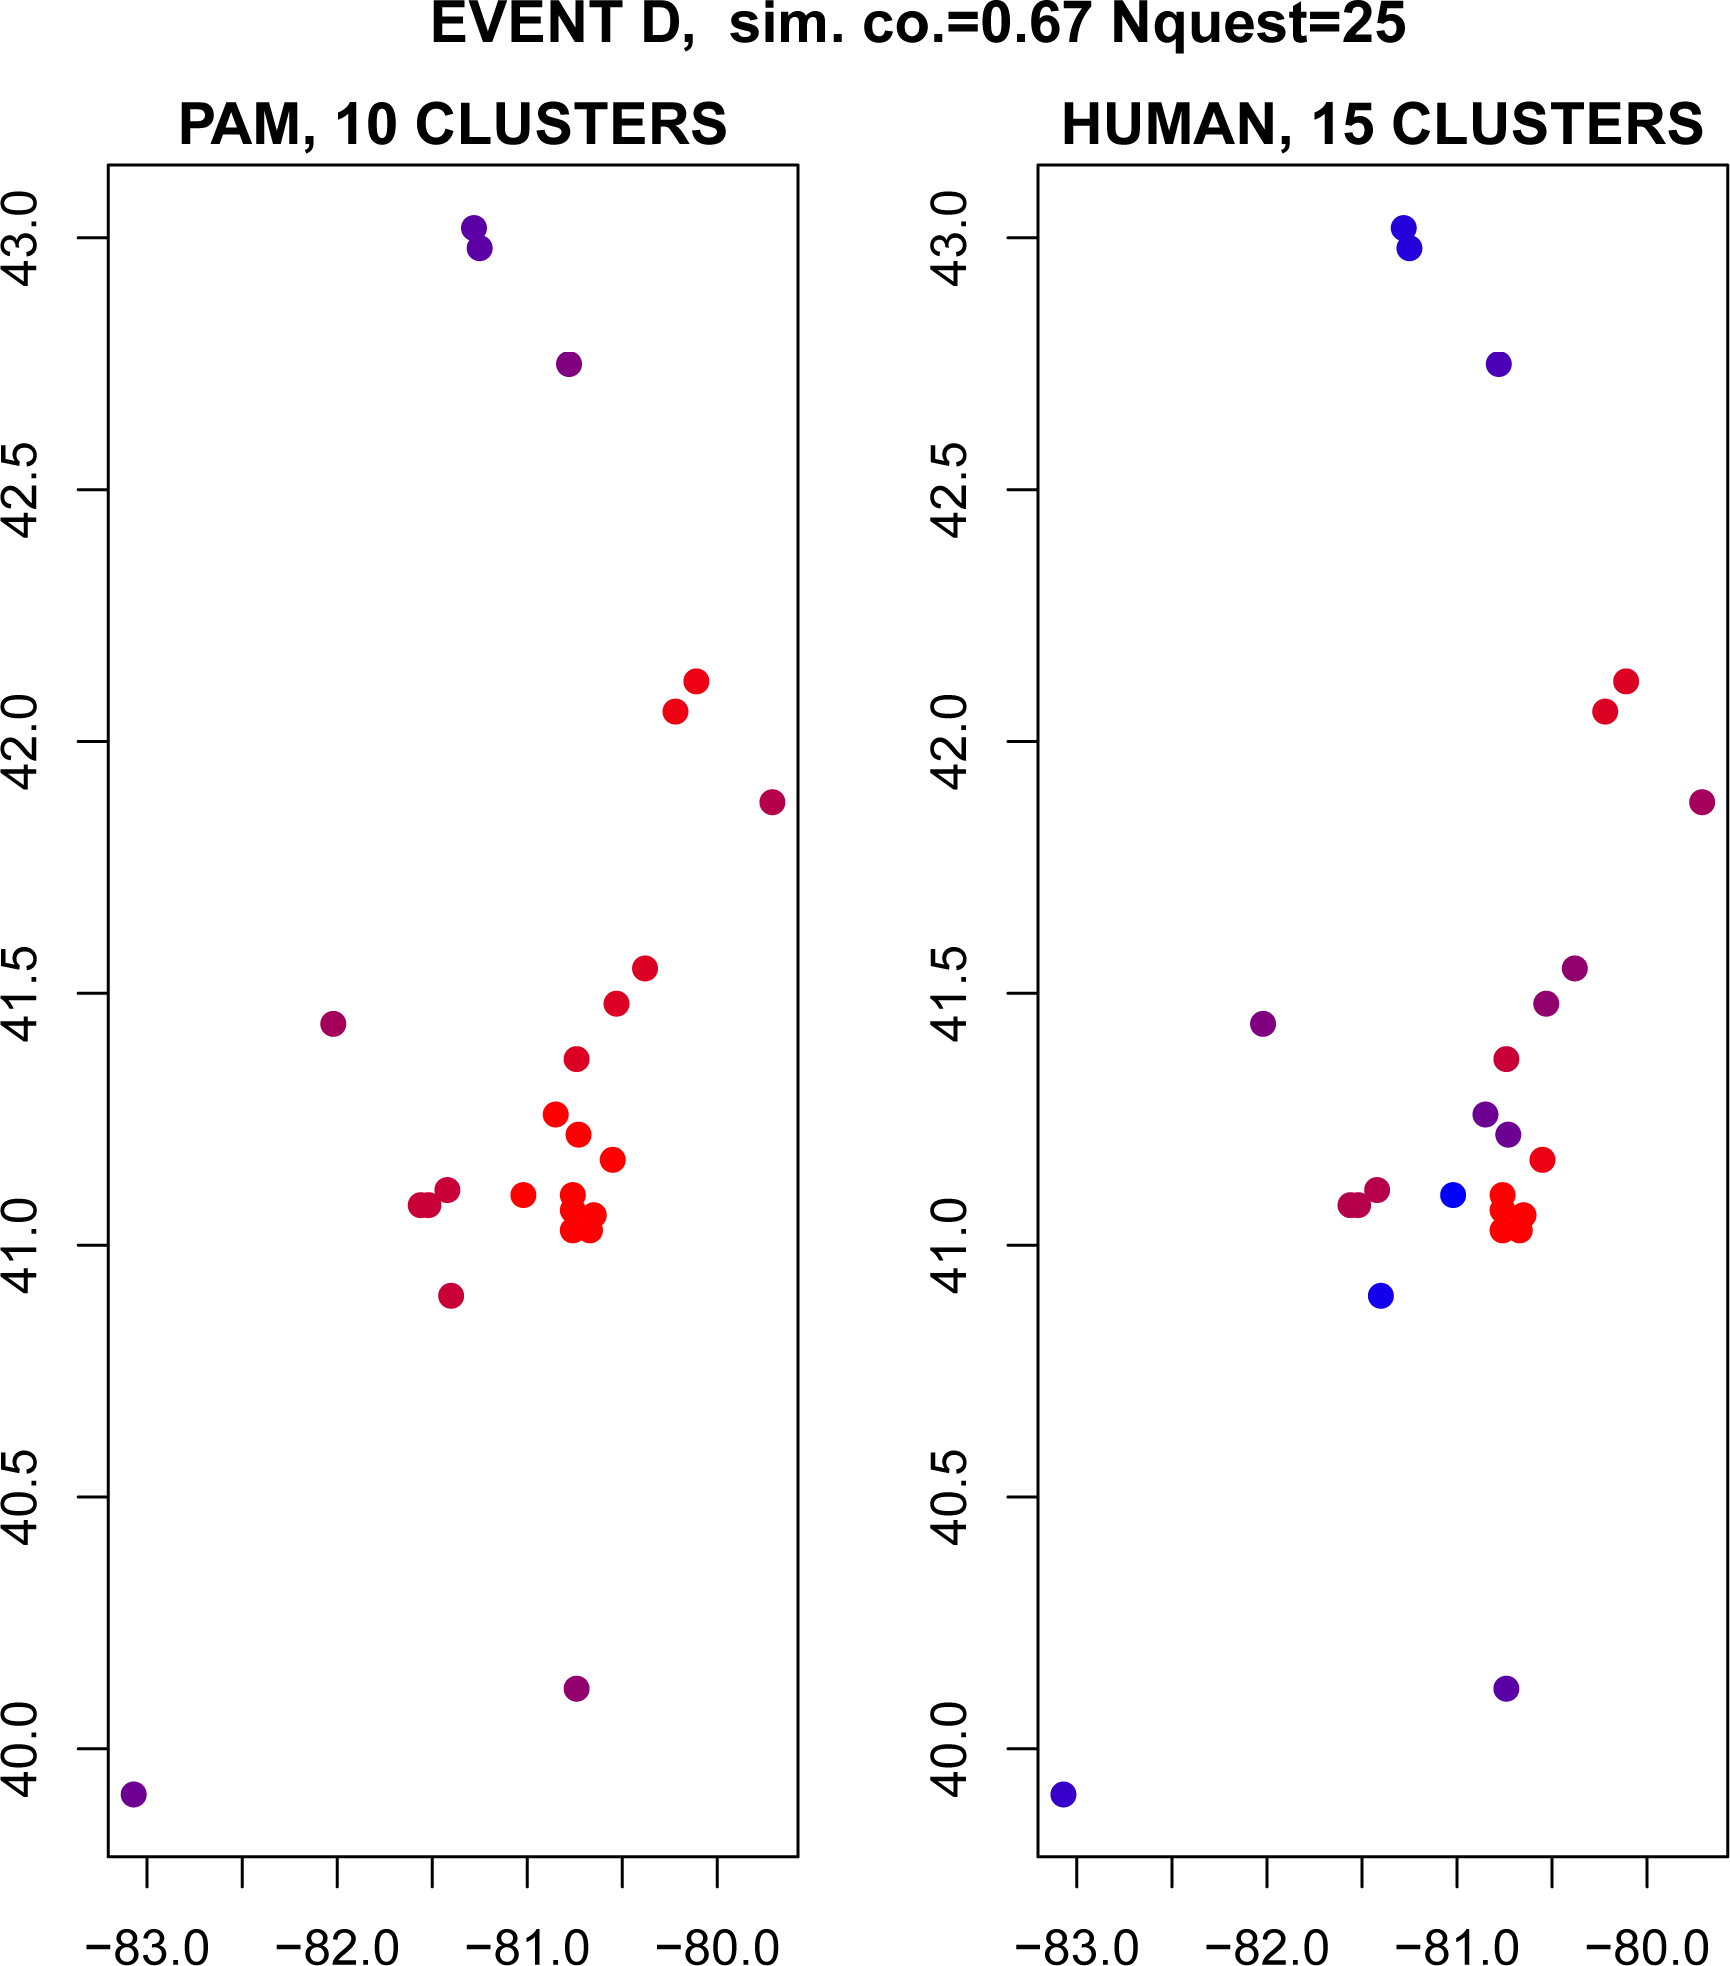
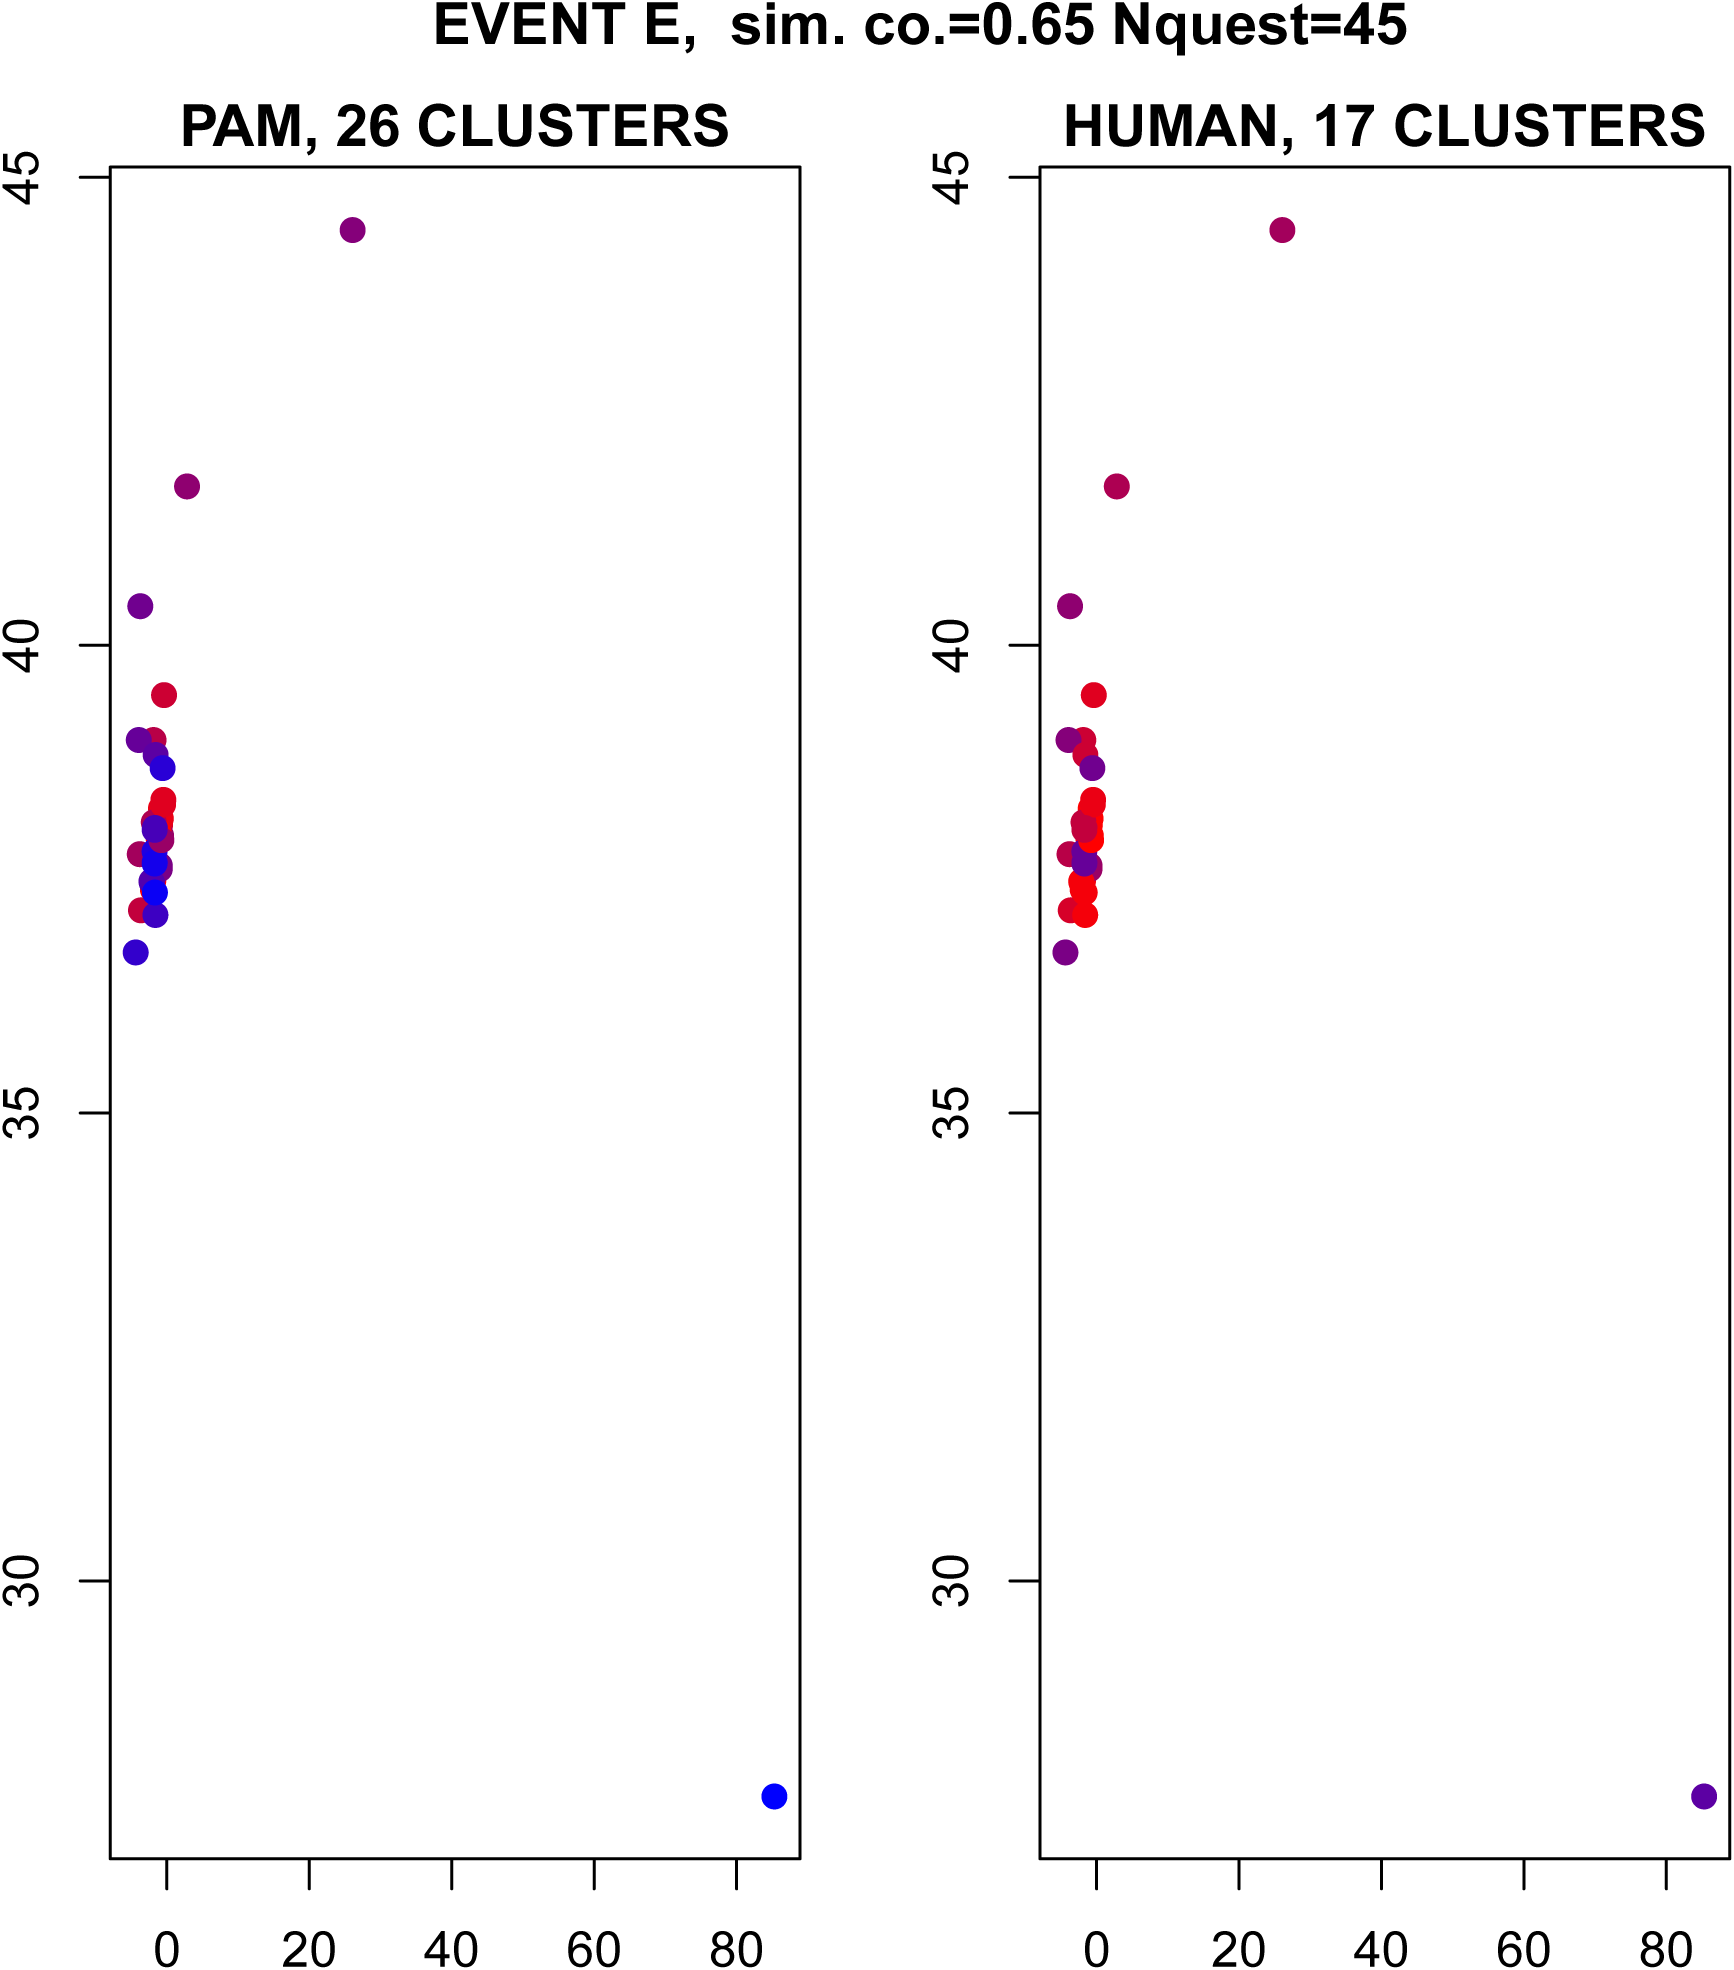
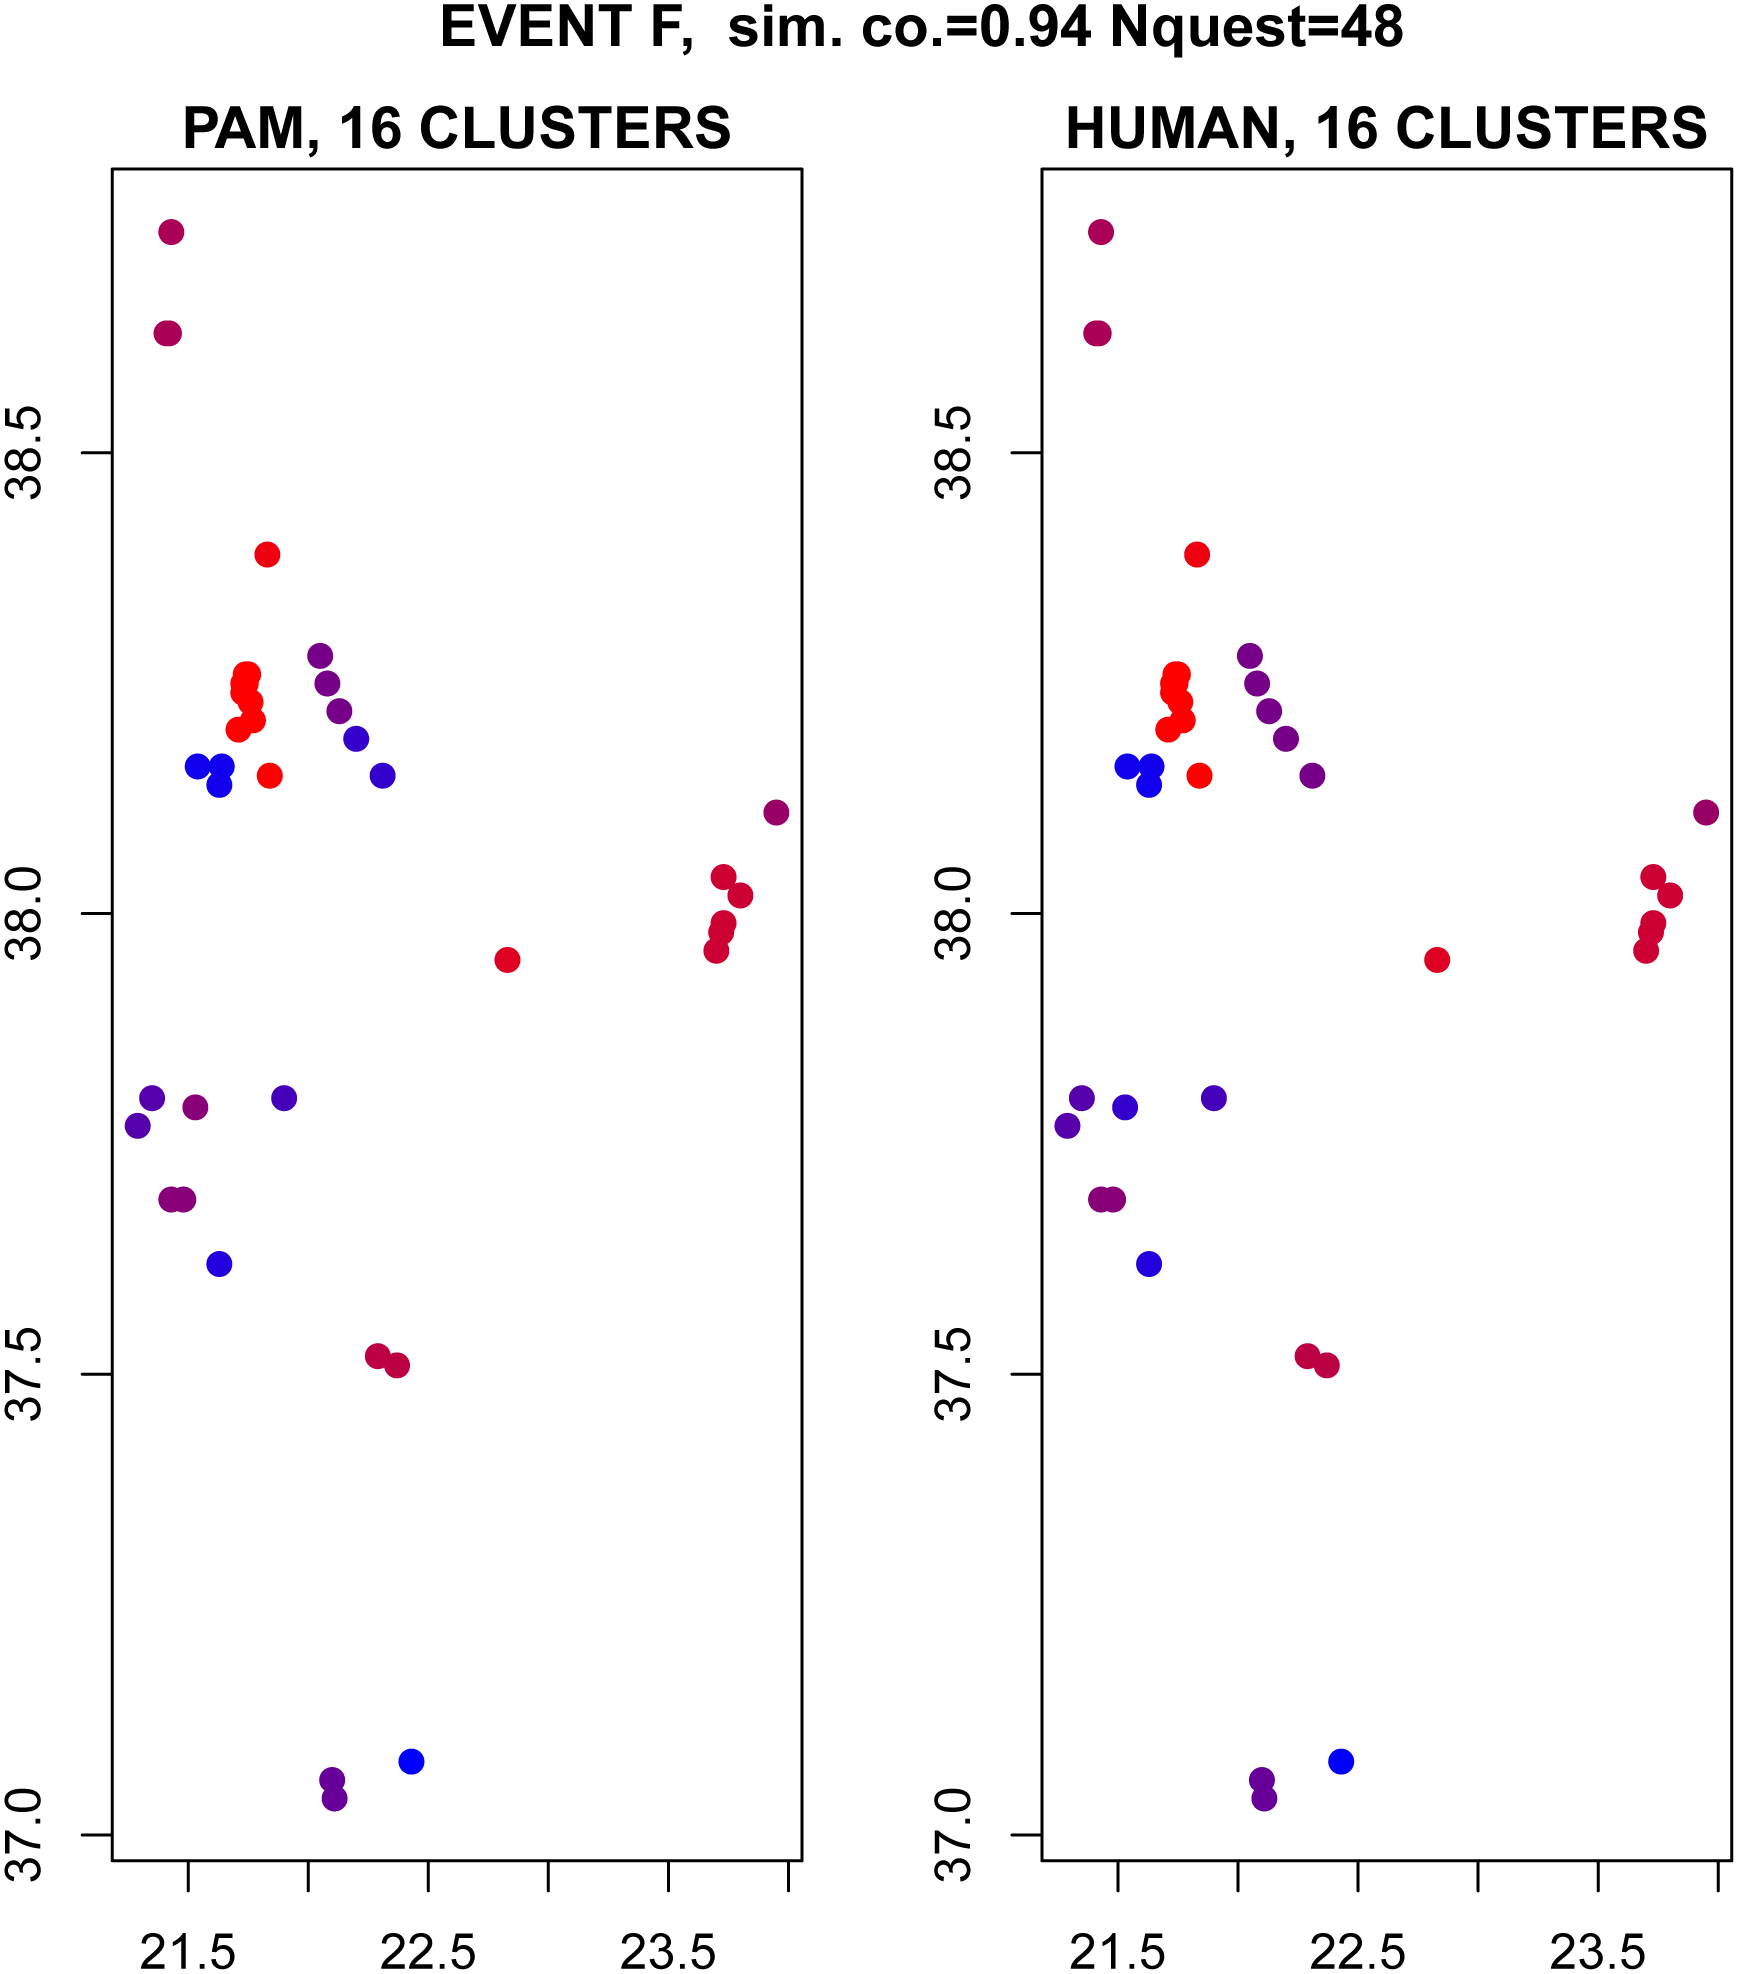
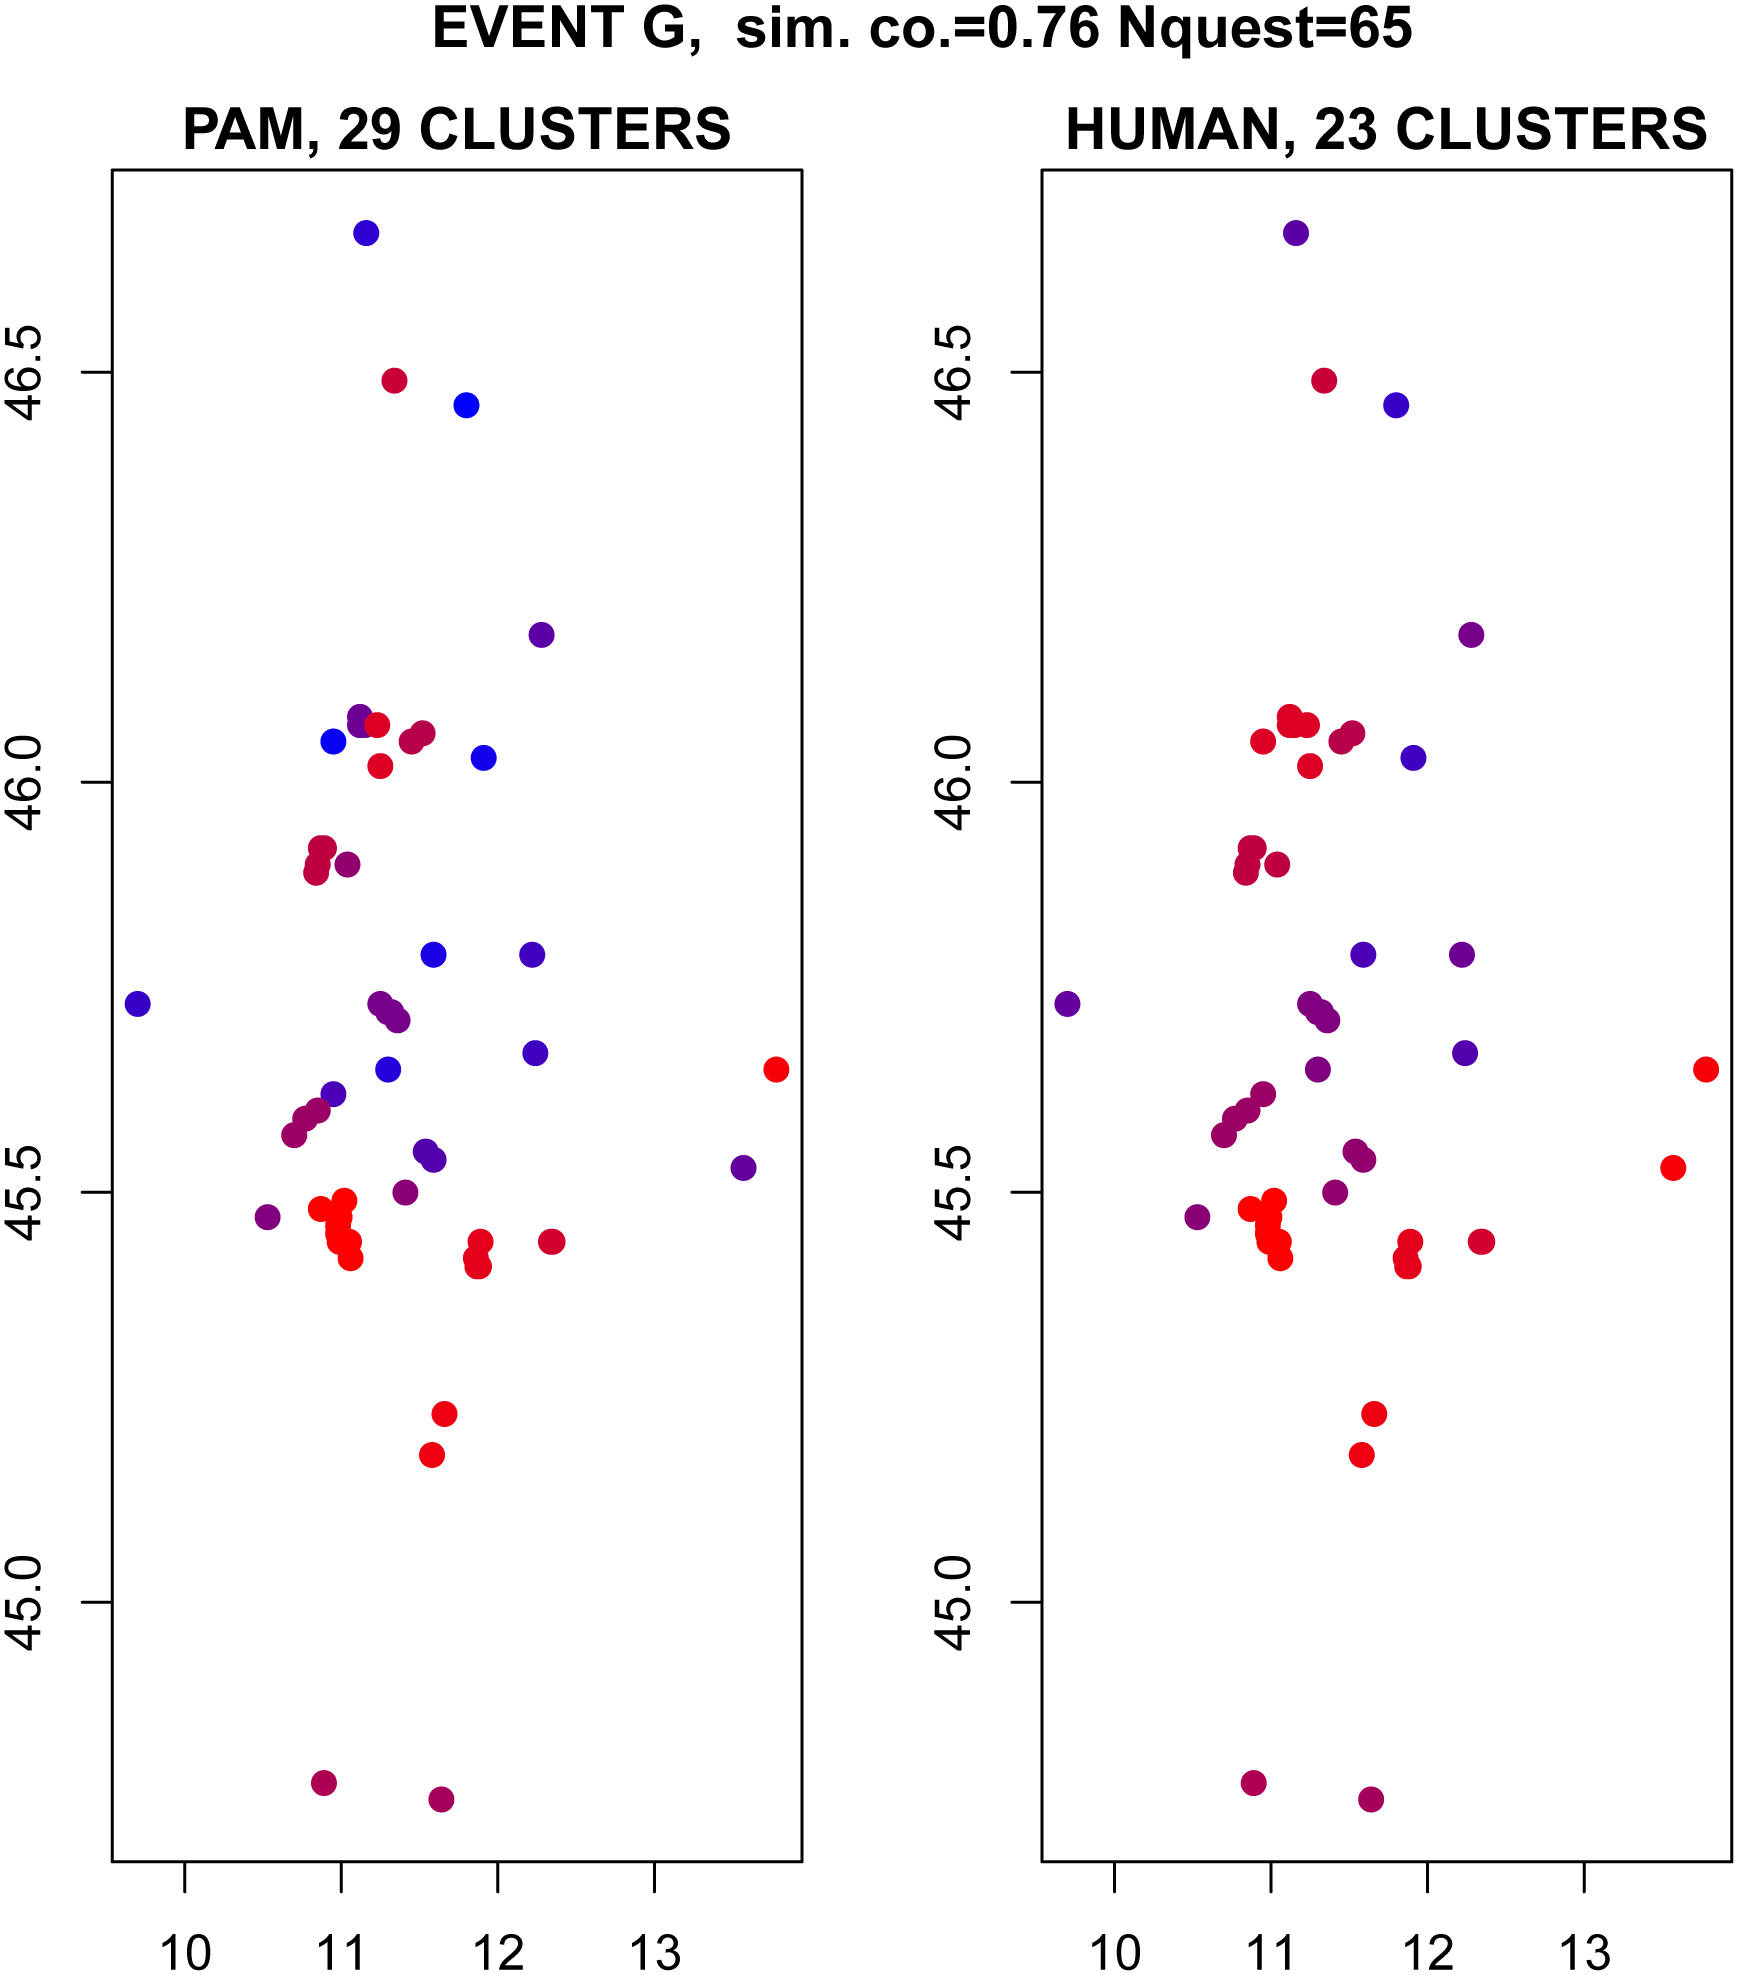
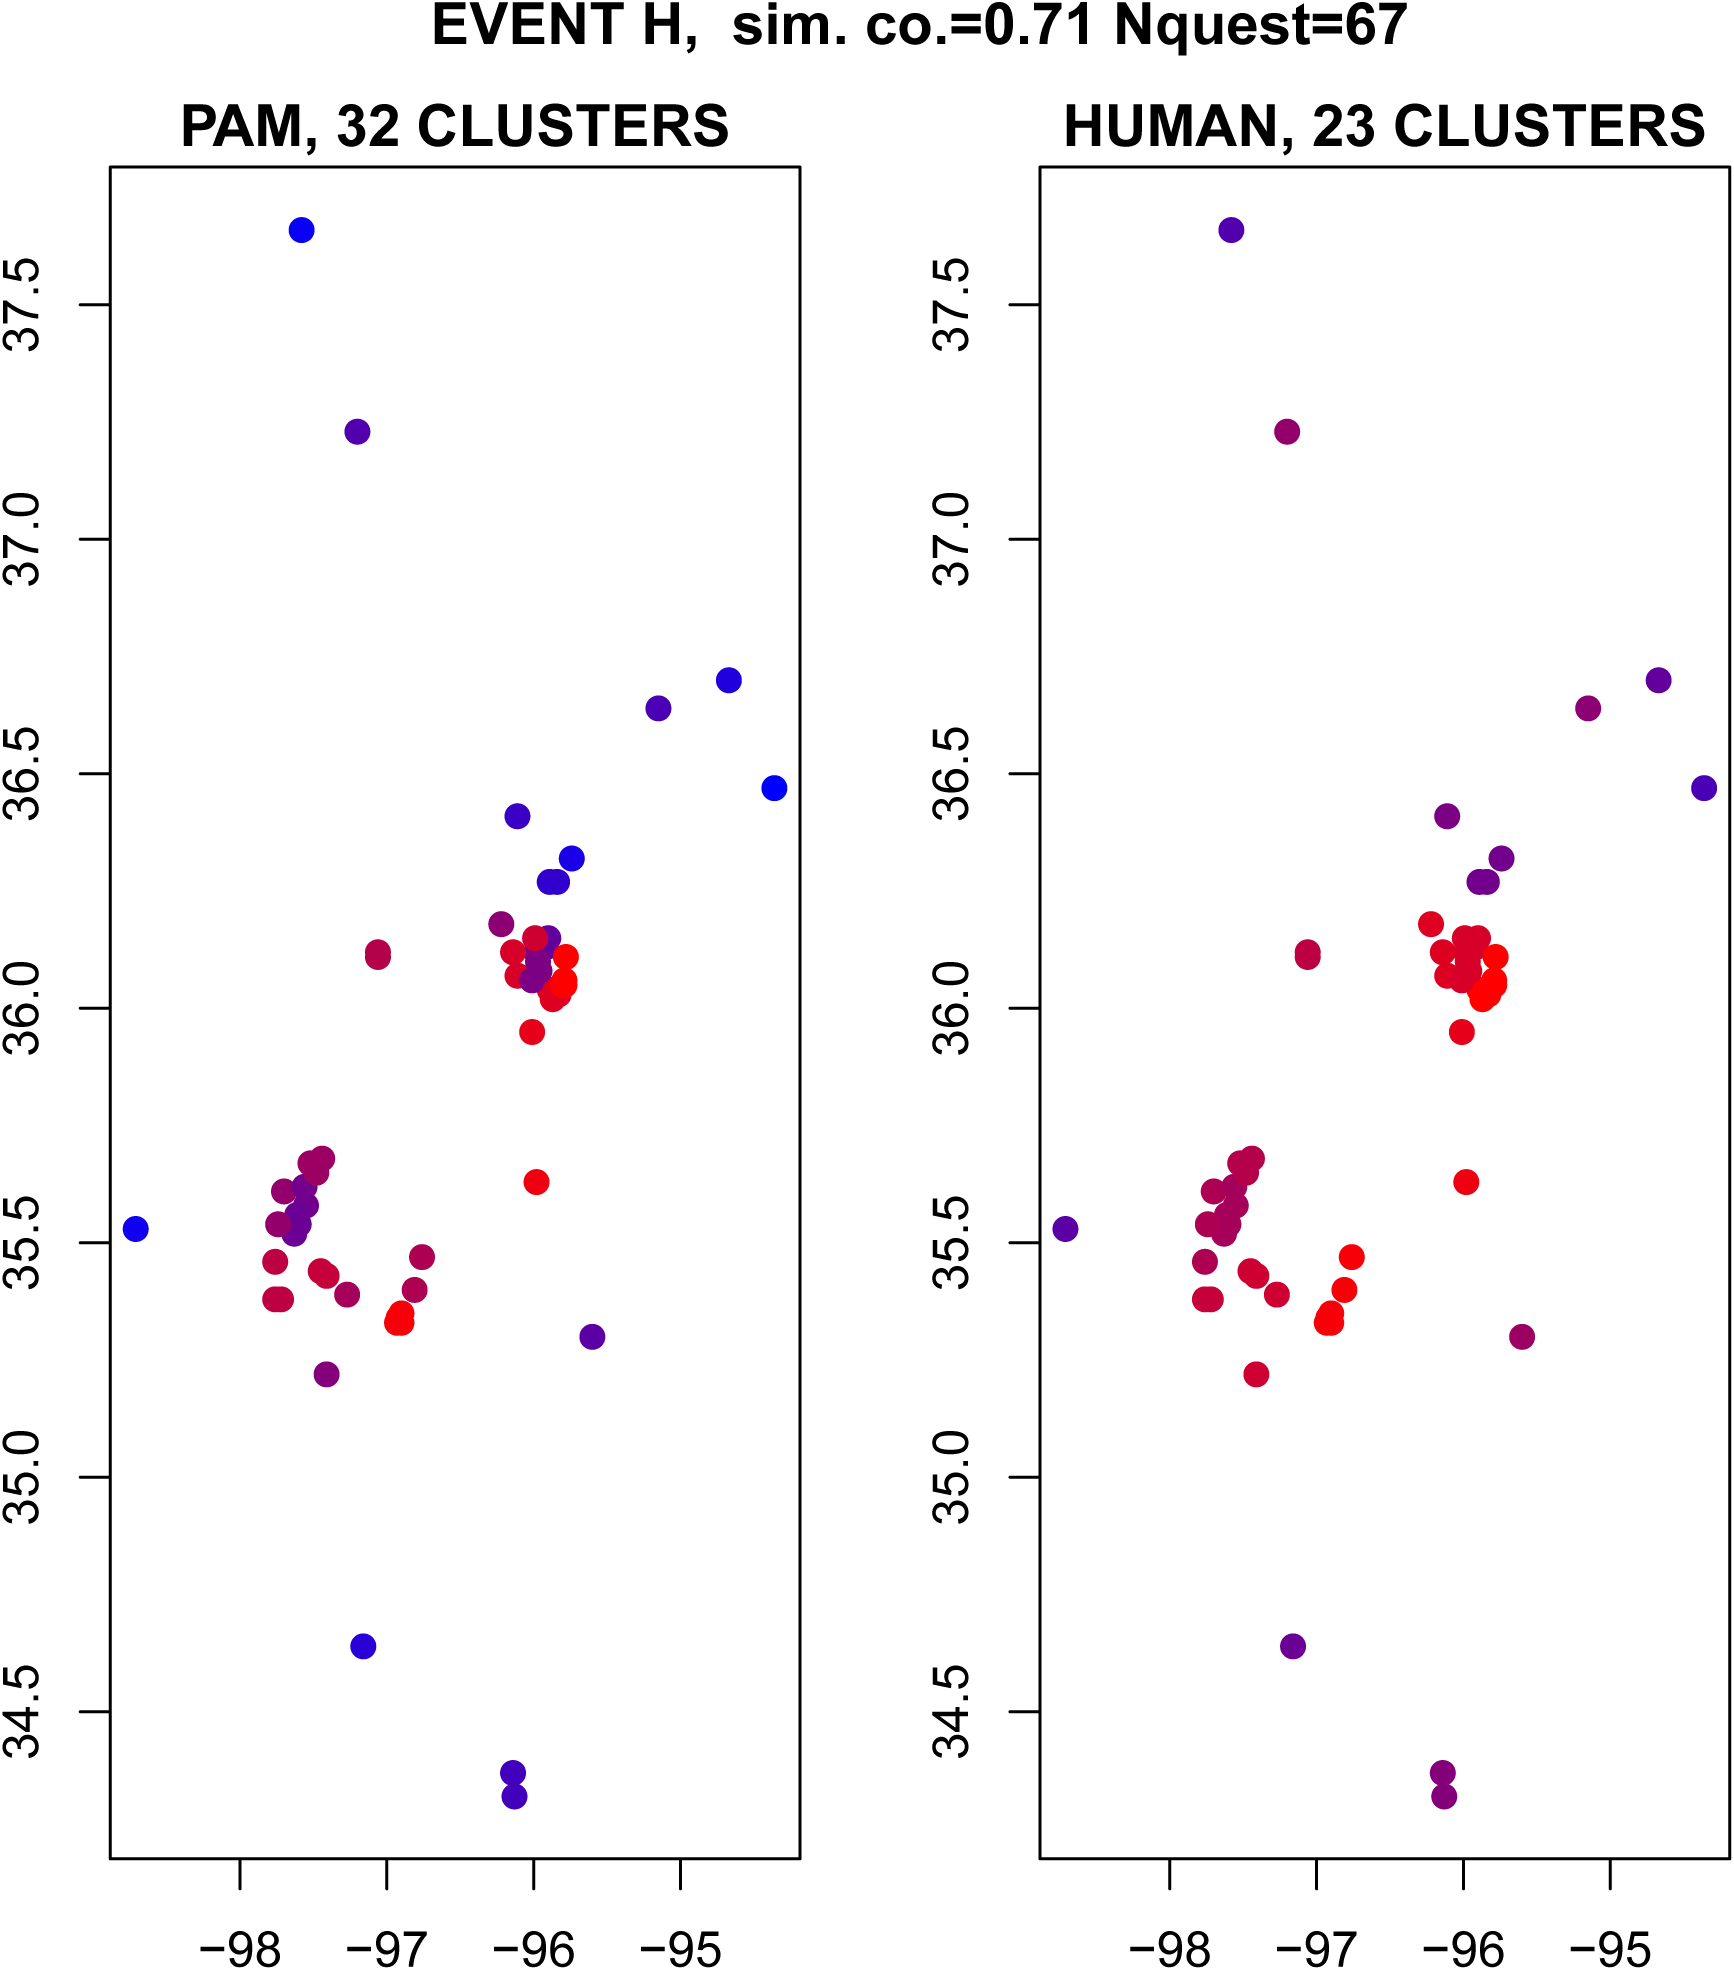
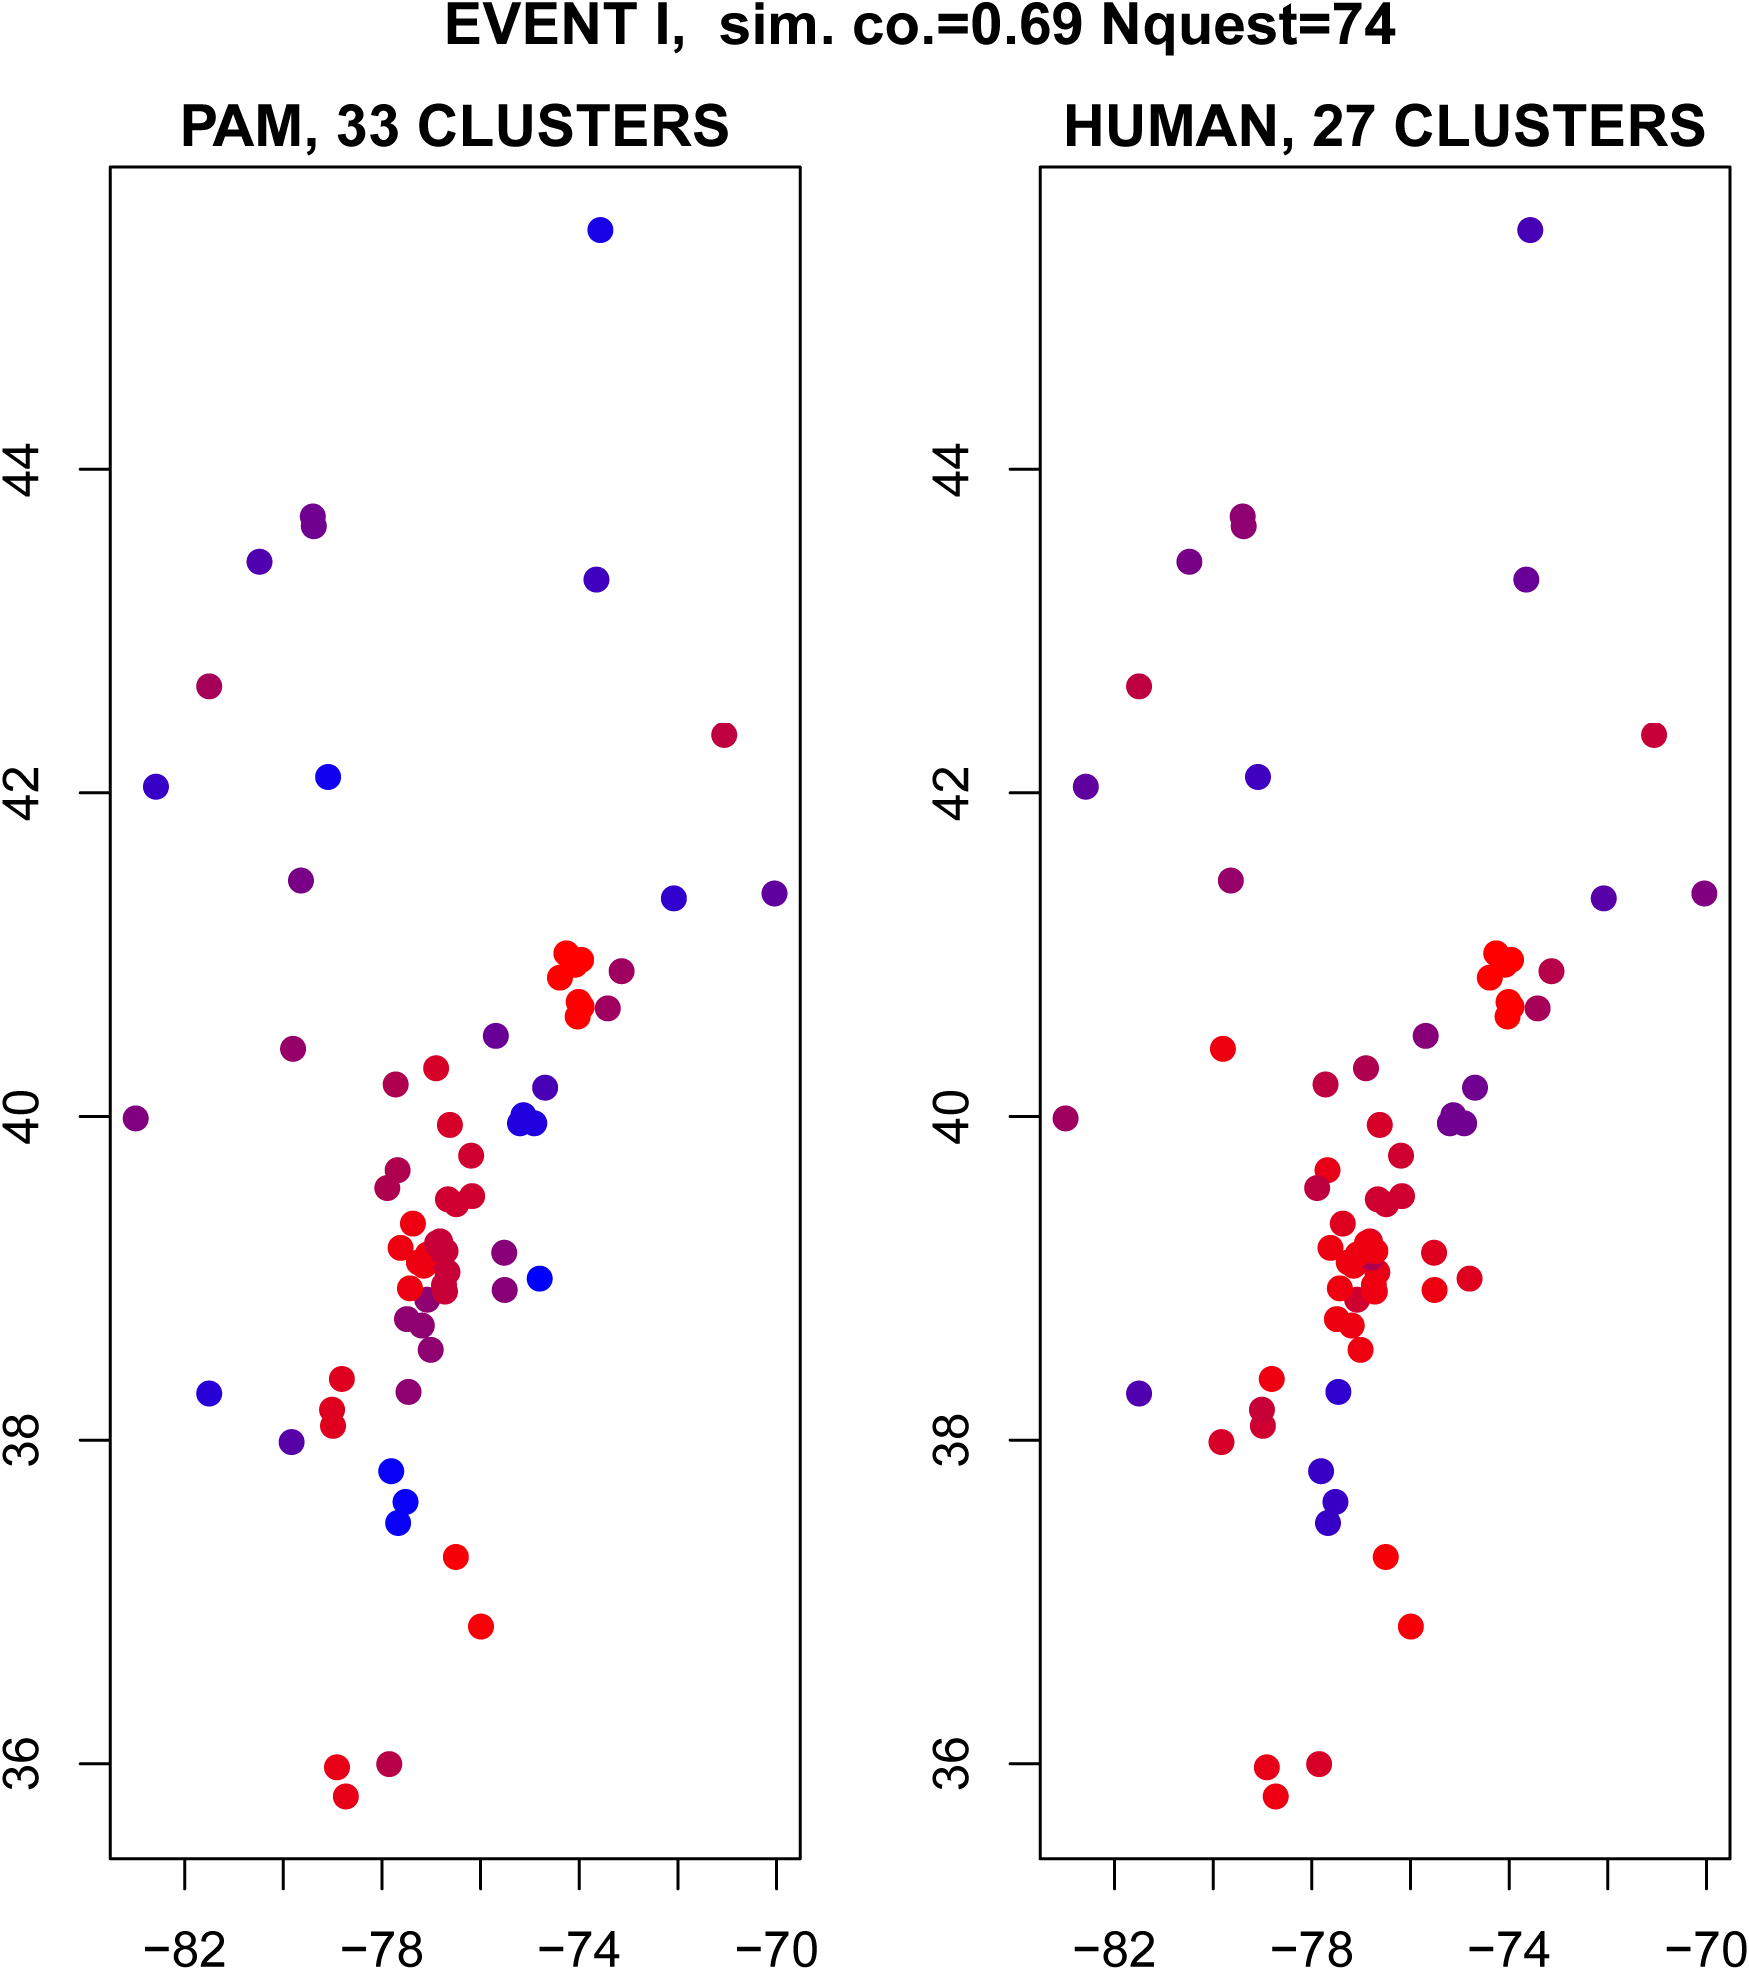
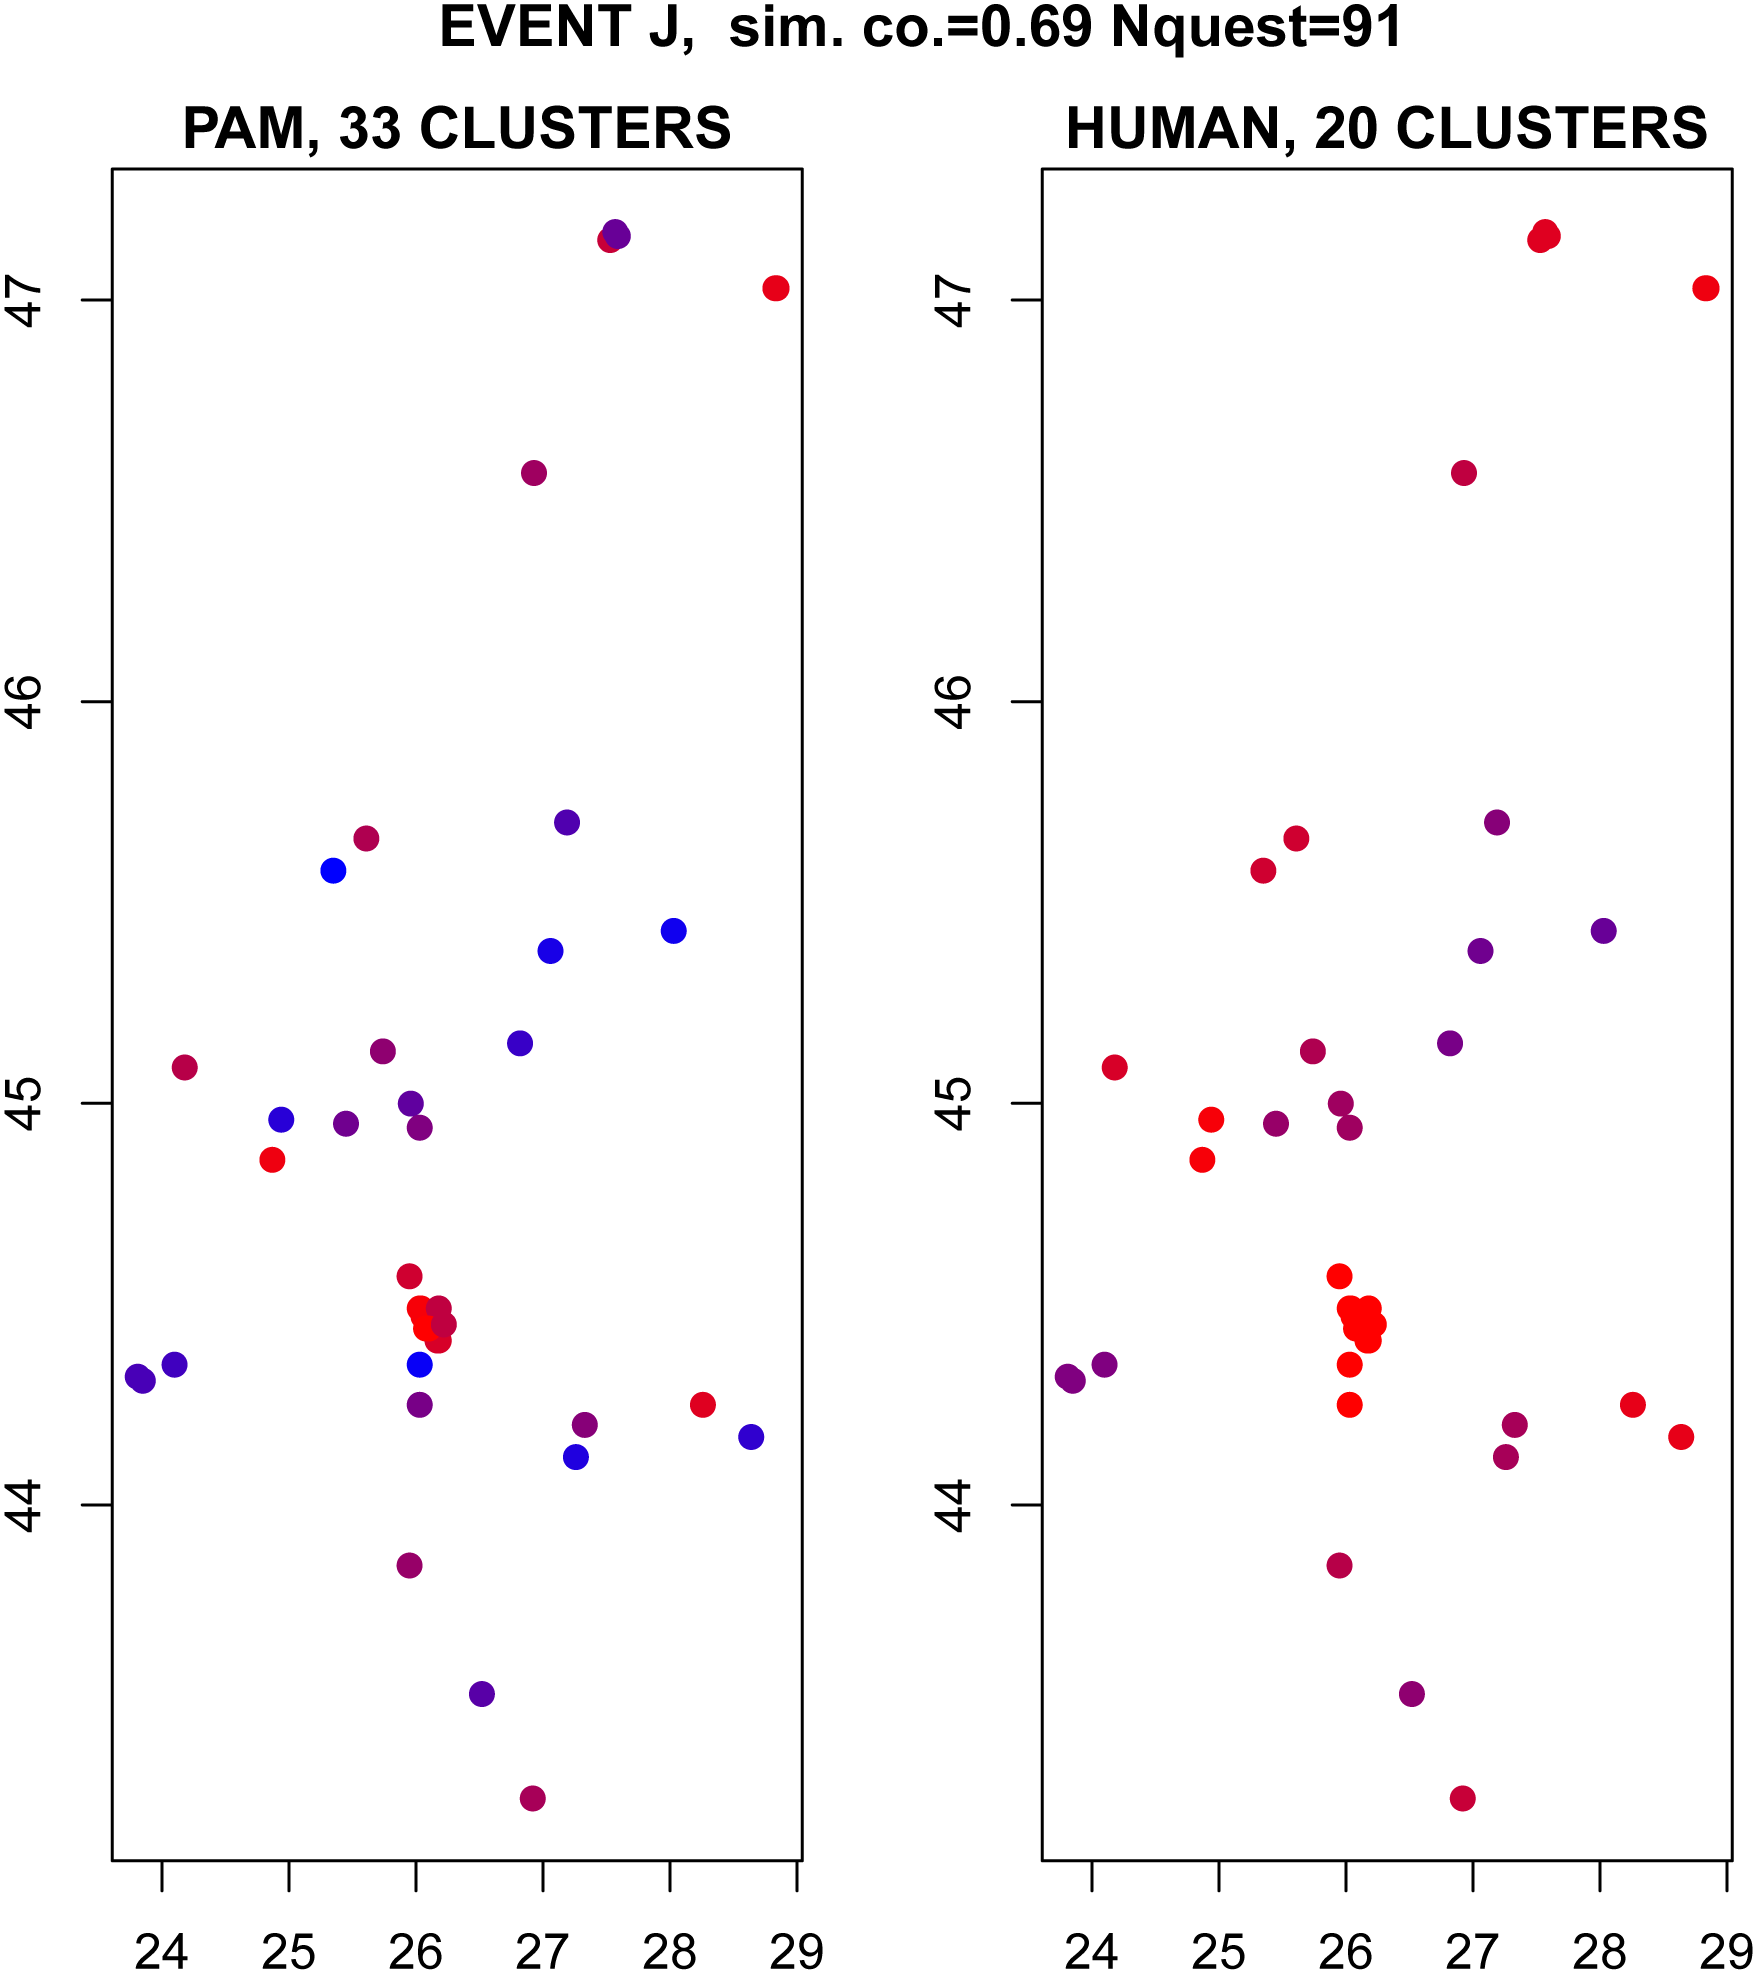
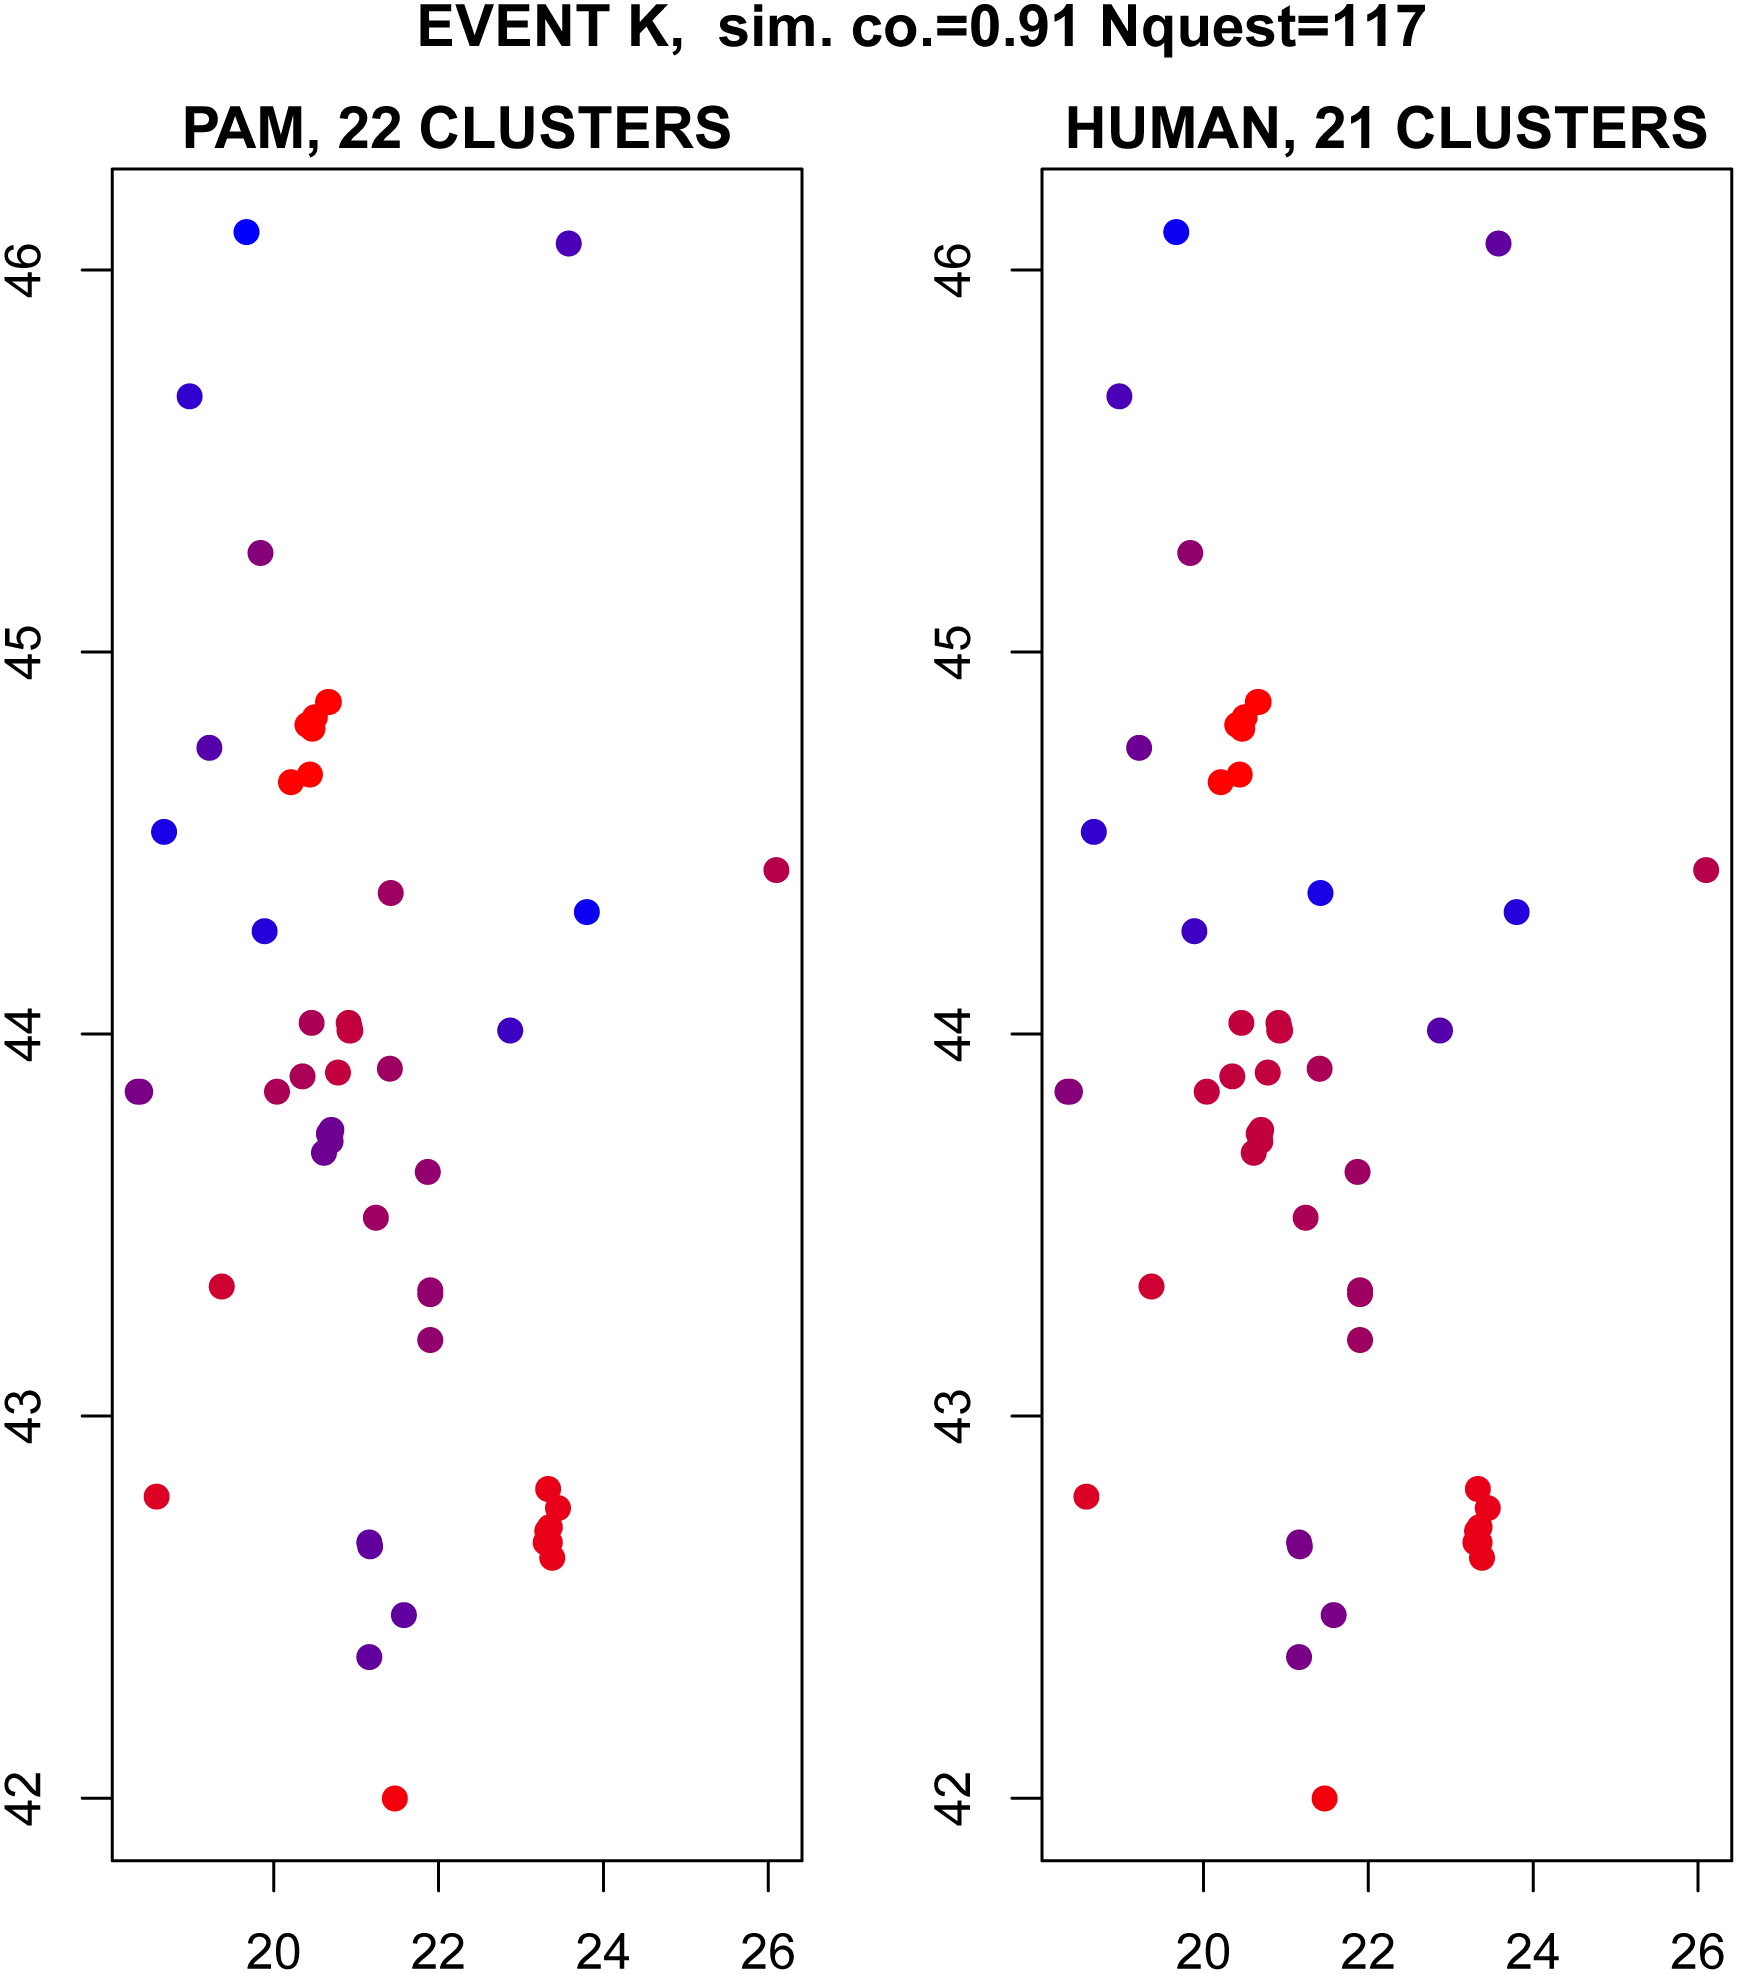
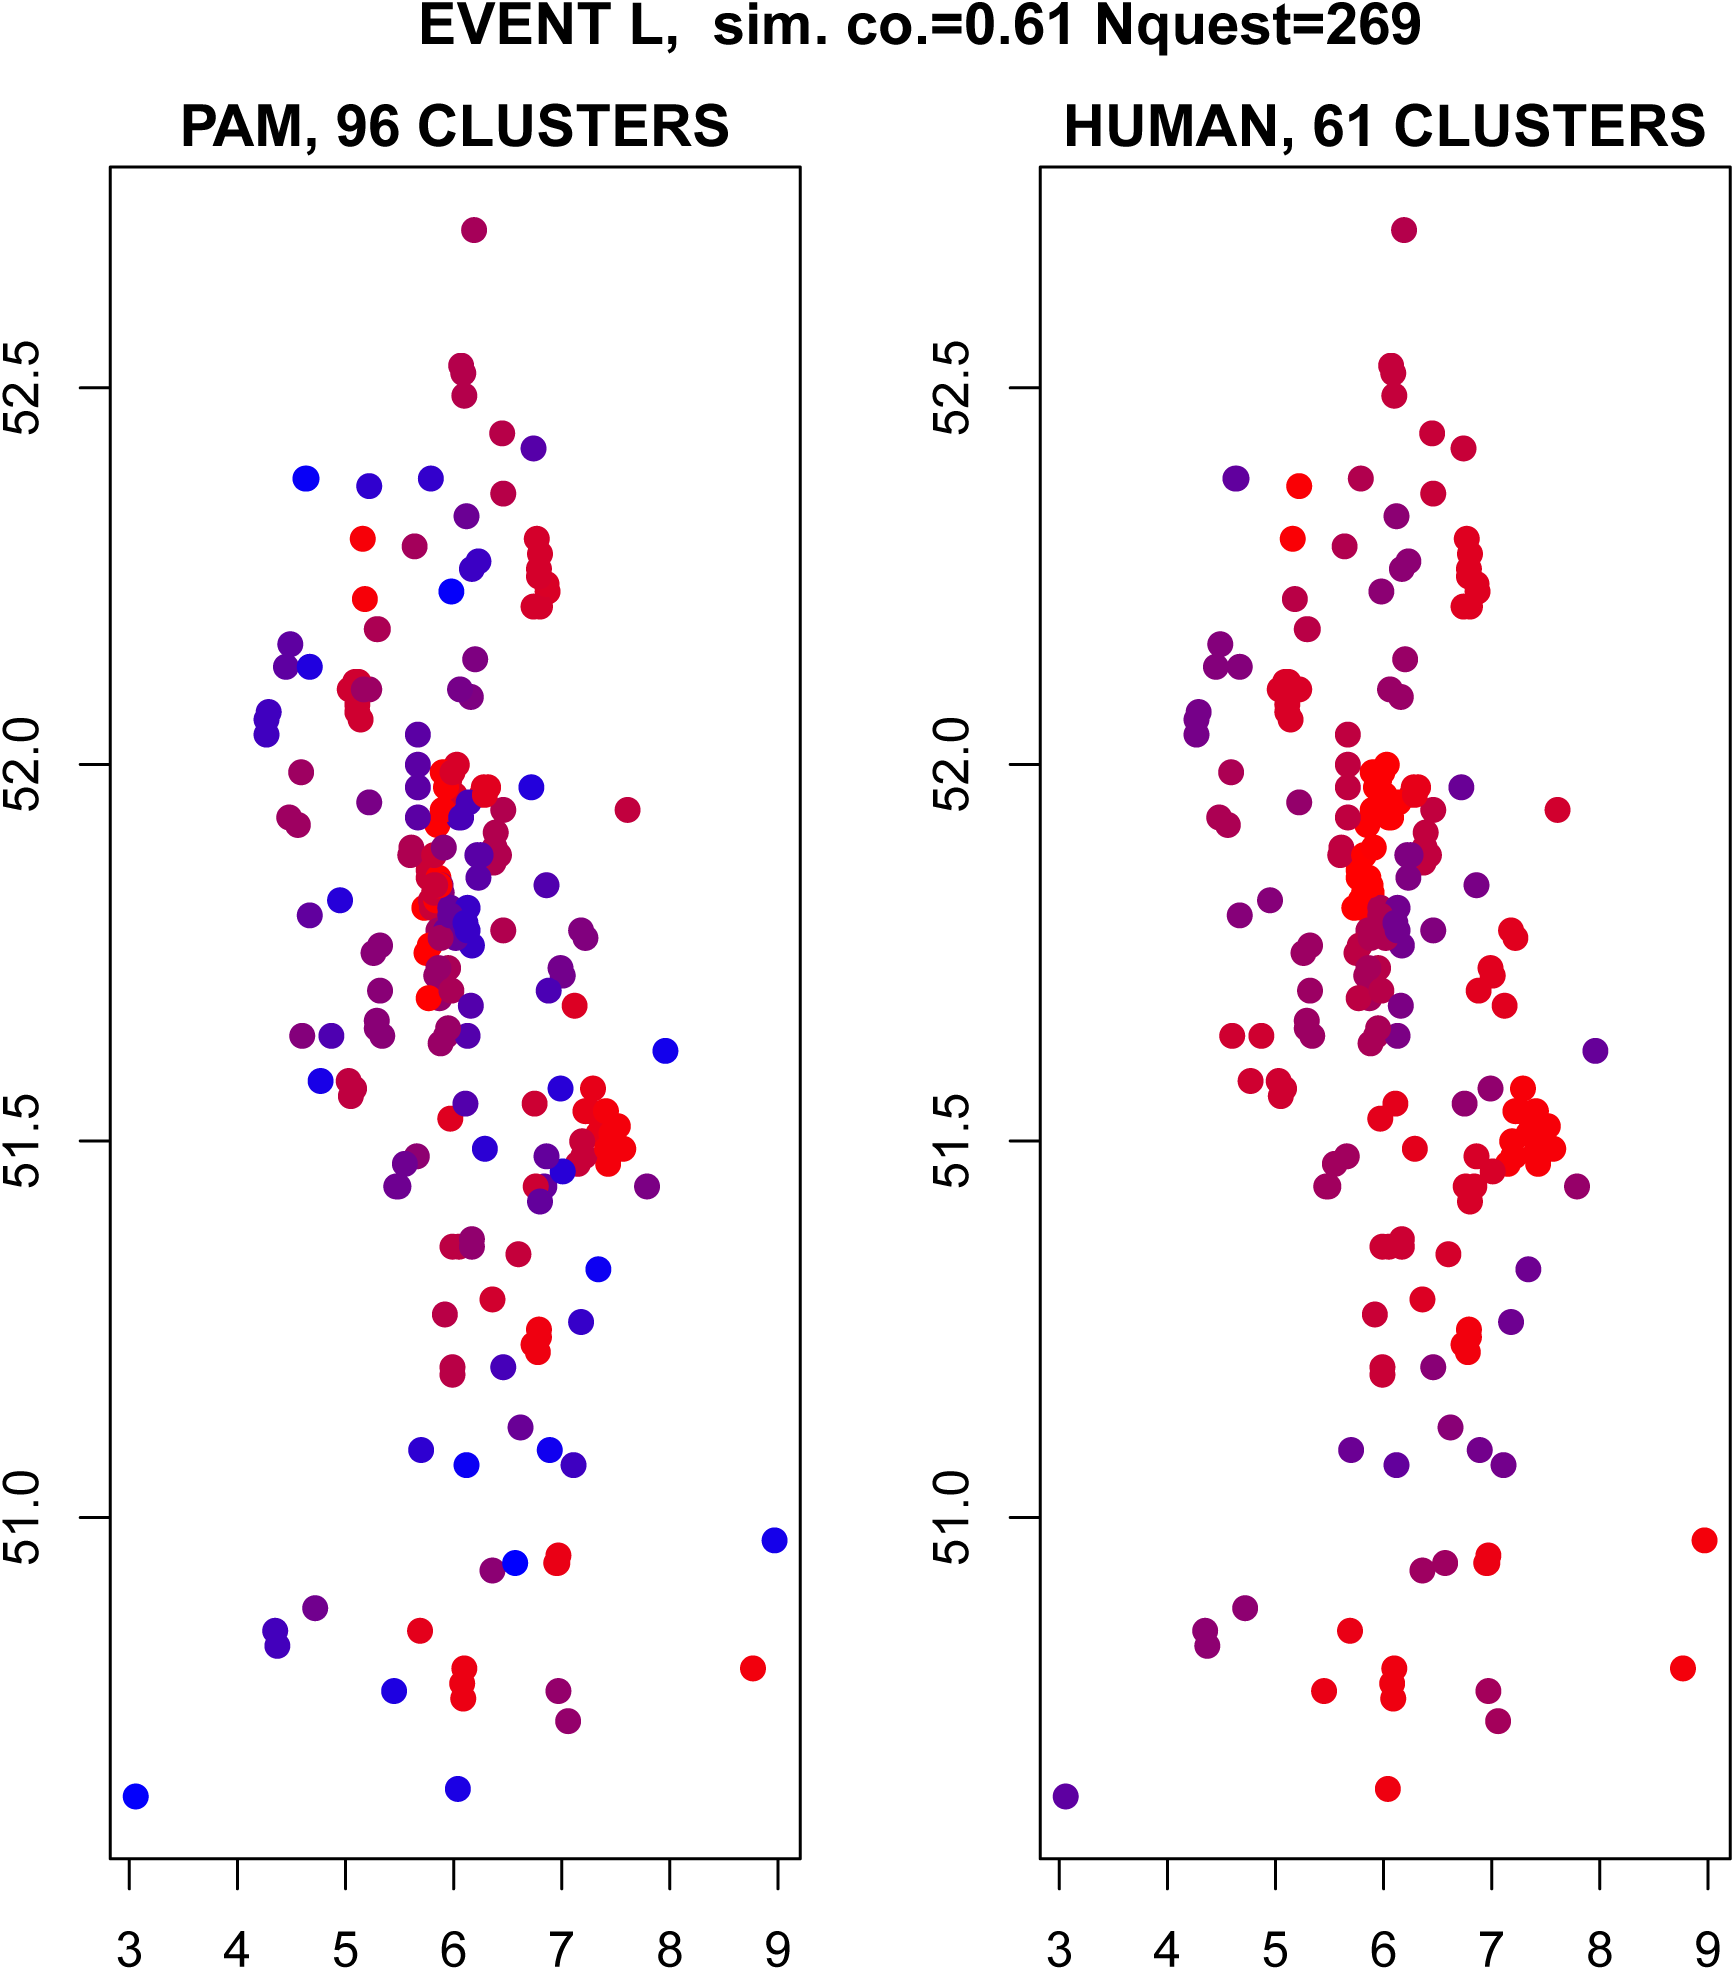
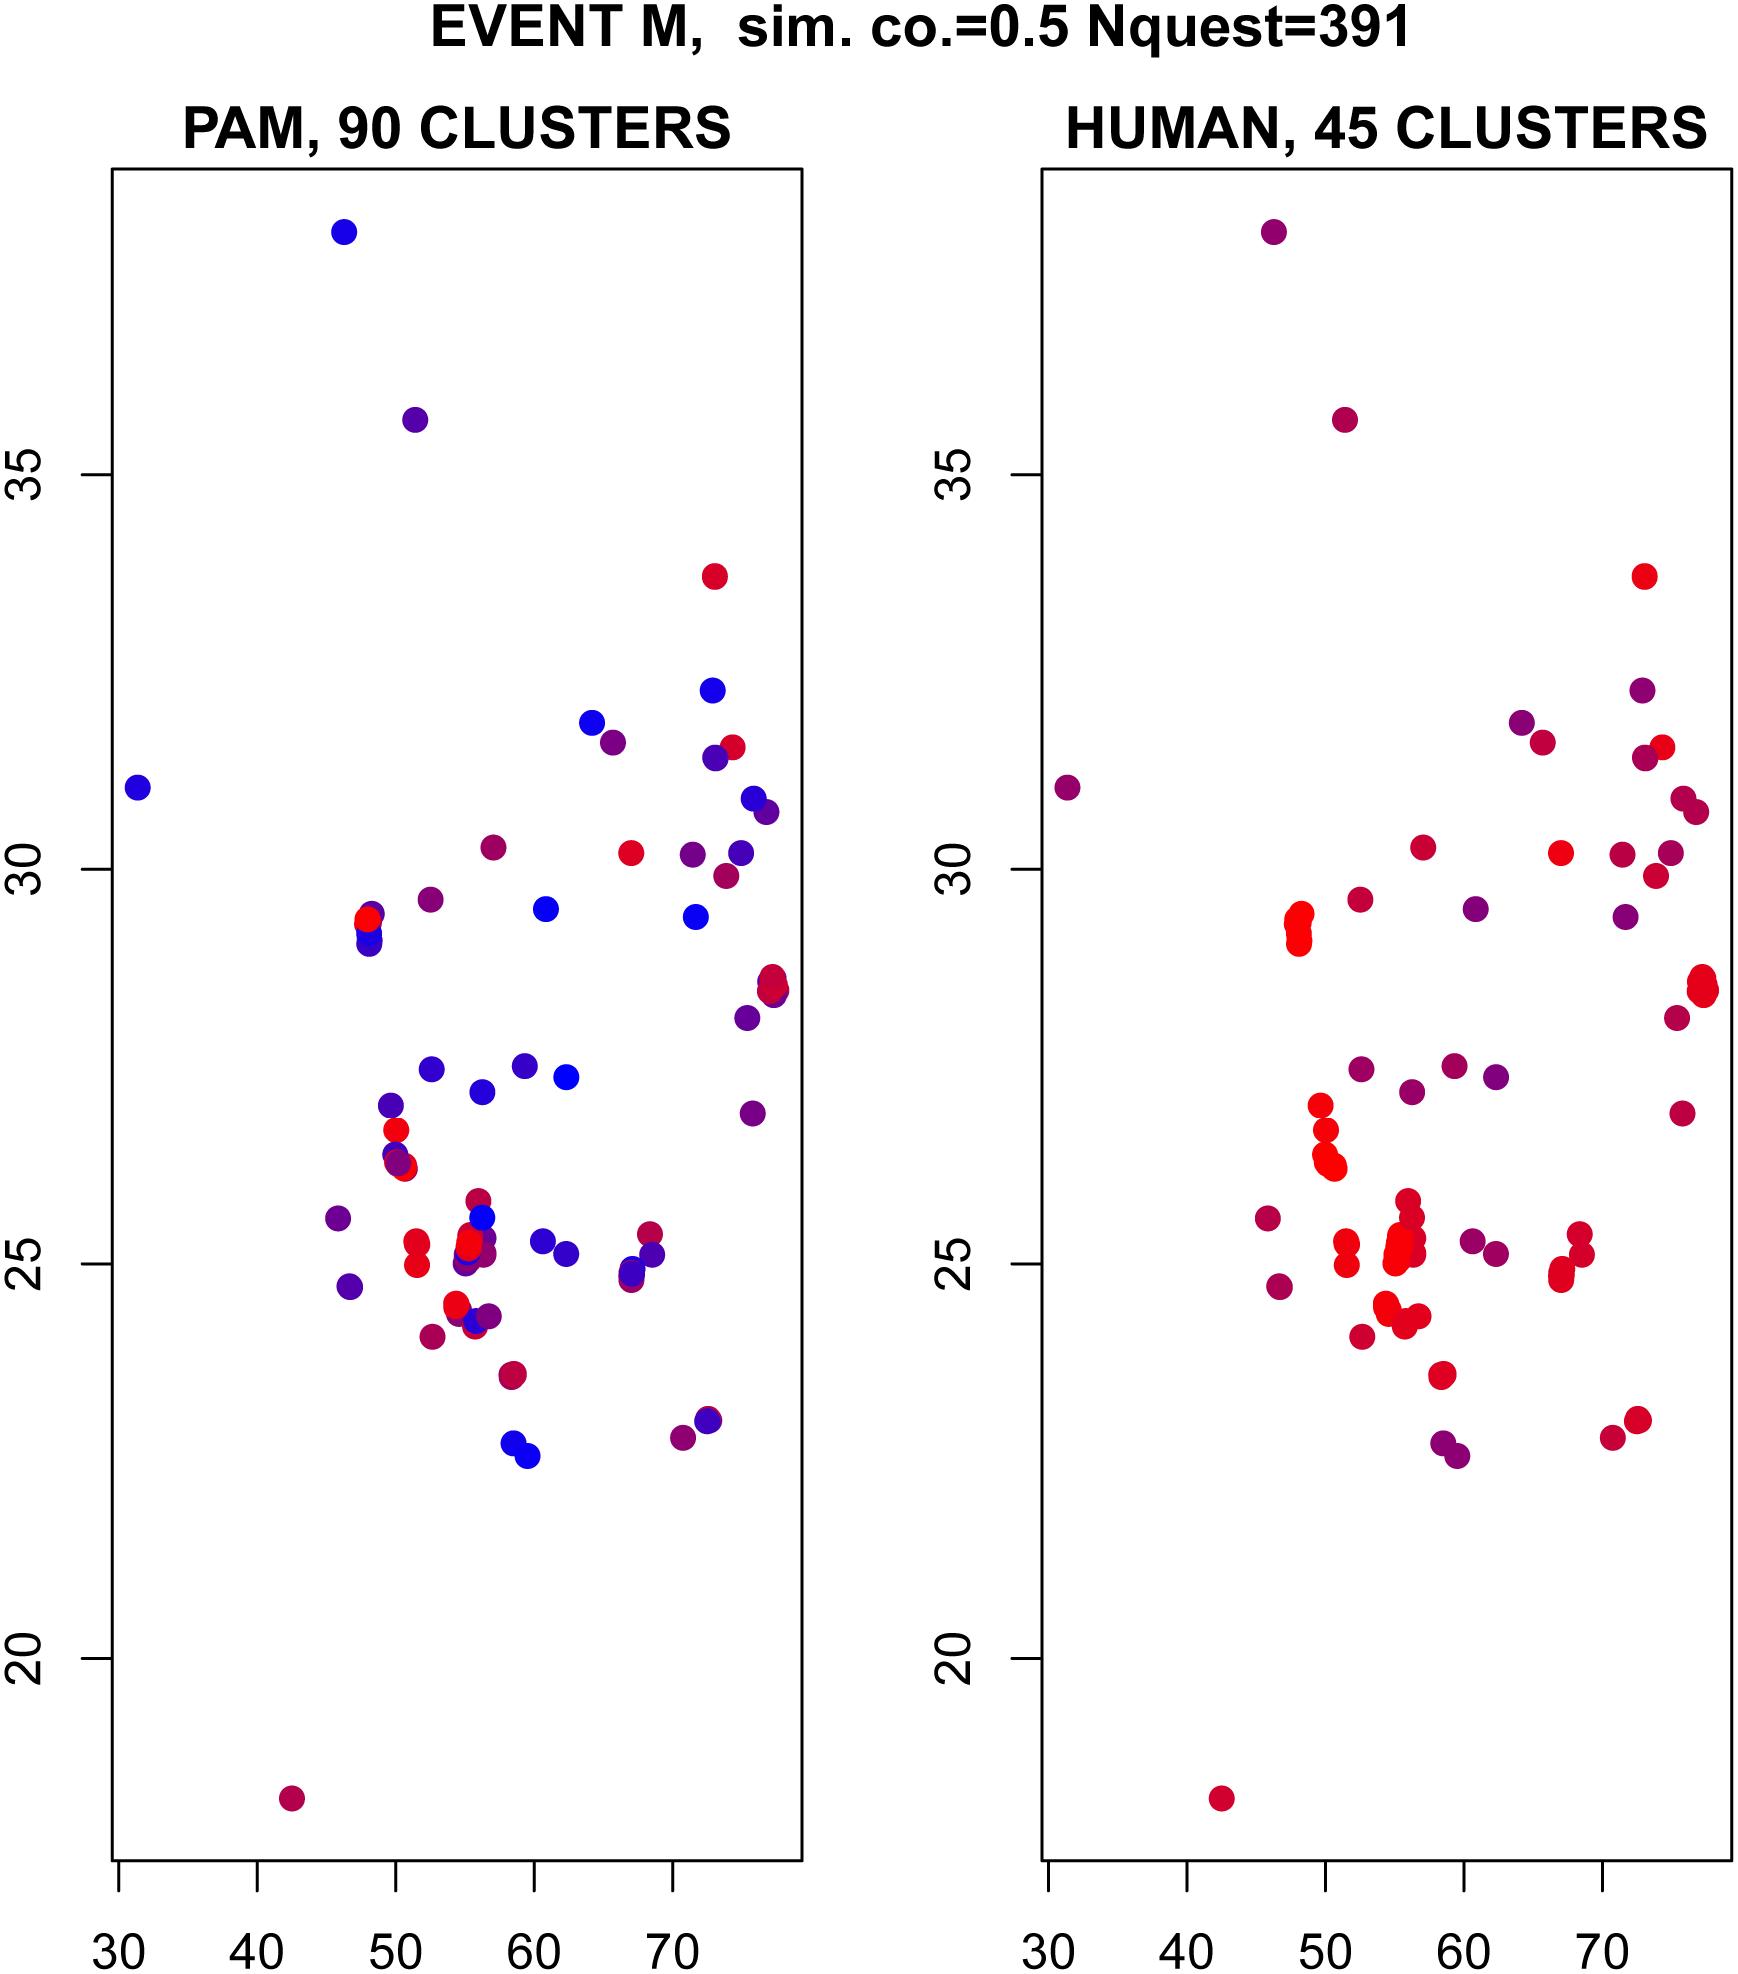
Download: Comparison Figures [Zipped PNG files; 1.2 MB]. This zip file contains the 15 clustering comparison figures (Figs. S16–S30, below), in which points are cluster medoids. Each cluster is assigned a color.
Figure S16. Cluster comparison for event A.
Figure S17. Cluster comparison for event B.
Figure S18. Cluster comparison for event C.
Figure S19. Cluster comparison for event D.
Figure S20. Cluster comparison for event E.
Figure S21. Cluster comparison for event F.
Figure S22. Cluster comparison for event G.
Figure S23. Cluster comparison for event H.
Figure S24. Cluster comparison for event I.
Figure S25. Cluster comparison for event J.
Figure S26. Cluster comparison for event K.
Figure S27. Cluster comparison for event L.
Figure S28. Cluster comparison for event M.
Figure S29. Cluster comparison for event N.
Figure S30. Cluster comparison for event O.
Animation S1 [h.264-Encoded MP4 Movie; 155 KB]. Evolution of the Barcelonnette event questionnaire clustering with time.
[ Back ]