These supplementary figures show details about the parameters used in the estimations of the magnitude of completeness Mc and b-values, as well as the subspace detector results for an additional station, GS.OK027. Table S1 contains the catalog of events detected on station GS.OK029. Table S2 contains production and disposal information for the wells shown in Figure 1 of the main text.
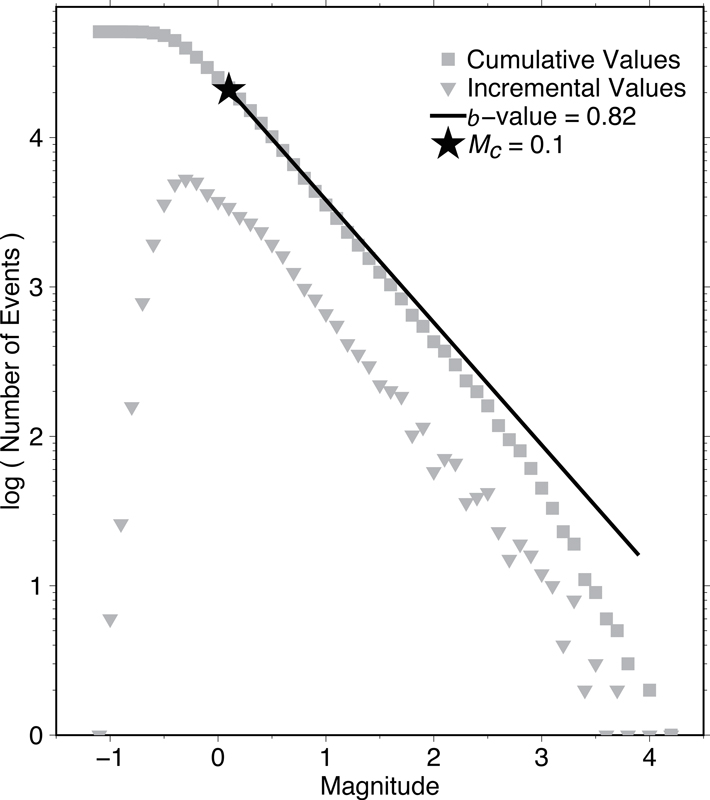
Figure S1. Gutenberg–Richter magnitude plot of the entire catalog (51,112 events in total) for the Guthrie cluster on station GS.OK029 with magnitude bins of 0.1. The estimated Mc (0.1) and b-value (0.82), calculated using methodologies described in the main text, are plotted as a black star and black line, respectively.
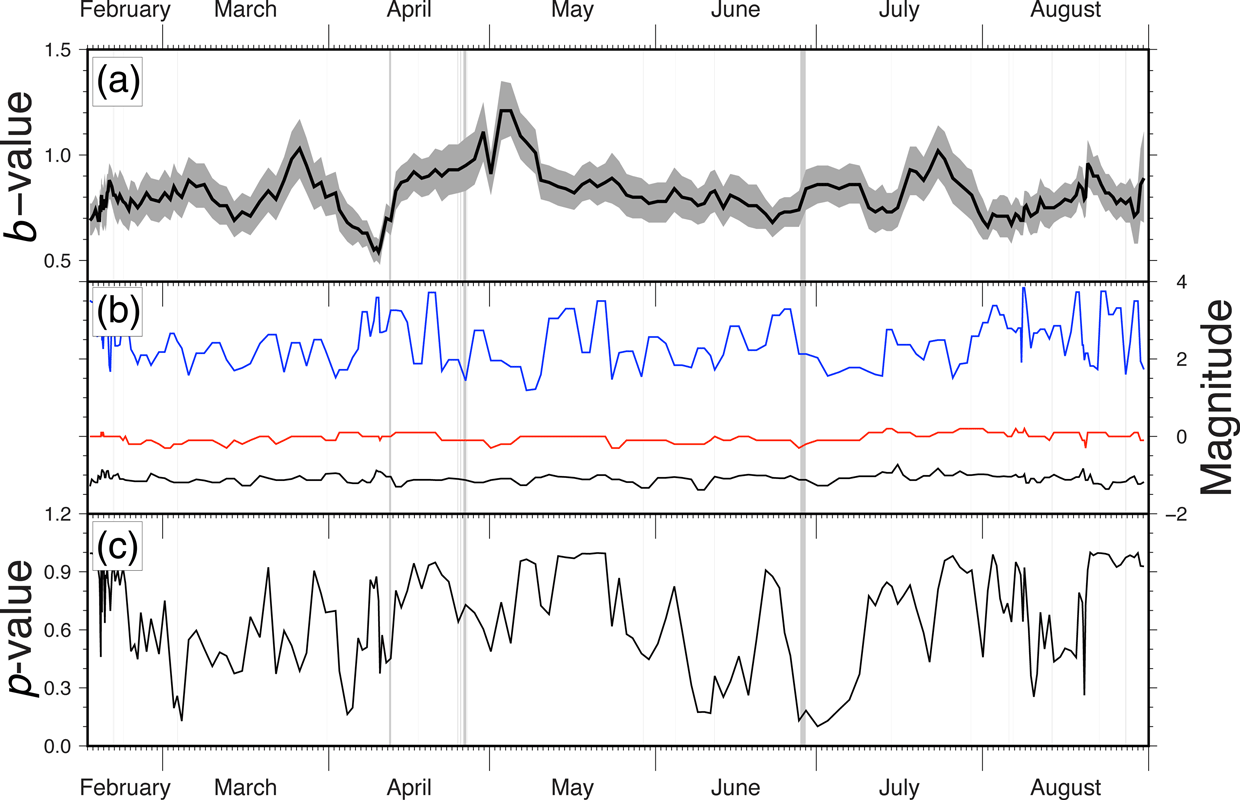
Figure S2. Summary of values used in and resultant from b-value calculations as a function of time for station GS.OK029: (a) the time-varying b-value using a sliding window of 500 earthquakes for each subcatalog (same as the dark gray line in Fig. 4 of the main text), with the dark gray background indicating 95% confidence level; (b) the magnitude extremes in each b-value calculation (black, minimum magnitude in subcatalog; red, minimum Mc in subcatalog; blue, maximum magnitude in sub-catalog); and (c) the p-value statistic for each subcatalog (e.g., Aster et al., 2012), a measure of how likely the observed data are to be produced from a random distribution produced with the predicted b-value and Gutenberg–Richter statistics.
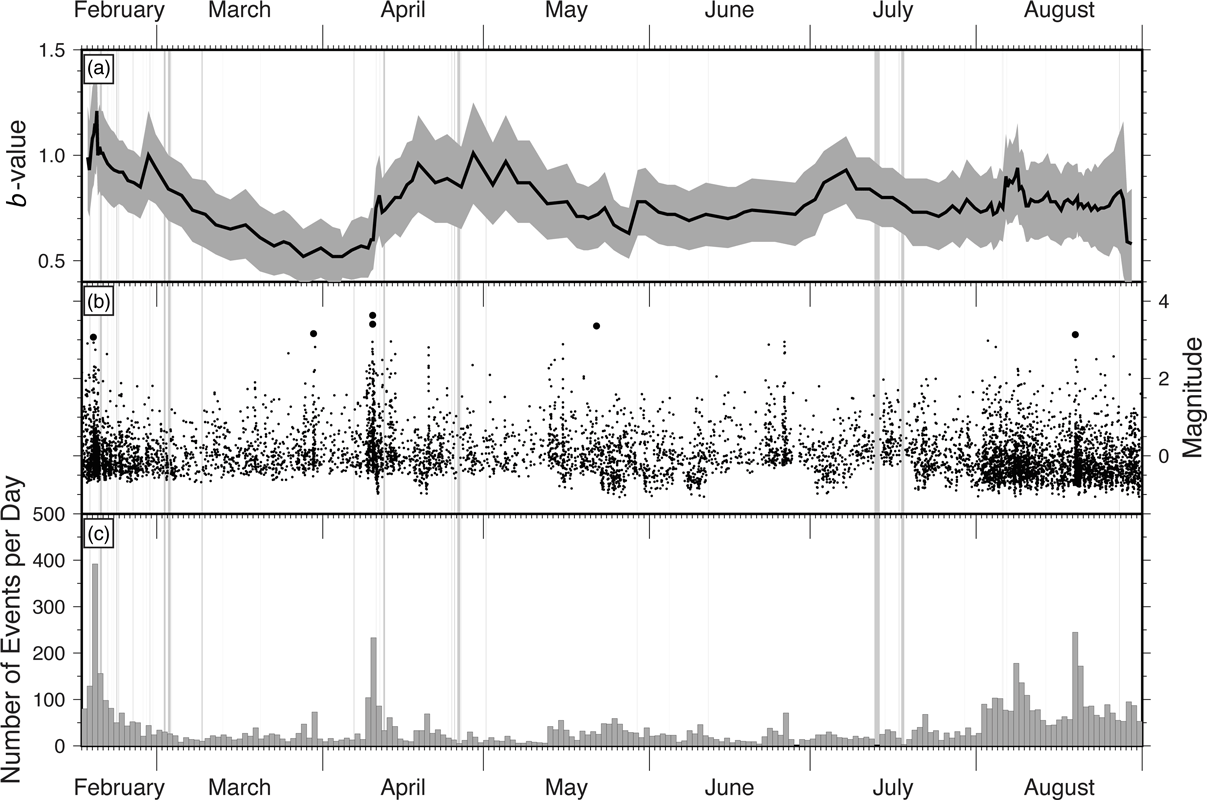
Figure S3. Detector summary as a function of time for station GS.OK027, located 16.5 km from the centroid of the Guthrie cluster using a template length of 3.5 s: (a) the time-varying b-value using a sliding window of 250 earthquakes, with the dark gray background indicating the 95% confidence interval; (b) the detection magnitudes (larger dots indicate events larger than magnitude 3.0); and (c) the number of detections per day. The light gray vertical lines show time periods without data. Approximately 15% of the events detected on station GS.OK029 were detected on station GS.OK027. All three panels show similar trends to those seen at station GS.OK029 (see Fig. S2).
Download/View: Table S1 [comma-separated value table; ~1.5 MB]. Catalog of the 51,112 events detected in the Guthrie cluster on station GS.OK029. Columns are event date (m/dd/yyyy), estimated origin time (mm:ss.s), computed magnitude, and detector variance.
Table S2. Production and disposal data for the American Petroleum Institute (API) wells active in 2013 that are displayed in Figure 1 of the main text. Well class abbreviations: 2DNC, noncommercial disposal well; 2DCm, commercial disposal well; 2R/2RIn, enhanced recovery production well; 2RSI, enhanced recovery production well with simultaneous injection and disposal. Information was gathered from the Oklahoma Corporation Commission’s oil and gas data files and electronic well database (see References).
Aster, R., B. Borchers, and C. Thurber (2012). Parameter Estimation and Inverse Problems, Elsevier, 360 pp.
Oklahoma Corporation Commission, Oklahoma Corporation Commission’s Well Data System (electronic well database), http://www.occpermit.com/WellBrowse/ (last accessed May 2015).
Oklahoma Corporation Commission, Oil and Gas Data Files, http://www.occeweb.com/og/ogdatafiles2.htm (last accessed May 2015).
[ Back ]