The electronic supplement contains nine figures, showing the shear-wave velocity model and its spatial correlation with other tectonic units, as well as multiple 3D resolution tests.
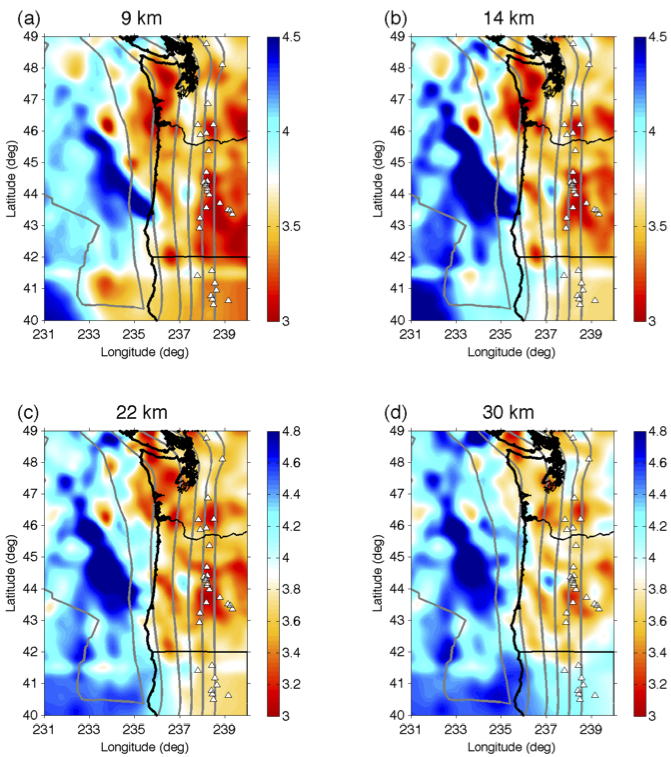
Figure S1. Shear-wave velocity VS structure (in km/s) at multiple depths. Note that the panels share different velocity scale, as denoted by the color bars. White triangles indicate locations of Holocene volcanism. The gray lines are the depth contours of the Juan de Fuca plate interface at 20–100 km from the model of McCrory et al. (2004).
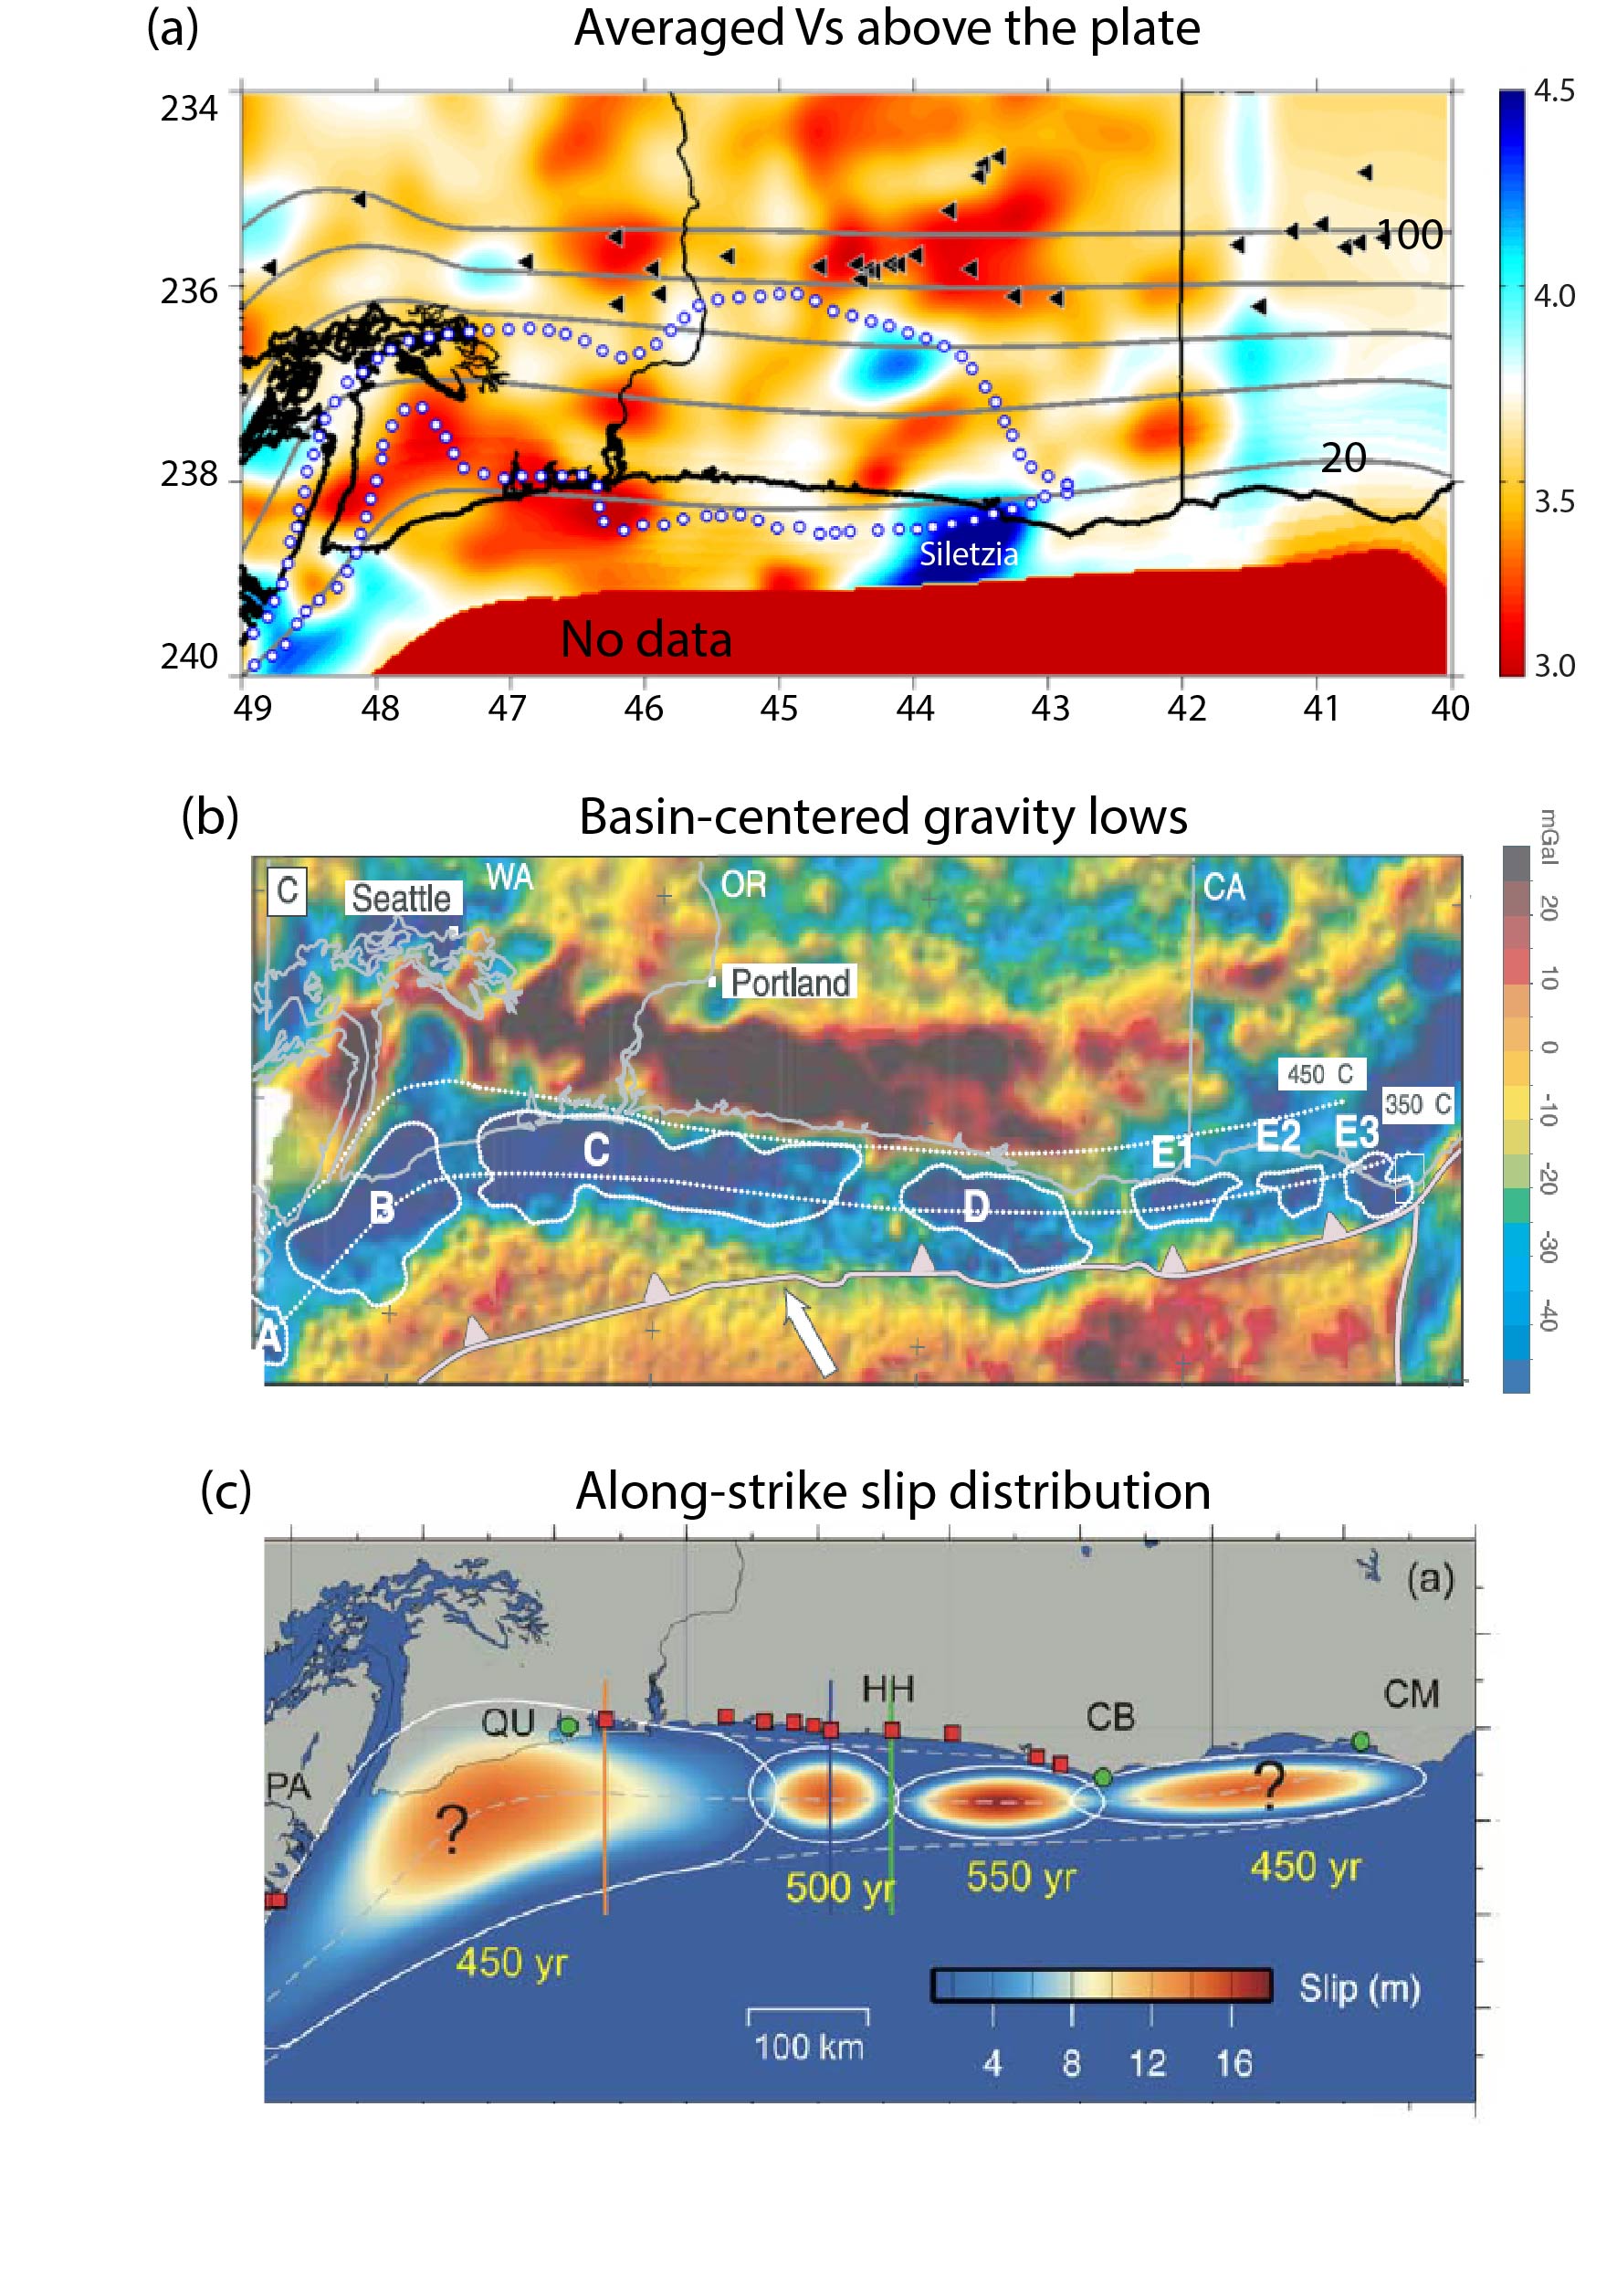
Figure S2. Comparison of (a) our preliminary VS model in km/s with (b) basin-centered gravity lows (Wells et al. 2003) and (c) the estimated high slip patches (Wang et al. 2013). The VS model in (a) is the average velocity in the crust above the plate interface within 8–25 km depths. White dots outline the distribution of Siletzia west of the Cascades from Wells et al. (1998). Black triangles indicate locations of Holocene volcanism. The gray lines are the depth contours of the Juan de Fuca plate interface at 8, 15, 30, 50, 70, and 90 km, individually, from the model of McCrory et al. (2004). In (b), the white arrow indicates the convergence of the Juan de Fuca plate relative to North America. The contoured offshore gravity lows indicate filled basins and accreted sediments. In (c), the white contours outline the high-moment slip patches of a rupture model for the 1700 Cascadia earthquake. The white dashed lines represent the down-dip limits of the uniform coseismic slip zone and linear transition zone, corresponding to the 350ºC and 450ºC isotherms, respectively.
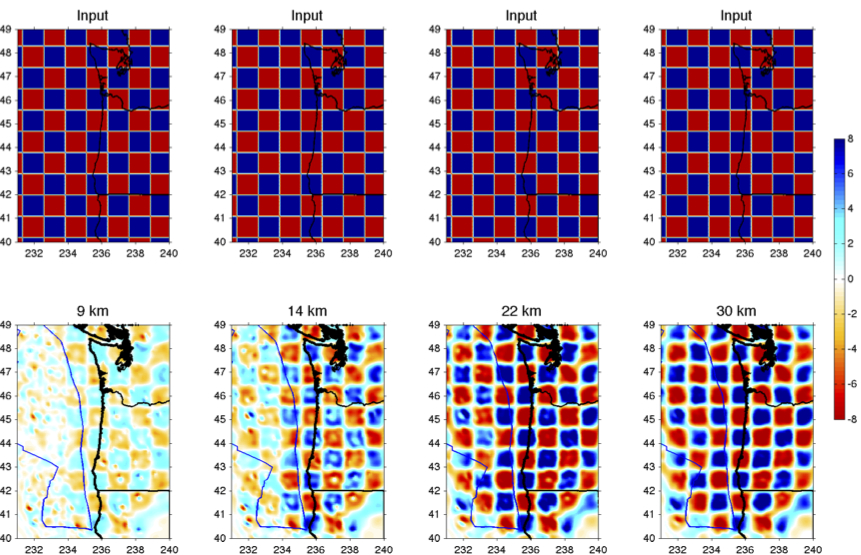
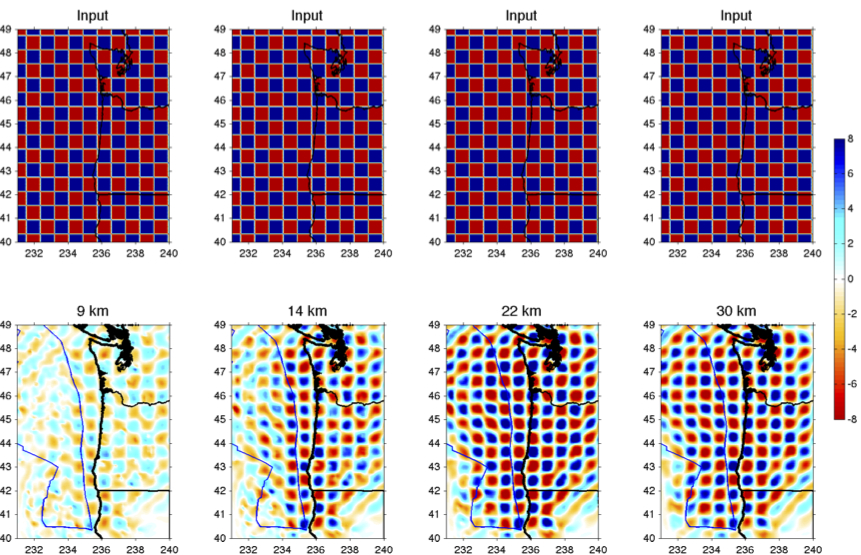
Figure S3. Three-dimensional checkerboard resolution test. (top, from left to right) Input model at 9, 14, 22, and 30 km, individually. The dimension of the checkerboard cells is ∼100 km horizontally and 50 km vertically. The velocity perturbation varies within a range of ±8%. (bottom) The recovered velocity models at the corresponding depths.
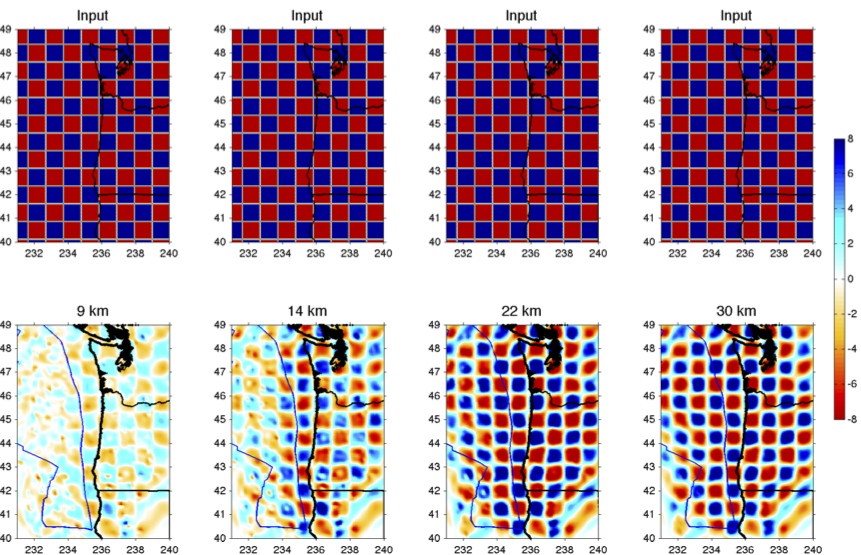
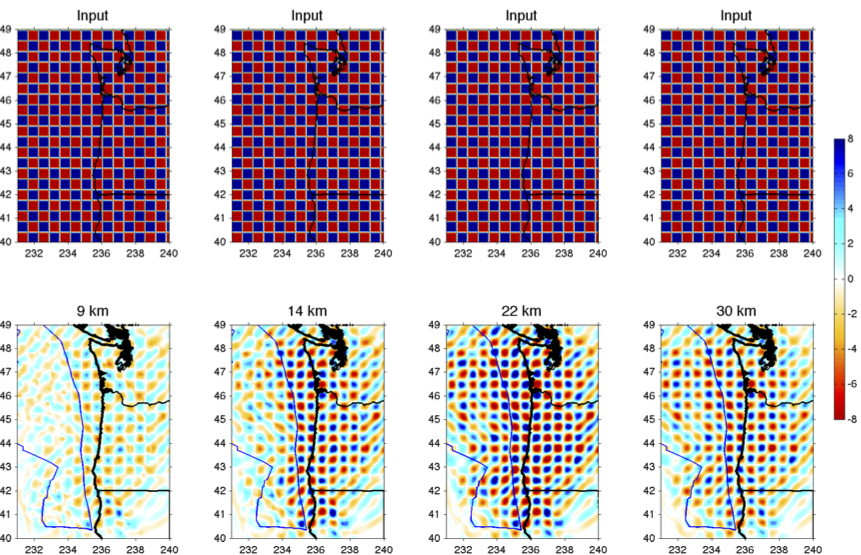
Figure S4. Same as Figure S3, except the dimension of the checkerboard cells is ∼85 km horizontally.
Figure S5. Same as Figure S3, except the dimension of the checkerboard cells is ∼65 km horizontally.
Figure S6. Same as Figure S3, except the dimension of the checkerboard cells is ∼50 km horizontally.
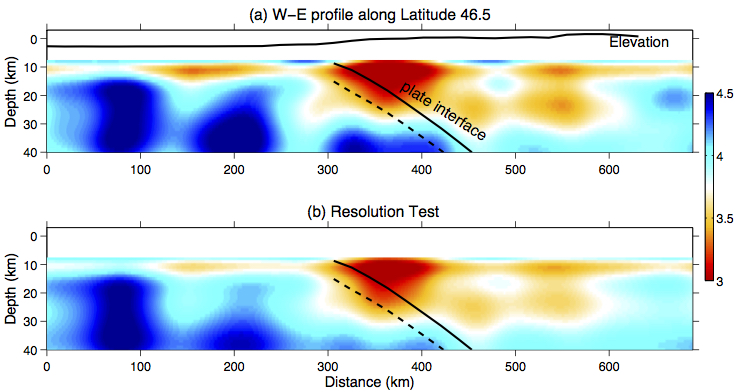
Figure S7. (top) A west–east (W-E) profile at latitude 46.5° (VS in km/s). The projected plate interface is from McCrory et al. (2004). The dashed lines mark the oceanic Moho interface, assuming the average thickness of the oceanic crust of 6 km. (bottom) The recovered structure using the preferred model (top) as an input to generate synthetic data.
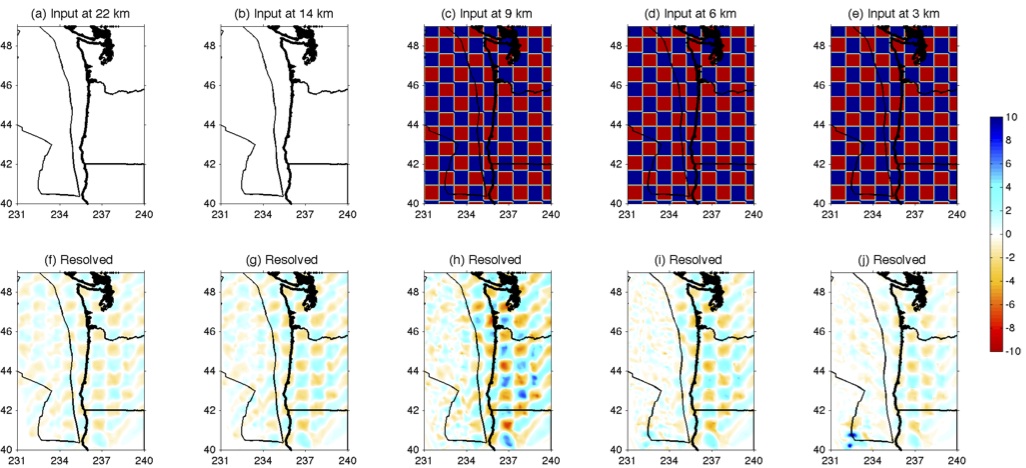
Figure S8. (top) The input model has a ±10% velocity perturbation at depths of 3–9 km. The horizontal dimension of the checkerboard cells is ∼75 km. (bottom) The recovered velocity models at the corresponding depths. It shows that a small portion of the velocity perturbation at shallow depths is leaked into greater depths due to the relatively poor vertical resolution constraint of surface-wave tomography.
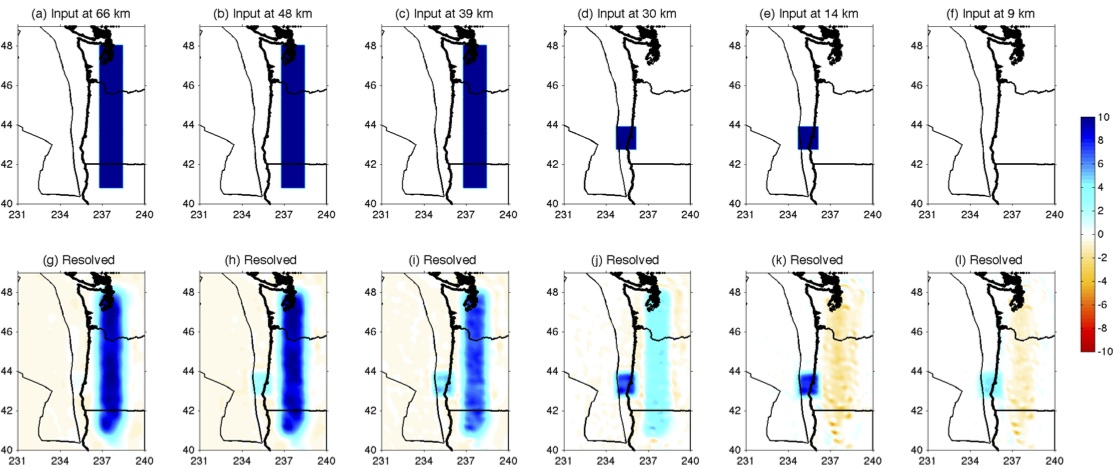
Figure S9. Three-dimensional resolution test with input of a subducting slab and Siletzia off the Oregon coast (as indicated in Fig. 5 in the main article and Fig. S2). (top) The input model has a high-velocity patch at depths of 14–30 km and a uniform slab at depths of 39–70 km with a 10% velocity perturbation. (bottom) The recovered velocity models at the corresponding depths. We see that in general the input velocity patterns are recovered fairly well as uniform units, though part of the velocity perturbations leak into shallower or deeper parts due to the relatively poor vertical resolution constraint of surface-wave tomography.
McCrory, P. A., J. L. Blair, D. H. Oppenheimer, and S. R. Walter (2004). Depth to the Juan de Fuca slab beneath the Cascadia subduction margin: A 3D model for sorting earthquakes, U.S. Geological Survey Data Series 91, http://pubs.usgs.gov/ds/91 (last accessed July 2015).
Wang, P.-L., S. E. Engelhart, K. Wang, A. D. Hawkes, B. P. Horton, A. R. Nelson, and R. C. Witter (2013). Heterogeneous rupture in the great Cascadia earthquake of 1700 inferred from coastal subsidence estimates, J. Geophys. Res. 118, 2460–2473, doi: 10.1002/jgrb.50101.
Wells, R. E., C. S. Weaver, and R. J. Blakely (1998). Fore-arc migration in Cascadia and its neotectonic significance, Geology 26, 759–762.
Wells, R. E., R. J. Blakely, Y. Sugiyama, D. W. Scholl, and P. A. Dinterman (2003). Basin-centered asperities in great subduction zone earthquakes: A link between slip, subsidence, and subduction erosion? J. Geophys. Res. 108, no. B10, doi: 10.1029/2002JB002072.
[ Back ]