This electronic supplement contains photographs of precariously balanced rocks (PBRs) with a regional location map, illustrations of measuring PBR fragility, and measured parameters of PBR fragility.
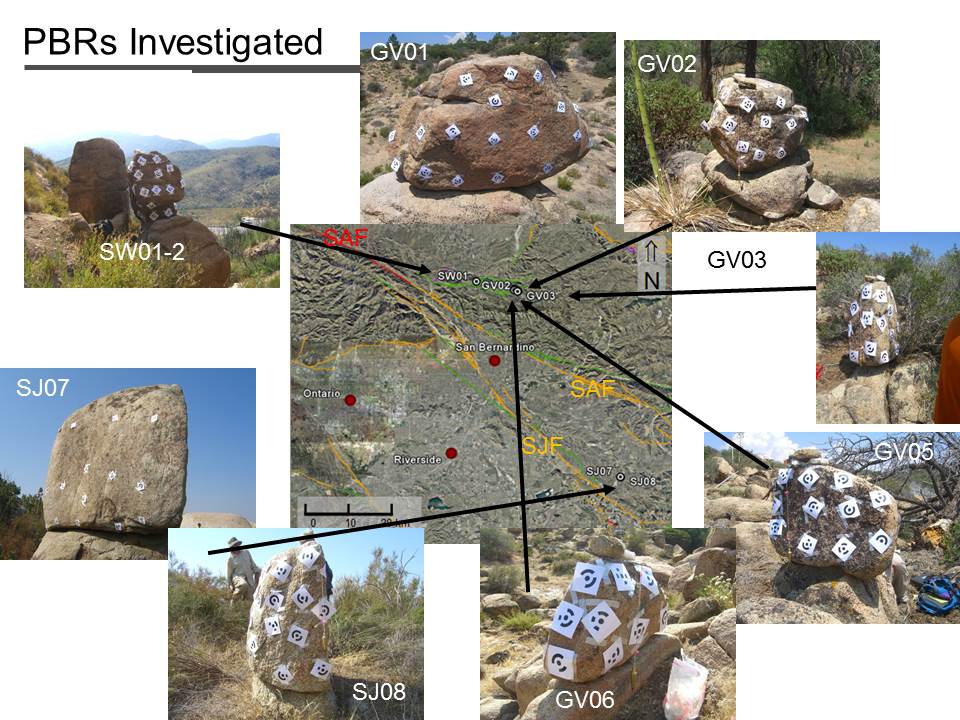
Figure S1. Photographs of balanced rocks GV01, GV02, GV03, GV05, GV06, and SW01-2, observed in the western San Bernardino Mountains near the San Andreas fault (SAF), and SJ07 and SJ08 near the San Jacinto fault (SJF) east of Riverside, California. Paper targets are affixed for photogrammetry. Plumb bobs, providing vertical reference lines, are visible in photos of GV02, GV05, GV06, and SJ08. The locations of selected rocks are shown on the map. Additional rocks are too close to plot separately. (The University of Nevada, Reno, maintains a database of known PBR locations; see Andersen et al., 2011.) Major cities are marked with red dots. Holocene faults, including the San Andreas and San Jacinto fault, are shown in orange. Late Quaternary faults are shown in green. The red portion of the San Andreas fault is the 1857 earthquake. Fault traces are from the Quaternary Fault and Fold Database of the United States (http//earthquakes.usgs.gov/regional/qfaults/, last accessed August 2008).
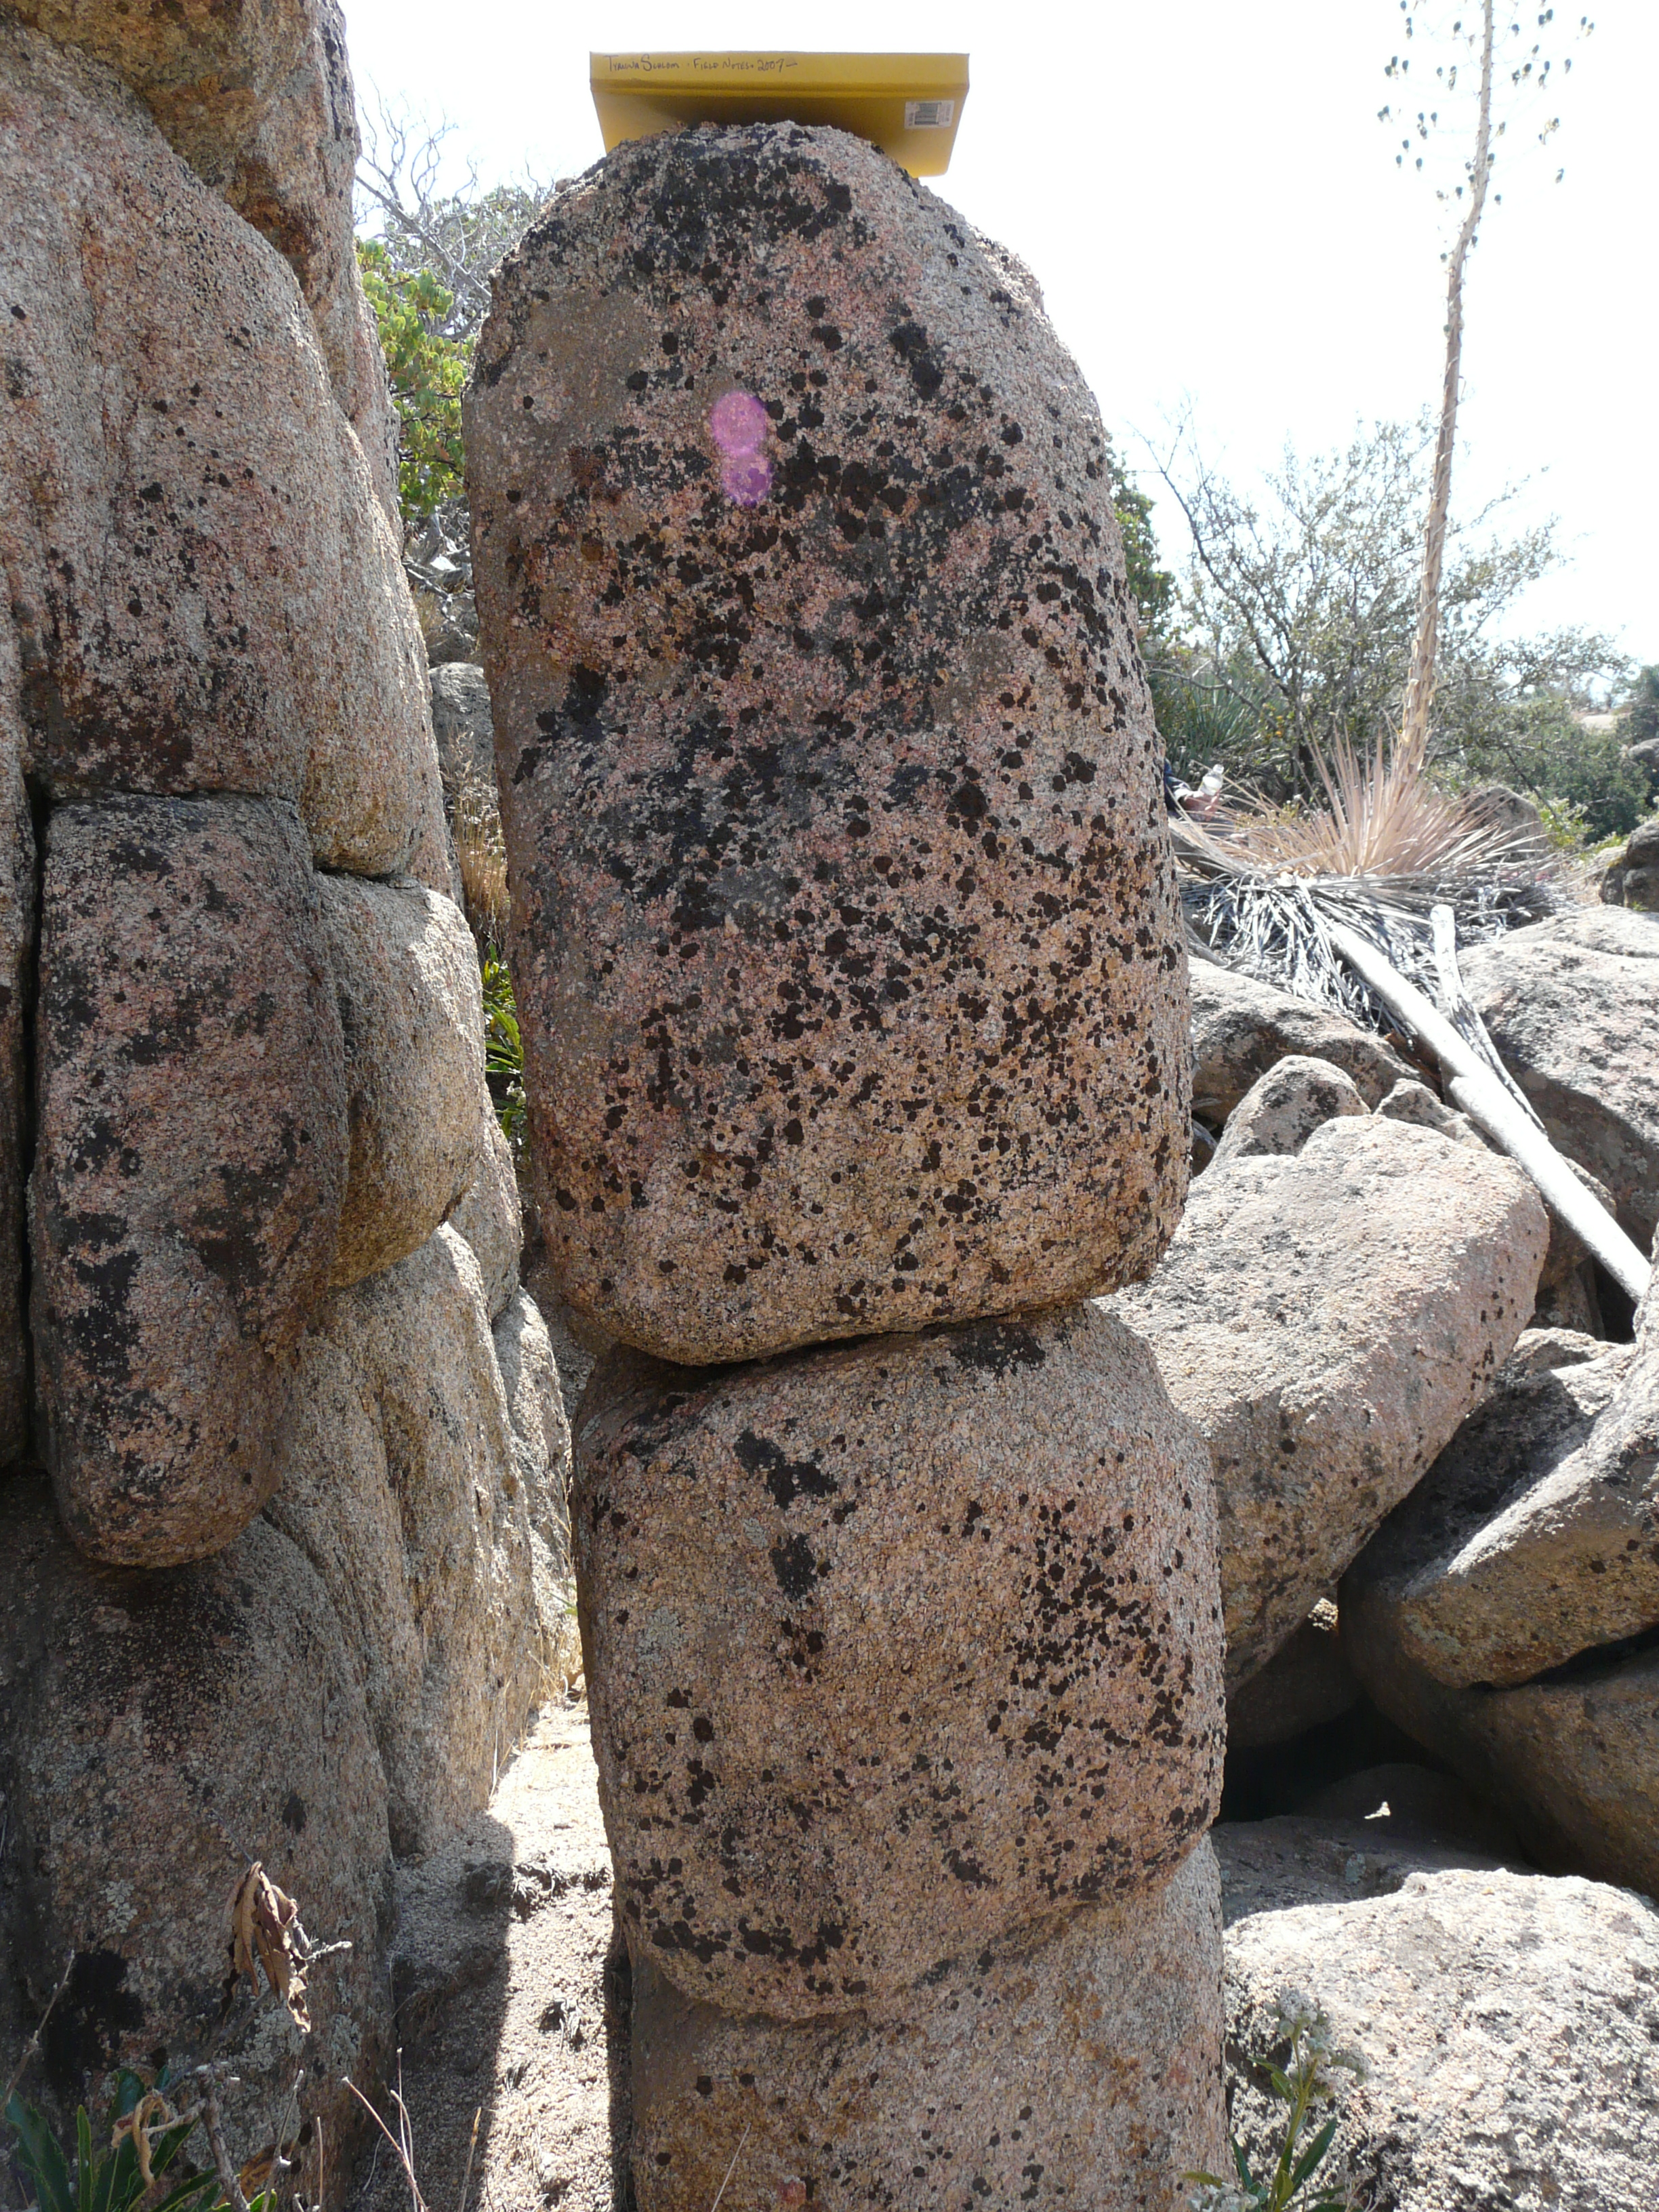
Figure S2. Unnamed fragile rock stack in Grass Valley area.
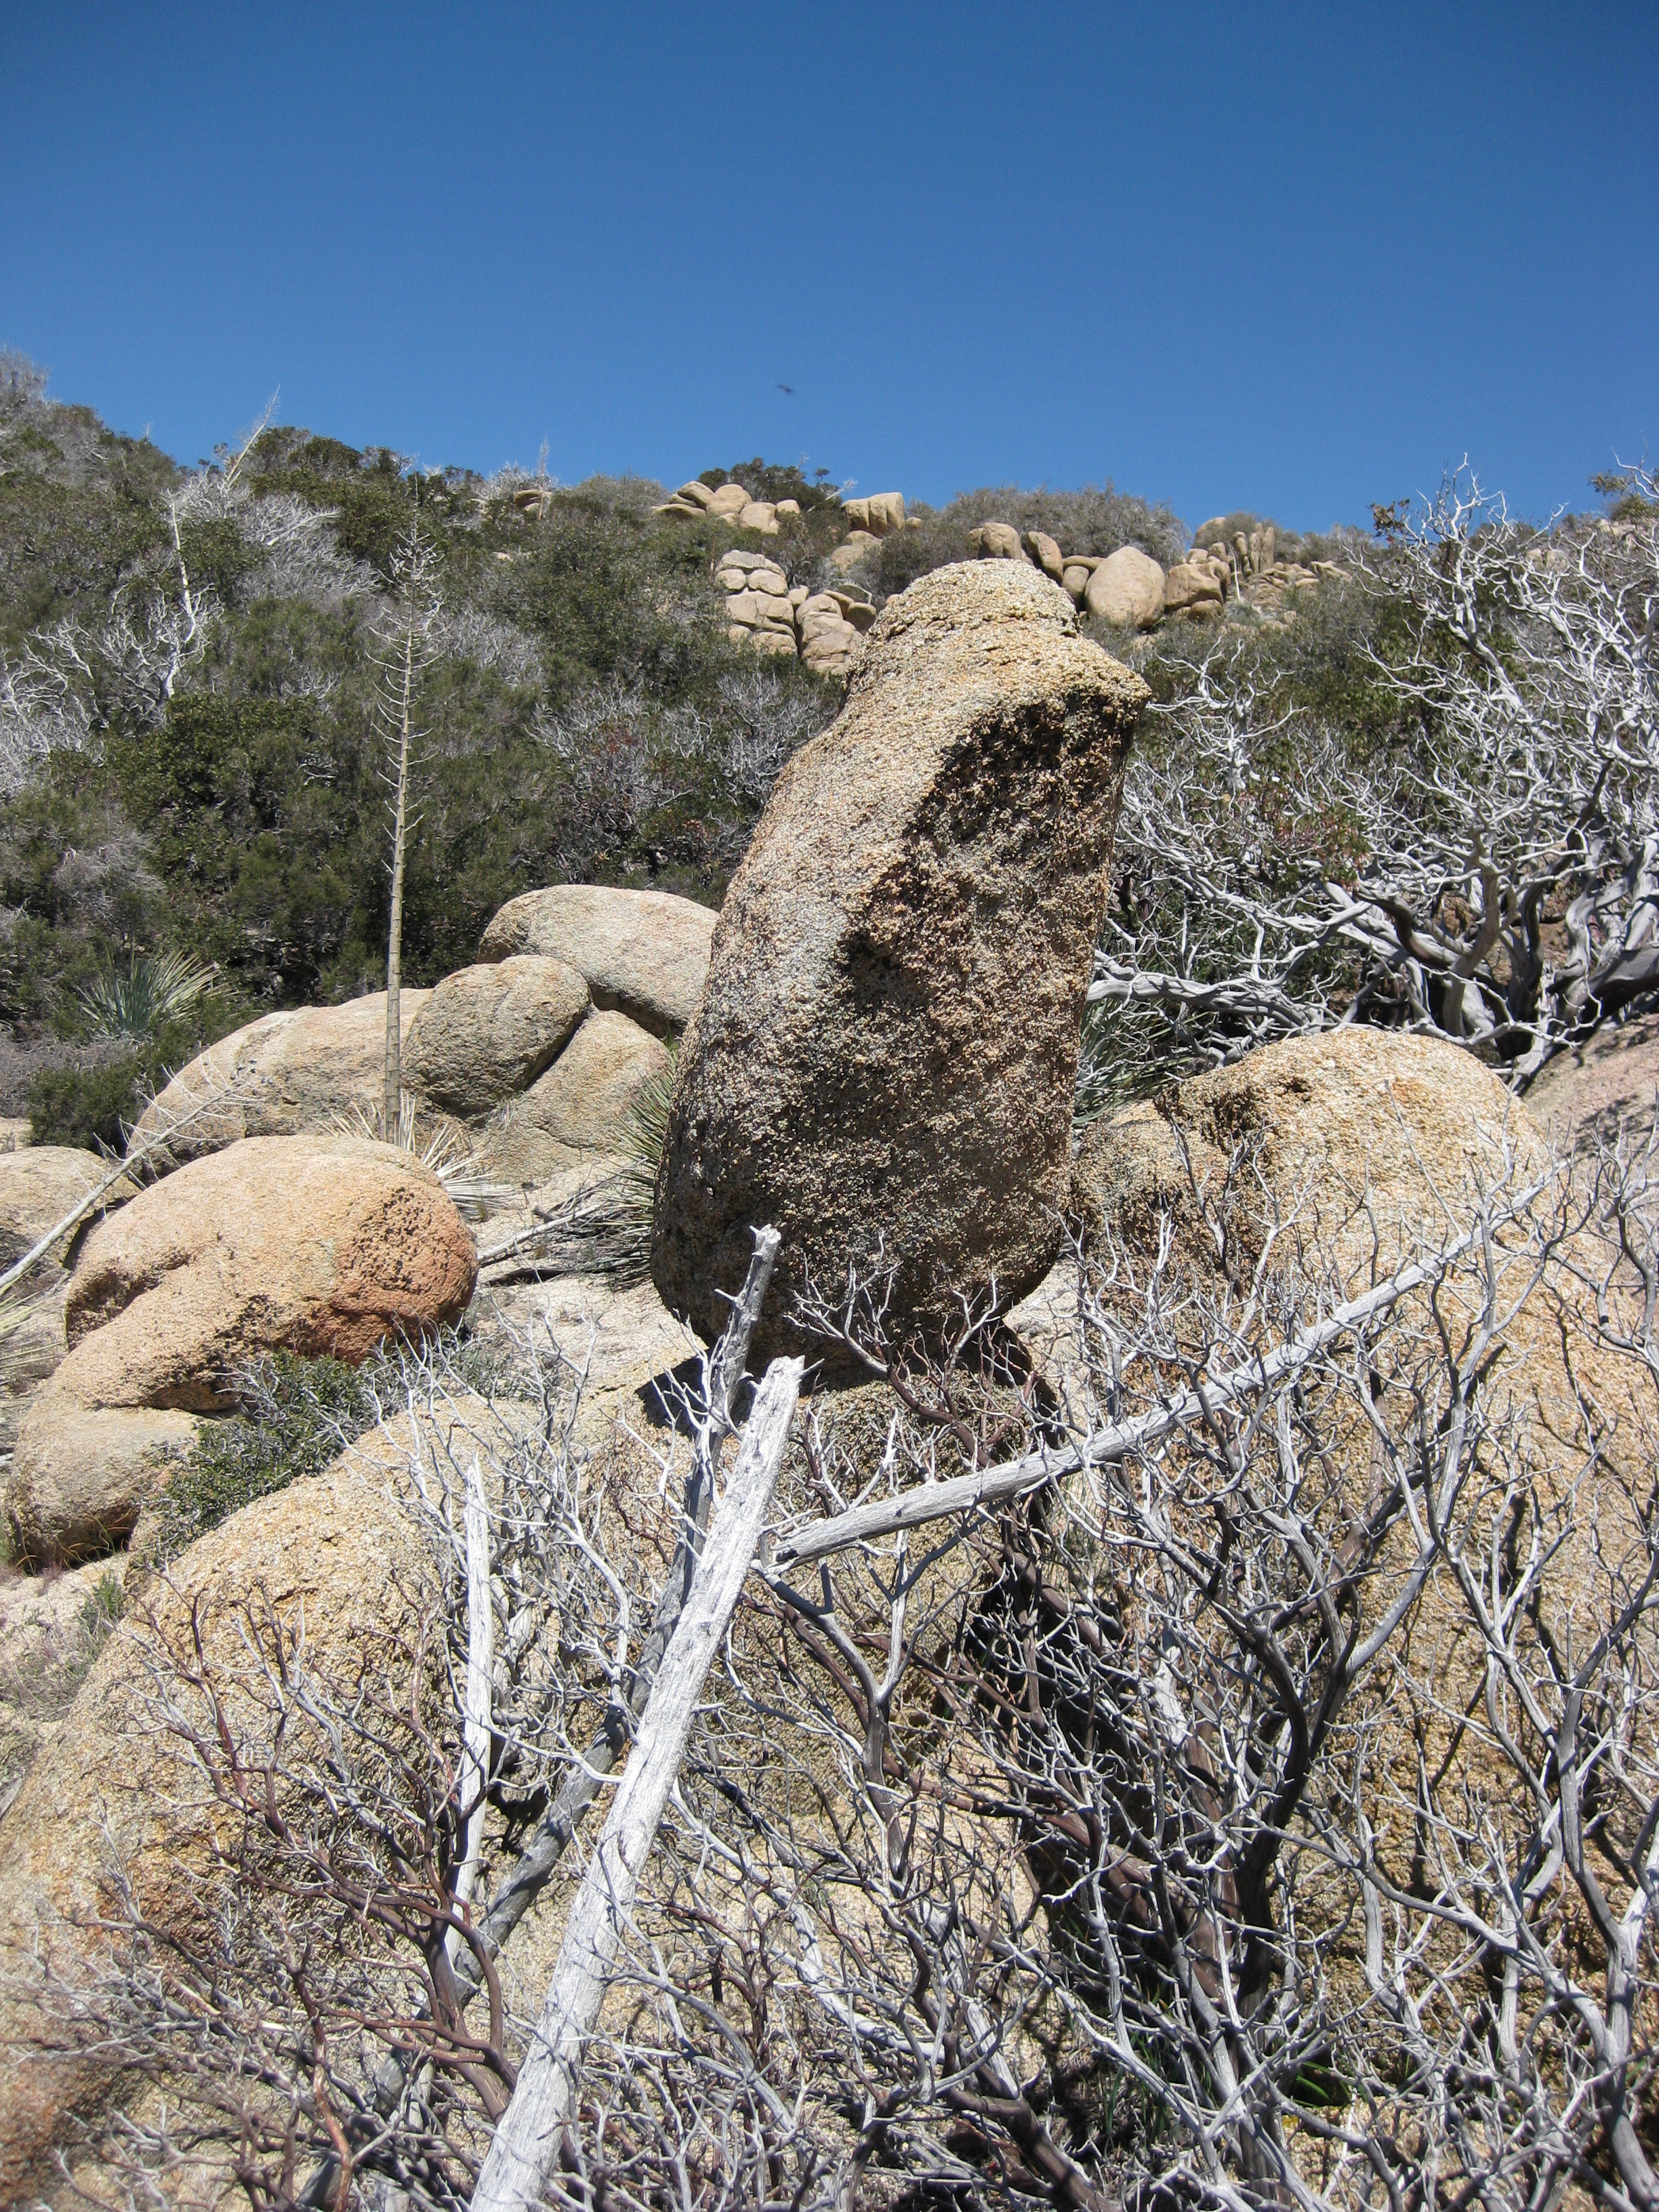
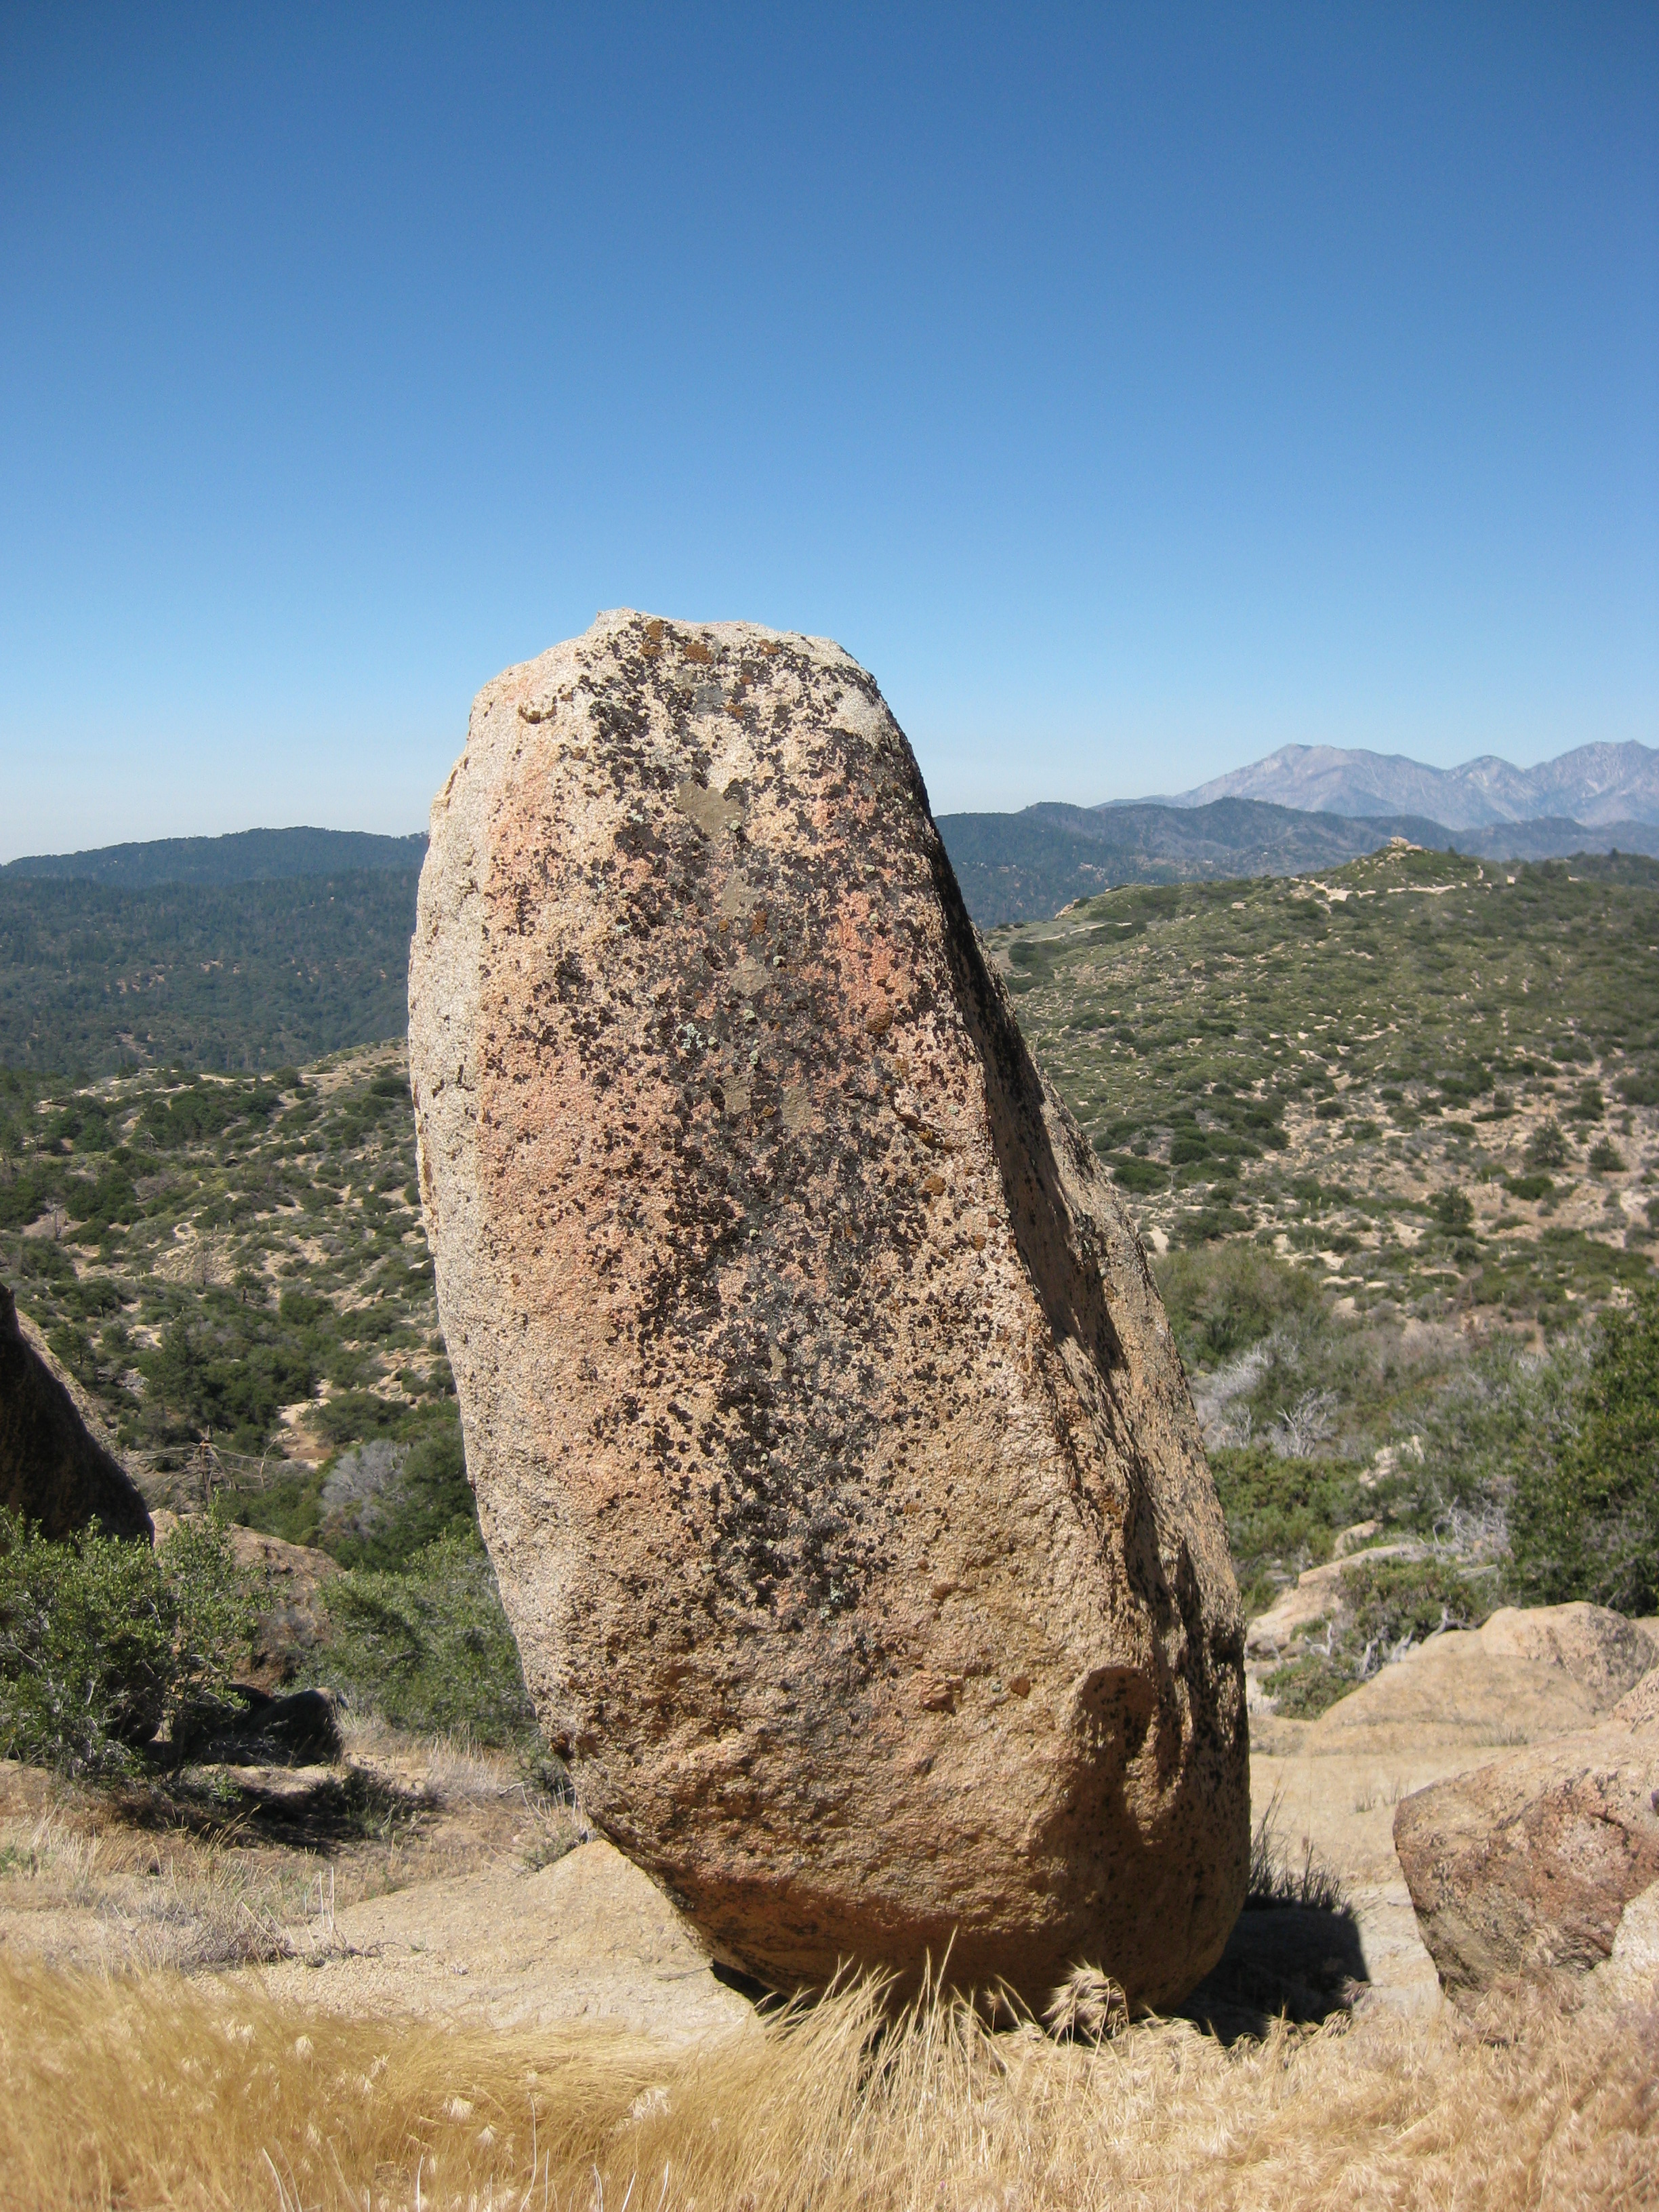
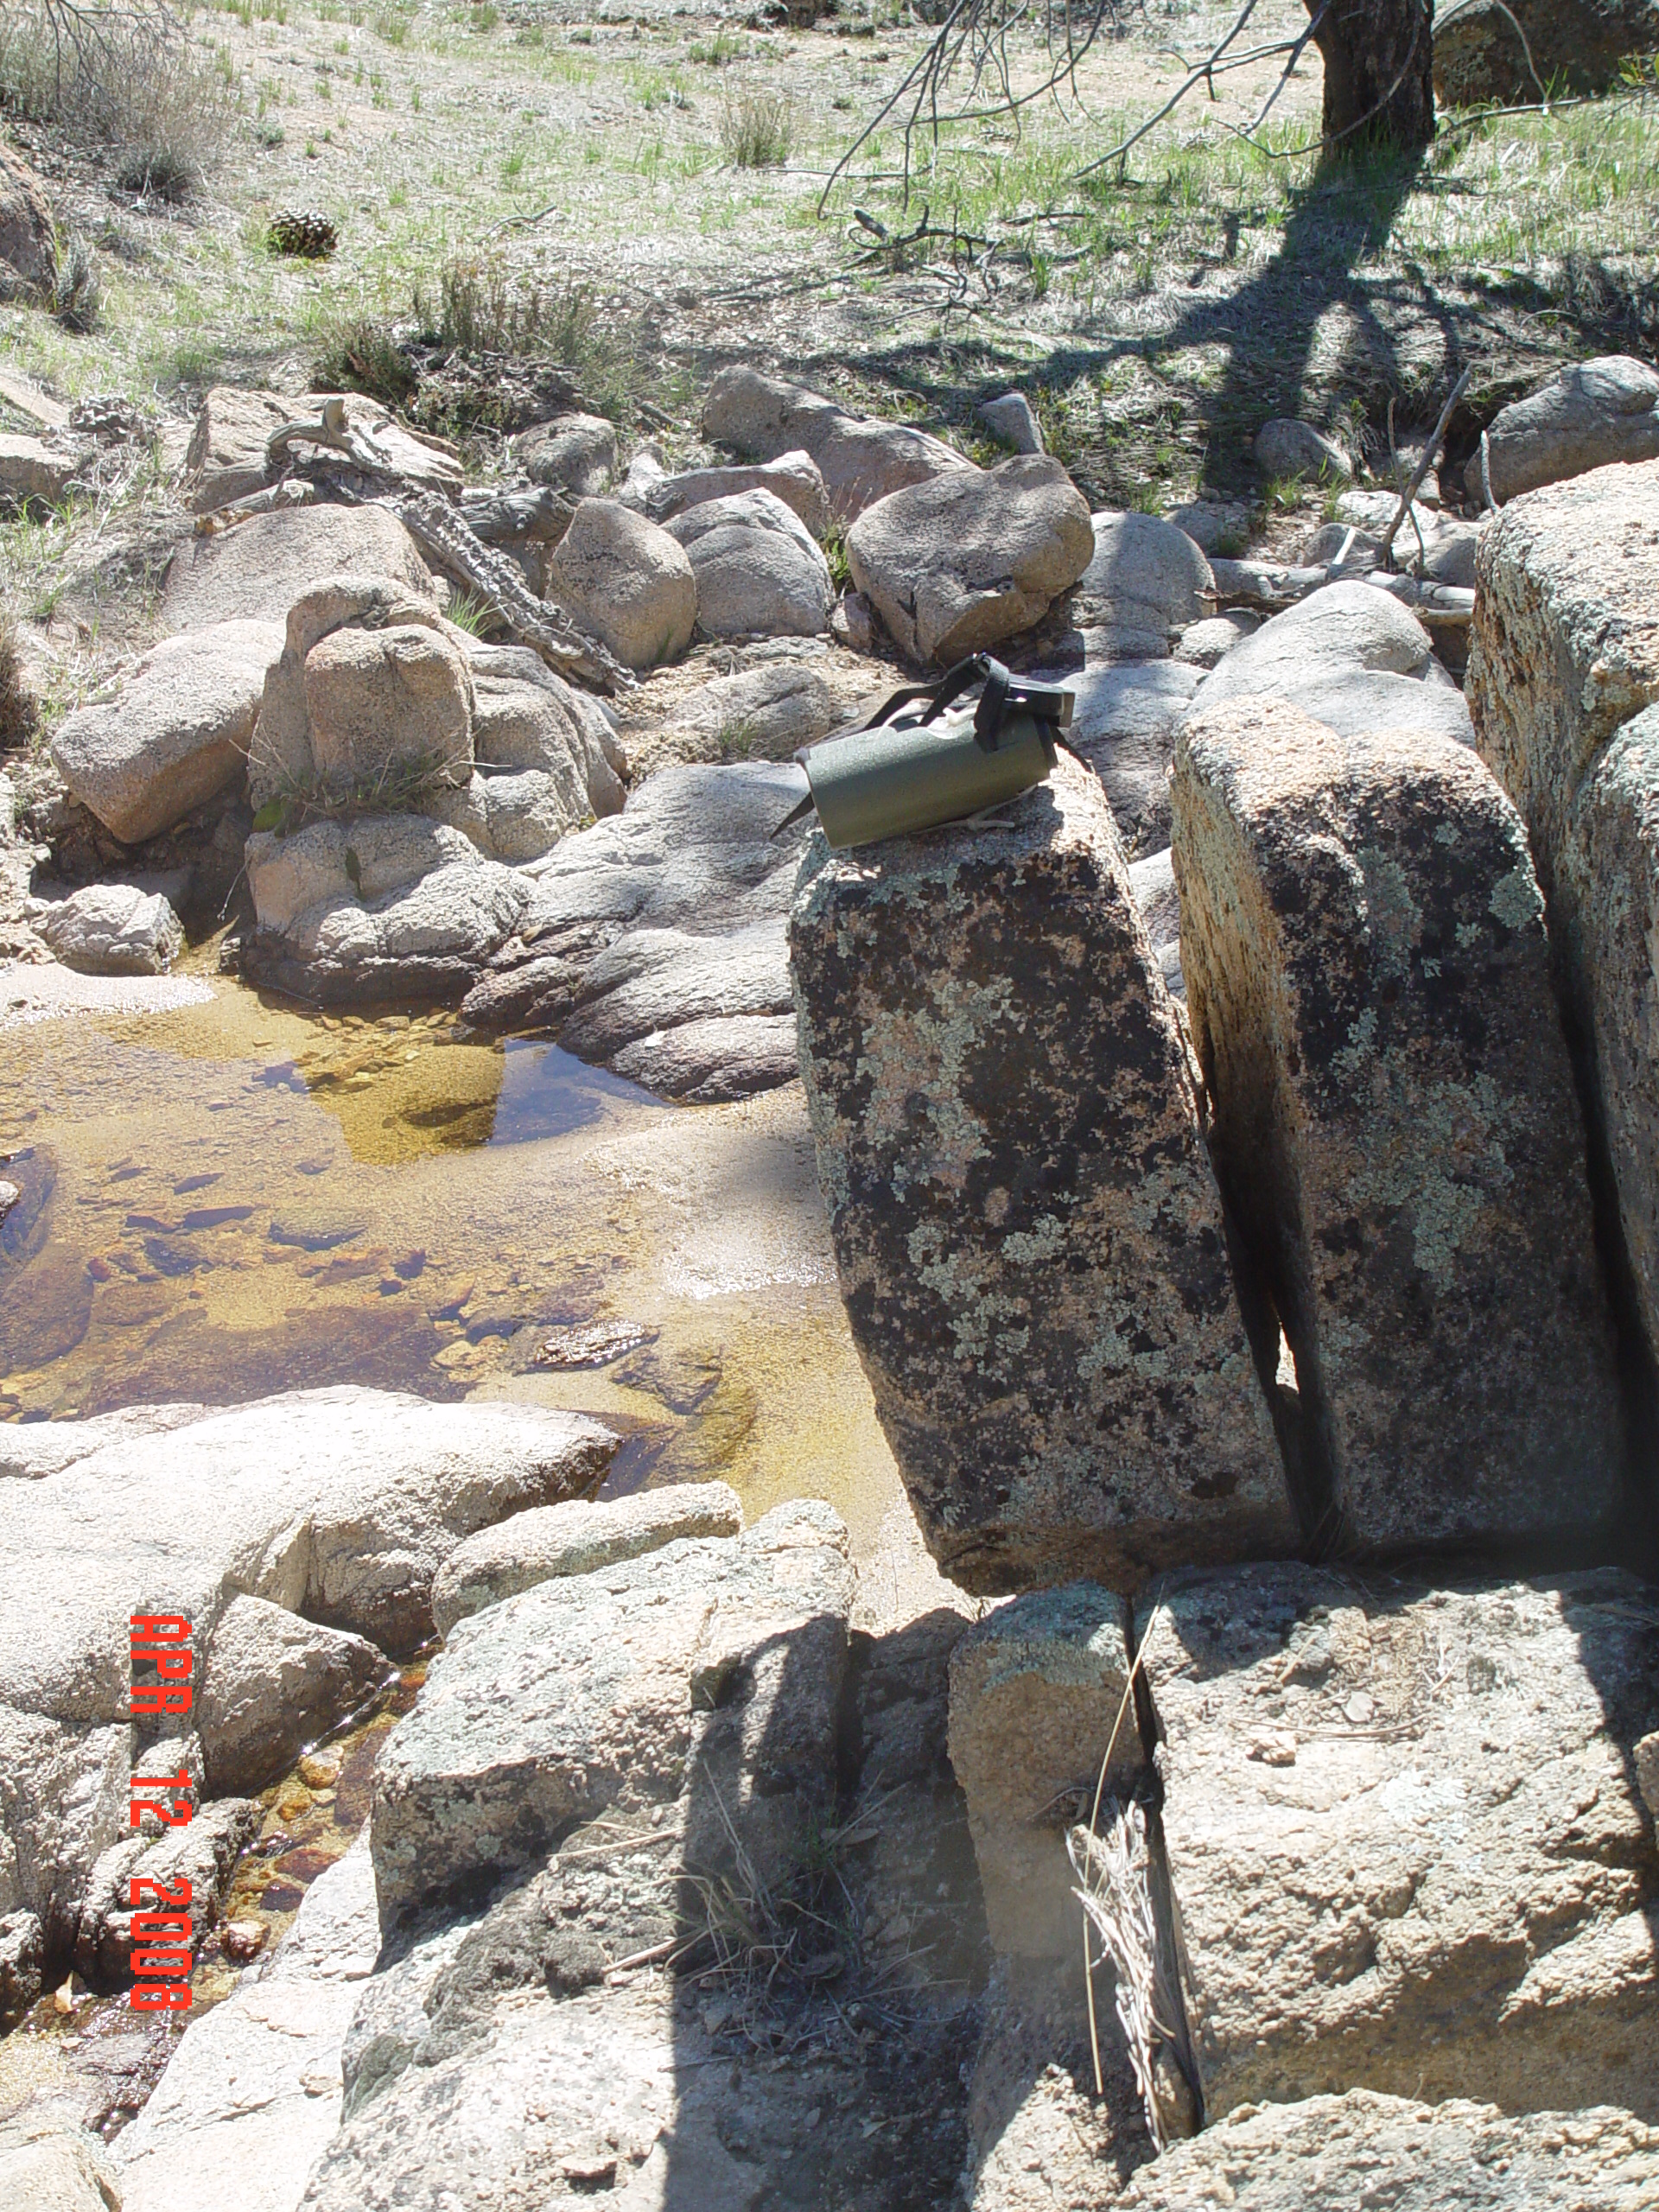
Figure S3. Unnamed fragile rock in Grass Valley area.
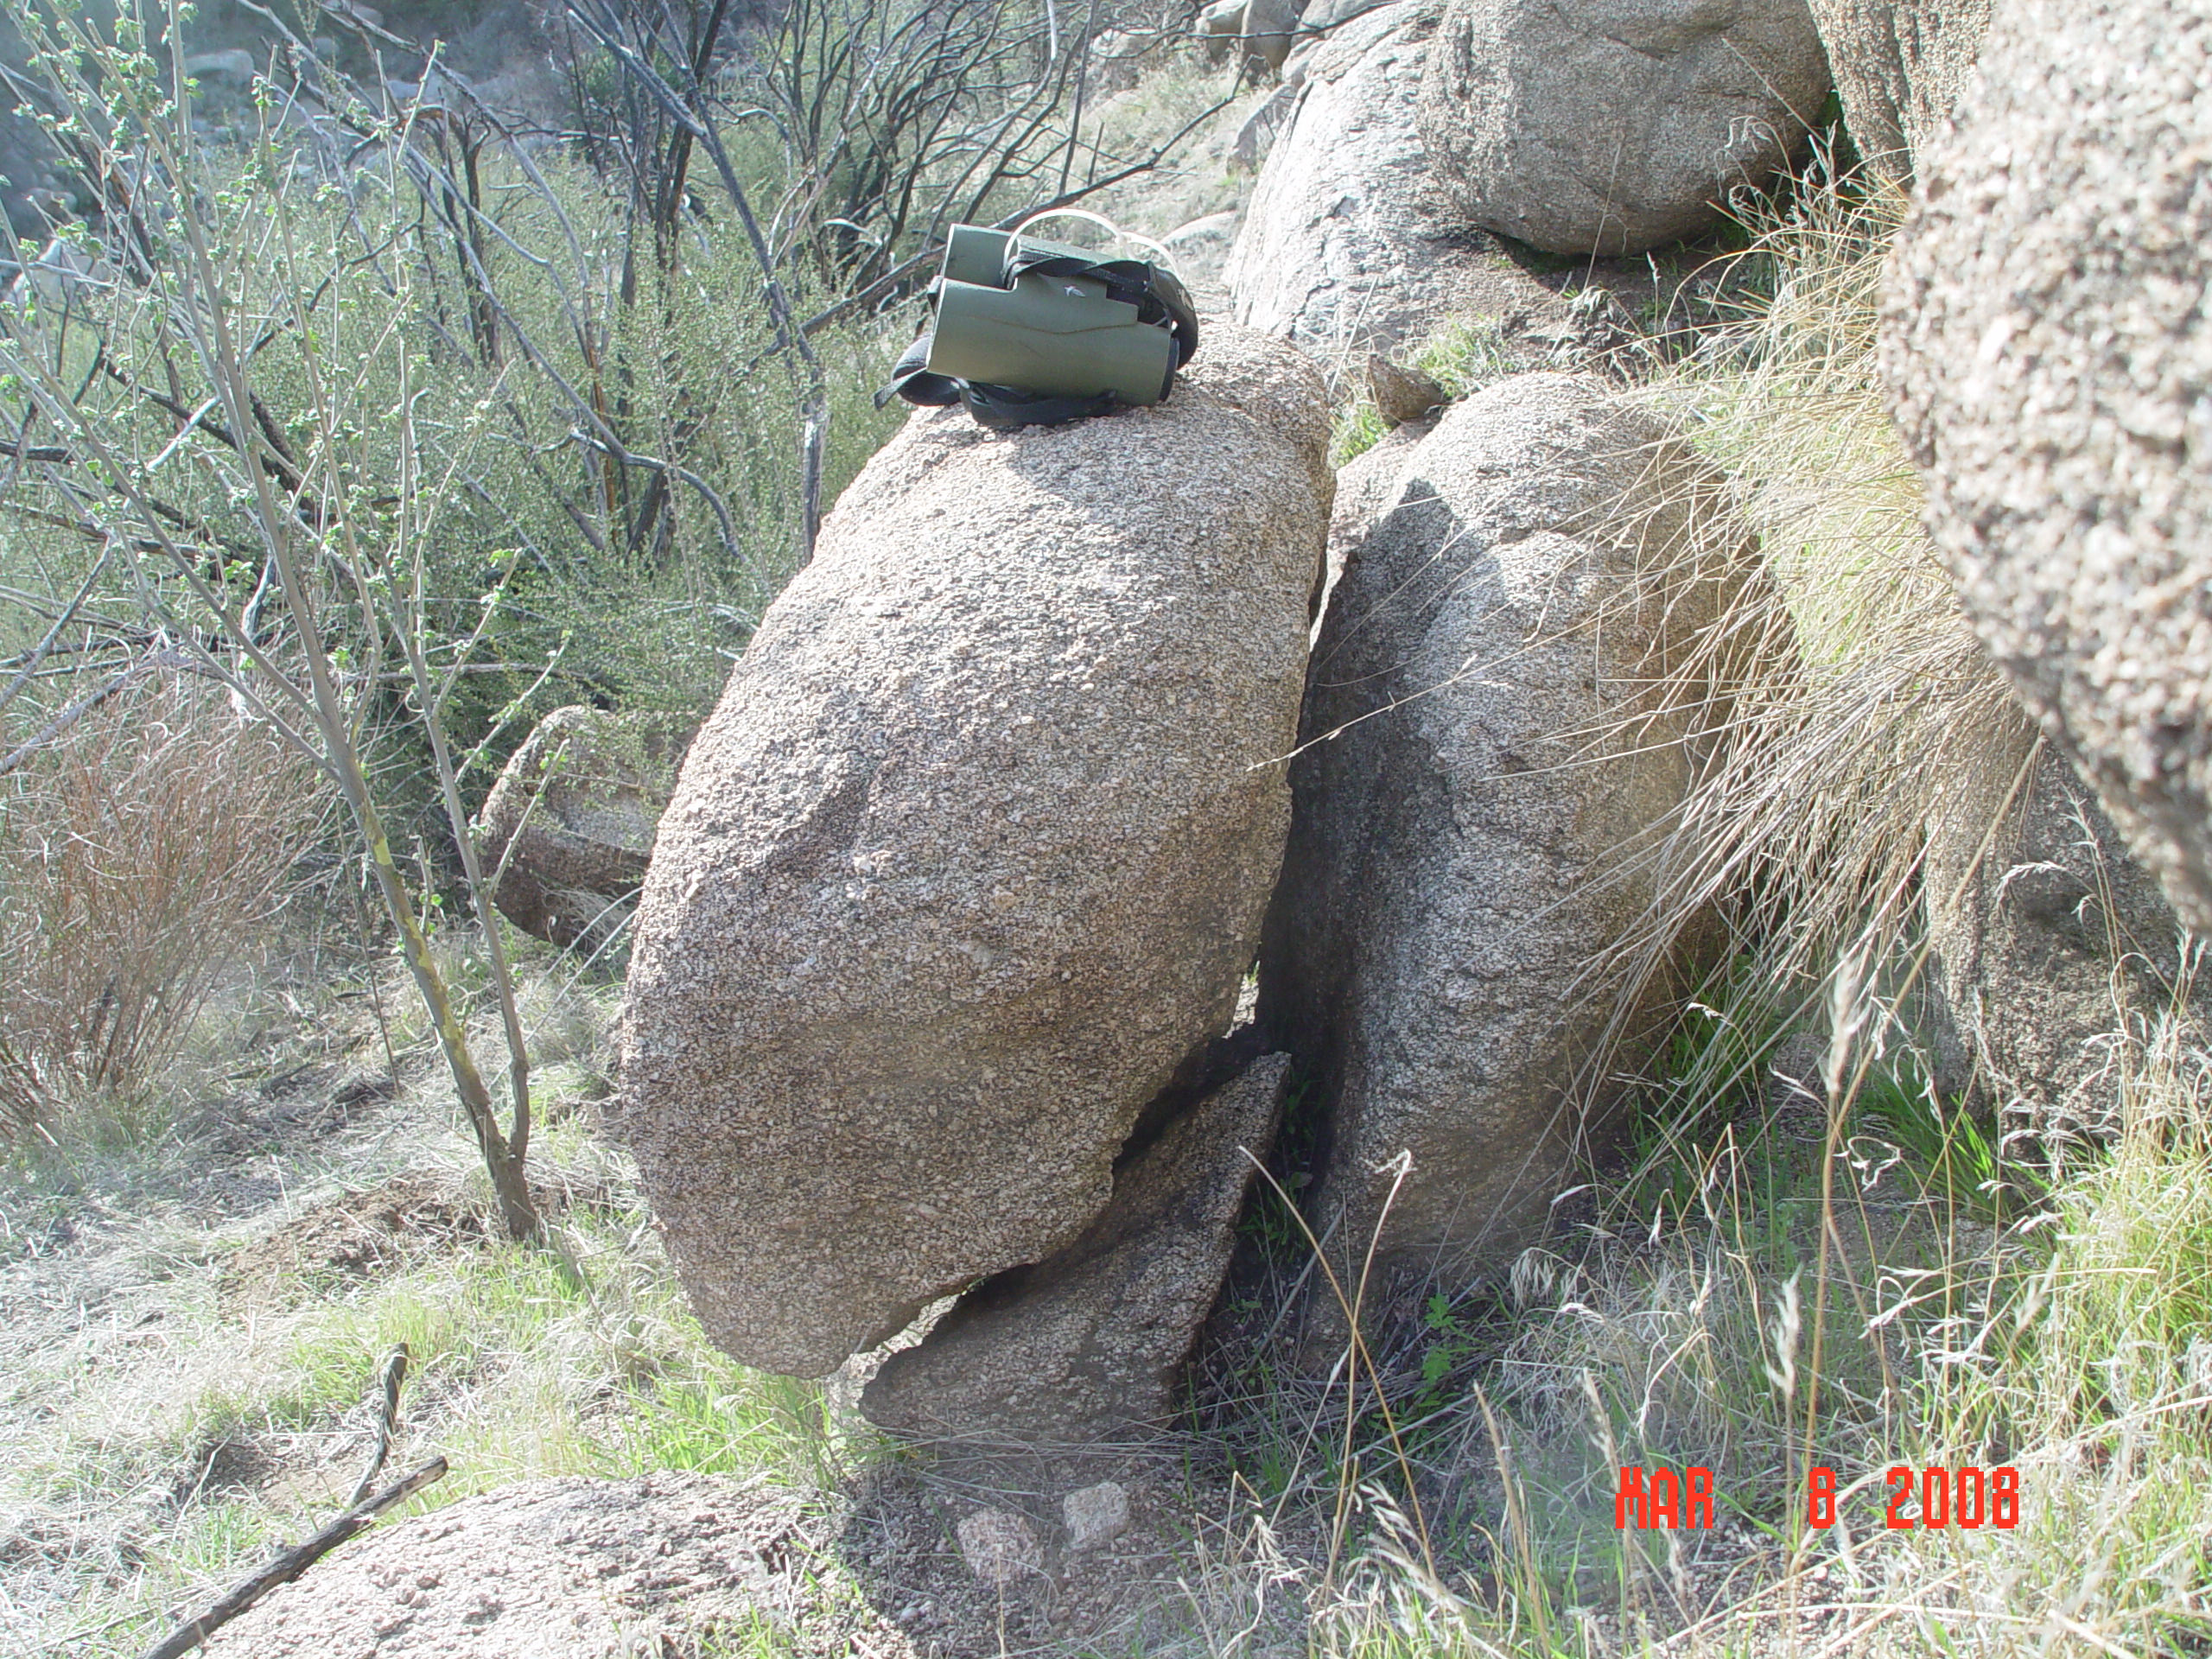
Figure S4. Unnamed fragile rock in Grass Valley area.
Figure S5. Unnamed fragile rock in Grass Valley area.
Figure S6. Unnamed fragile rock near Silverwood Lake.
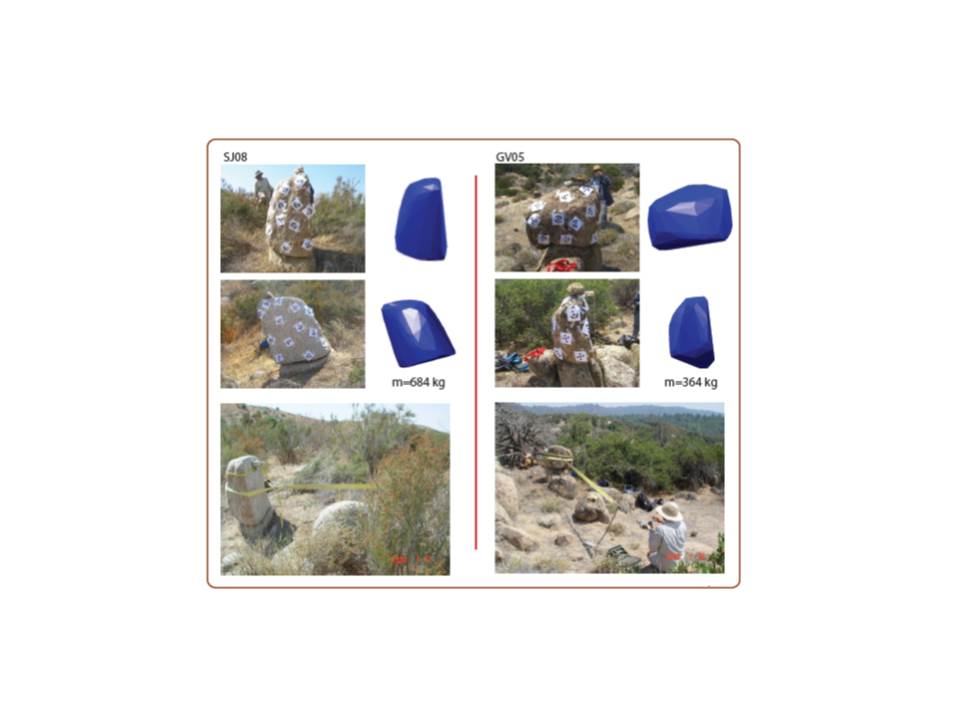
Figure S7. Photographs of two quasi-static toppling, or tilt, tests carried out in the field. Rock SJ08 is located south of Beaumont near the San Jacinto fault; rock GV05 is located north of San Bernardino near the San Andreas fault. Each rock is pulled (or pushed) by a horizontal force through its center of mass until it begins to rotate about one of its two rocking points (O1 and O2 in Fig. S8). For each rock, the shapes generated by photogrammetry and the corresponding photographs are juxtaposed.
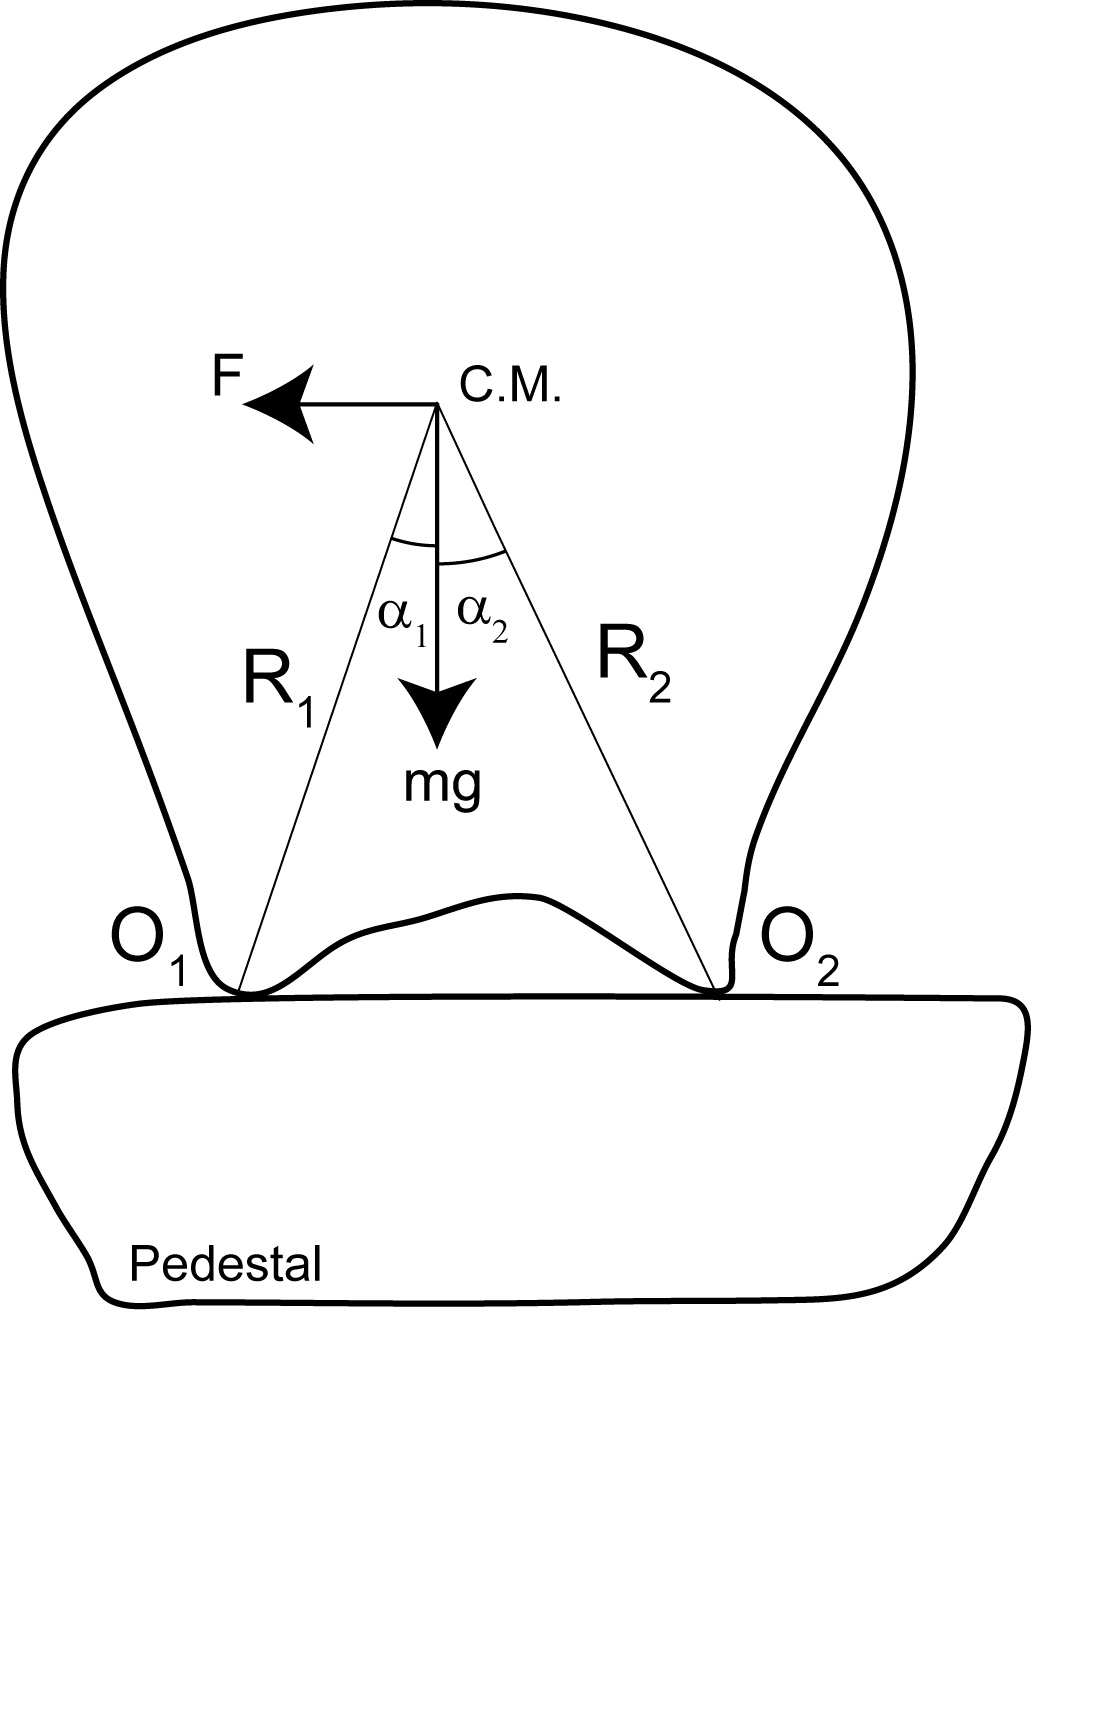
Figure S8. Diagram illustrating the derivation and geometrical relationships of fragility parameters that are derived from field testing and photomodeling of PBRs. R1 and R2 are the distances from the center of mass (C.M.) of the rock to the rocking points, O1 and O2, respectively. The angles (α1 and α2) are measured from the vertical to the lines connecting the center of mass to the rocking points. Force of gravity (mg) and the force required to tilt the rock (F) are illustrated with arrows. Modified from Anooshehpoor et al. (2002, 2004) and Purvance et al. (2008).
Figure S9. Plots of tilt angle versus quasi-static toppling force in two different directions for rock SJ08 are shown here. The plot on the left is for a pulling azimuth of 50°, and the plot on the right is for a pulling azimuth of 260°. The α values of 0.16 and 0.44 rad, corresponding to peak normalized forces of 0.17 and 0.42, are obtained from the intersection of the blue tangent lines with the inclination axis. However, the experimental peak normalized forces are about 0.14 and 0.39. The values of α = 0.13 rad and α = 0.36 rad listed in Table S1 are the corrected values. This reduction in the value of α is due to the complex contact area between the rock and the pedestal.
Table S1. Measured fragility parameters from tilt tests and the parameters estimated from photomodeling. Measurements of tilt-test tipping angles α1 and α2 were made as shown in Figures S7–S9. For rocks GV03 and SJ08, alphas obtained from photomodeling are shown for comparison with the results of tilt tests. Rock GV02 was tilt tested, but it rotated during testing, thereby reducing confidence in the reliability of the measurement. Results for GV02 are presented for completeness but are not included in our analysis. For rock SW01, steep terrain prevented tilt testing. The fragility of SW01 is estimated from photomodeling. Purvance et al. (2008) verified the fragility analysis methods using shake table experiments.
Anderson, J. G., J. N. Brune, G. Biasi, A. Anooshehpoor, and M. Purvance (2011). Workshop report: Applications of precarious rocks and related fragile geological features to U.S. National Hazard Maps, Seismol. Res. Lett. 82, no. 3, 431–441.
Anooshehpoor, A., and J. N. Brune (2002). Verification of precarious methodology using shake table tests of rock models, Soil Dynam. Earthq. Eng. 22, 917–922, doi: 10.1016/S0267-7261(02)00115-X.
Anooshehpoor, A., J. N. Brune, and Y. Zeng (2004). Methodology for obtaining constraints on ground motion from precariously balanced rocks, Bull. Seismol. Soc. Am. 94, no. 1, 285–303.
Purvance, M. D., A. Anooshehpoor, and J. Brune (2008). Freestanding block overturning fragilities: Numerical simulation and experimental validation, Earthq. Eng. Struct. Dynam. 37, 791–808.
U.S. Geological Survey (2008). Quaternary Fault and Fold Database of the United States, available at http//earthquakes.usgs.gov/regional/qfaults/ (last accessed August 2008).
[ Back ]