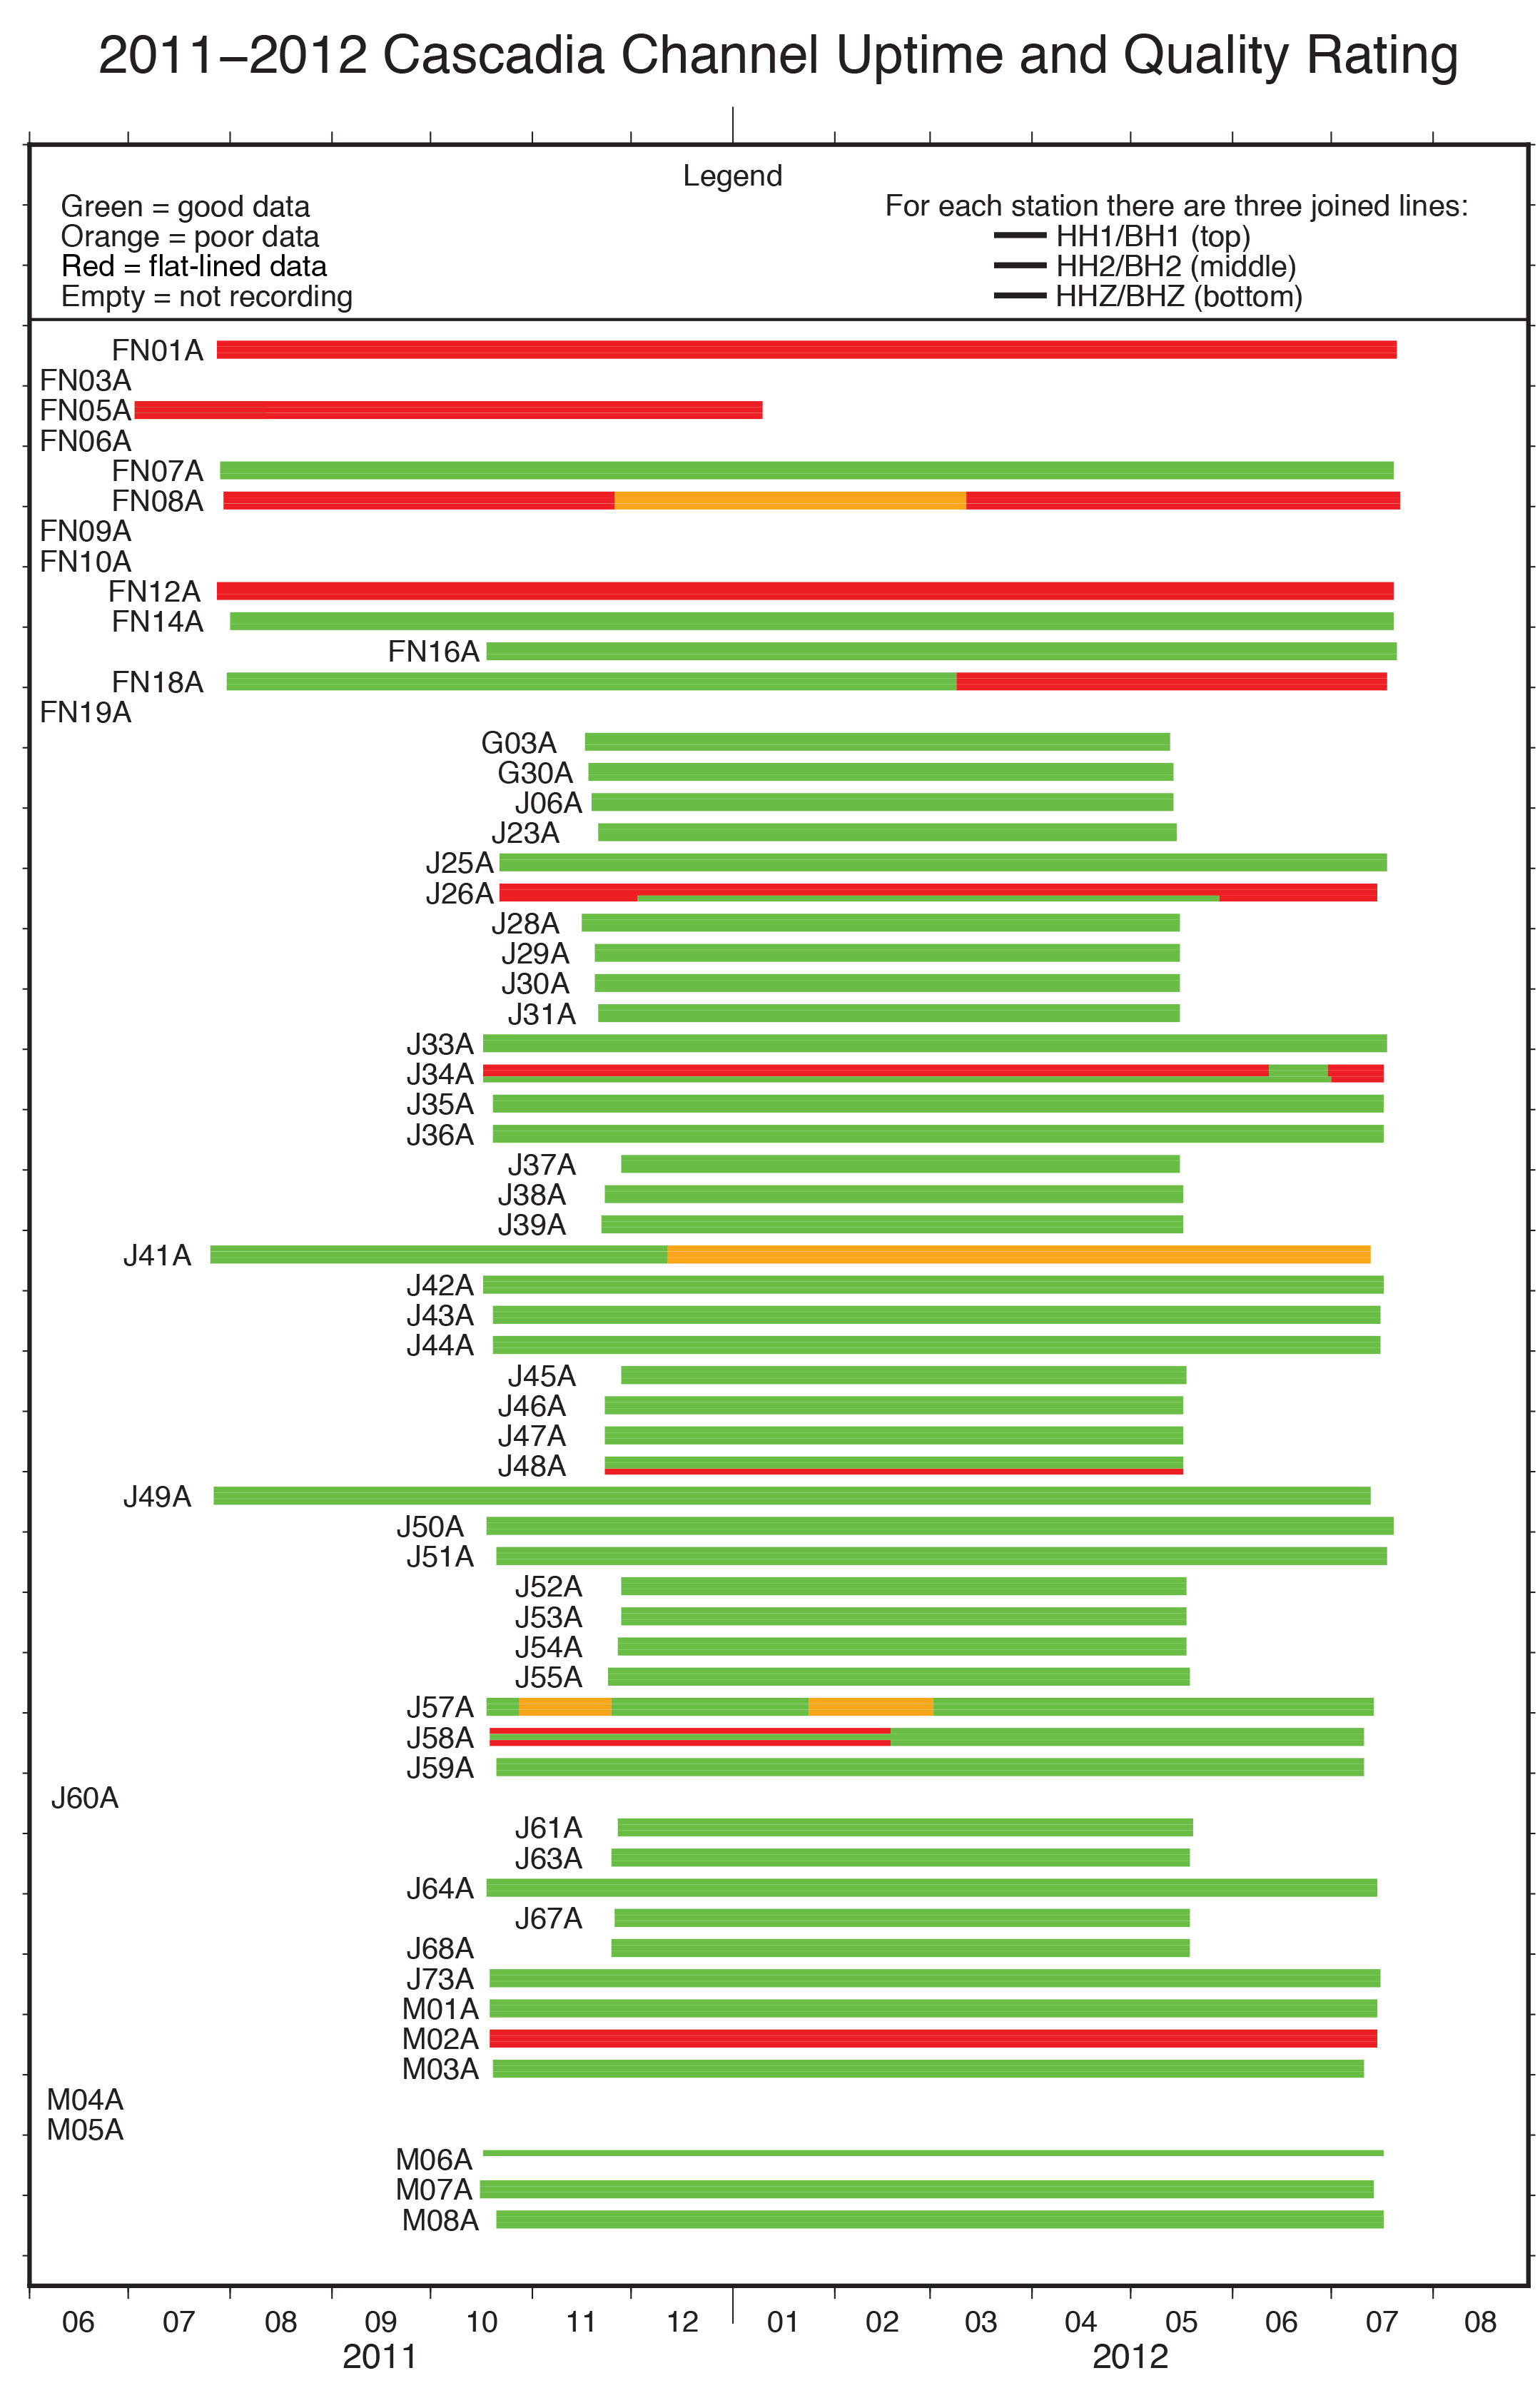
These three figures in this electronic supplement show the channel uptime and quality for each of the first three years of deployment. The three horizontal bars for each station represent the status of the two horizontal channels and one vertical channel, respectively, over the duration of the deployment. Either the HH[1,2,Z] or BH[1,2,Z] channels are shown, depending on the sampling rate of the instrument. The quality of each instrument channel is shown by the color: green is high-quality data; orange is noisy, yet possibly useful data; and red is flat-lined data. If there are no horizontal bars for a station, data were not recovered. For instance, station FN14A recorded high-quality data for the entire duration of the deployment on all three channels, whereas station FN09A did not record any data, M02A only recorded flat-lined data, and M06A only recorded one of the horizontal components. Figure 4 of the main article identifies the summary station quality in map view. Note that these plots are meant as an initial guide for station performance, and investigators need to make their own assessment of the data quality needed for their research purposes.
Figure S1. The Cascadia Initiative year 1 (2011–2012) channel uptime and quality.
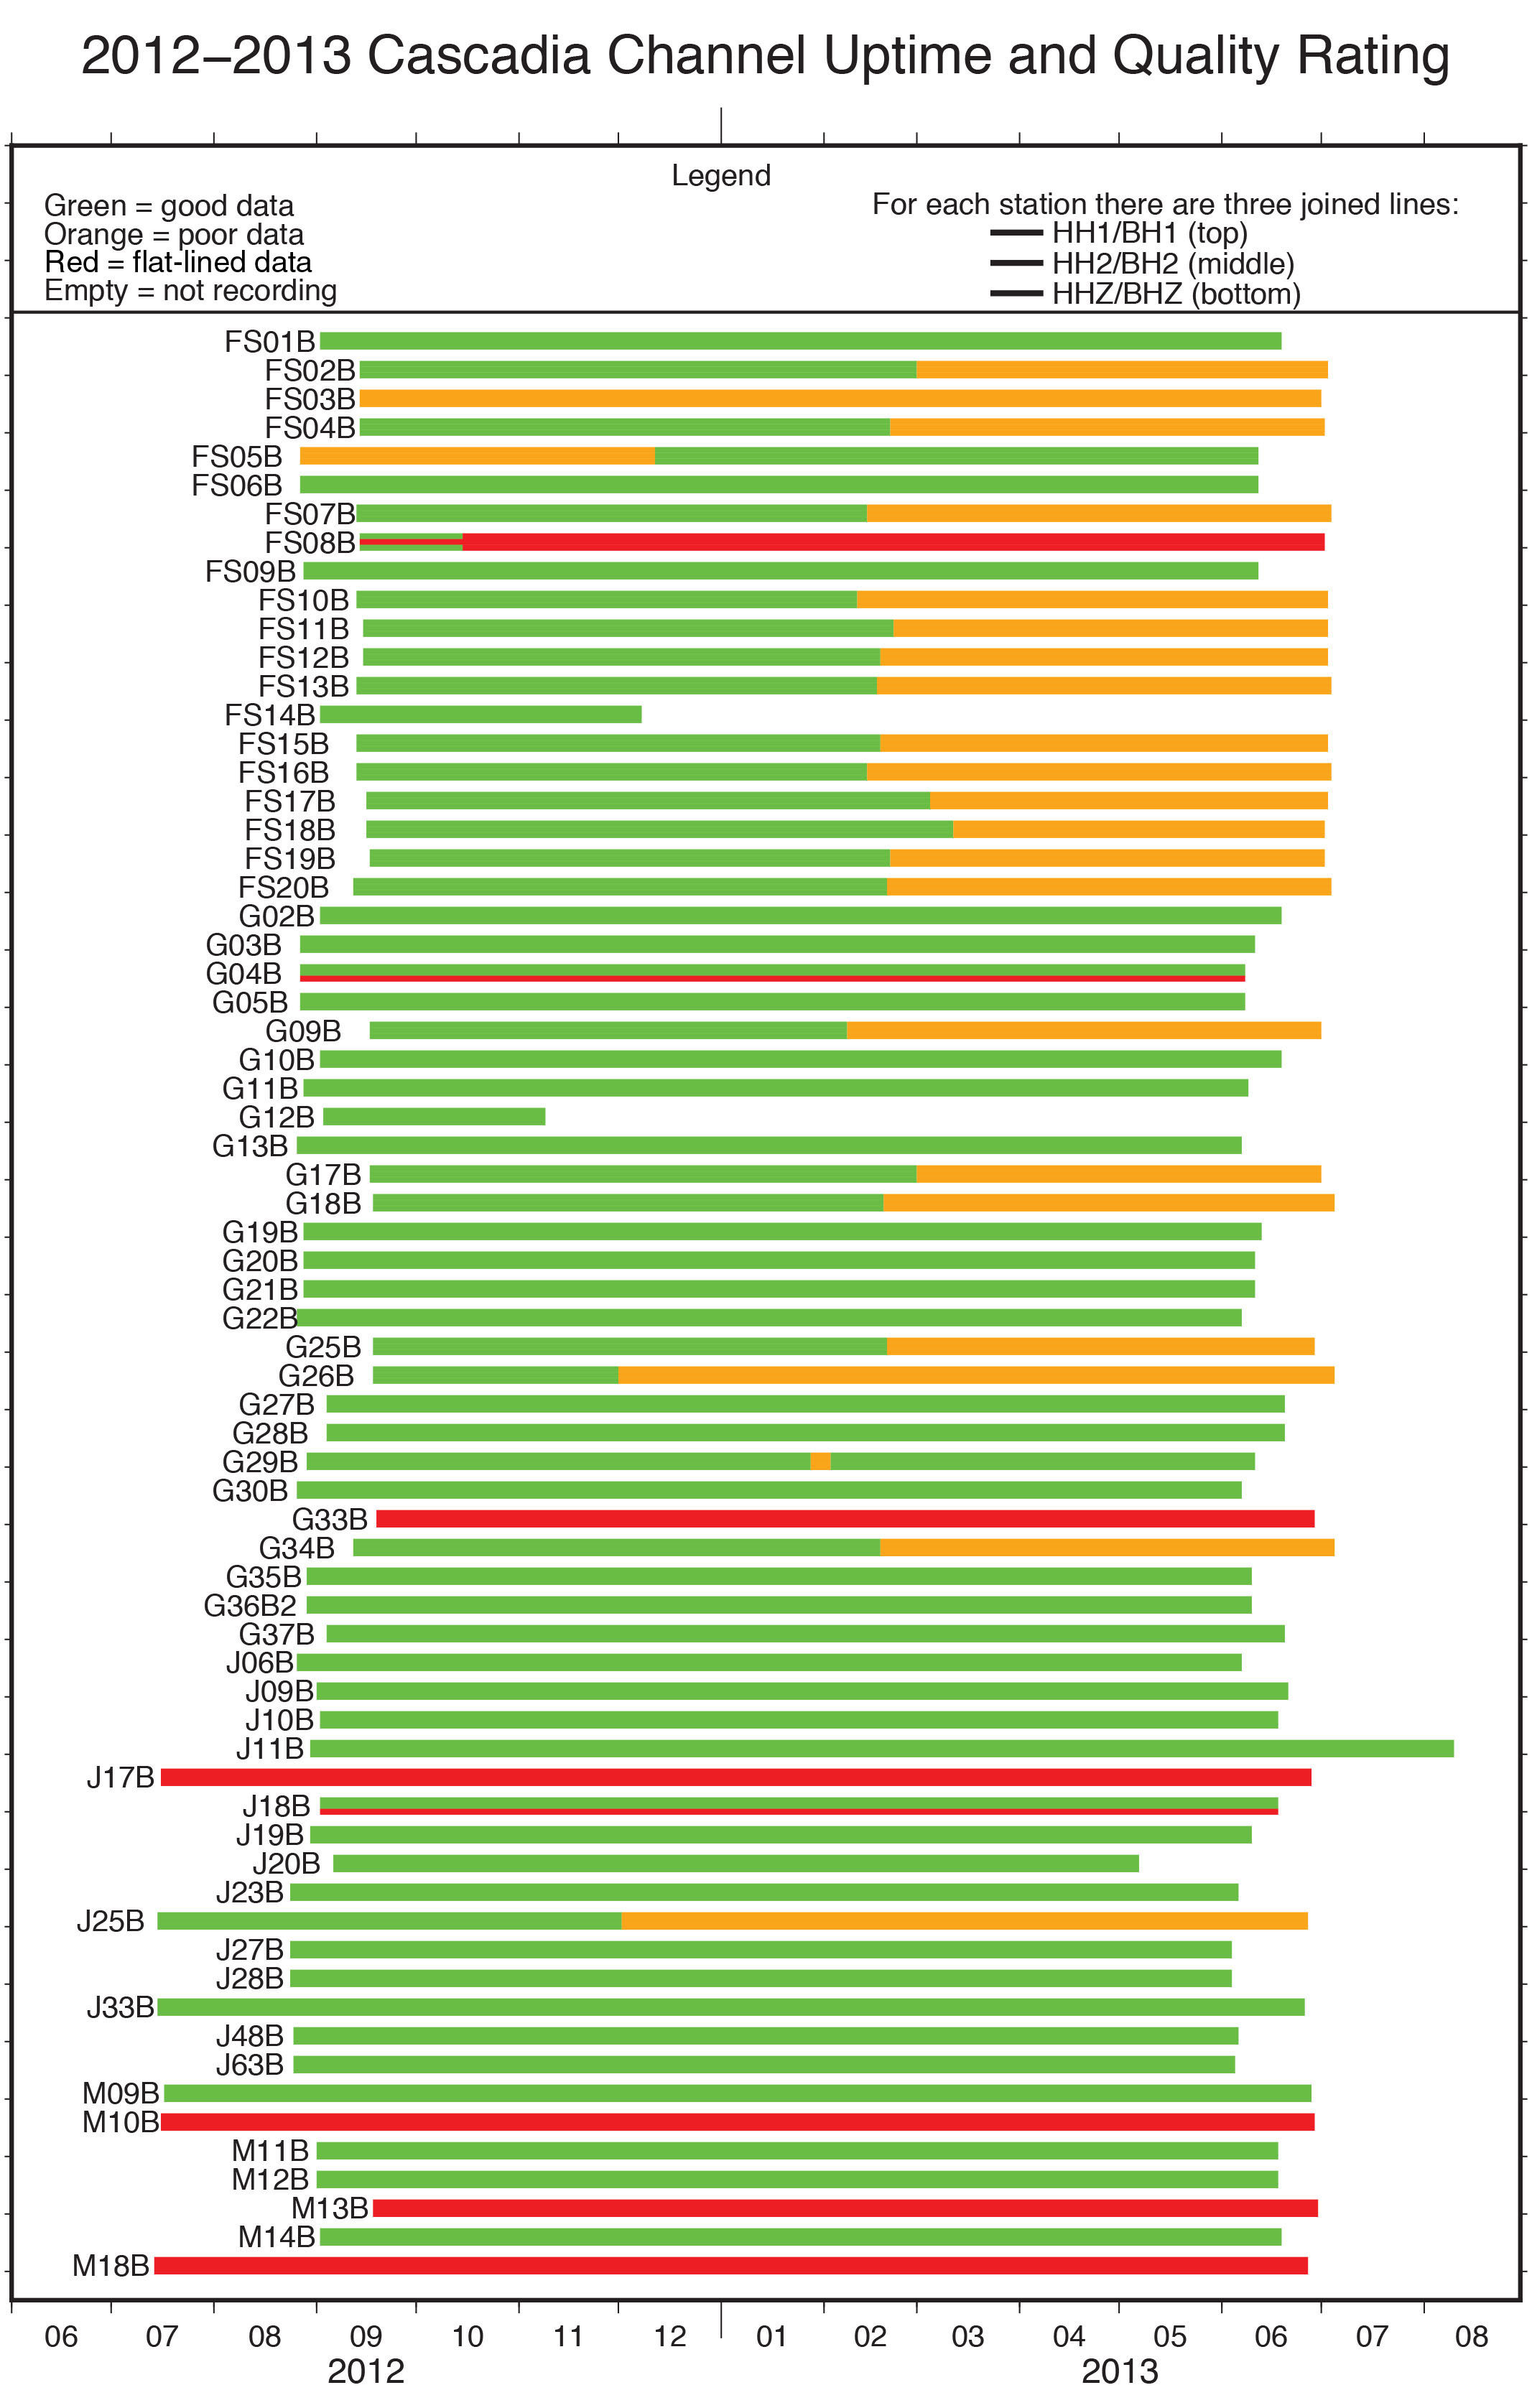
Figure S2. The Cascadia Initiative year 2 (2012−2013) channel uptime and quality.
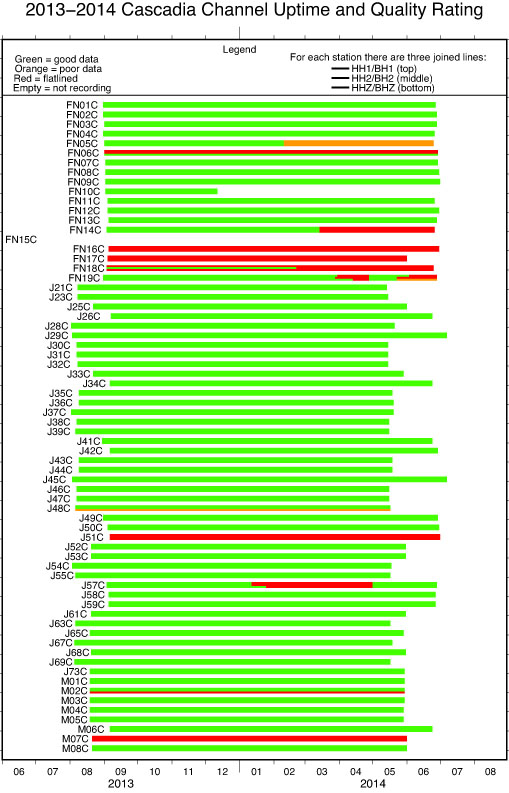
Figure S3. The Cascadia Initiative year 3 (2013−2014) channel uptime and quality.
[ Back ]