This electronic supplement contains synthetic test results for noise-added waveforms. In the first test, we add Gaussian noise with standard deviation that is 20% of the waveform amplitude. Because P wave is picked at vertical component and S wave is picked at transverse component, the noise is 20% of P-wave amplitude at the vertical component and 20% of S-wave amplitude at transverse component. Figures S1–S3 show the velocity model changes, arrival-time residuals, and waveform examples of the test. Similarly, Figures S4–S6 show the test results when noise level of 50% of the waveform amplitude is added.
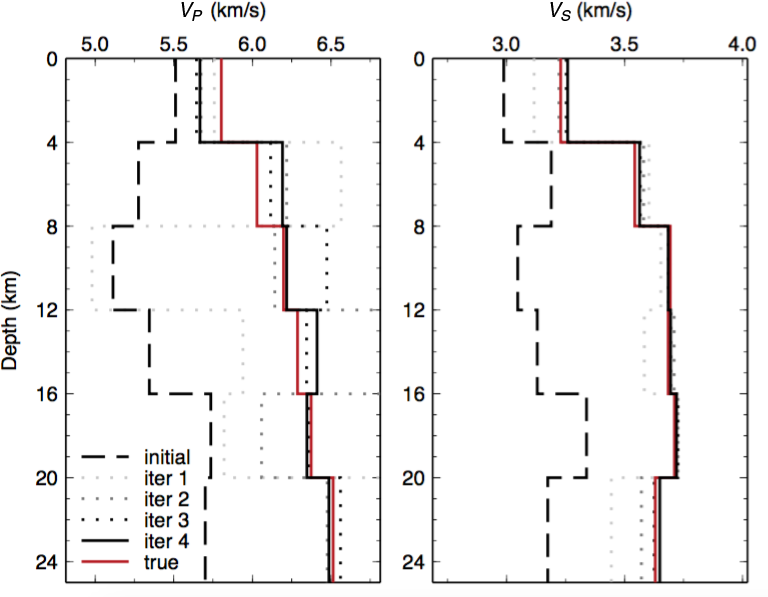
Figure S1. 1D P- and S-velocity models in the synthetic test with 20% amplitude noise added. Symbols are the same as in Figure 3 of the main article.
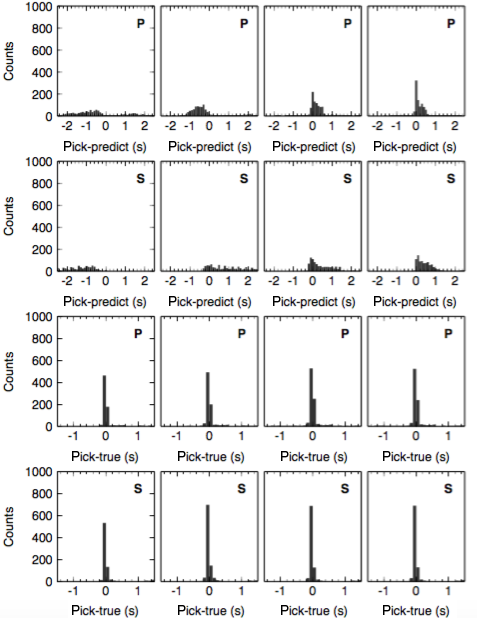
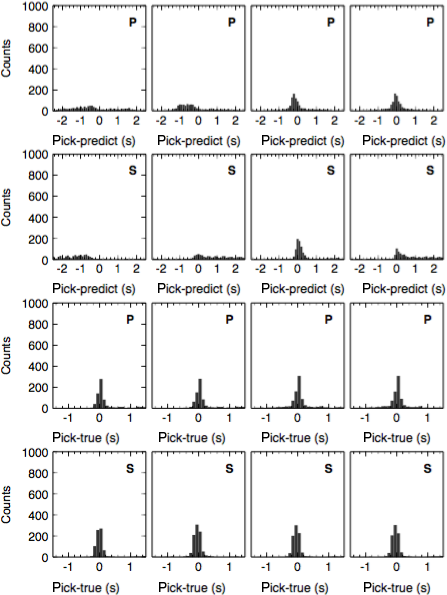
Figure S2. Histograms of P- and S-pick residuals in the end of four iterations in the synthetic test with 20% amplitude noise added. Symbols are the same as in Figure 4 of the main article.
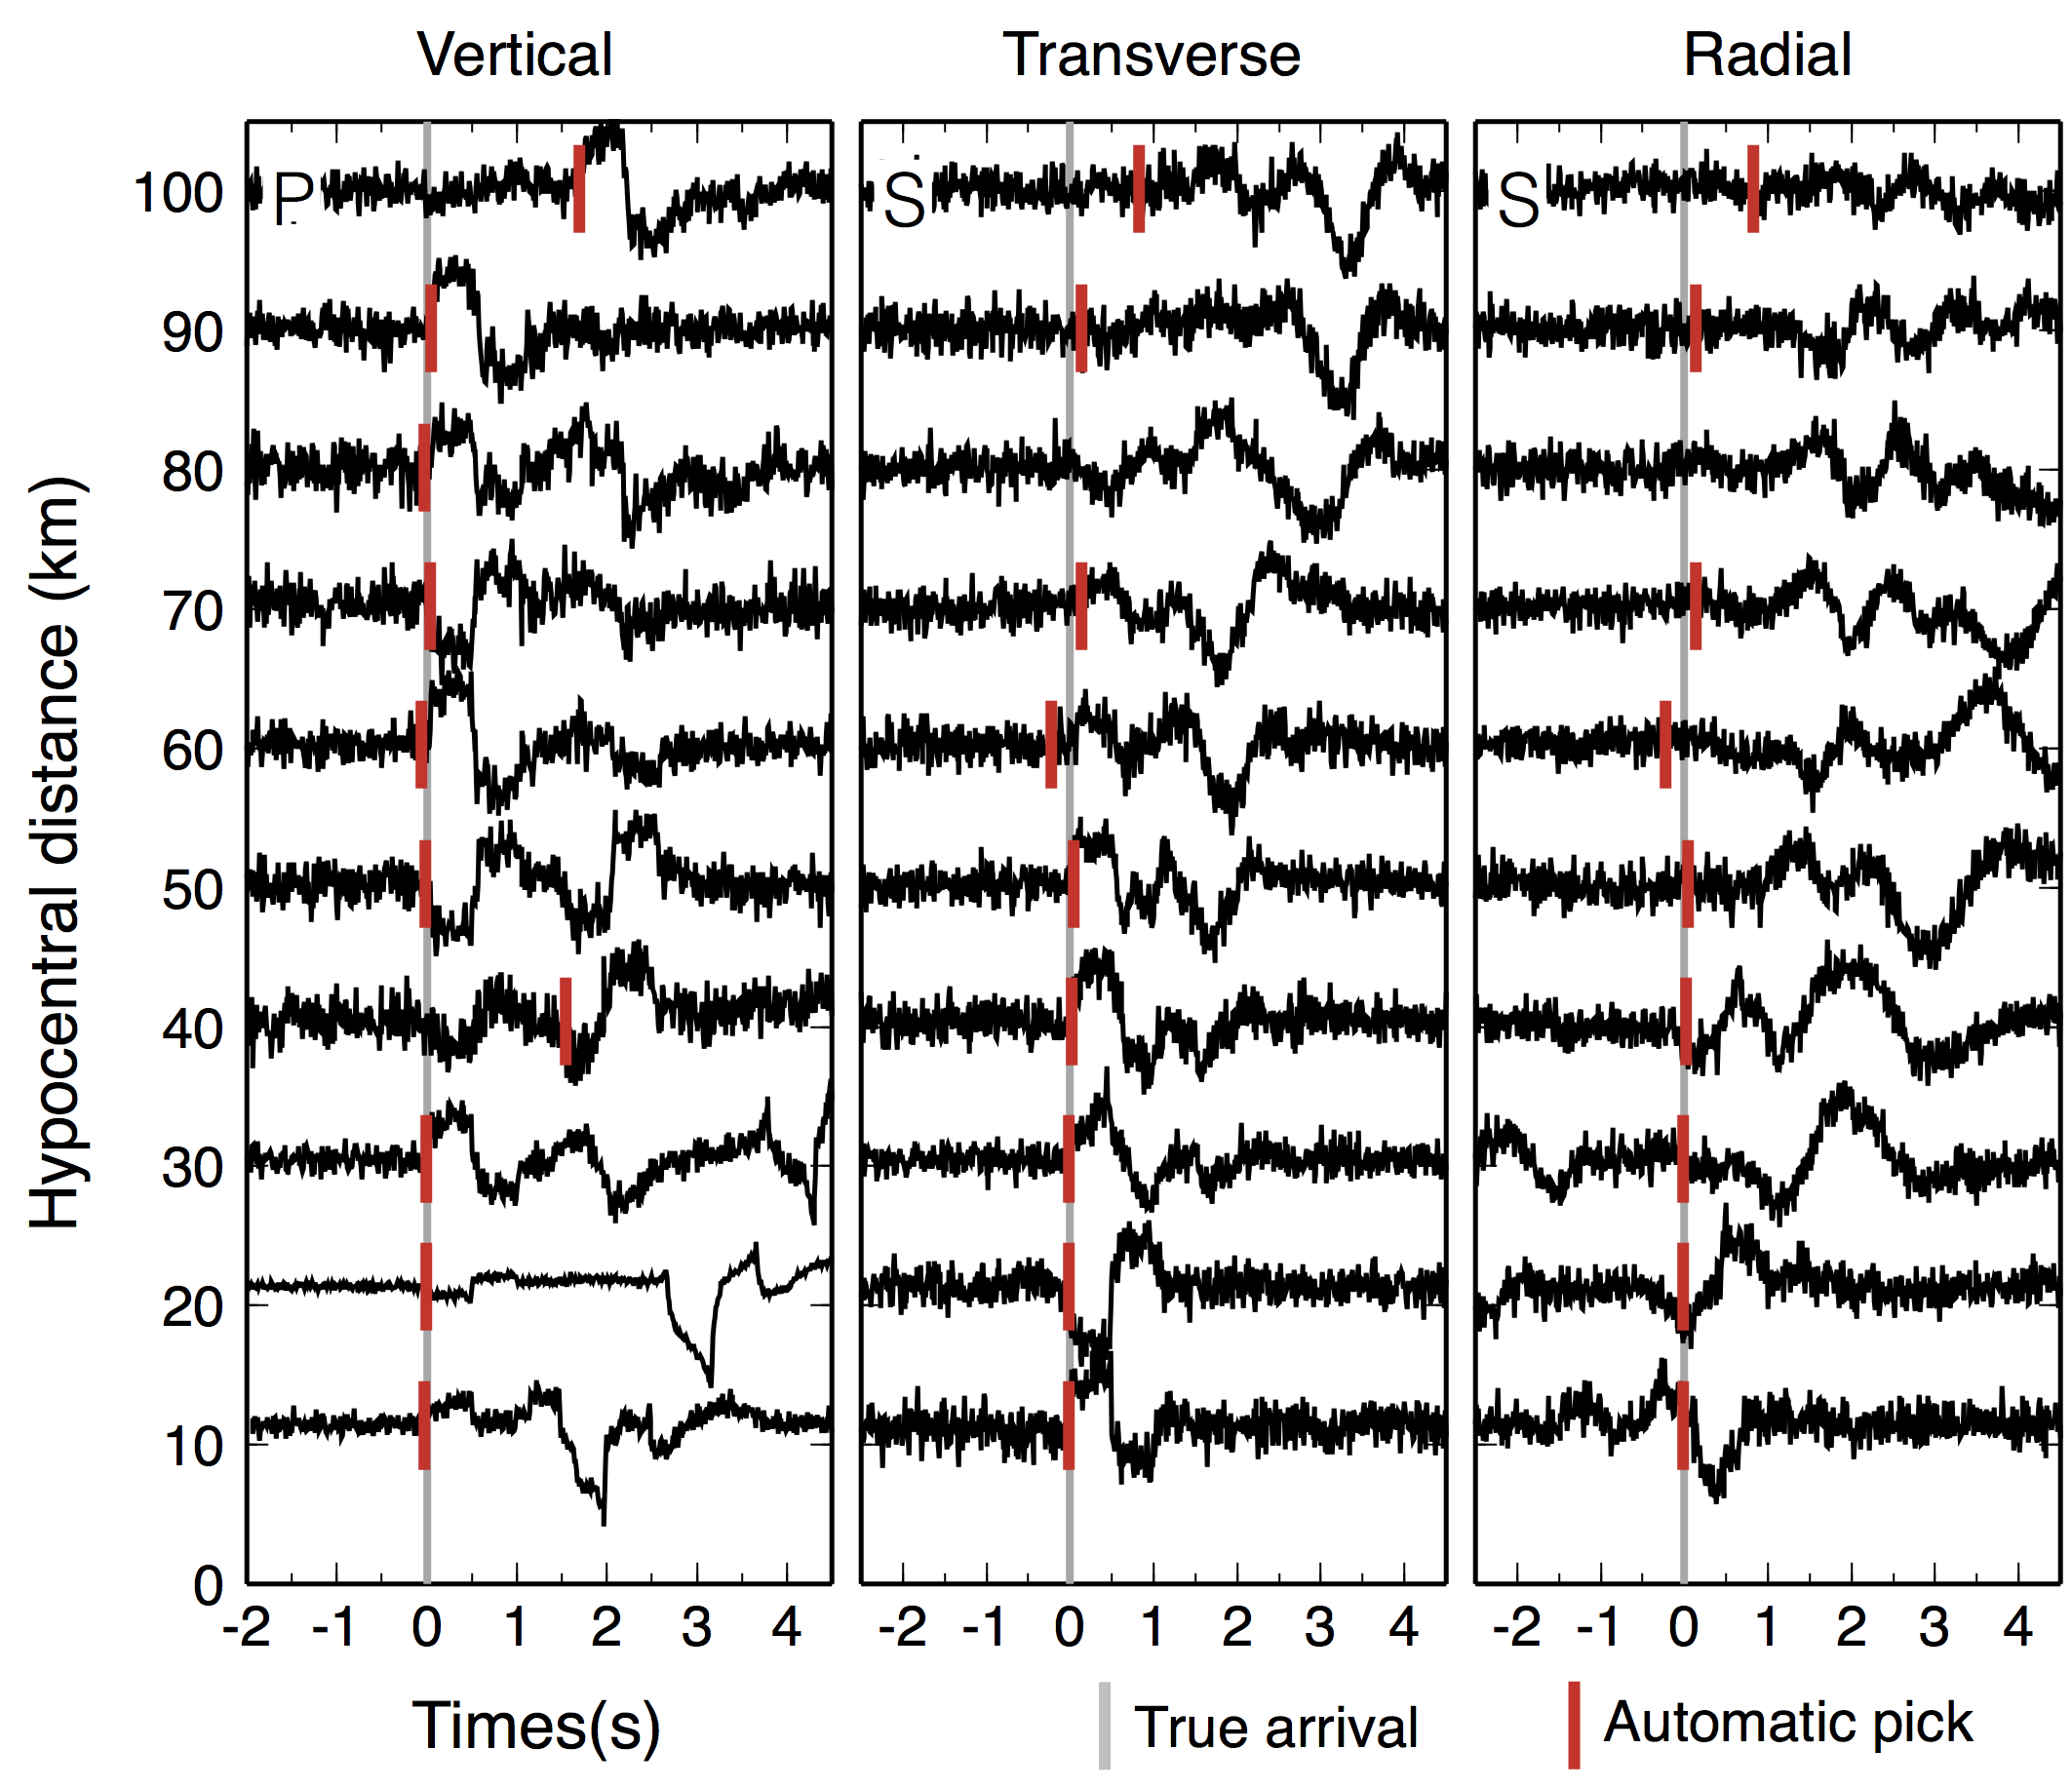
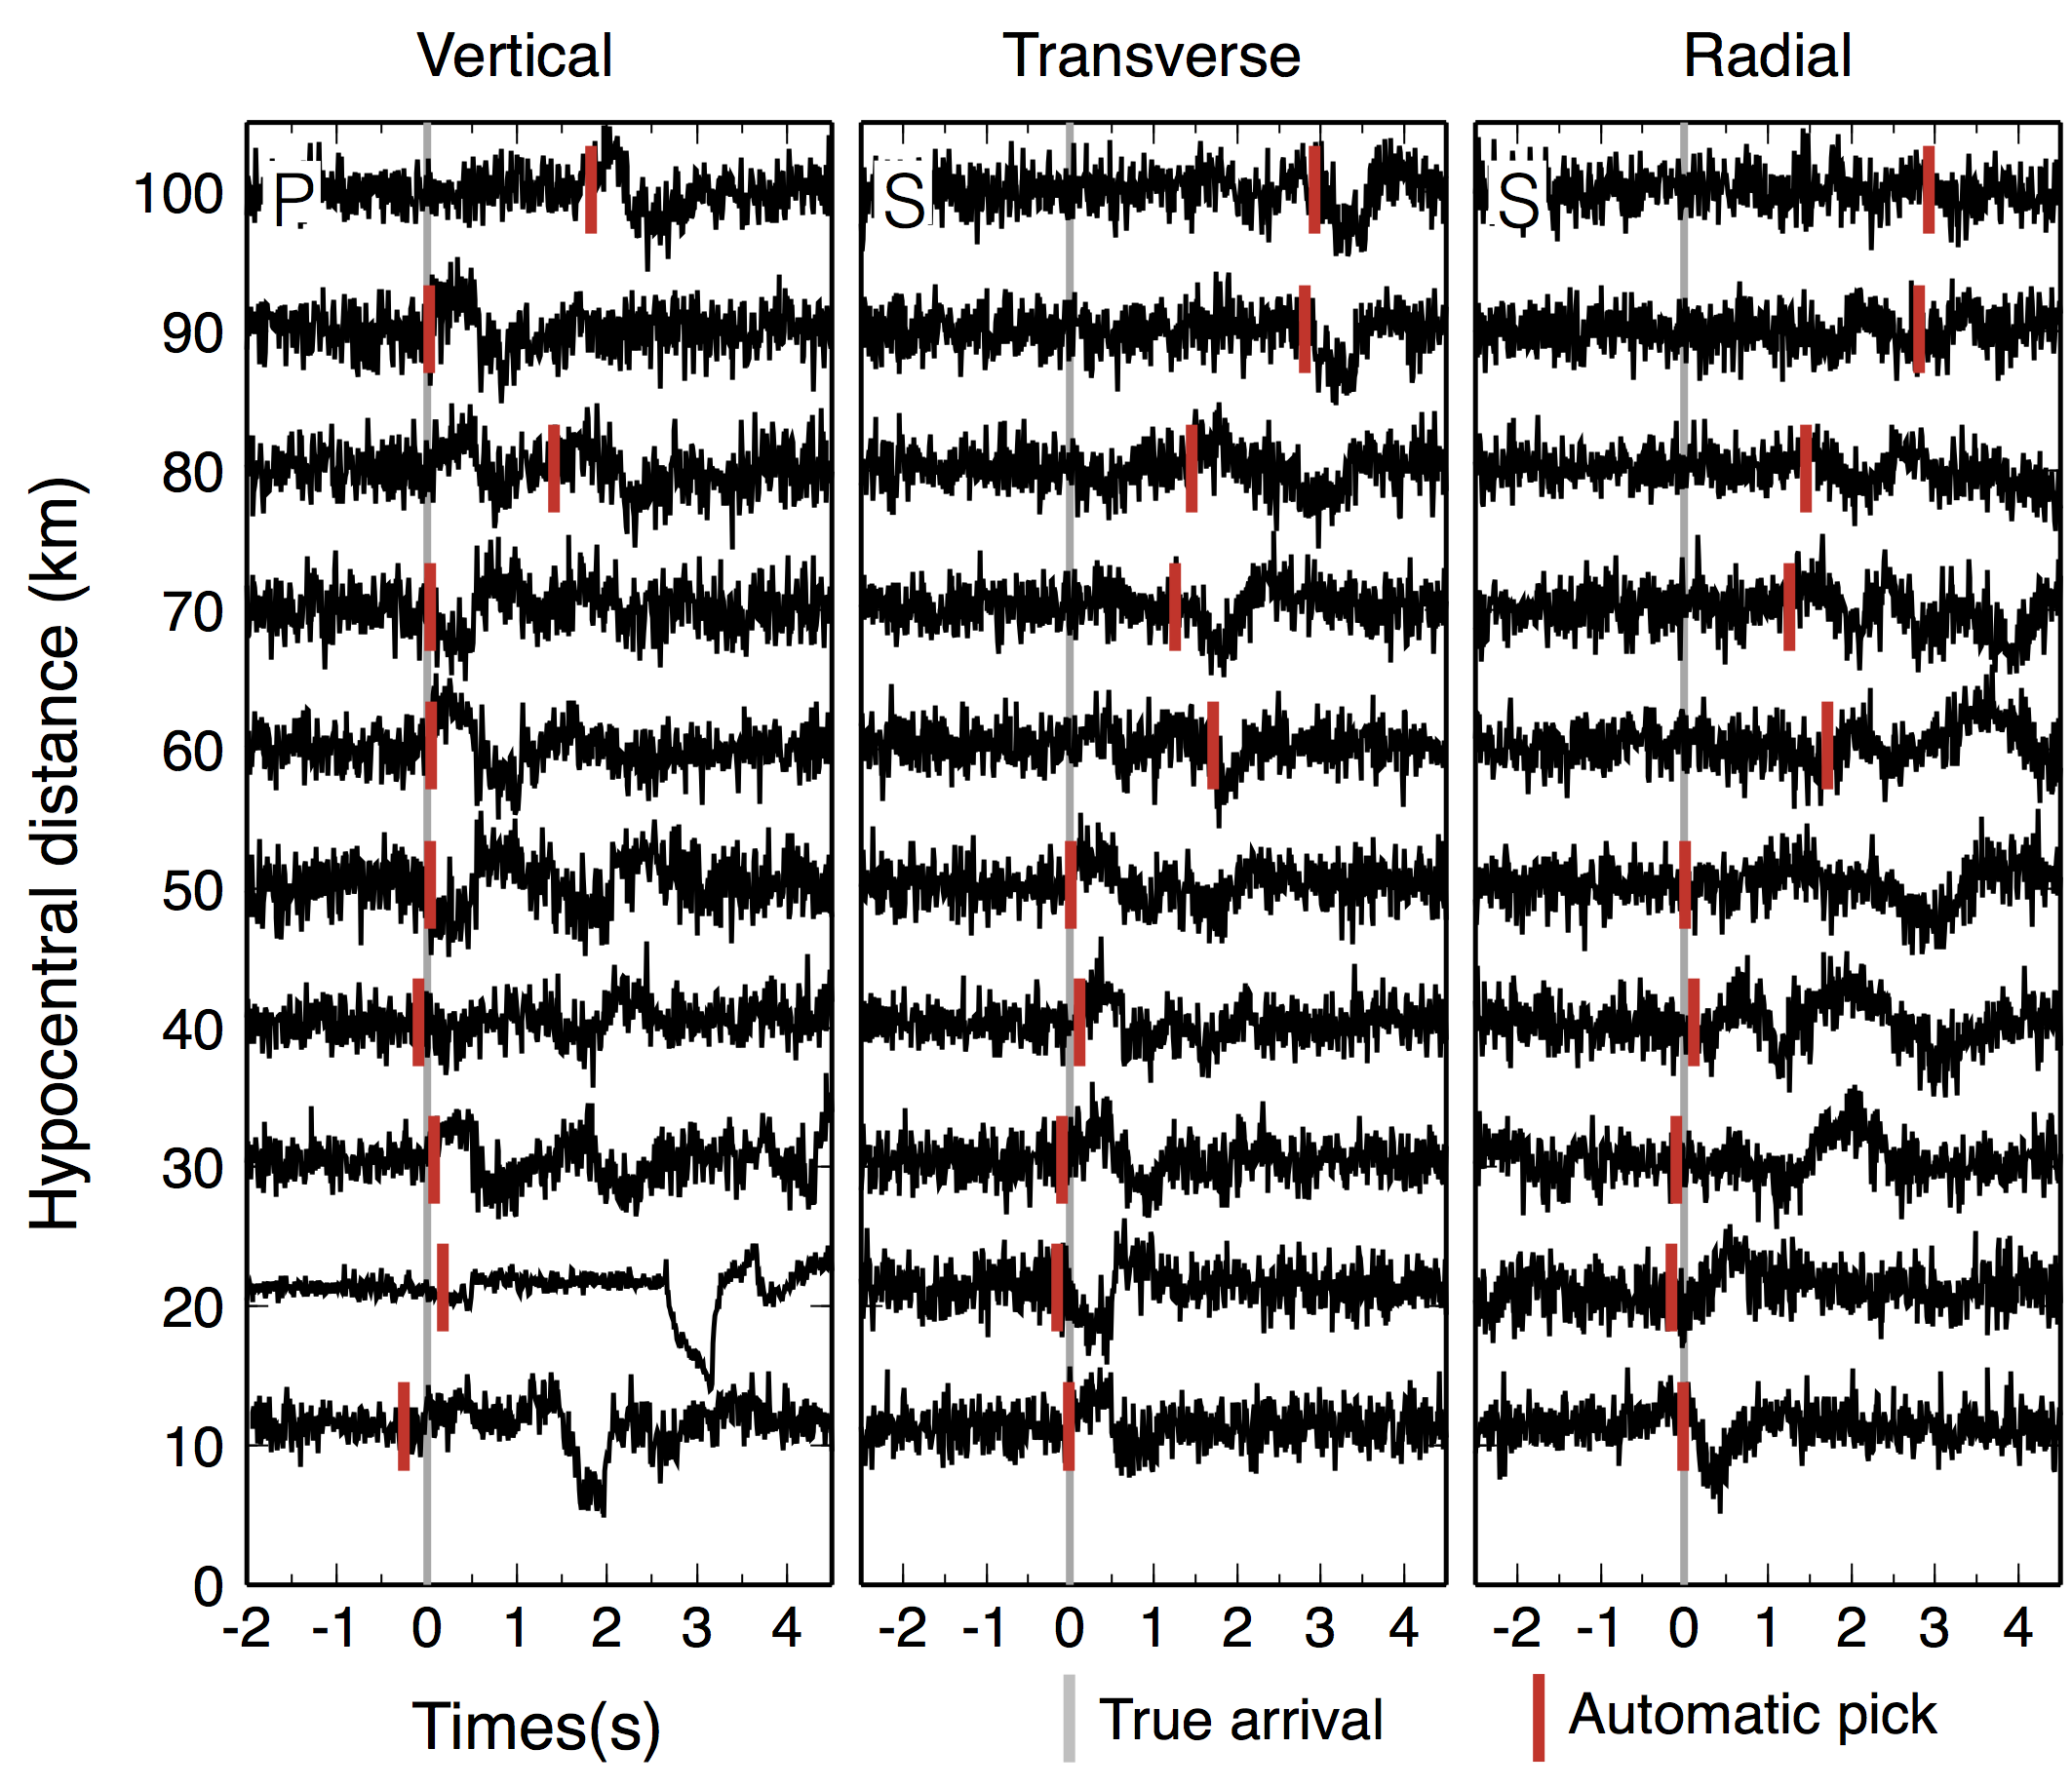
Figure S3. Examples of P and S picks on synthetic seismograms with 20% amplitude noise added. Symbols are the same as in Figure 5 of the main article.
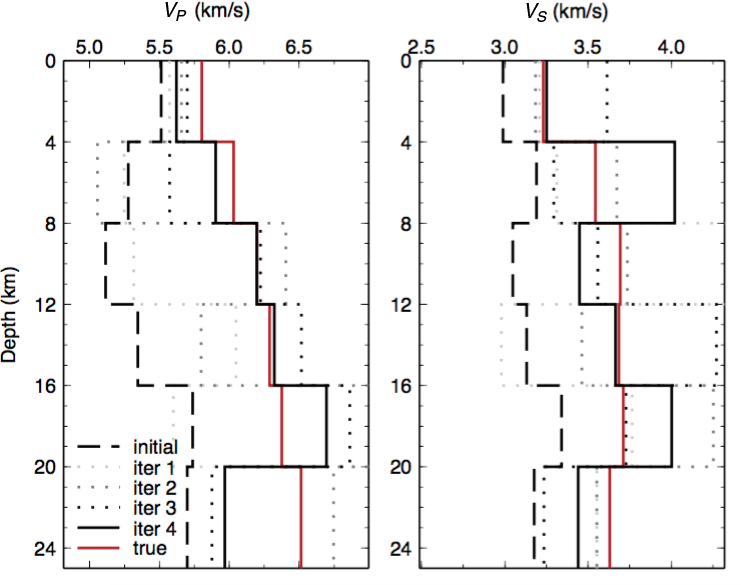
Figure S4. 1D P- and S-velocity models in the synthetic test with 50% amplitude noise added. Symbols are the same as in Figure 3 of the main article.
Figure S5. Histograms of P- and S-pick residuals in the end of four iterations in the synthetic test with 50% amplitude noise added. Symbols are the same as in Figure 4 of the main article.
Figure S6. Examples of P and S picks on synthetic seismograms with 50% amplitude noise added. Symbols are the same as in Figure 5 of the main article.
[ Back ]