This electronic supplement contains figures of individual intensity assignments and comparison of corrected intensities with other intensity datasets, which present the 12 thumbnails used for testimony collection (Fig. S1) and the comparison between uncorrected (Figs. S2–S15) and corrected (Figs. S16–S32) macroseismic intensities derived from thumbnail-based questionnaires with independent macroseismic studies that utilize European Macroseismic Scale 1998 (EMS-98) as well as comparisons with “Did You Feel It?” (DYFI) results.
Figure S1. The thumbnails used to collect testimonies at European-Mediterranean Seismological Centre (EMSC). Each represents a different EMS-98 intensity level from 1 to 12.
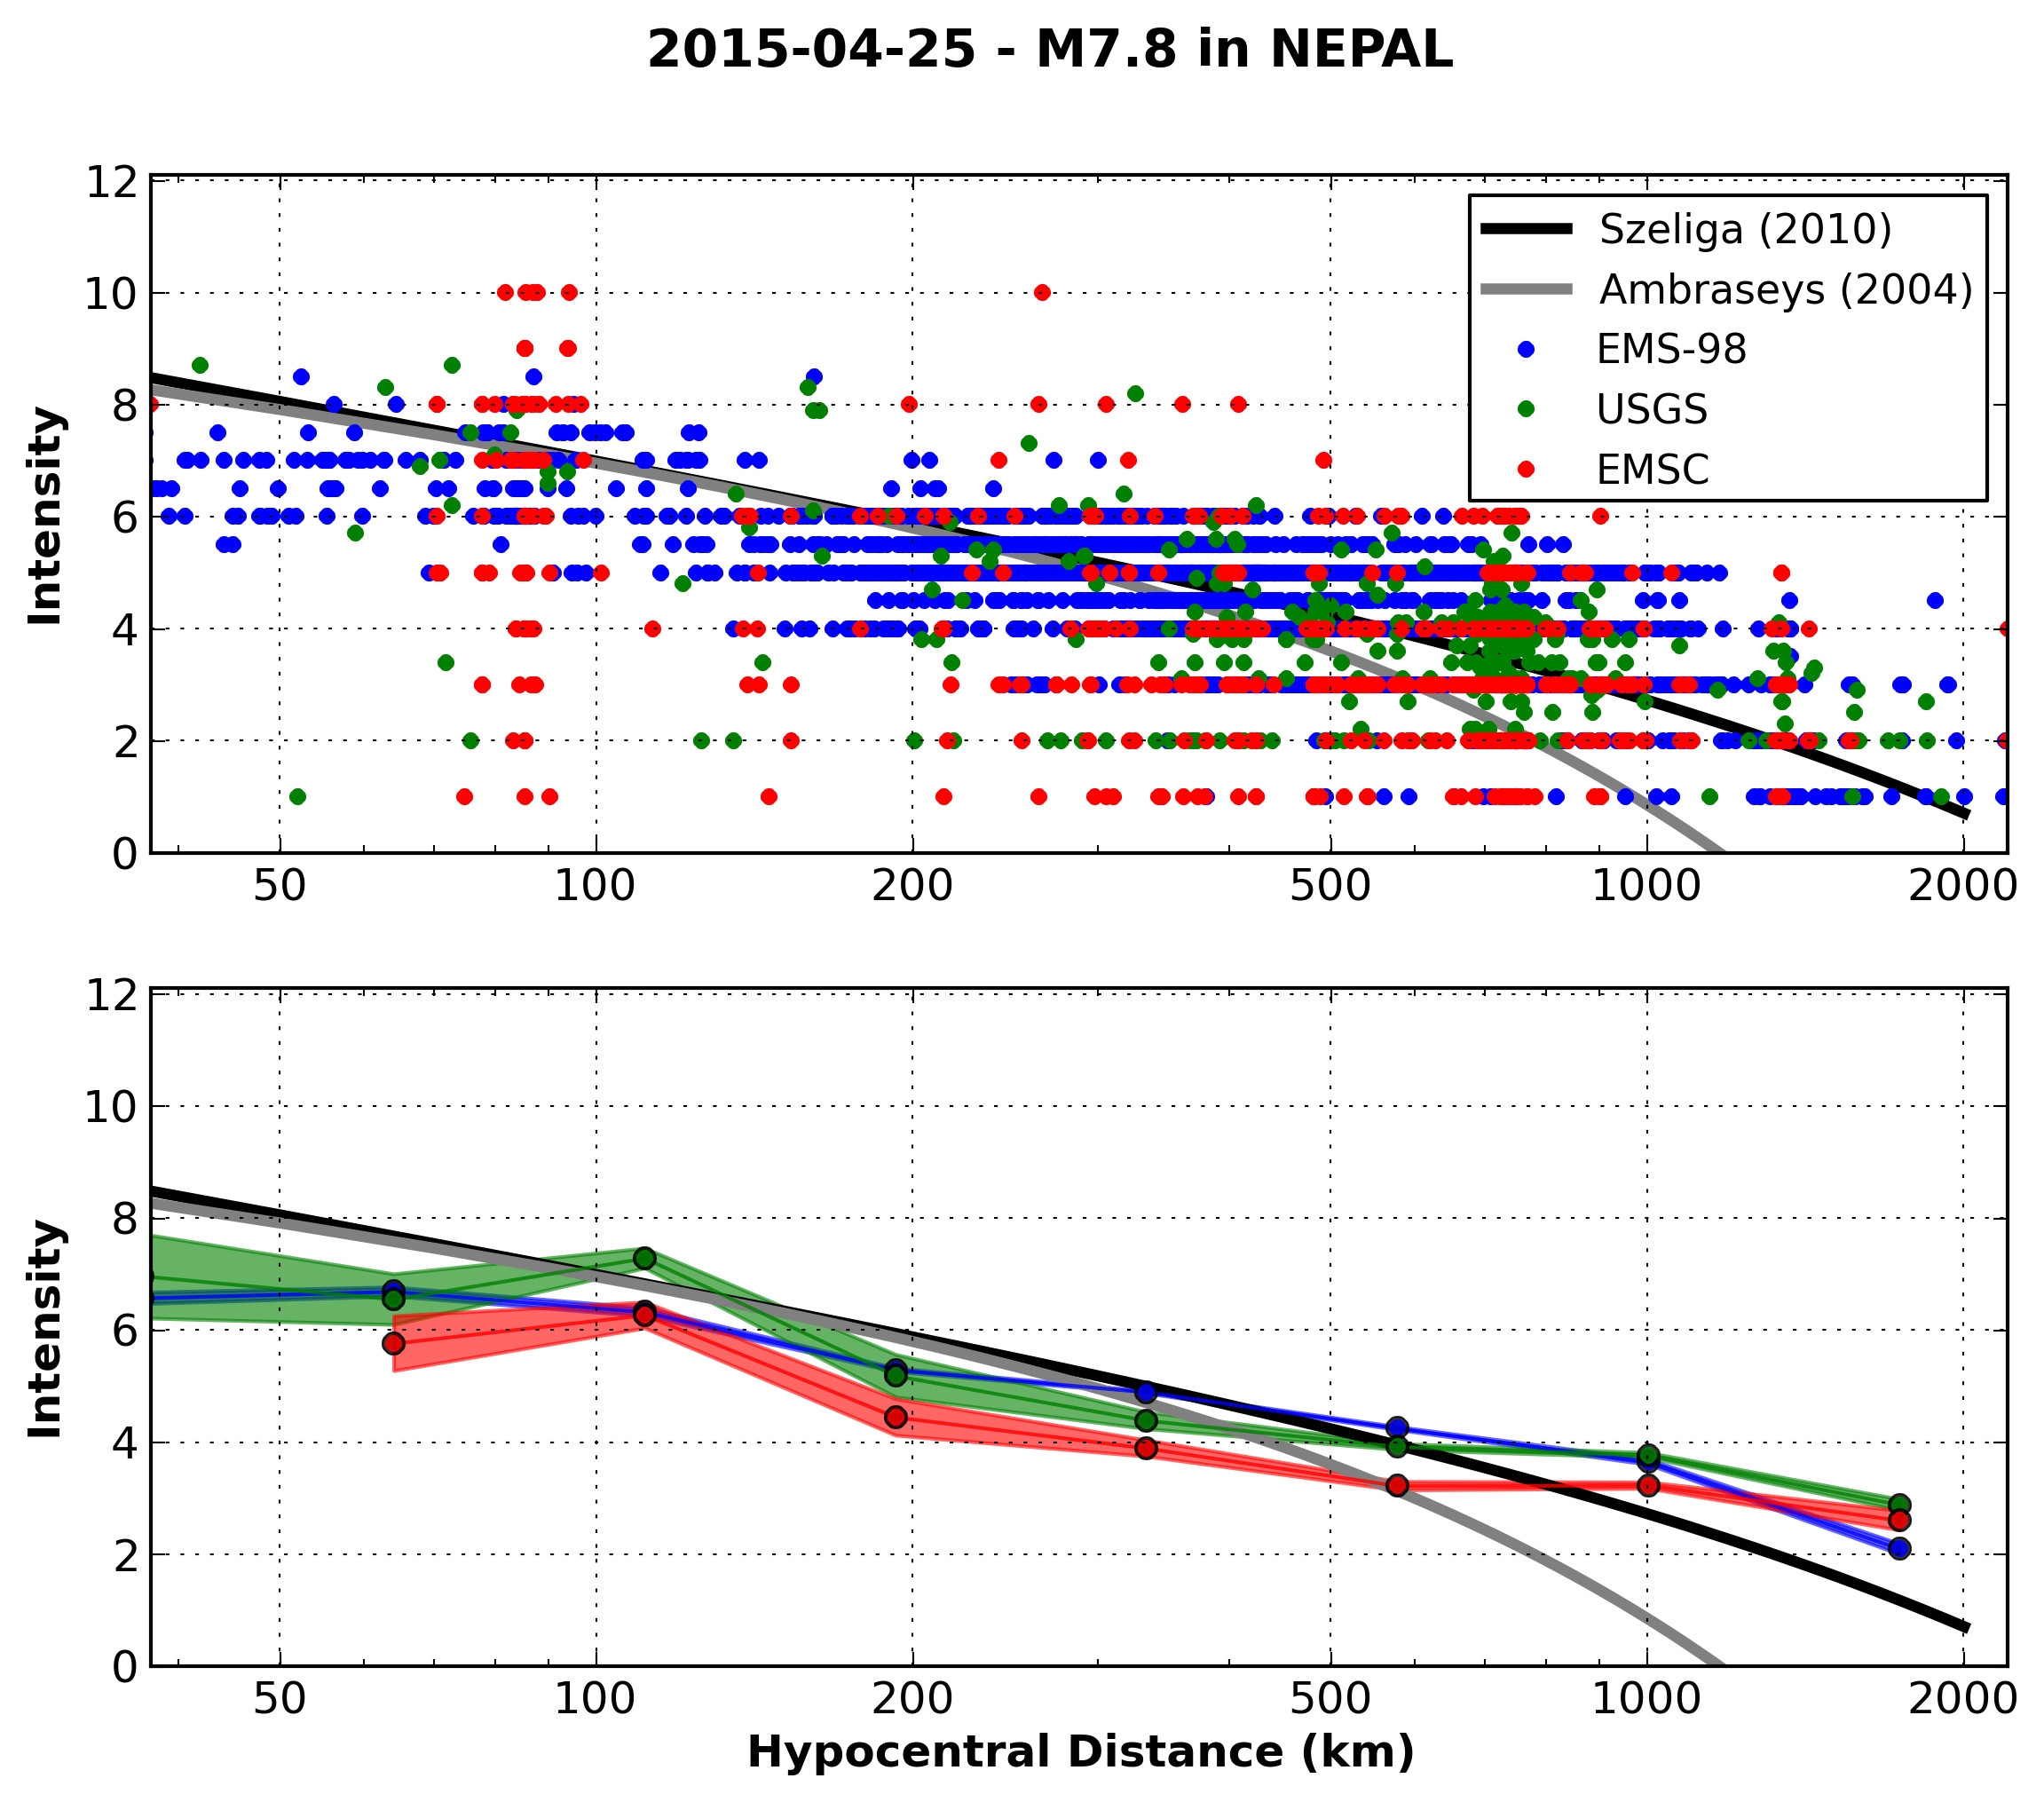
Figure S2. (Top) Individual intensity assignments from Martin et al. (2015) (blue dots), EMSC individual intensities (red dots), and DYFI geocoded data (Wald et al., 1999, 2011) for the M 7.8 Gorkha, Nepal, earthquake. (Bottom) The dot represents the center of the bin. Bin averaged mean values for the same datasets. Shading indicates ±1 standard deviation of the mean calculated for each (logarithmic) distance bin. Black and gray lines show intensity prediction equations from Szeliga et al. (2010) and Ambraseys and Douglas (2004), respectively.
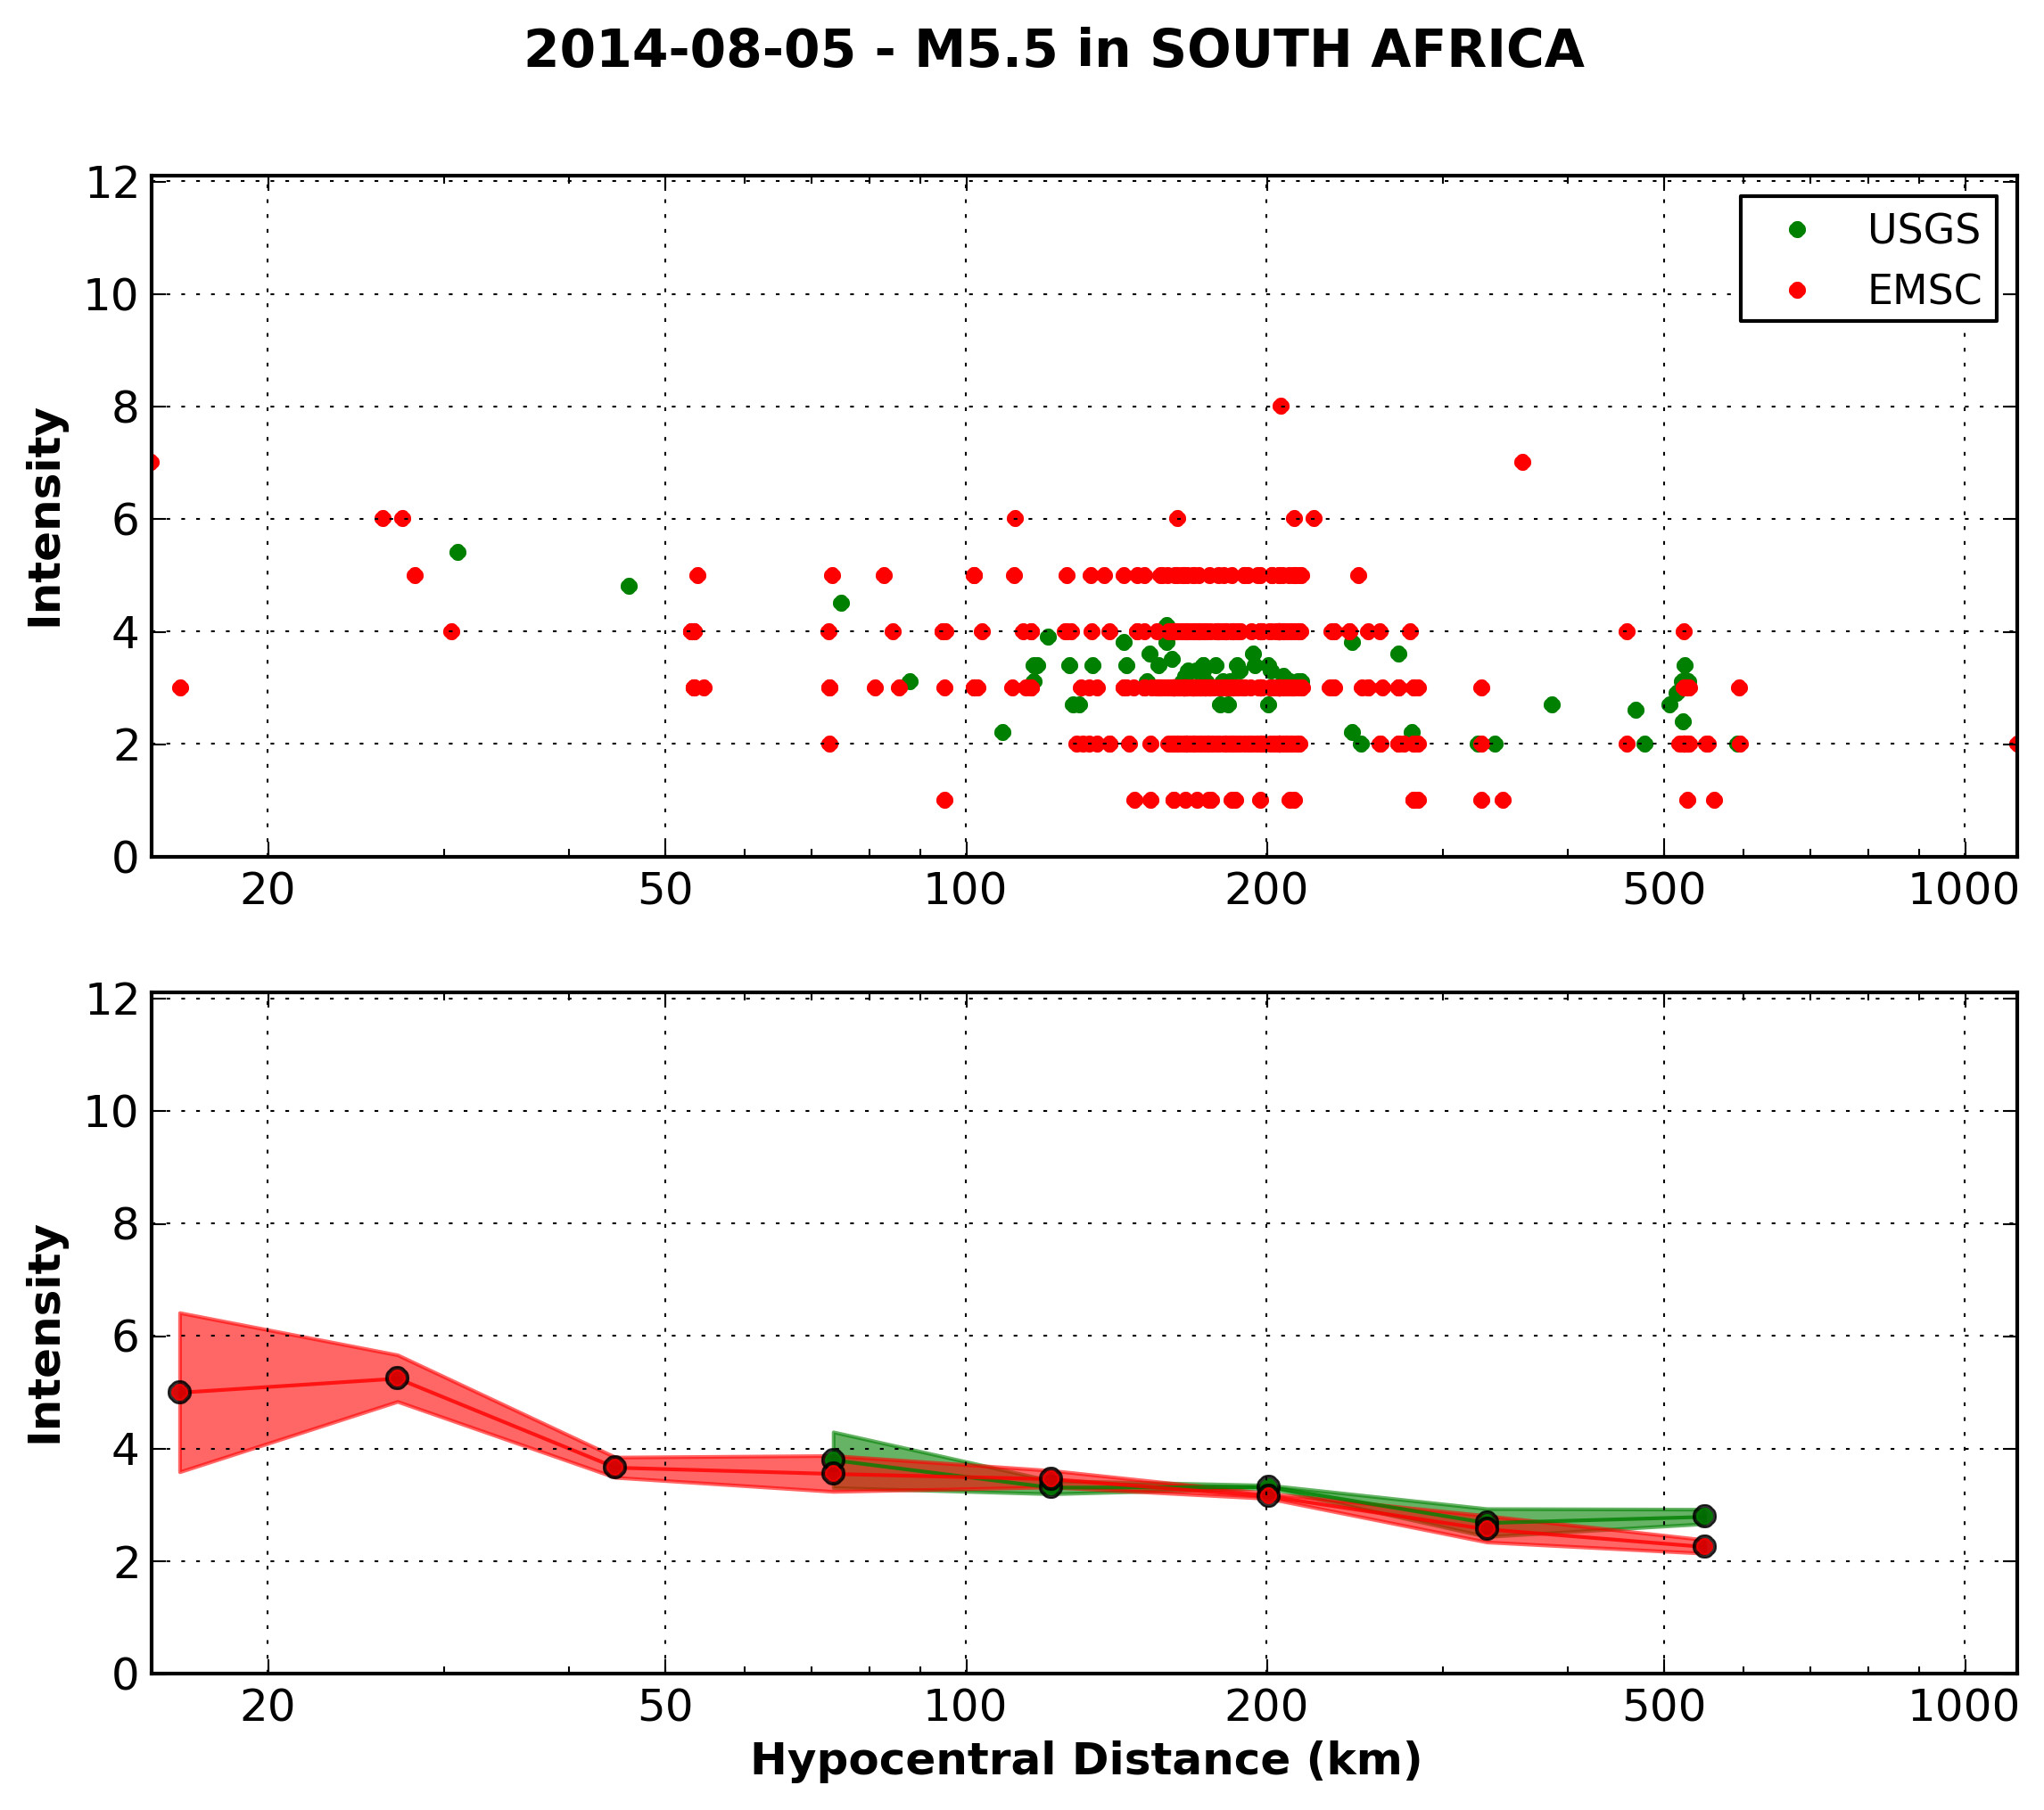
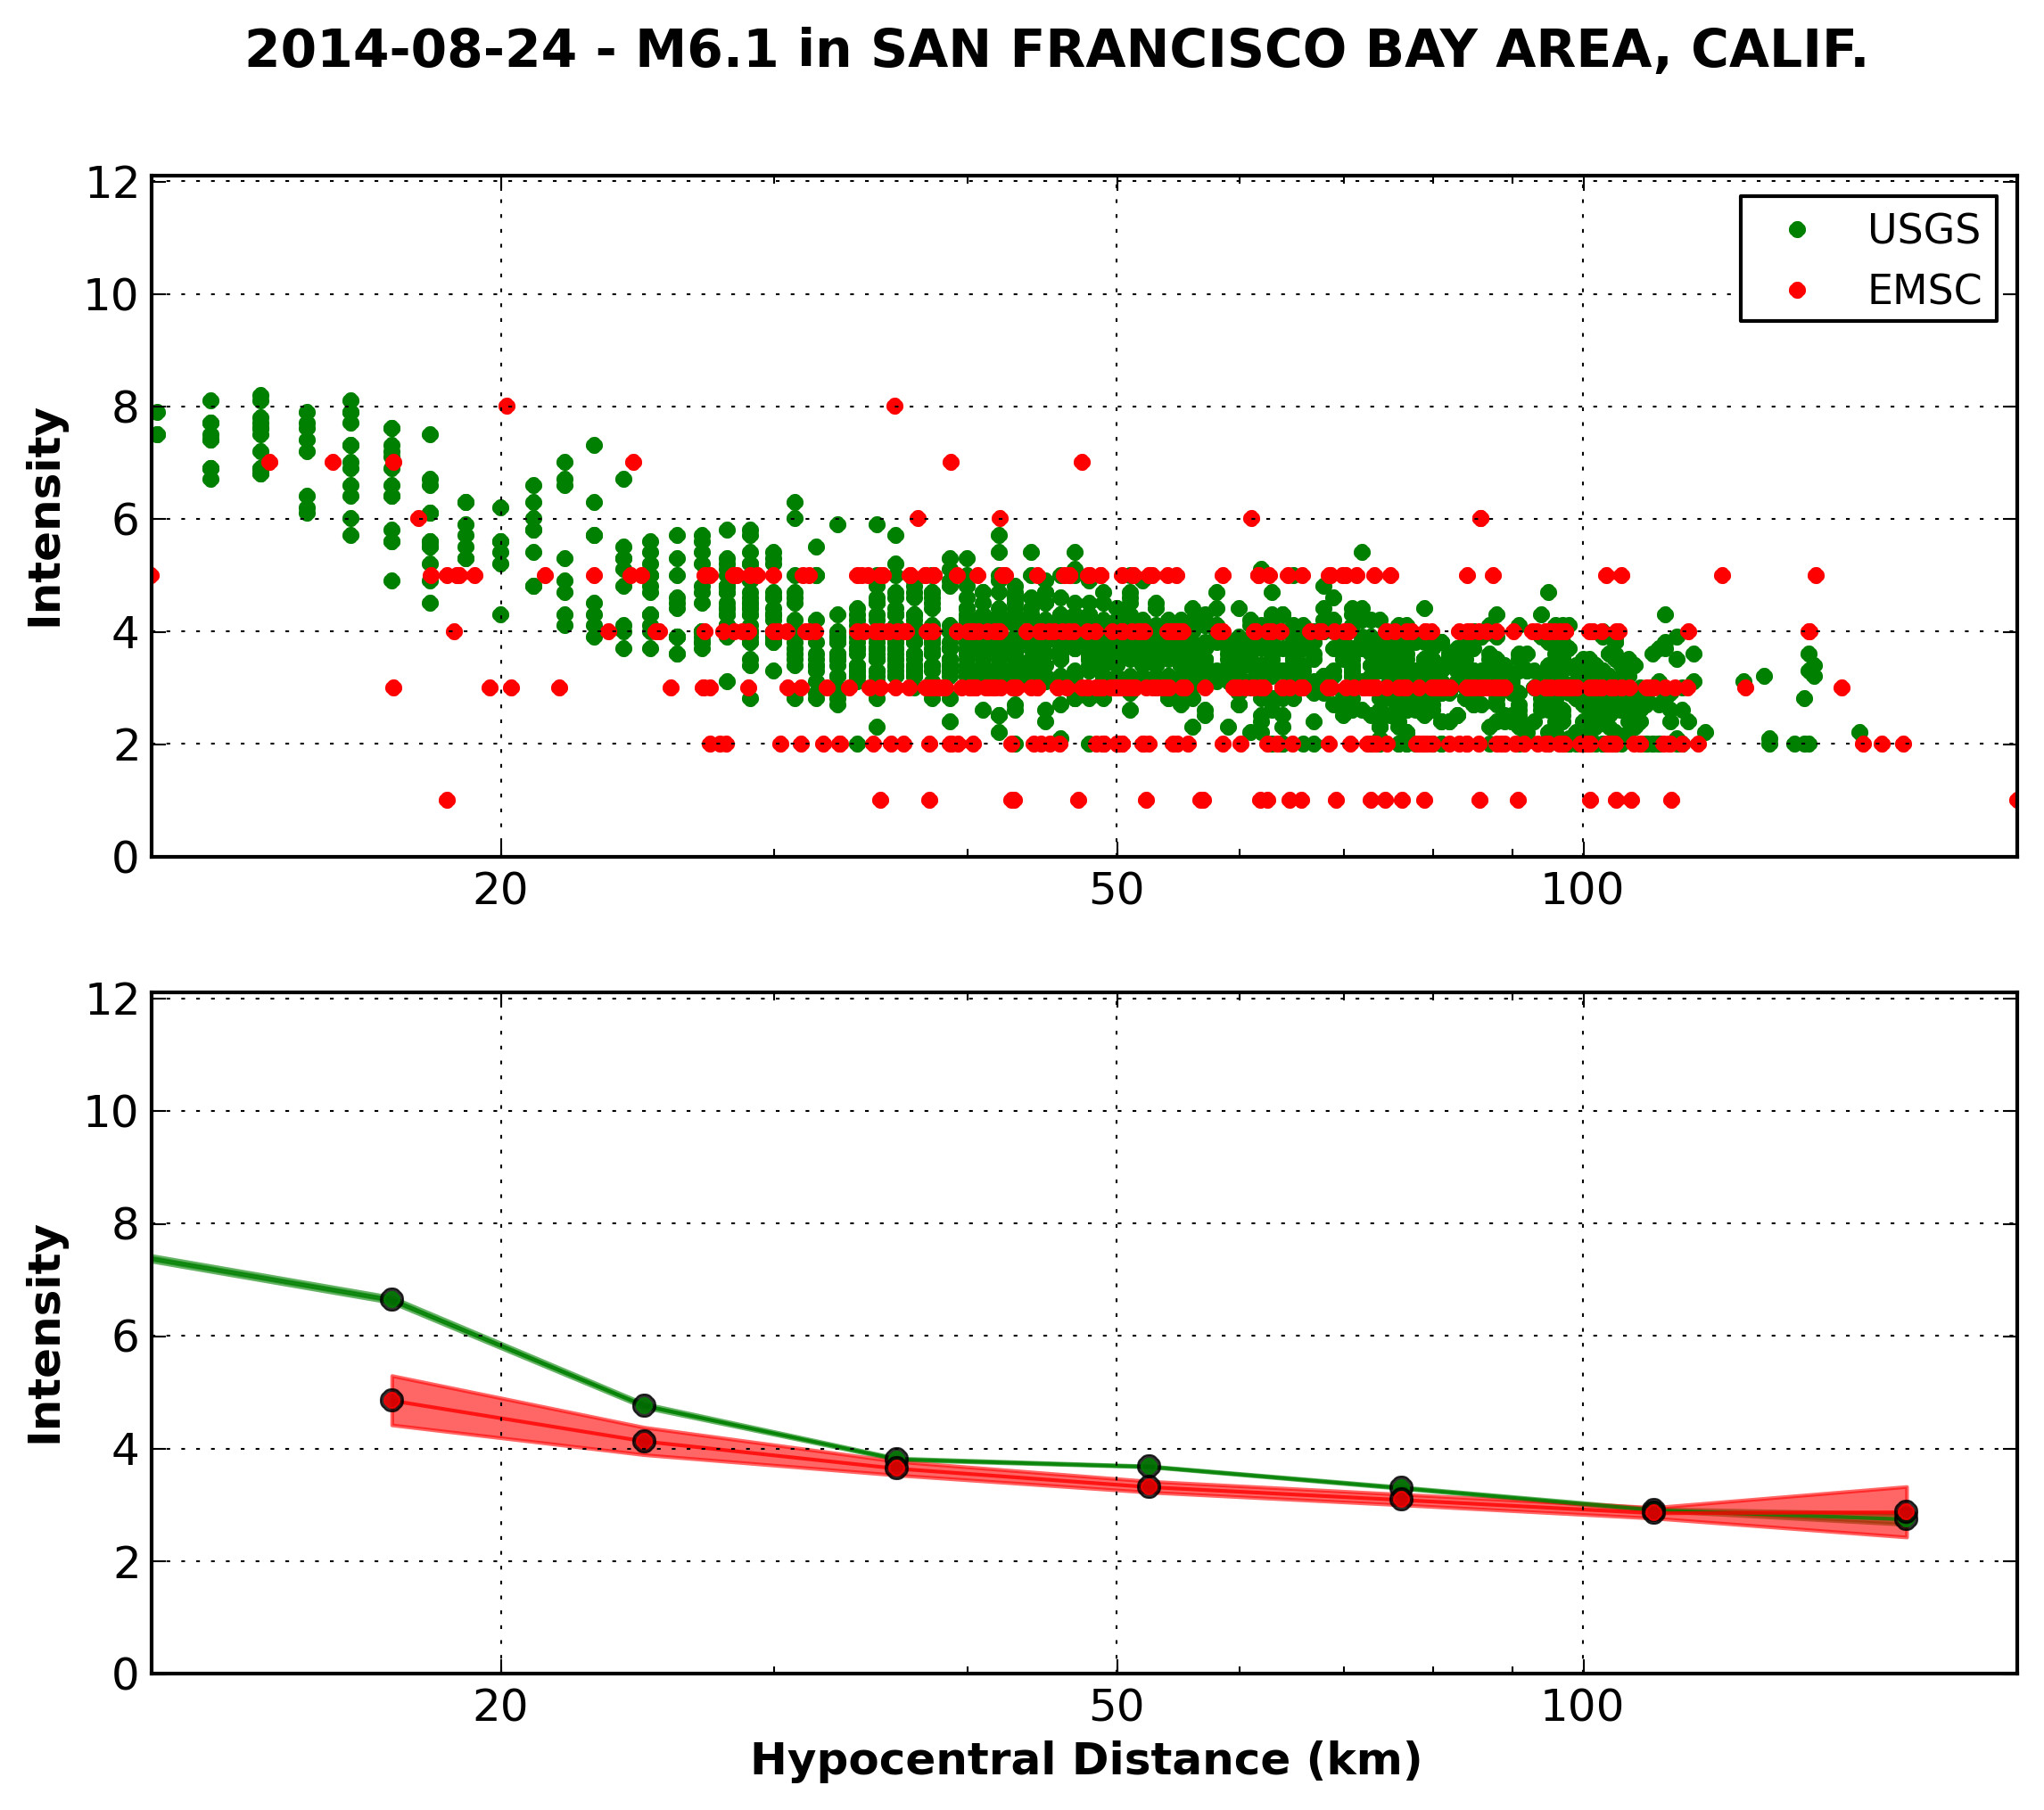
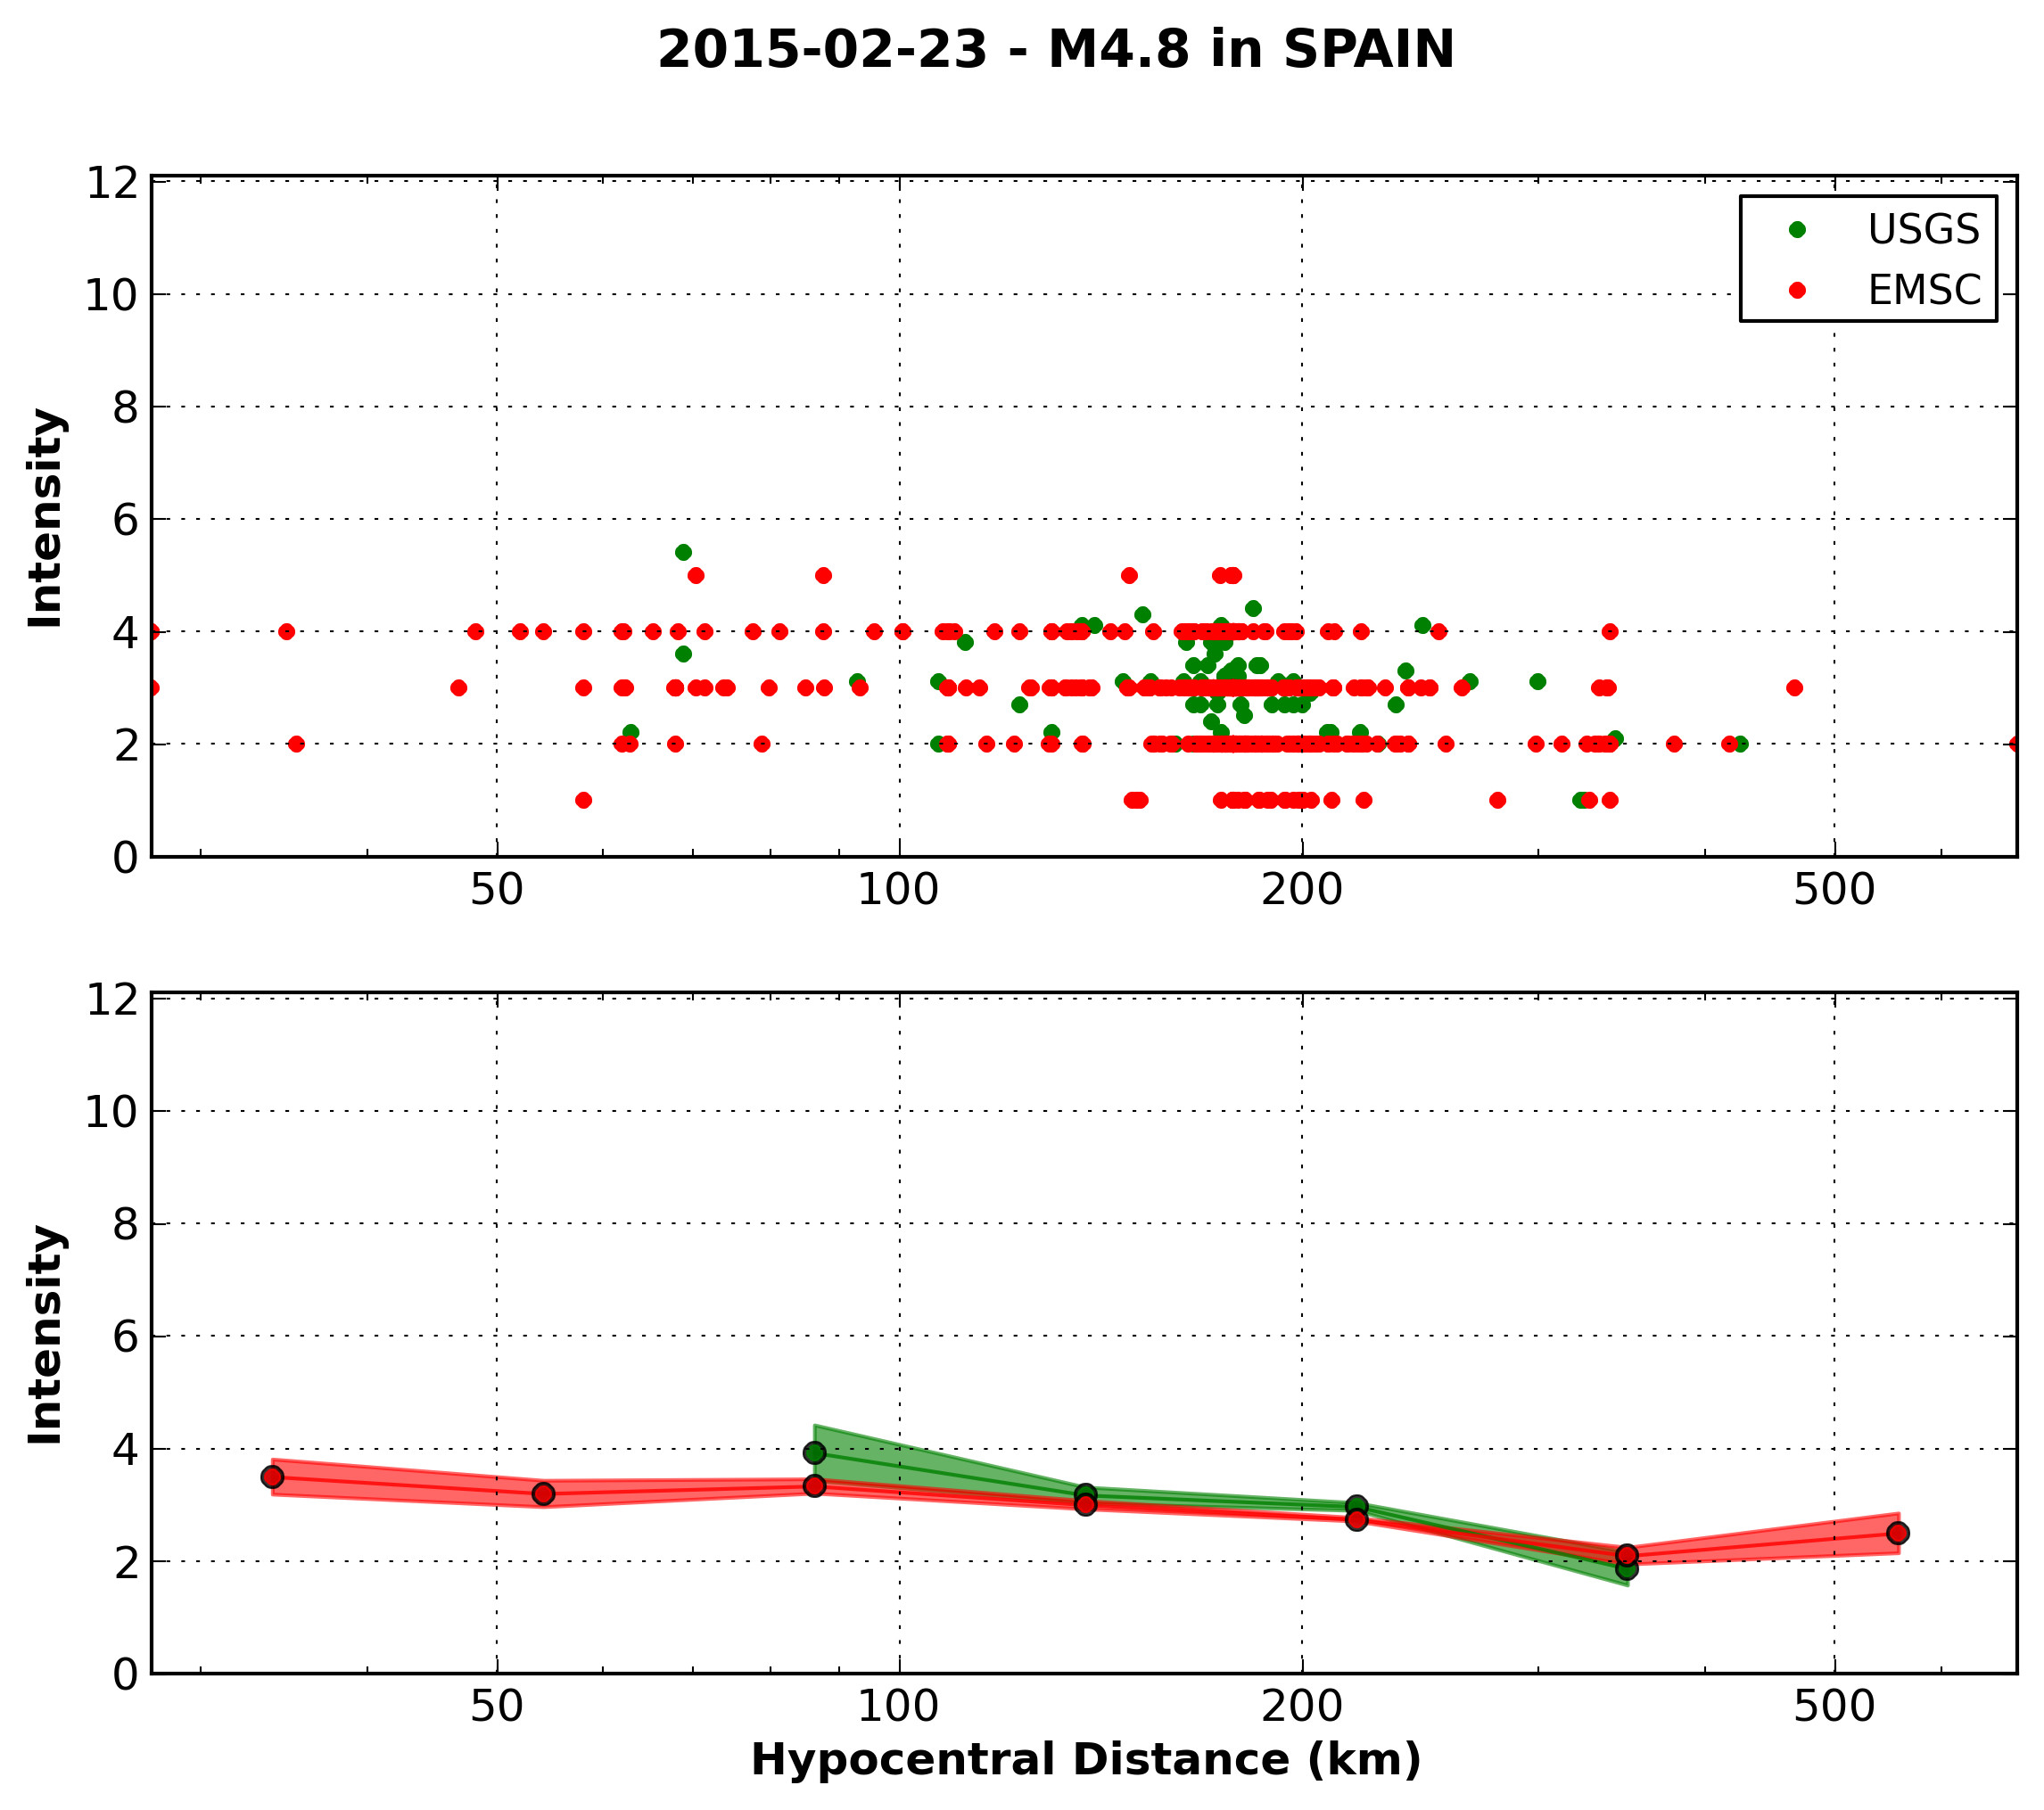
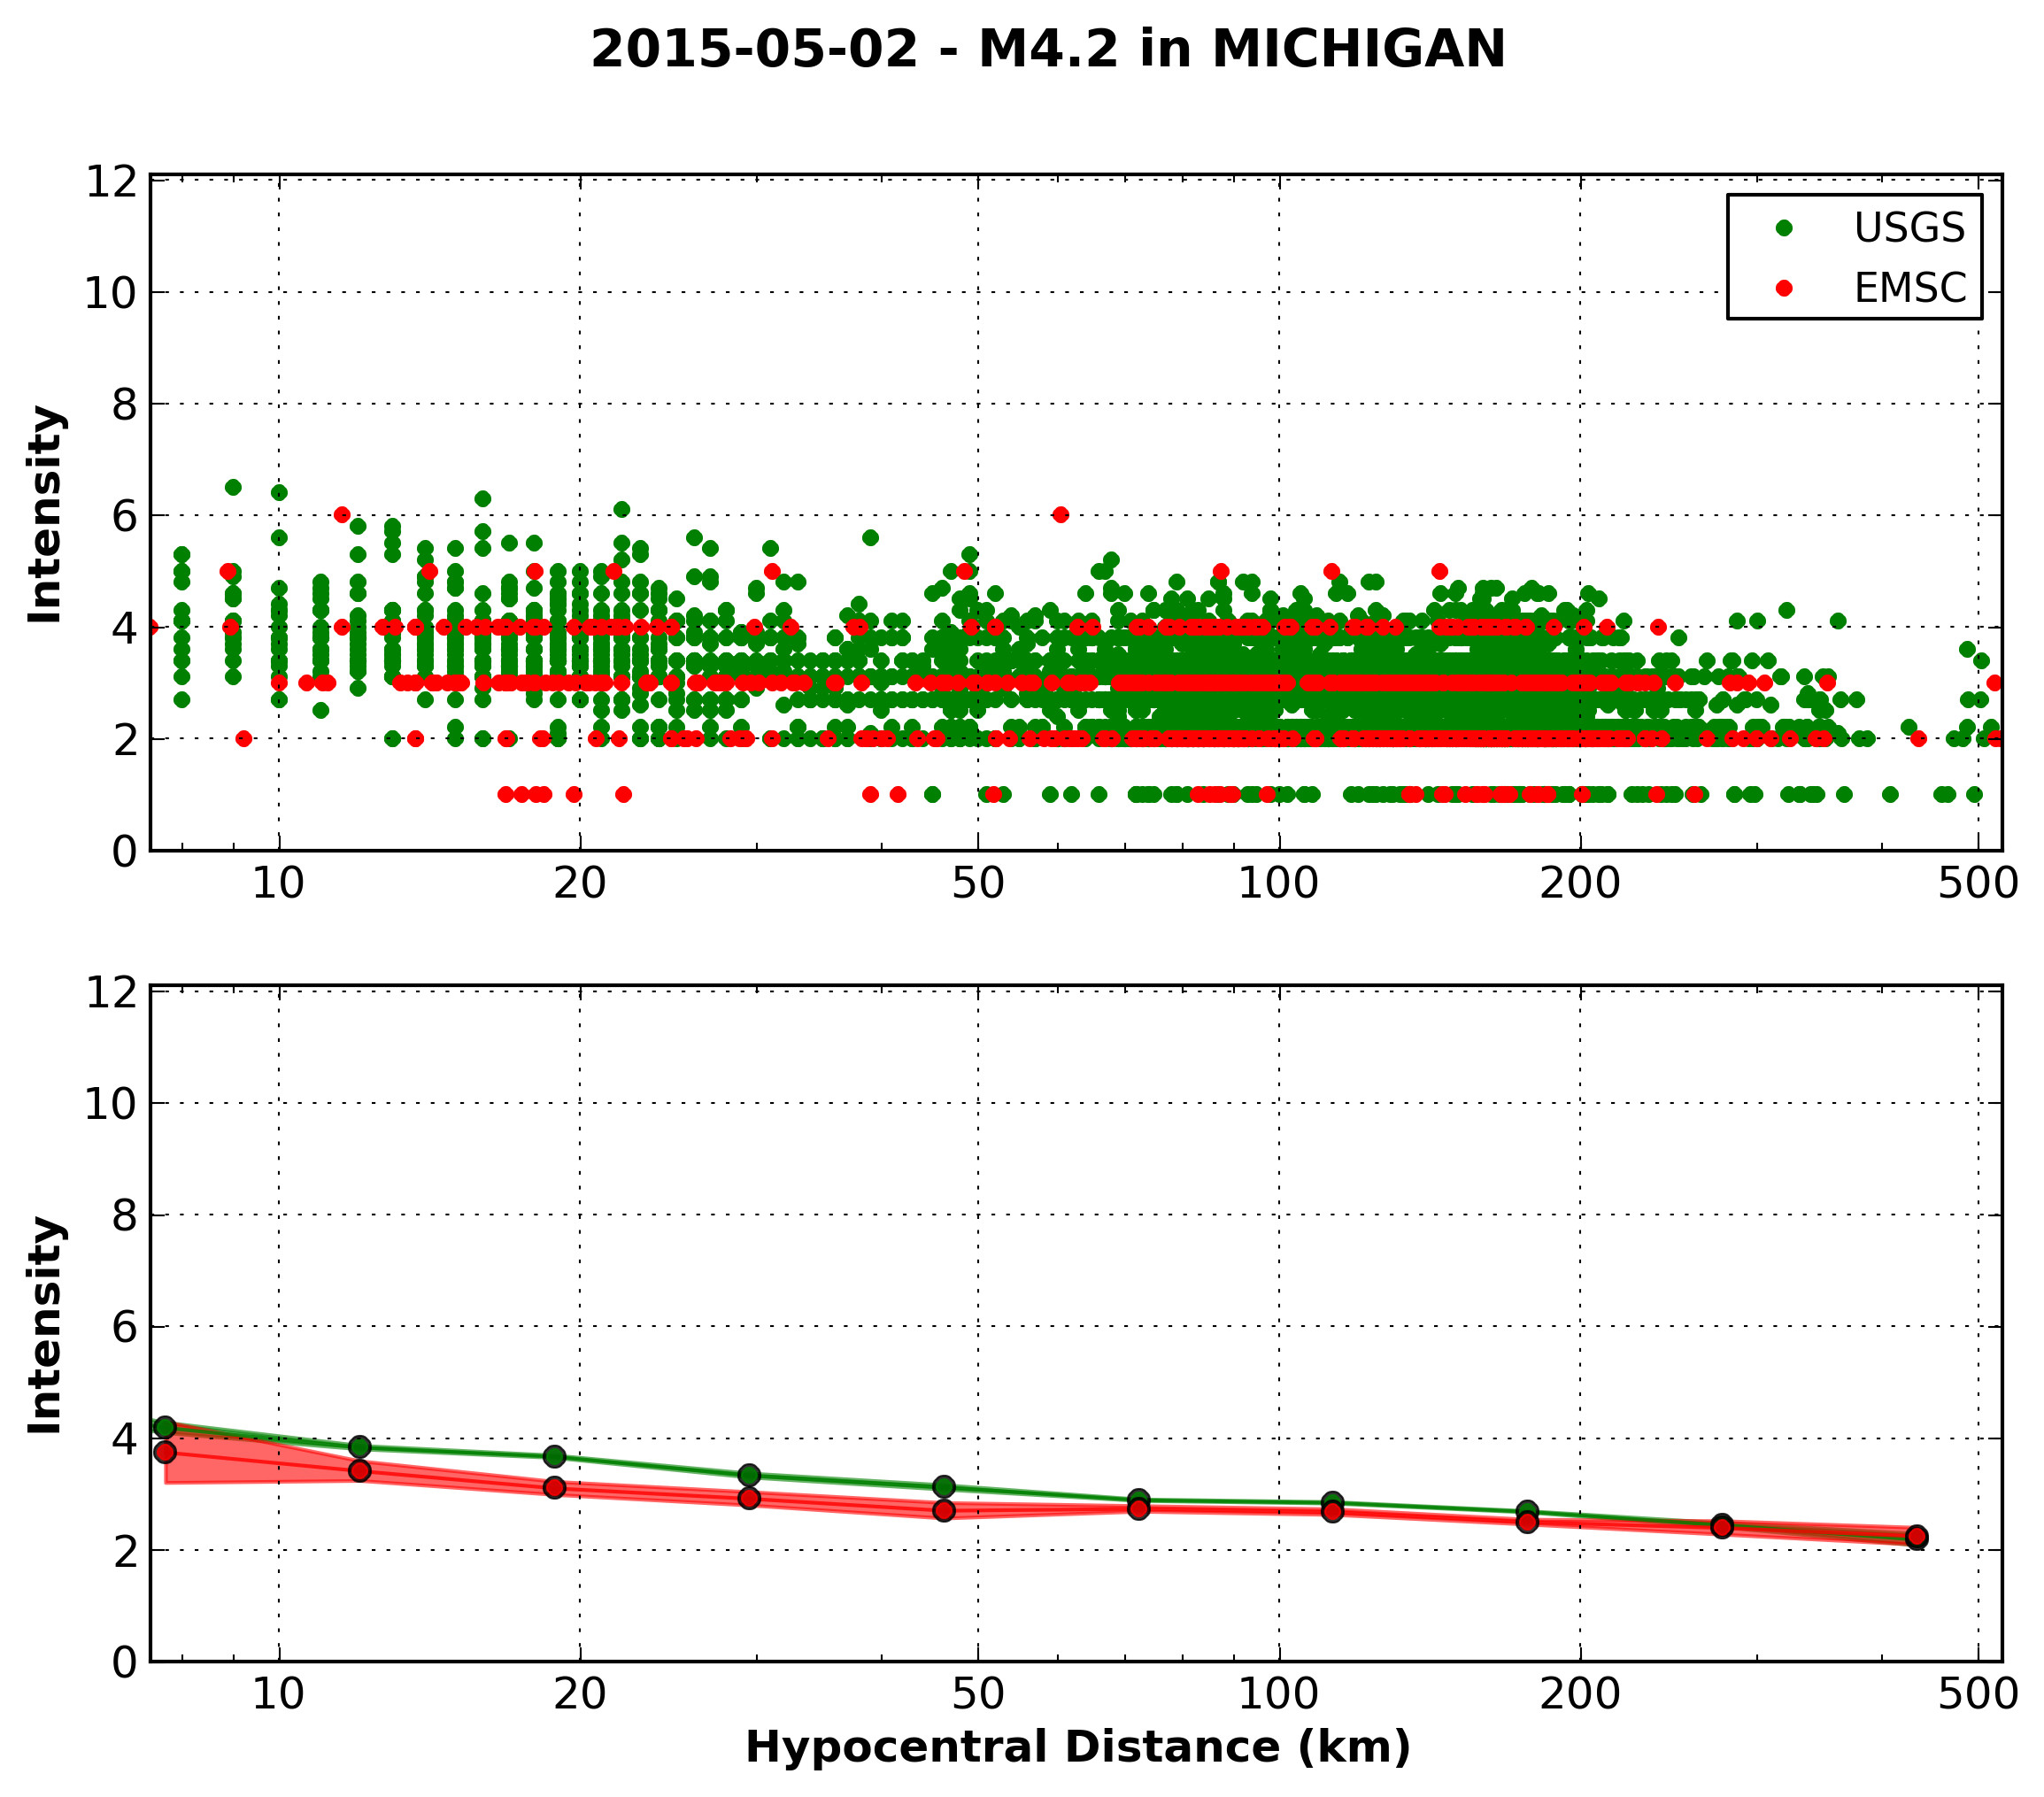
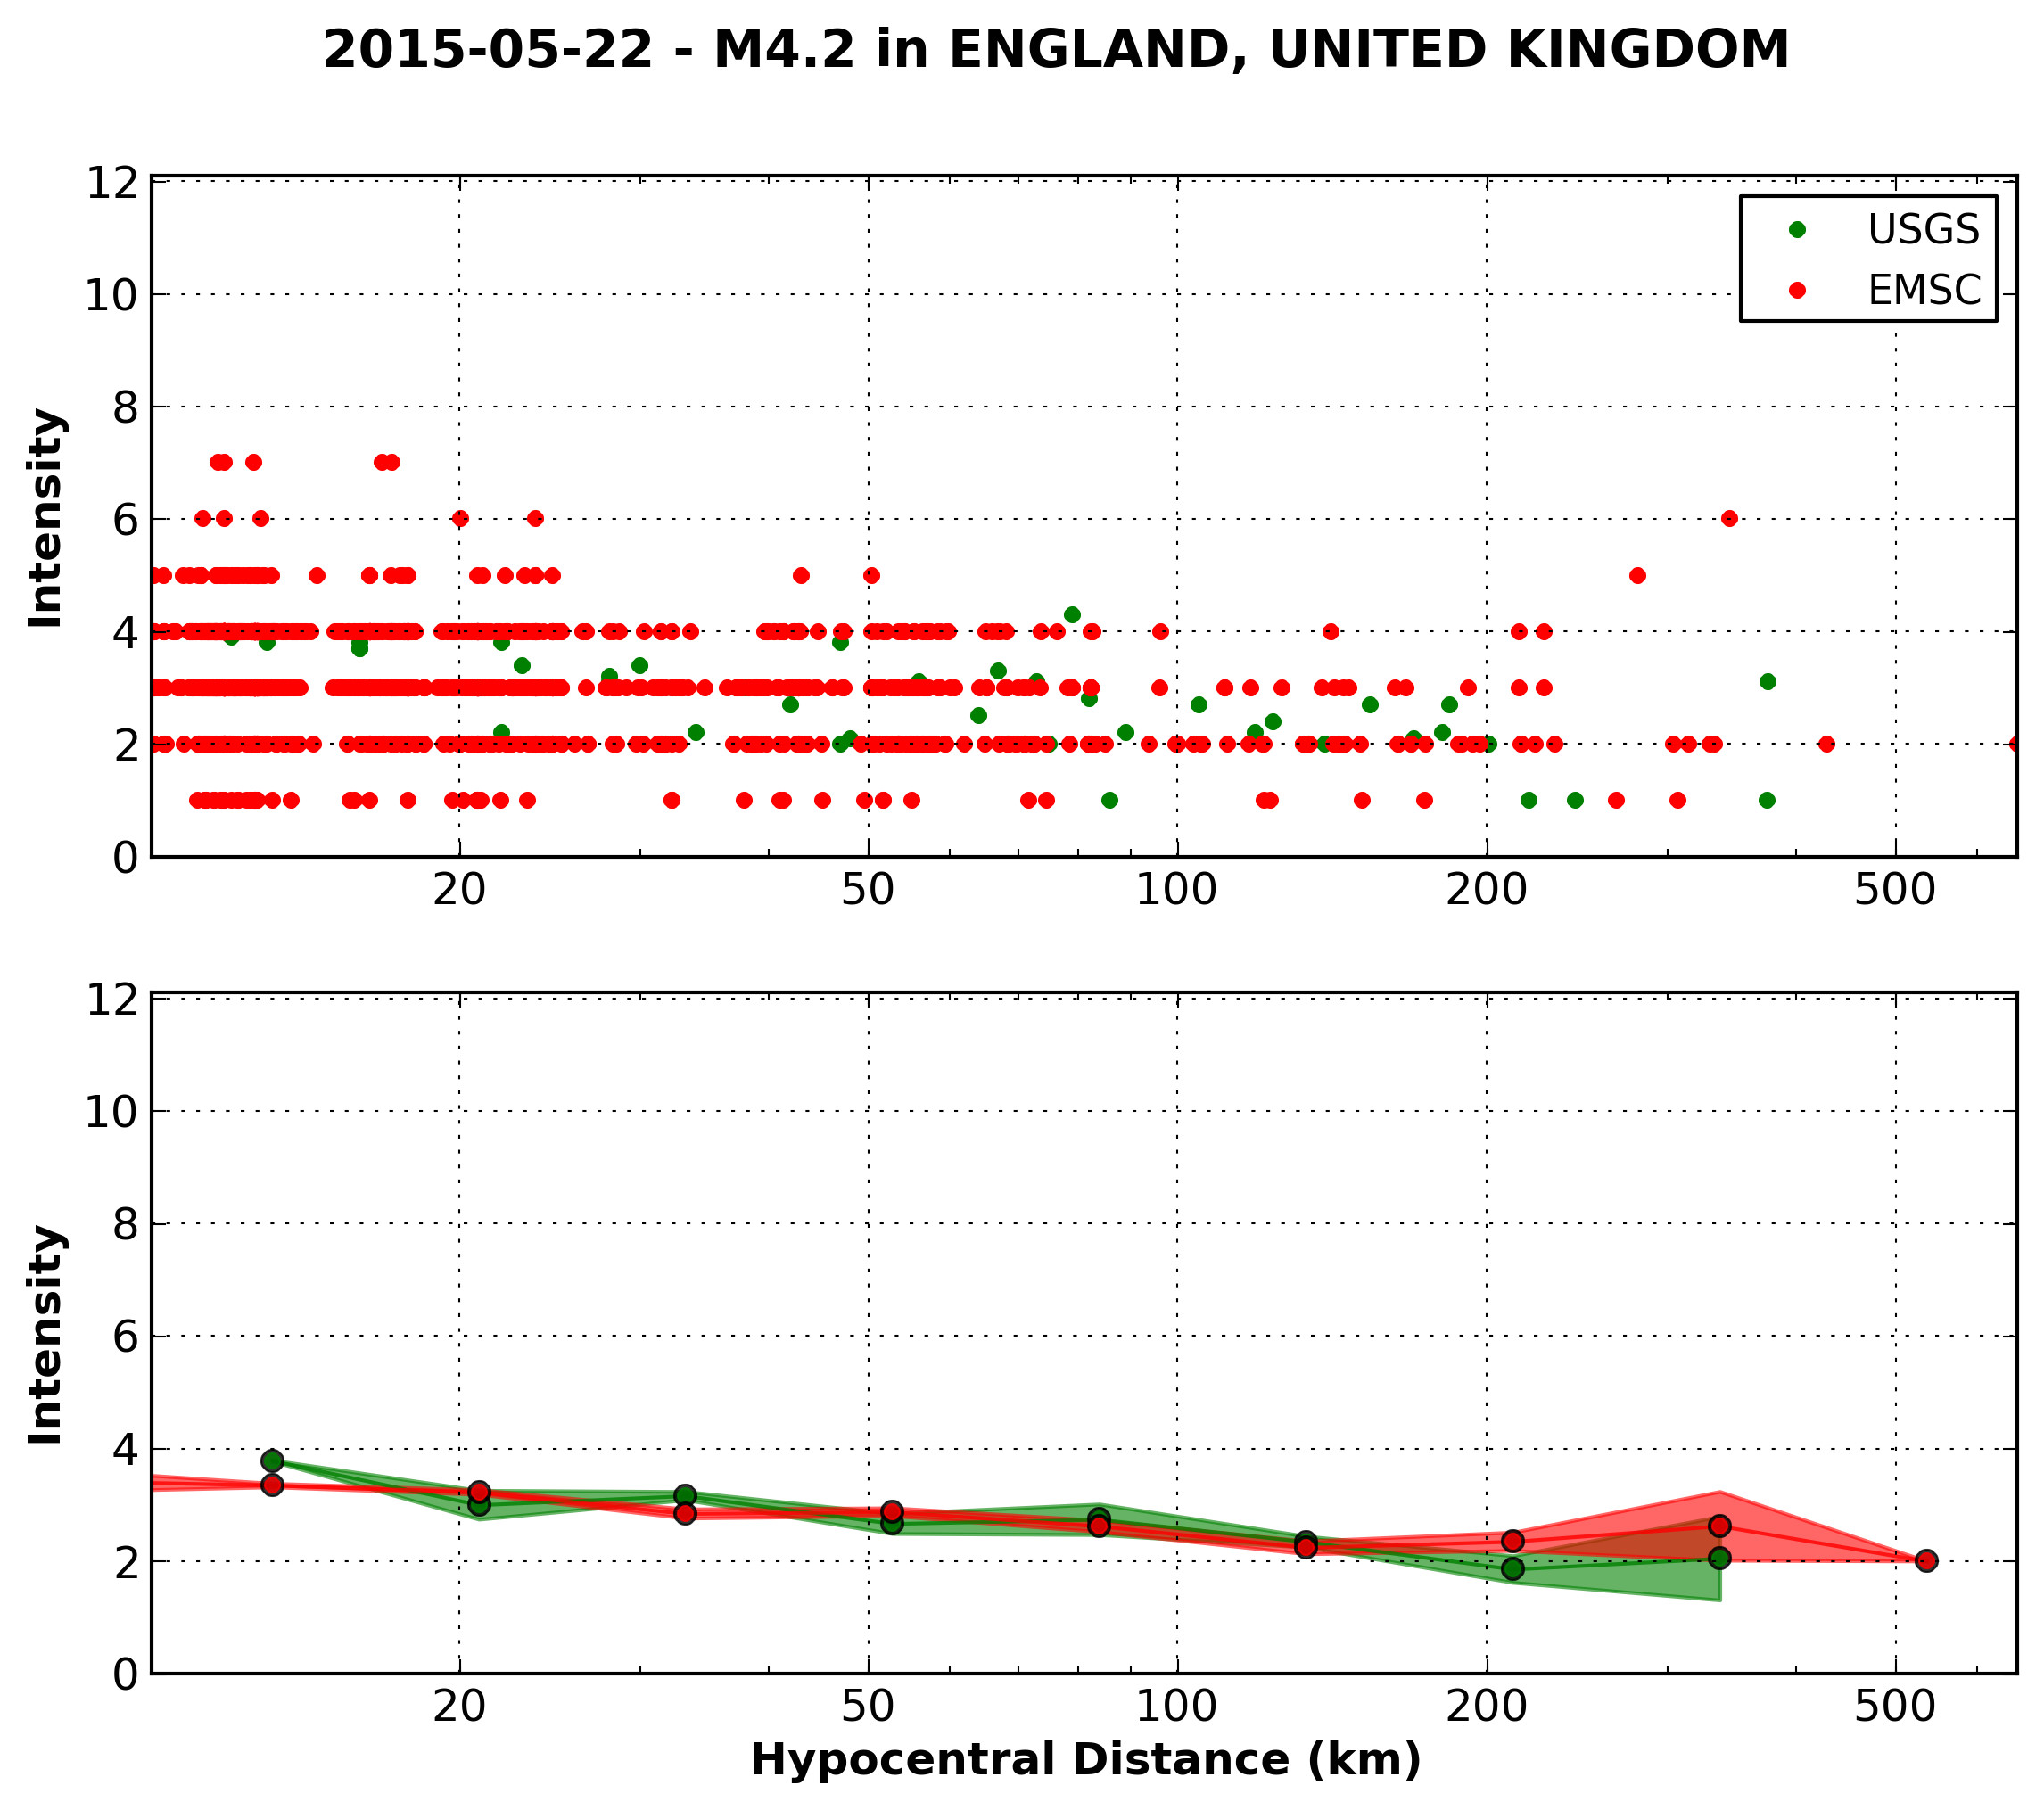
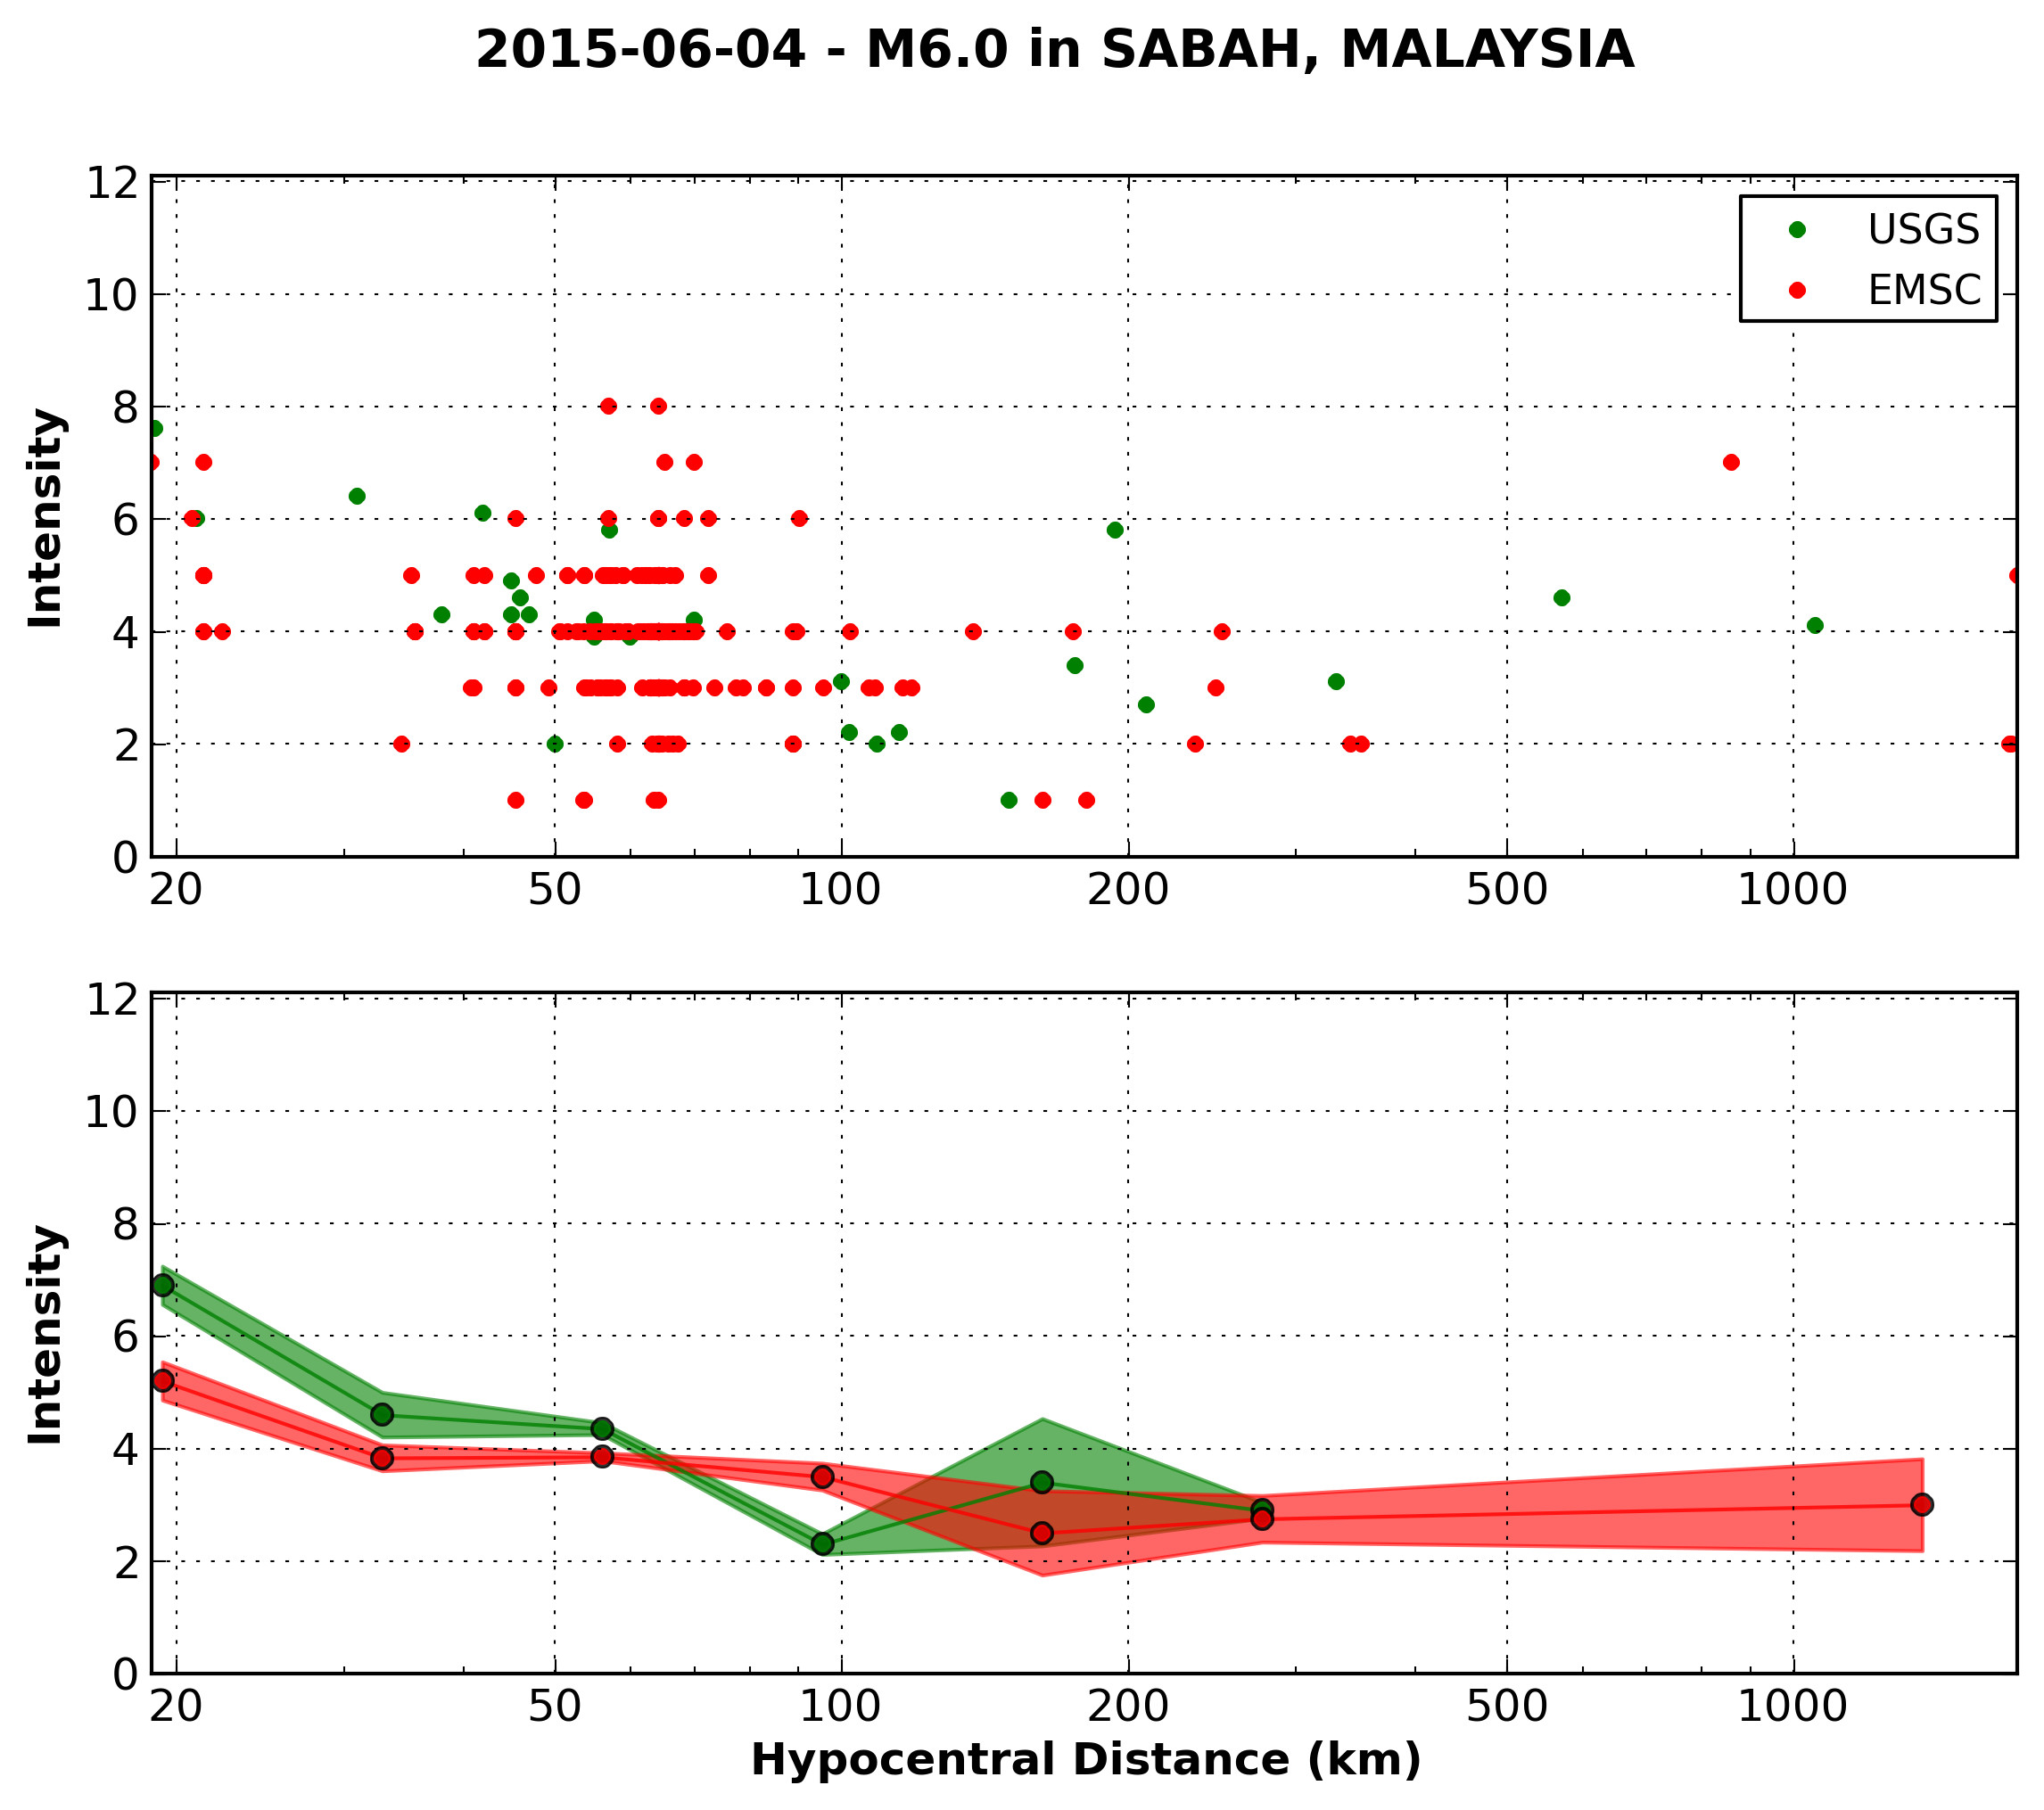
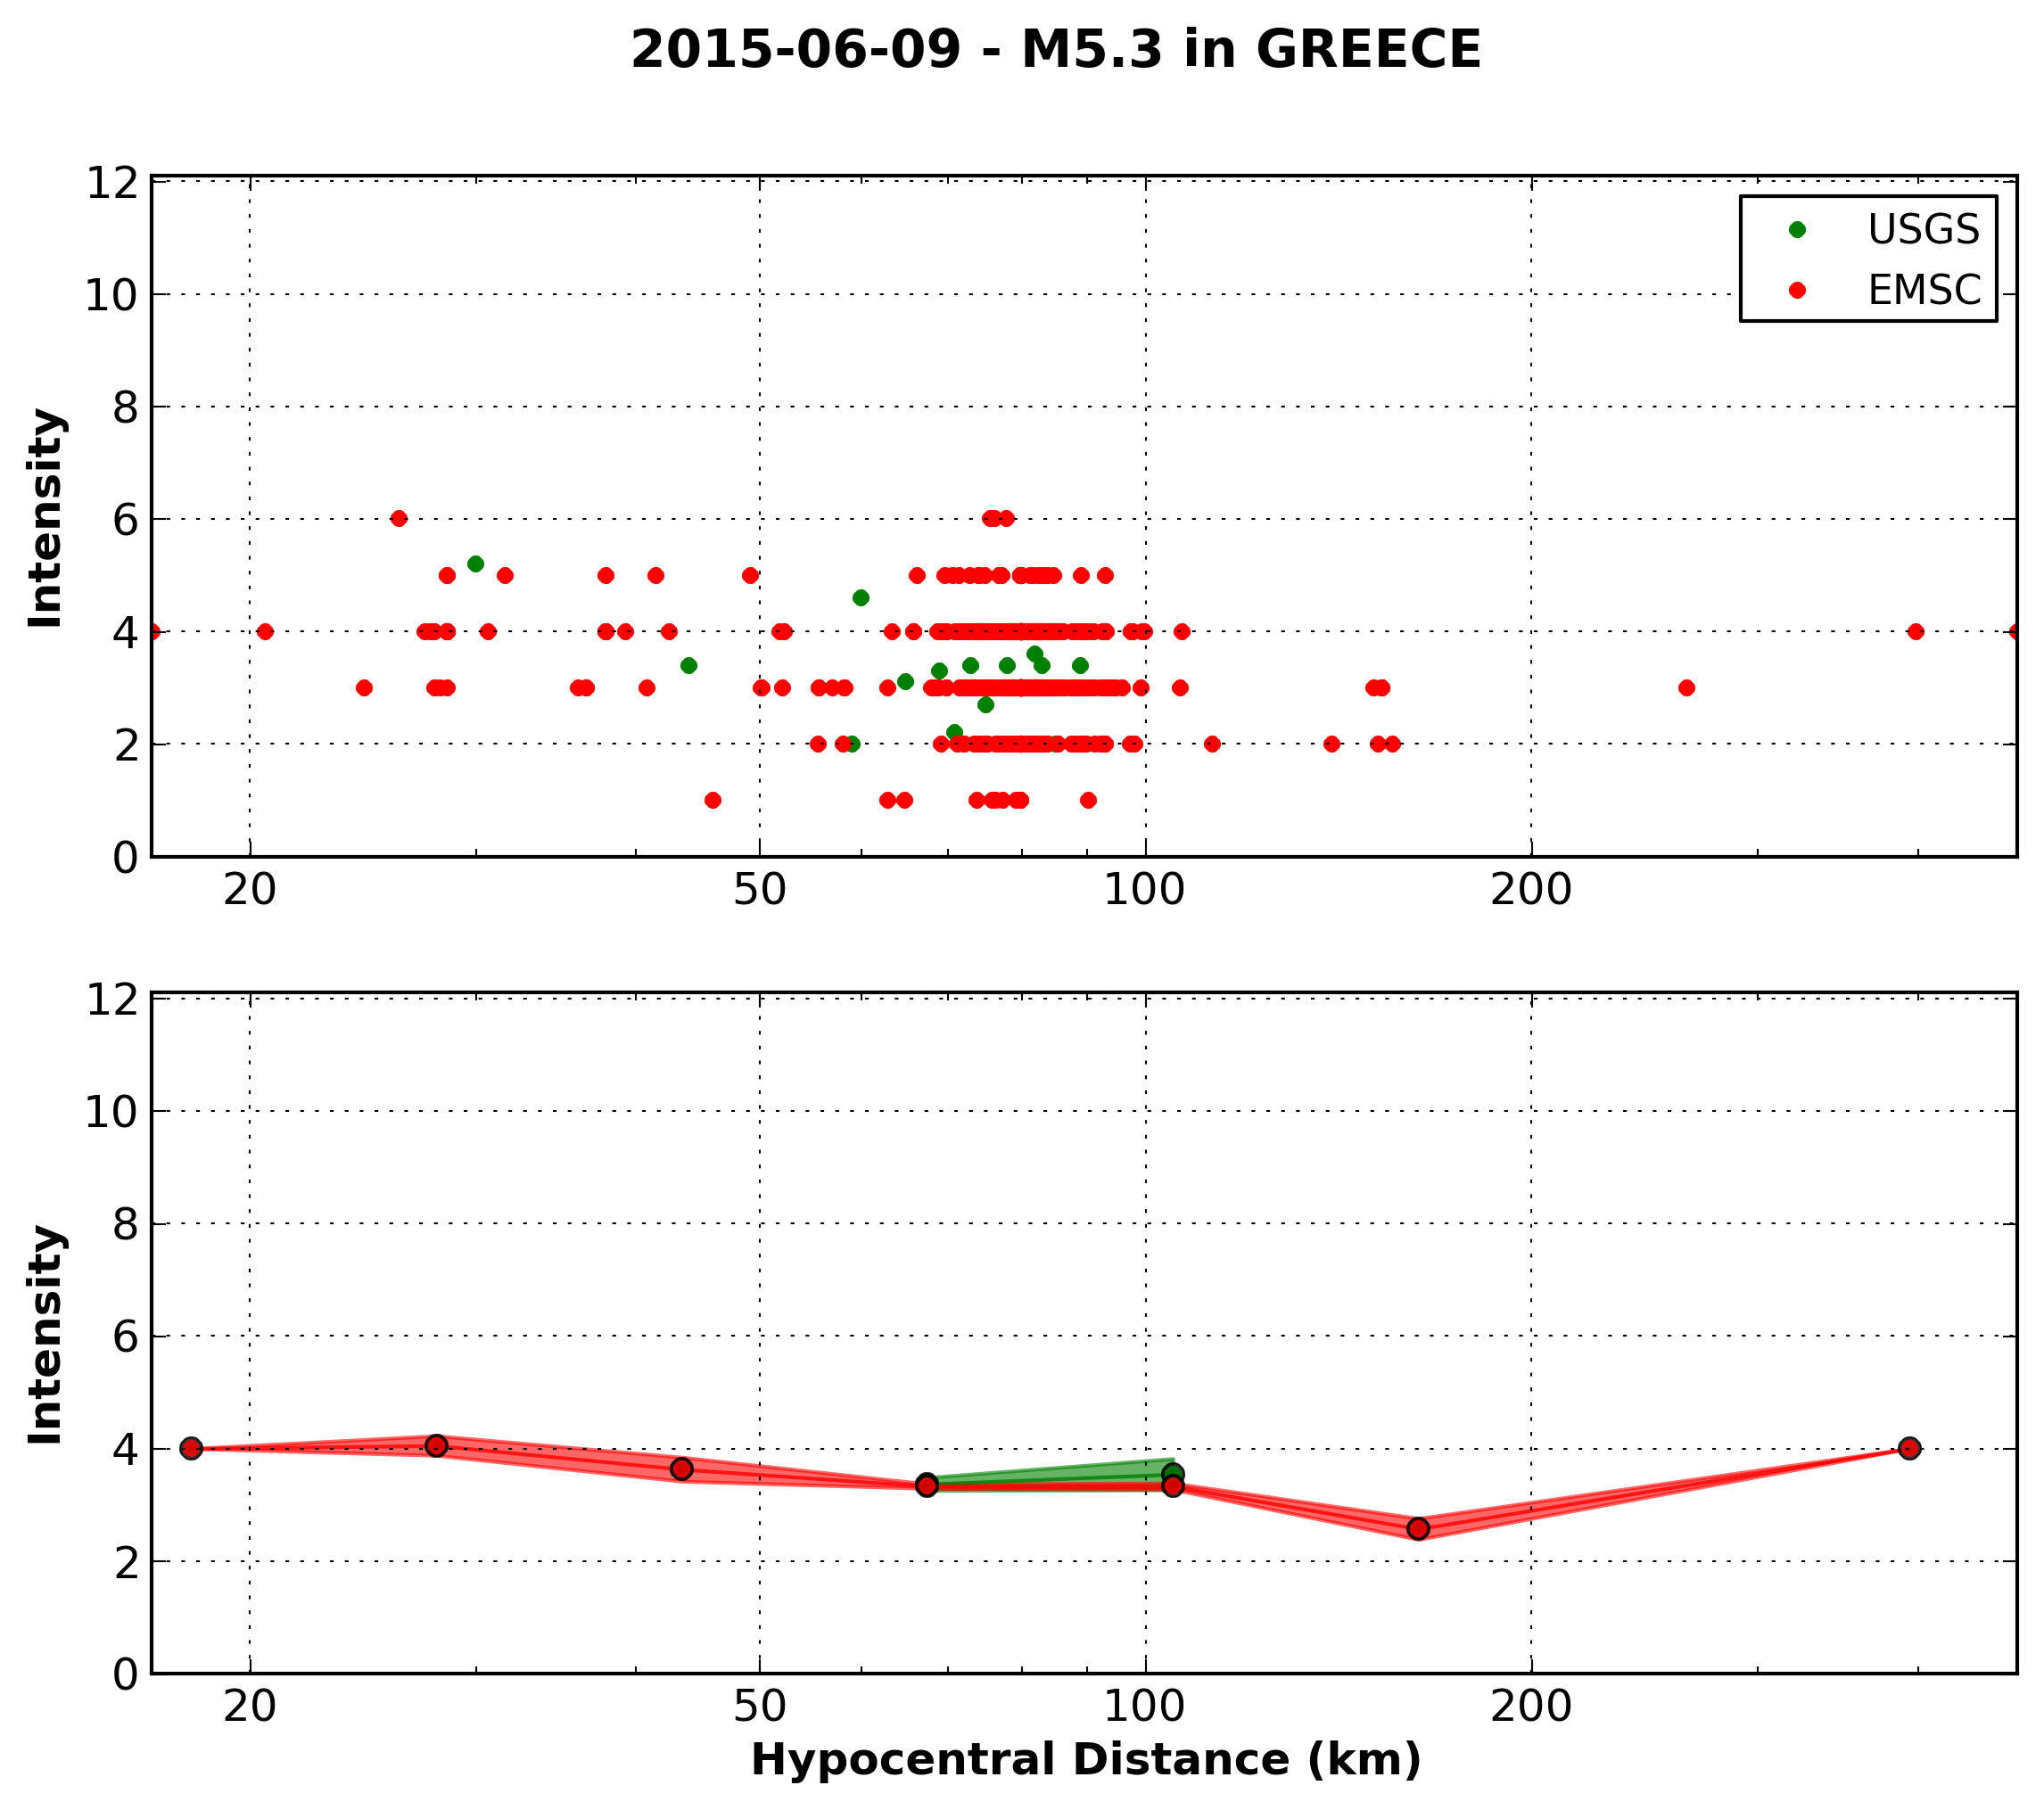
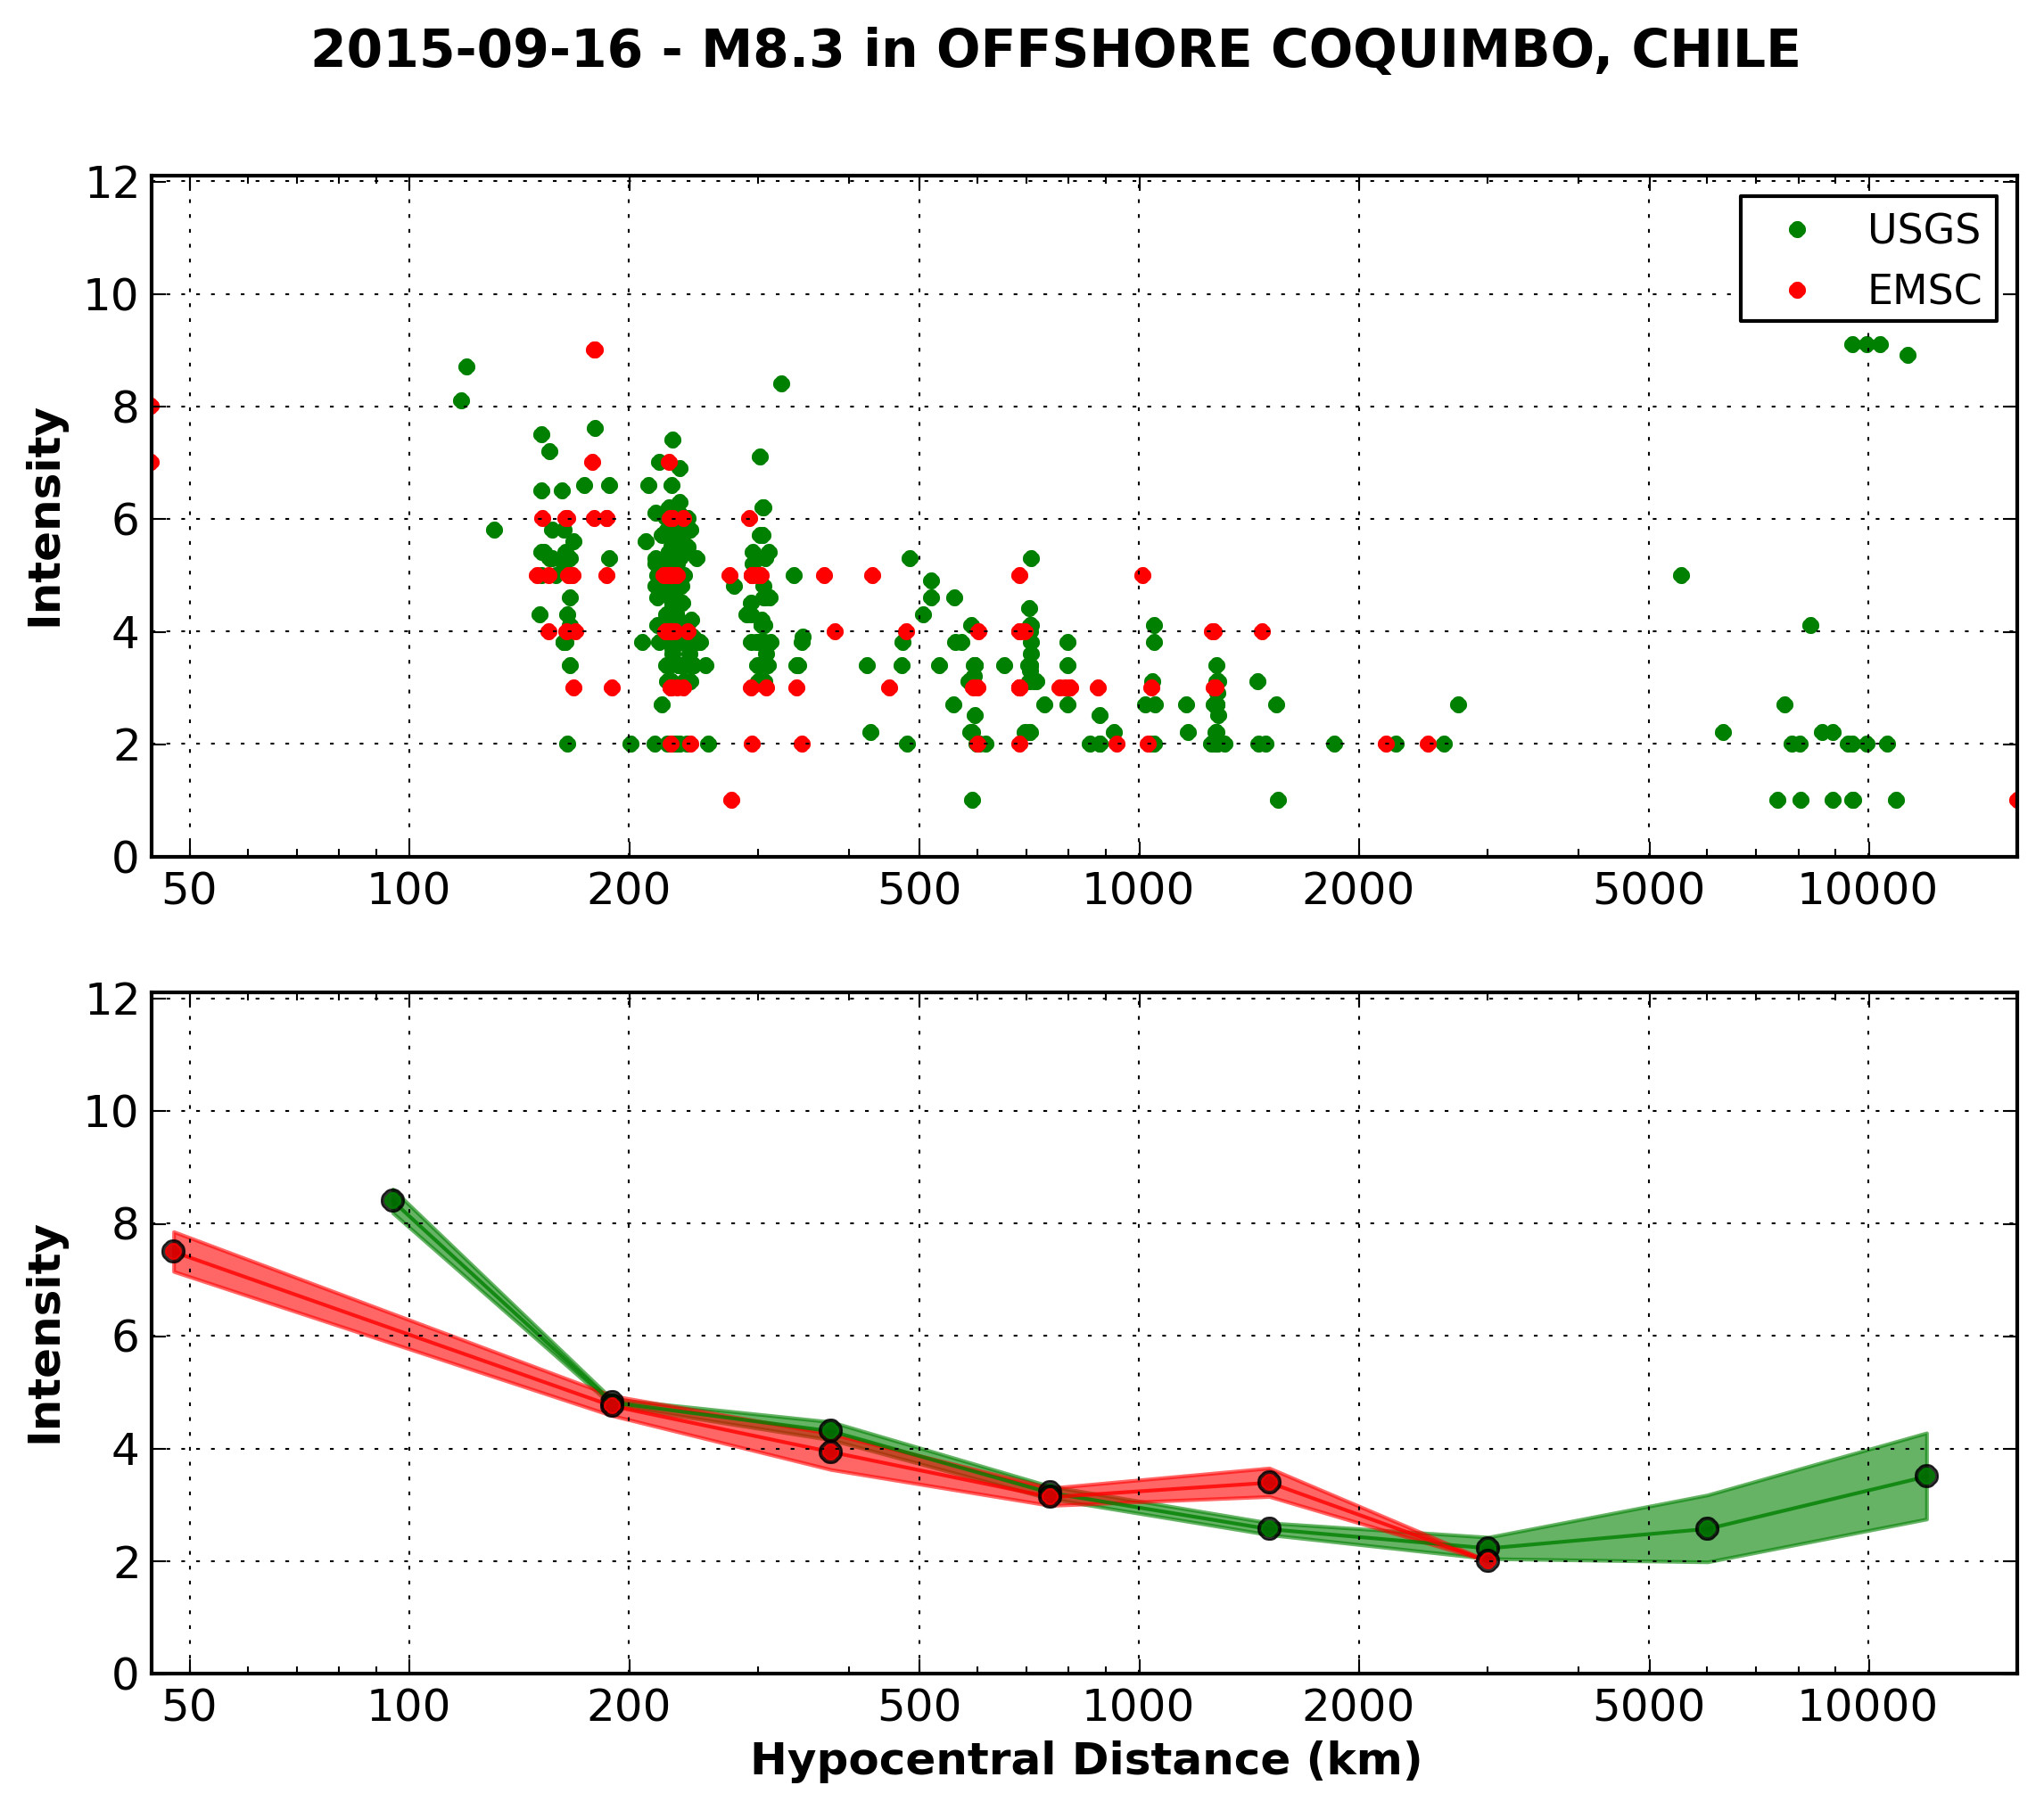
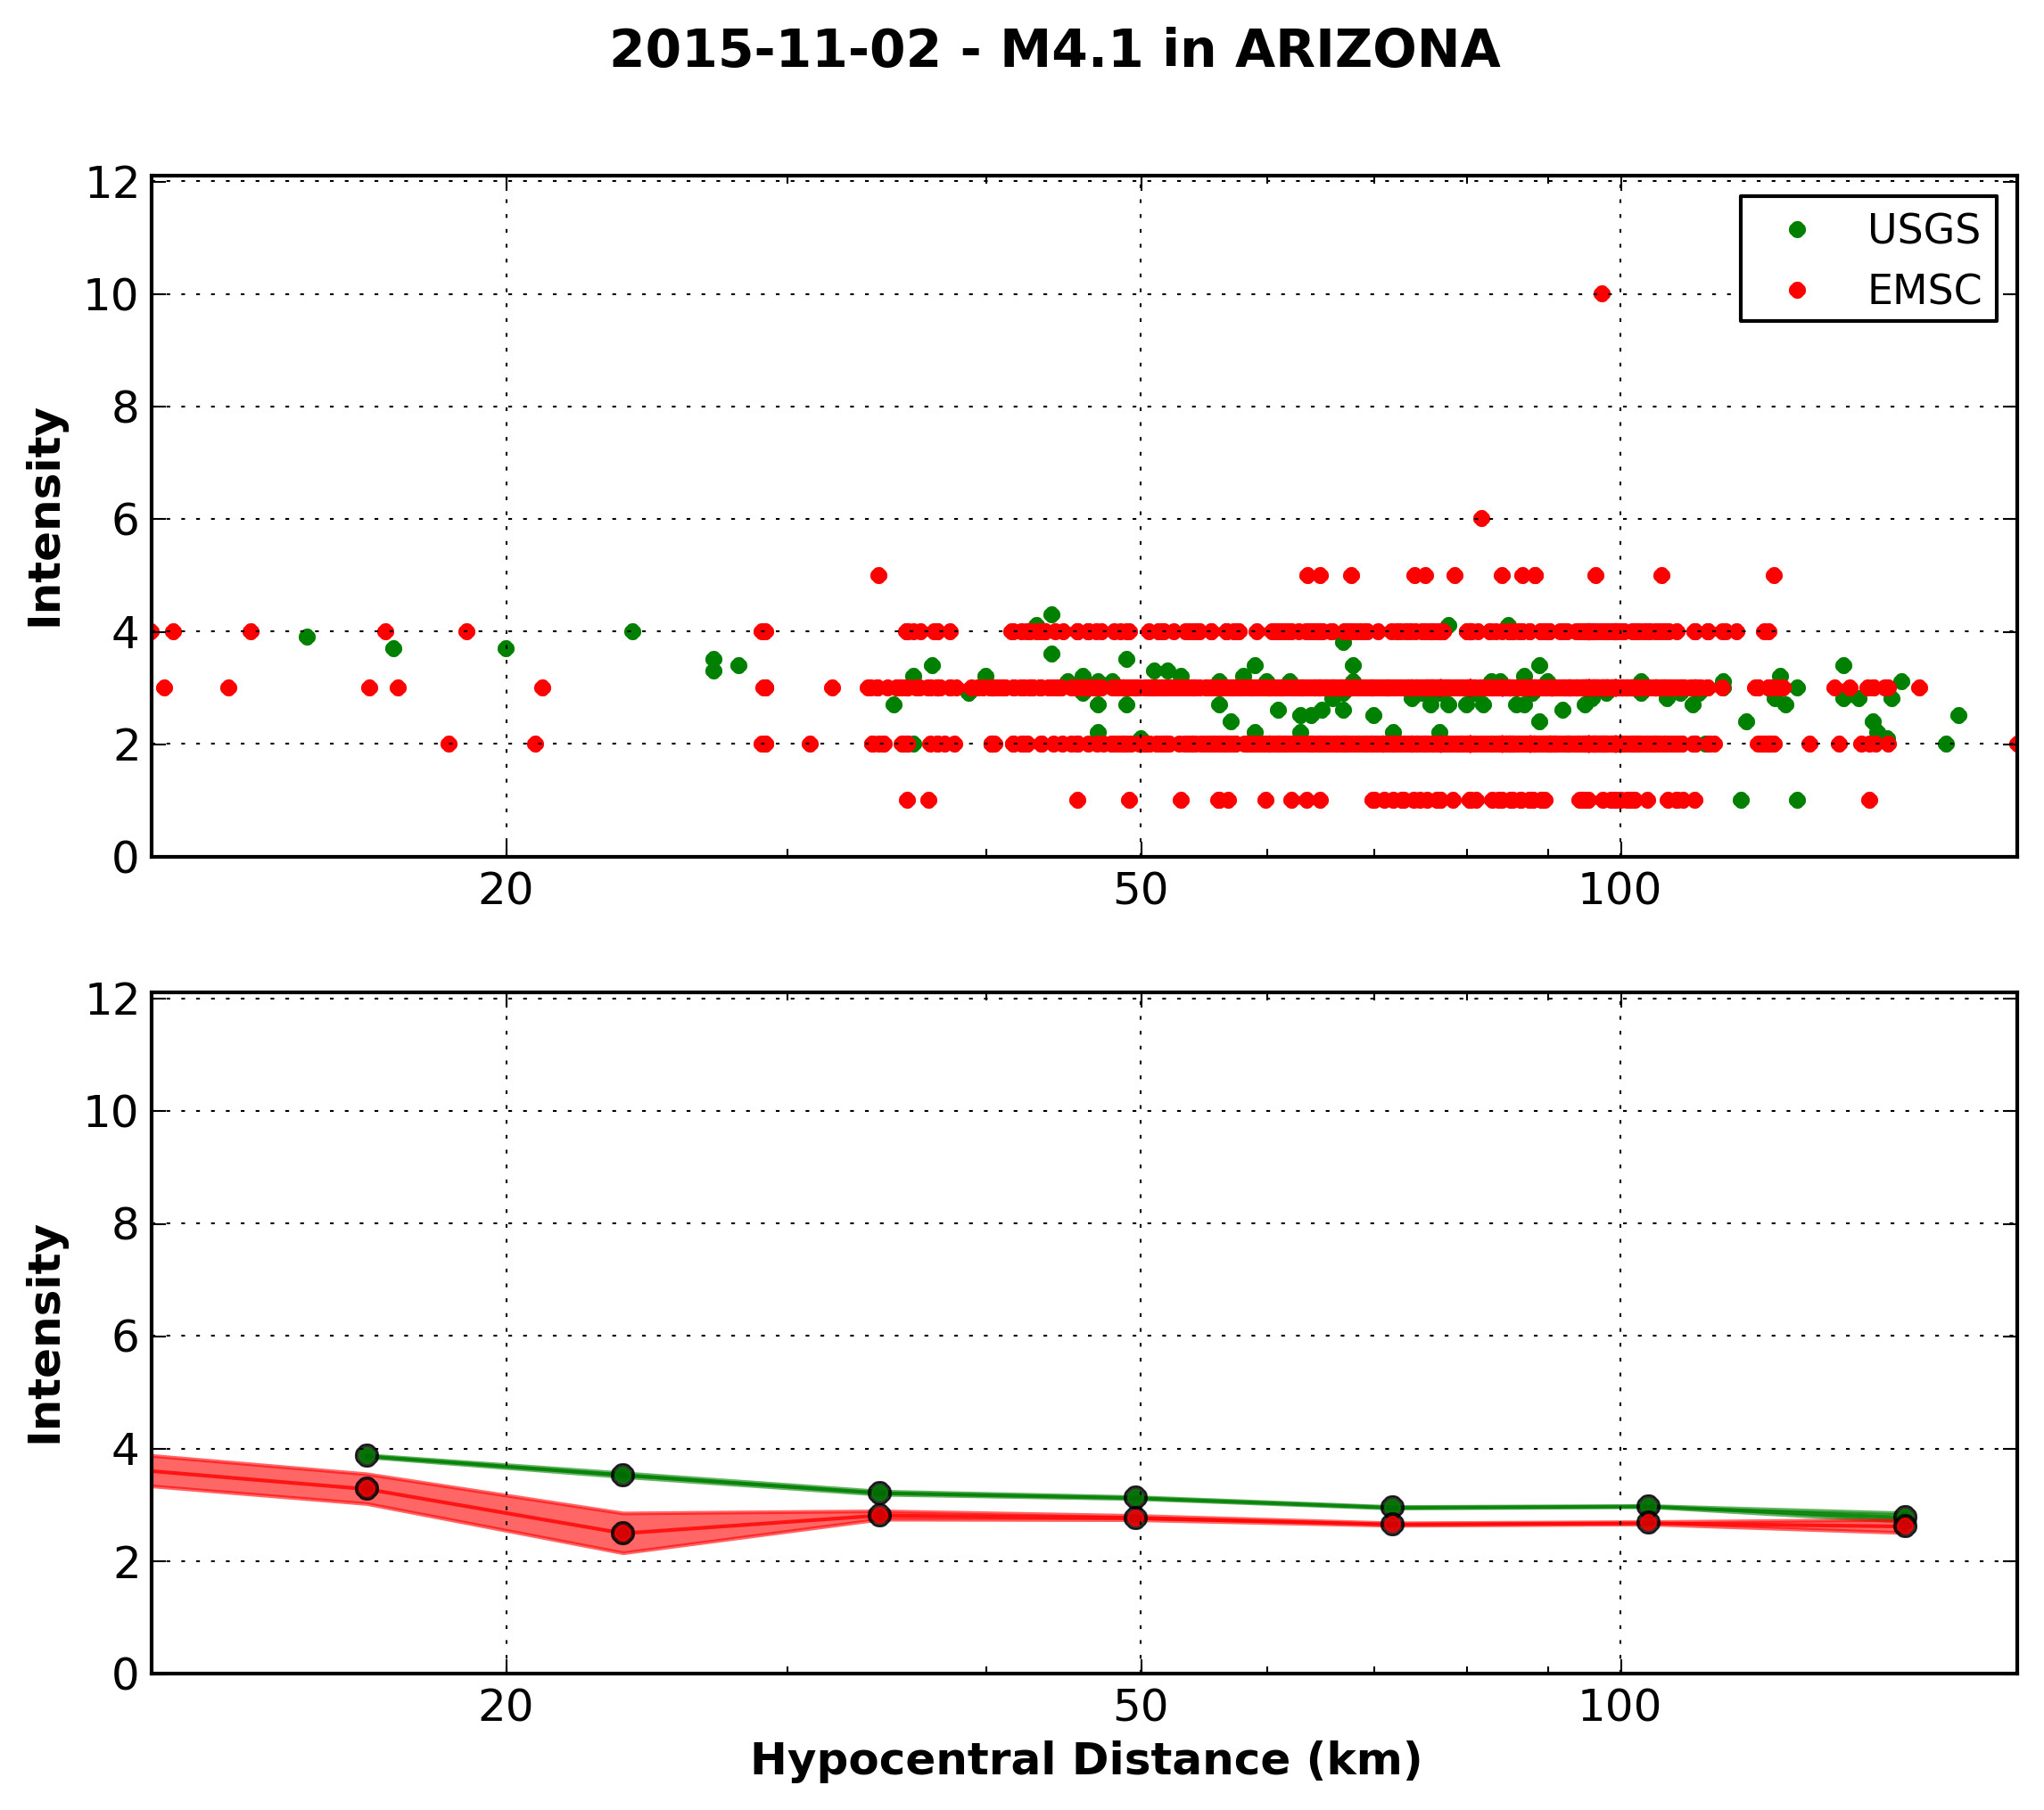
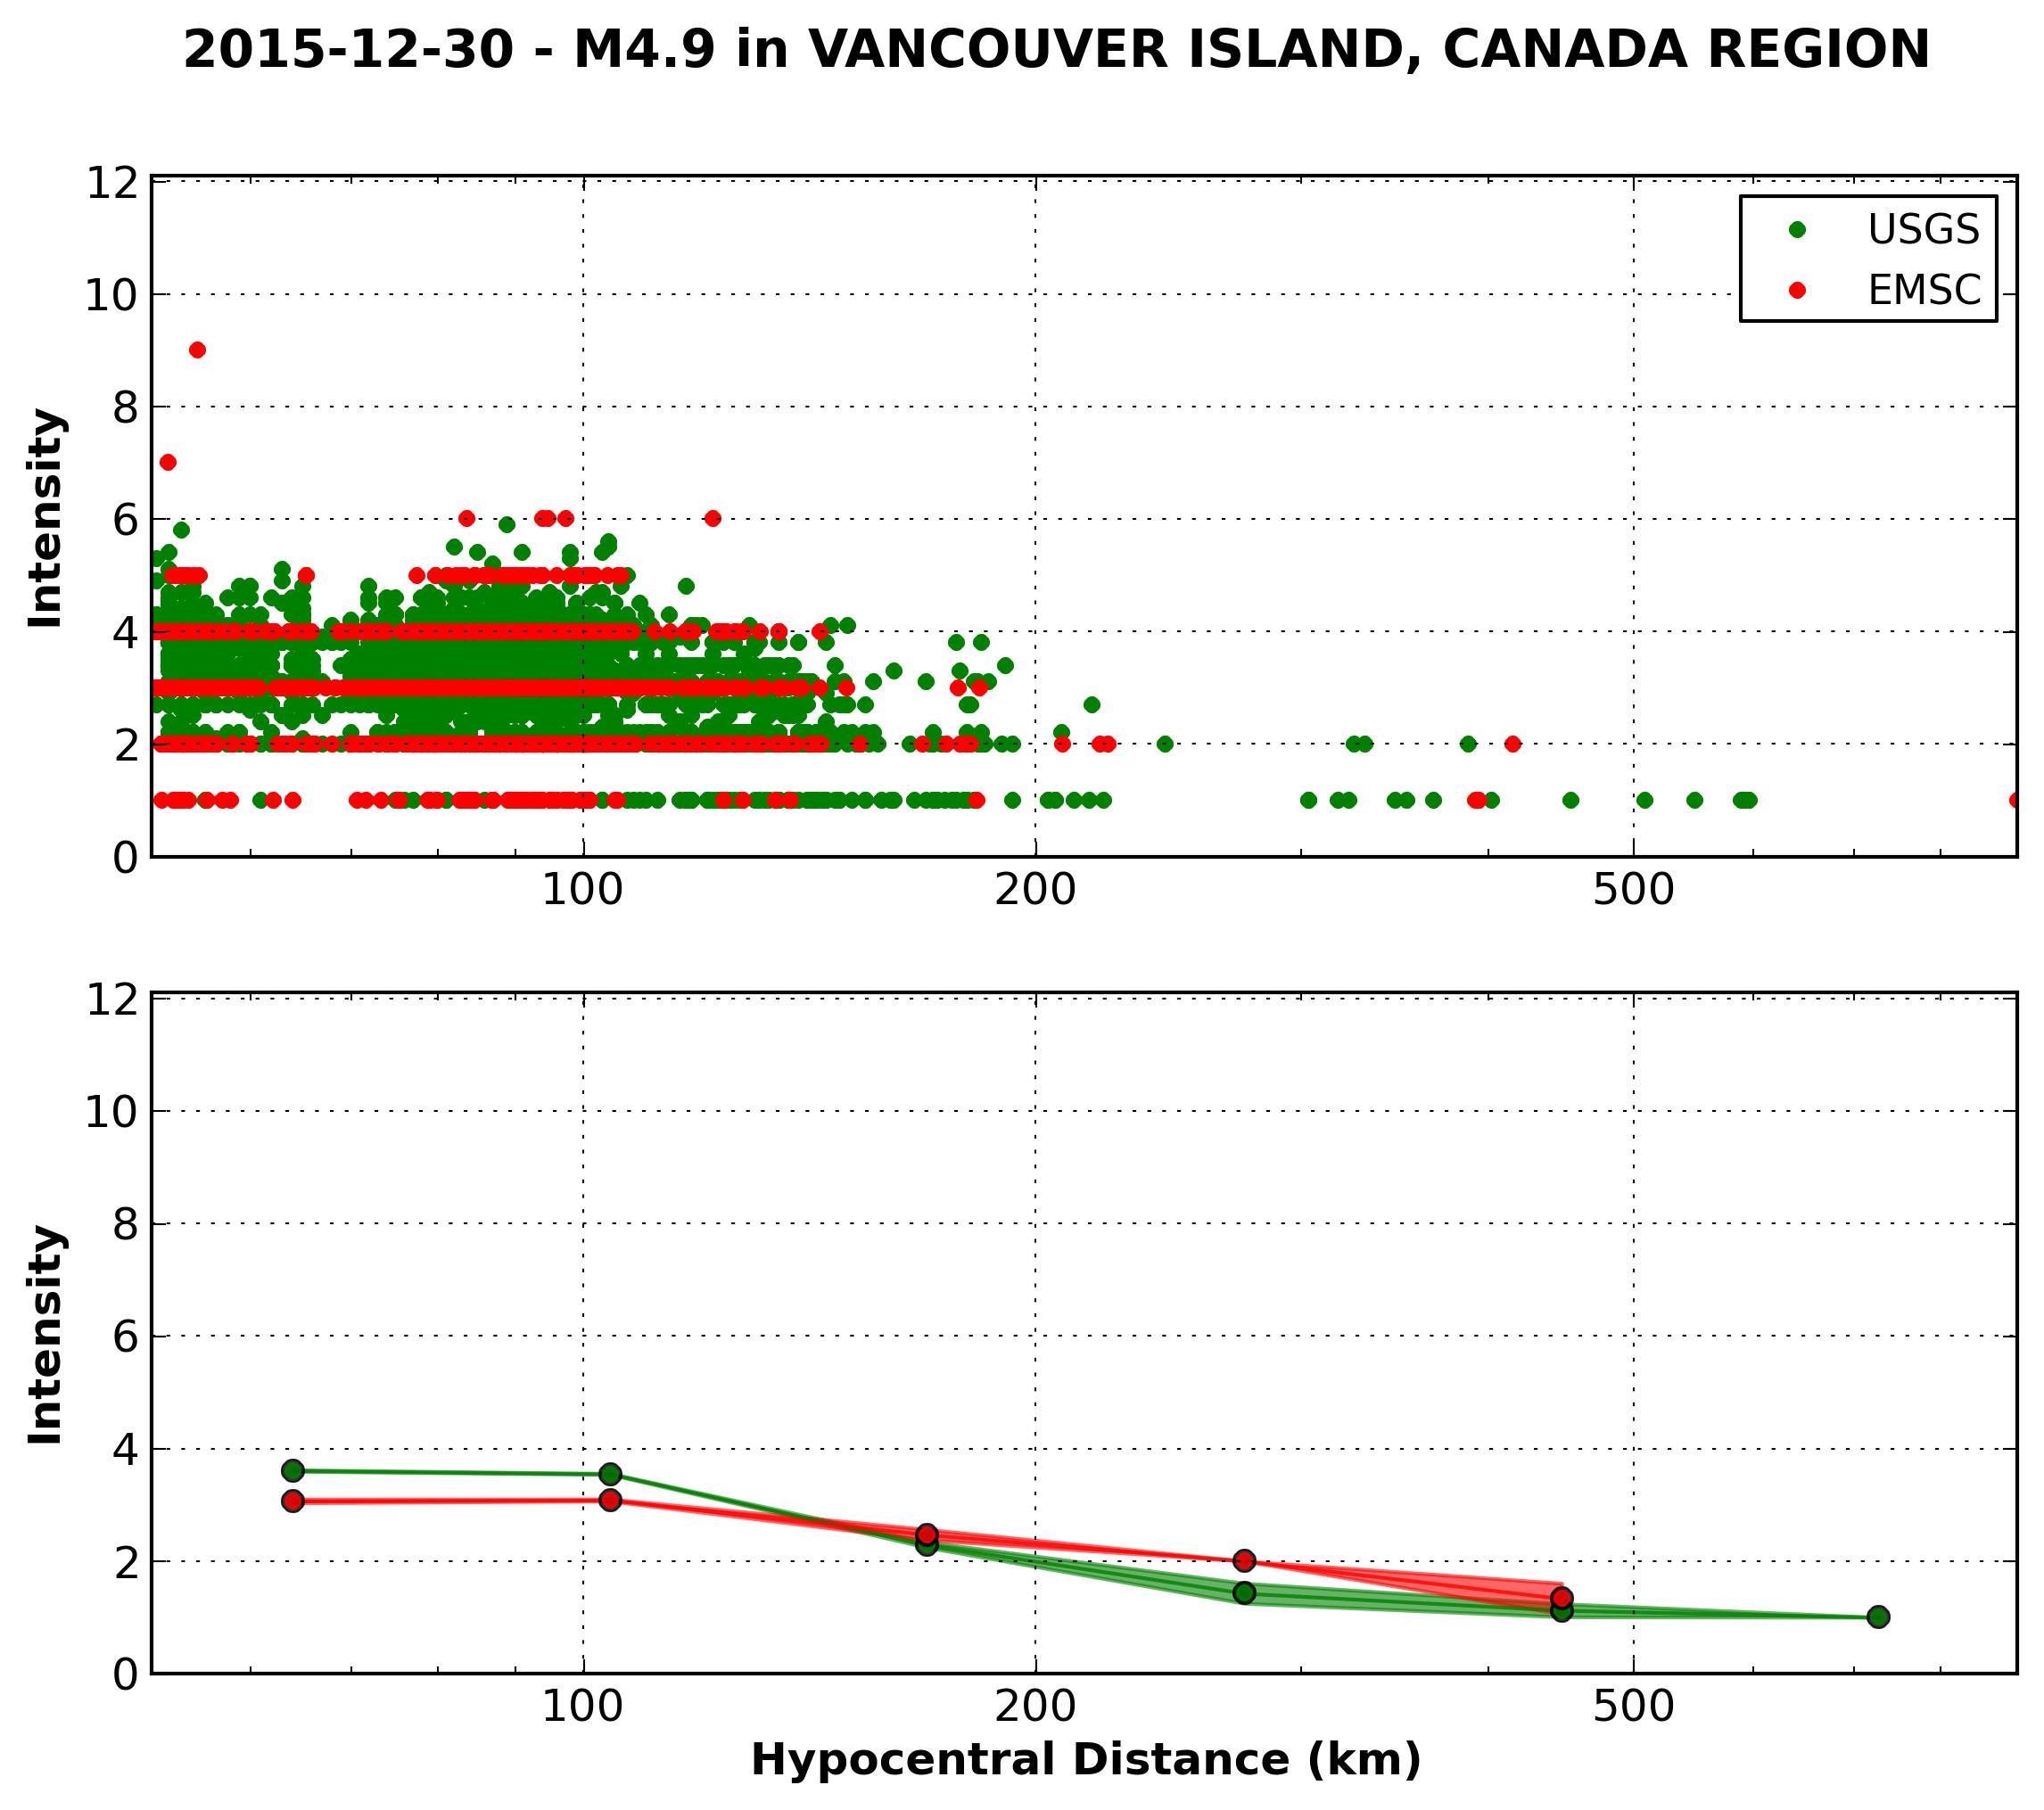
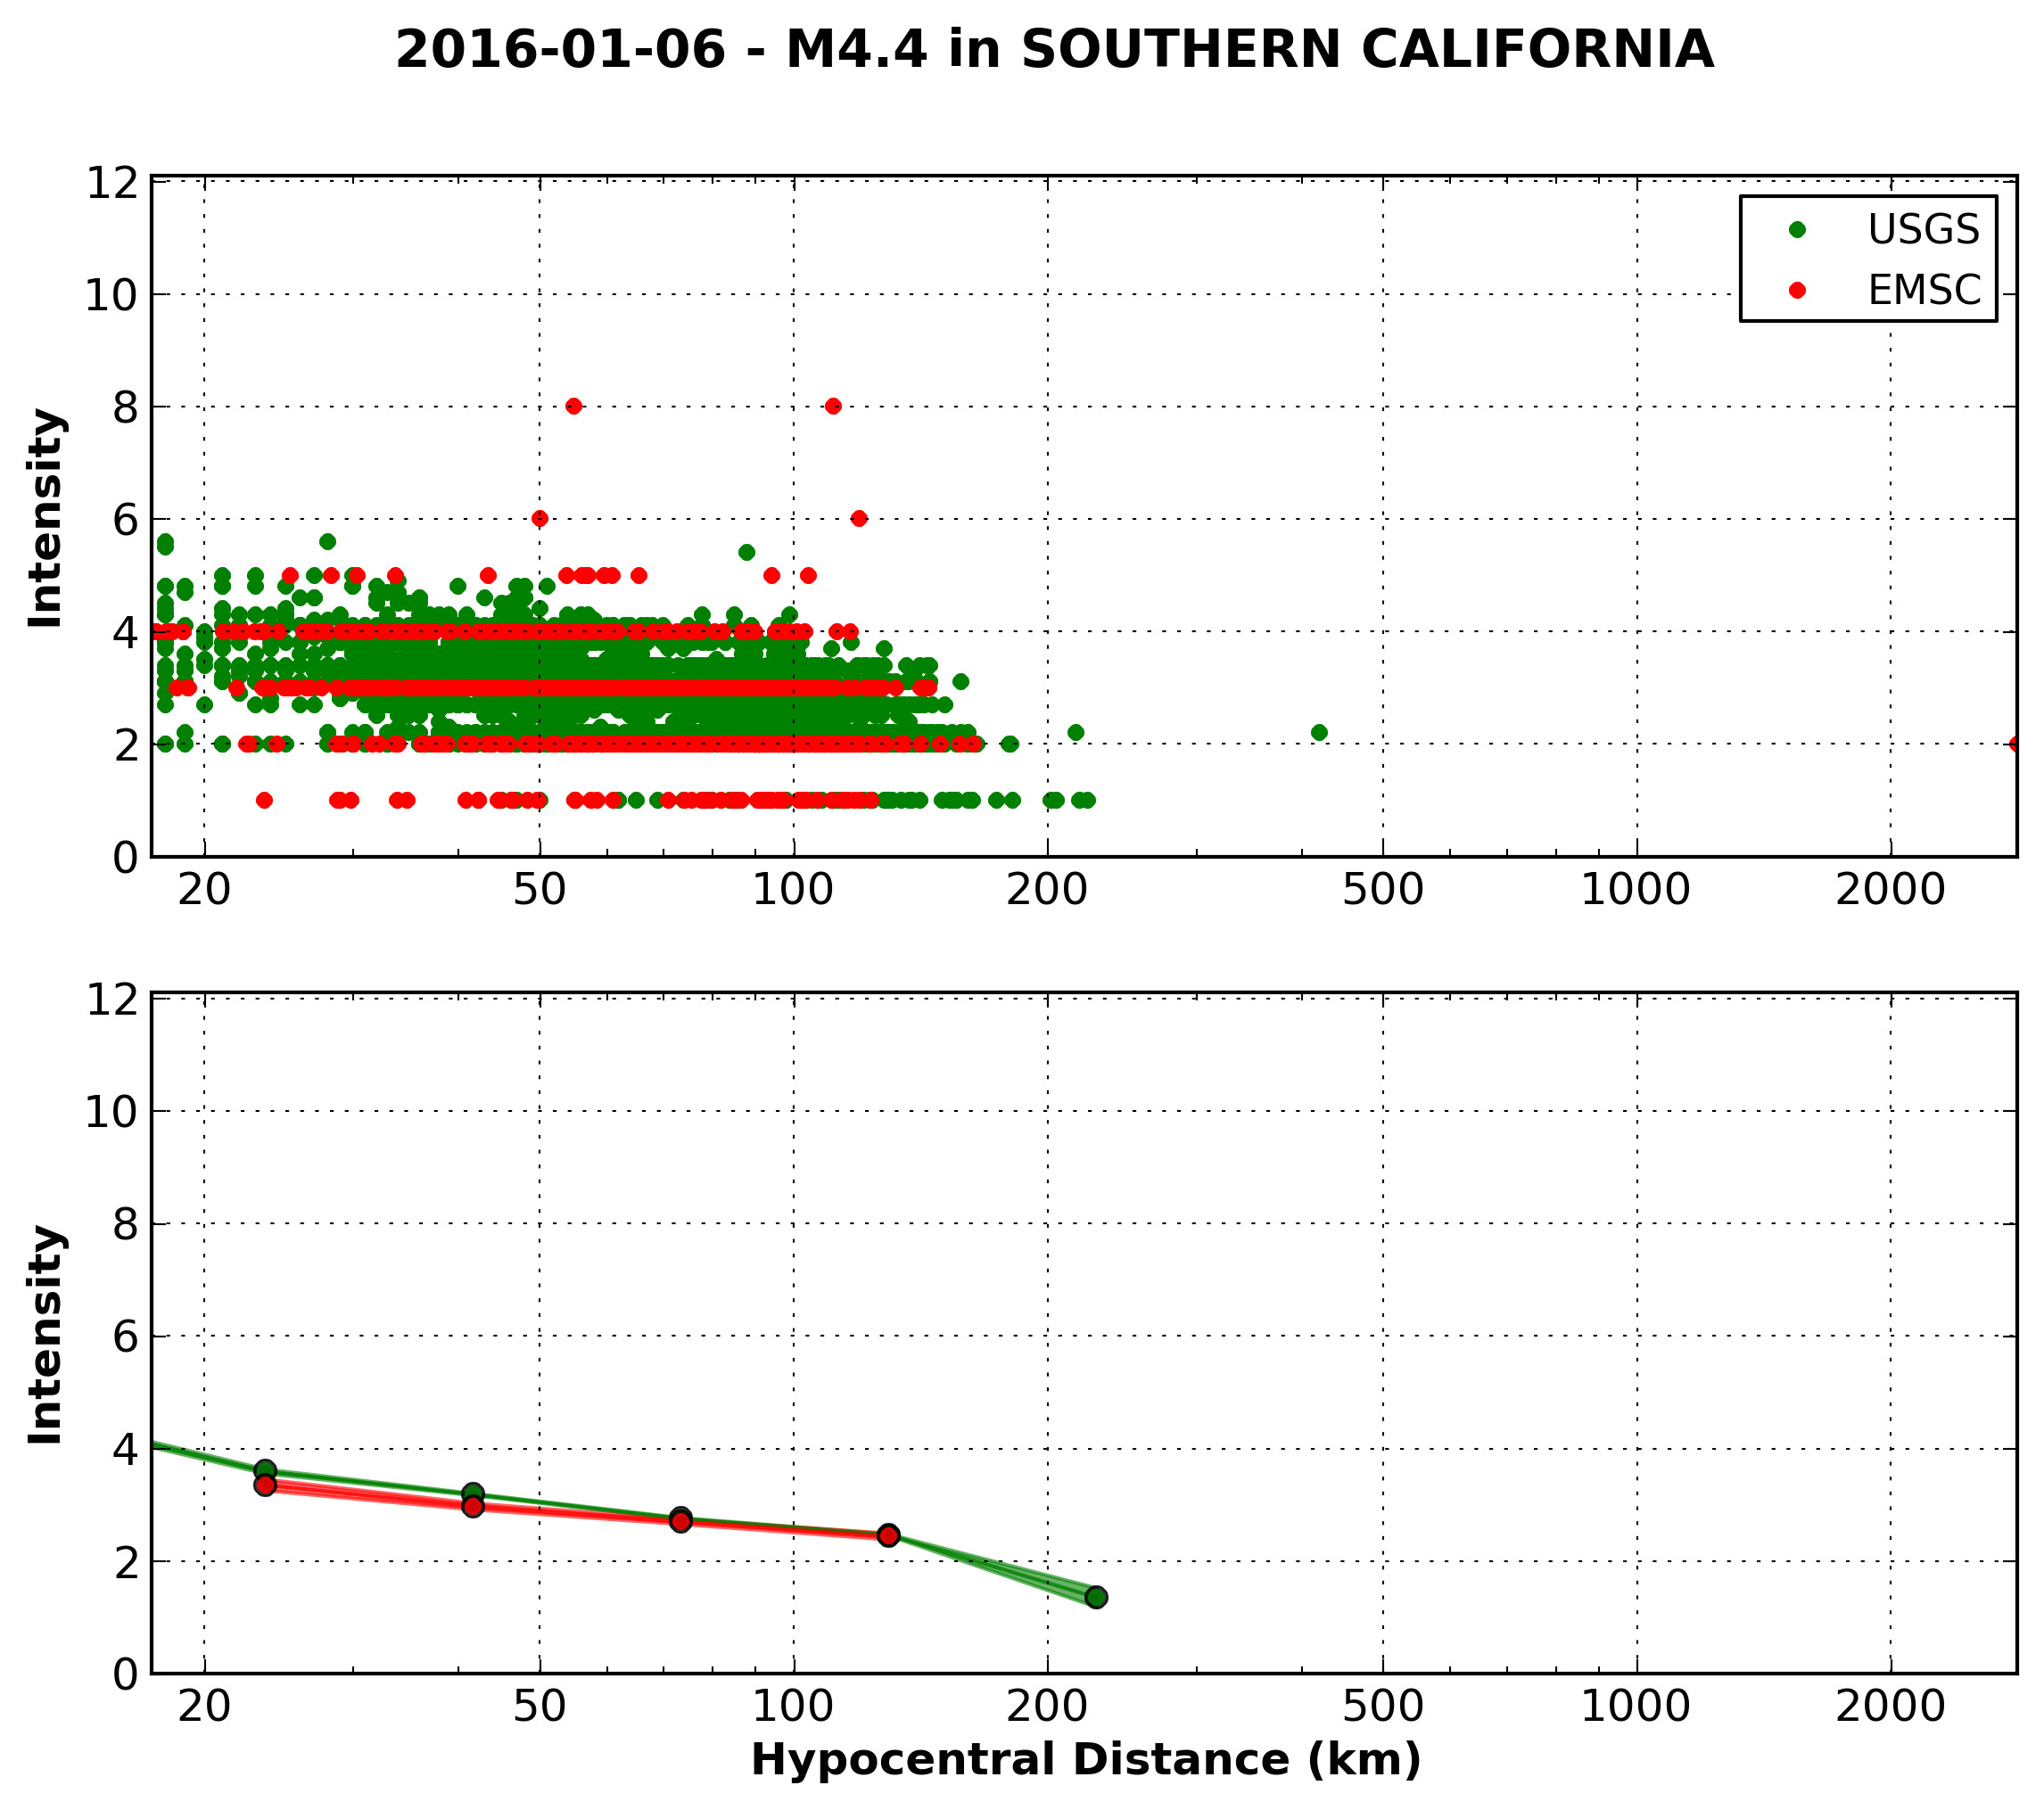
Figure S3. (Top) Individual intensity assignments from EMSC individual intensities (red dots) and DYFI geocoded data (Wald et al., 1999, 2011) (green dots) for the 5 August 2014 M 5.5 South Africa earthquake. (Bottom) Bin averaged mean values for the same datasets. Shading indicates ±1 standard deviation of the mean calculated for each (logarithmic) distance bin.
Figure S4. Same as Figure S3 for the 24 August 2014 M 6.1 Napa, California, earthquake.
Figure S5. Same as Figure S3 for the 23 February 2015 M 4.8 Spain earthquake.
Figure S6. Same as Figure S3 for the 2 May 2015 M 4.2 Michigan, U.S.A., earthquake.
Figure S7. Same as Figure S3 for the 22 May 2015 M 4.2 England, United Kingdom, earthquake.
Figure S8. Same as Figure S3 for the 4 June 2015 M 6.0 Malaysia earthquake.
Figure S9. Same as Figure S3 for the 9 June 2015 M 5.3 Greece earthquake.
Figure S10. Same as Figure S3 for the 16 September 2015 M 8.3 Chile earthquake.
Figure S11. Same as Figure S3 for the 2 November 2015 M 4.1 Arizona, U.S.A., earthquake.
Figure S12. Same as Figure S3 for the 30 December 2015 M 4.9 Vancouver, Canada, earthquake.
Figure S13. Same as Figure S3 for the 6 January 2016 M 4.4 California, U.S.A., earthquake.
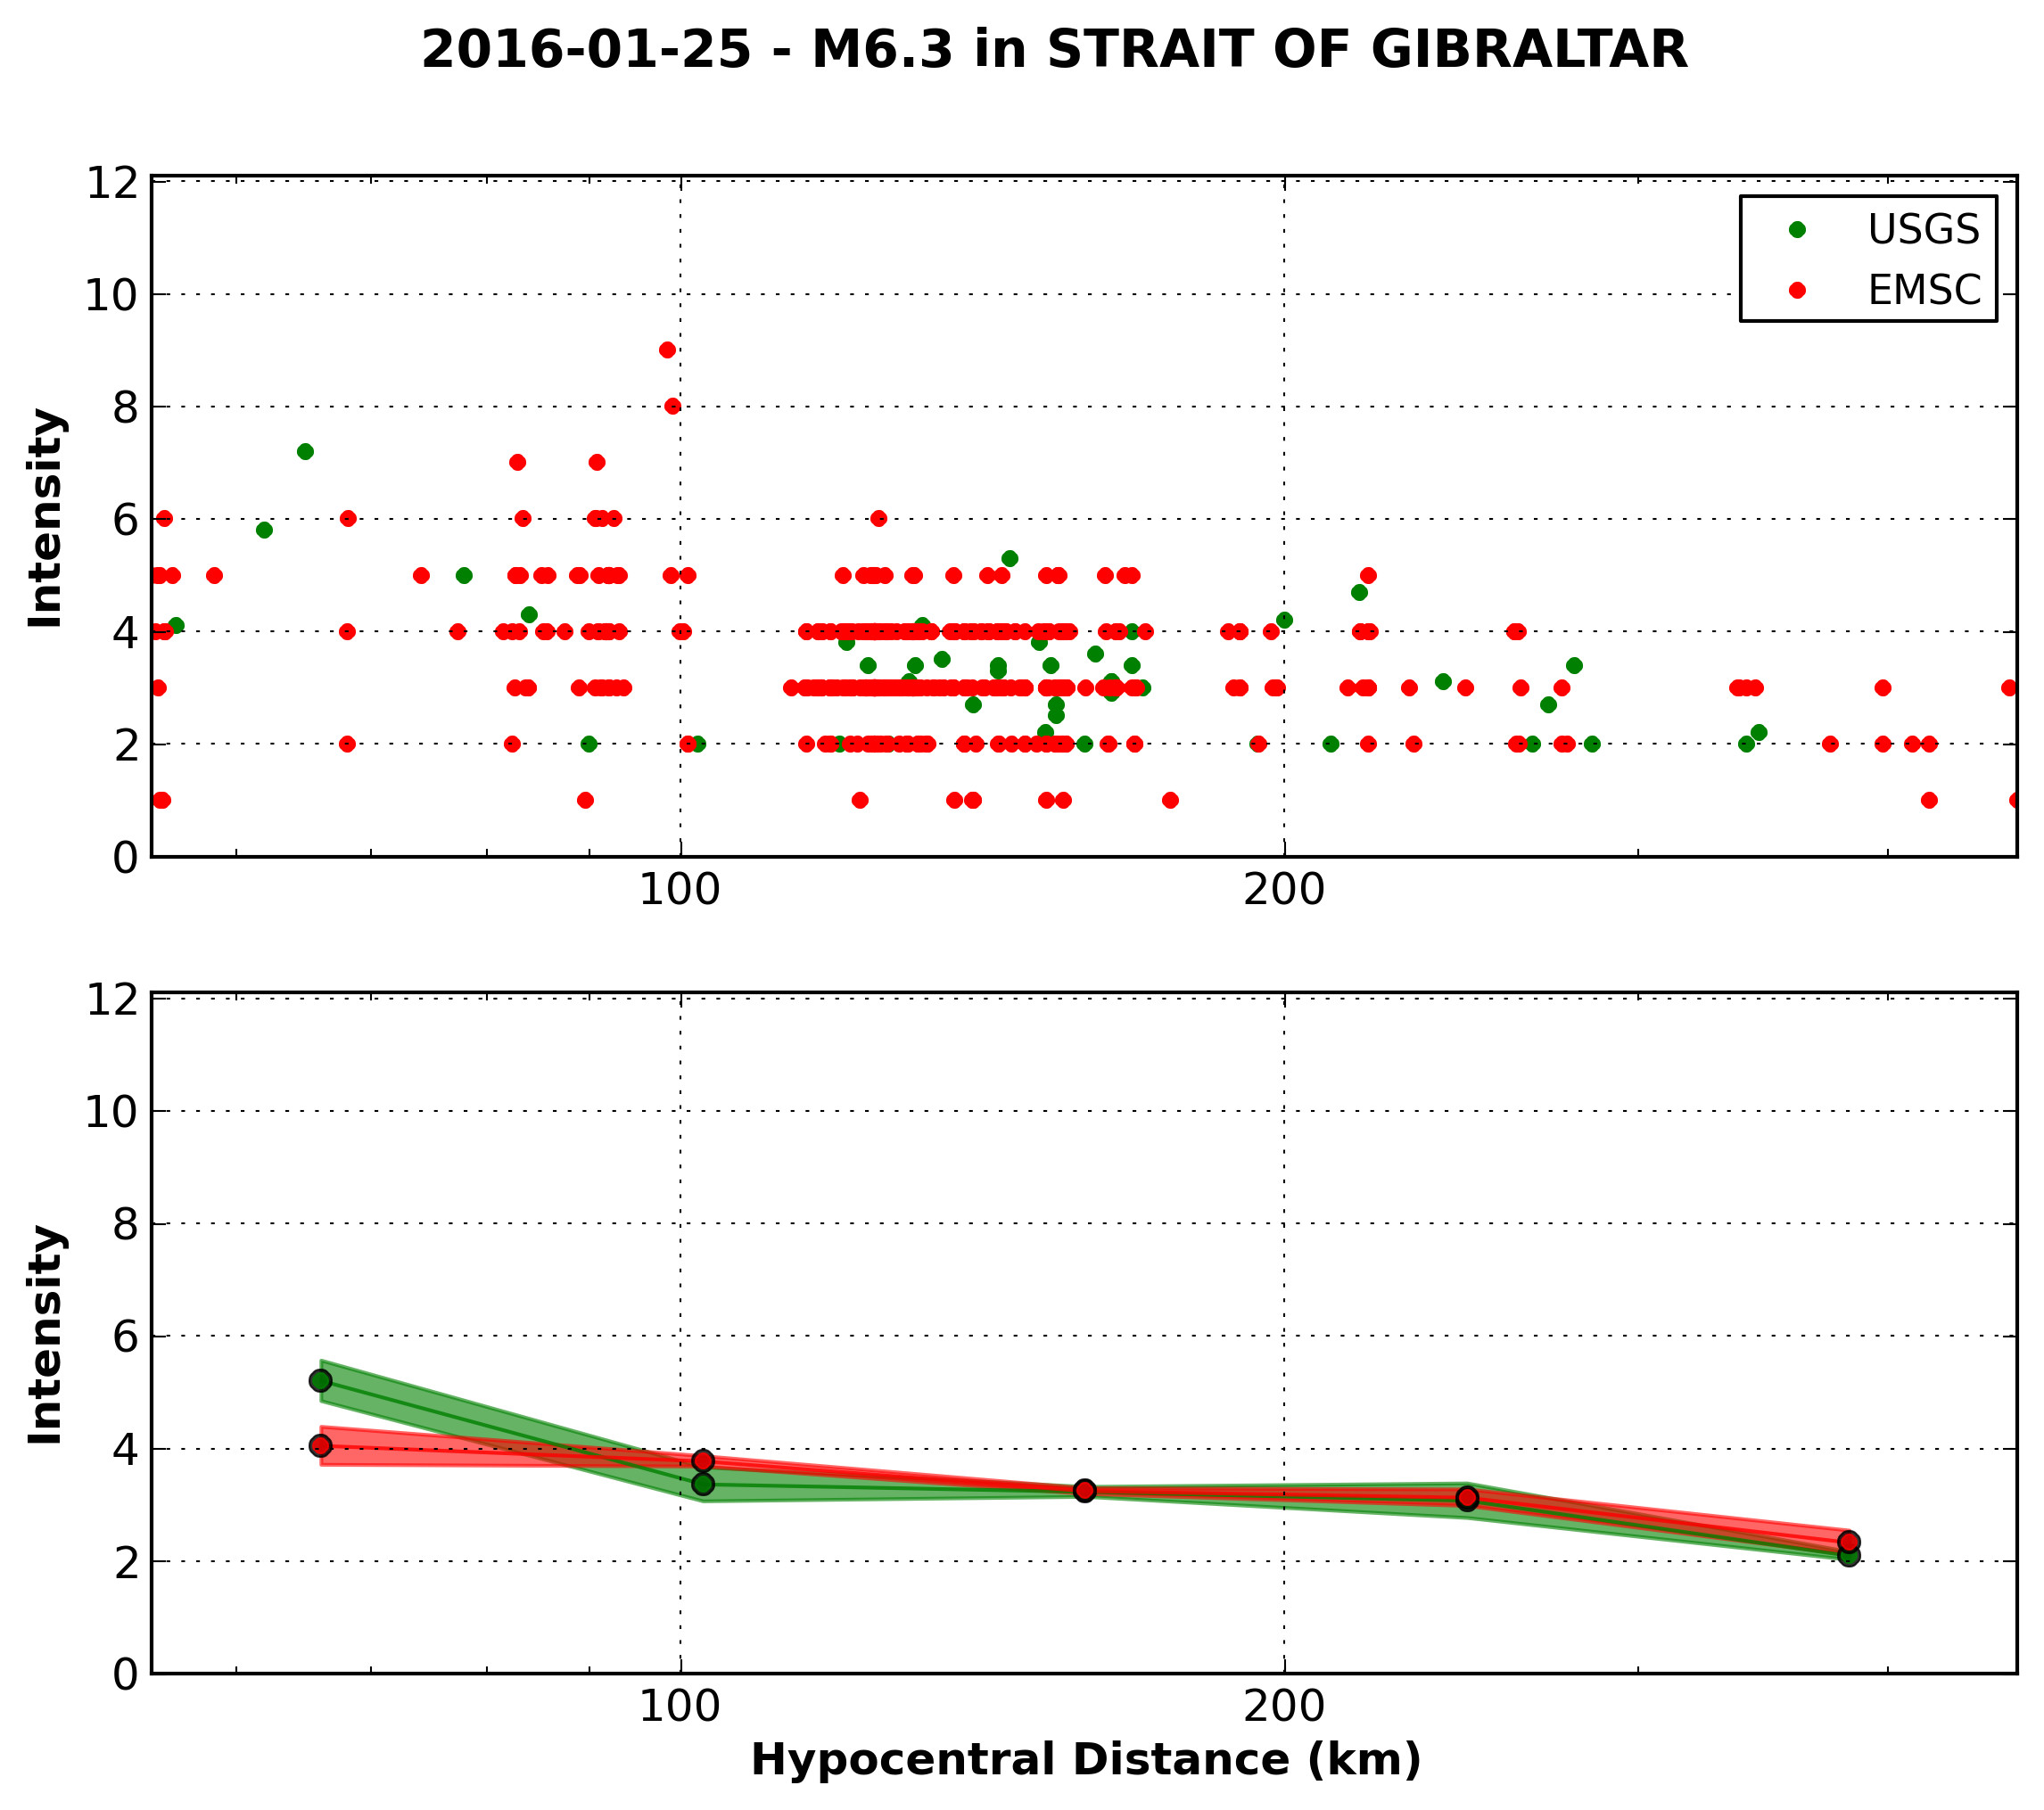
Figure S14. Same as Figure S3 for the 25 January 2016 M 6.3 Gibraltar earthquake.
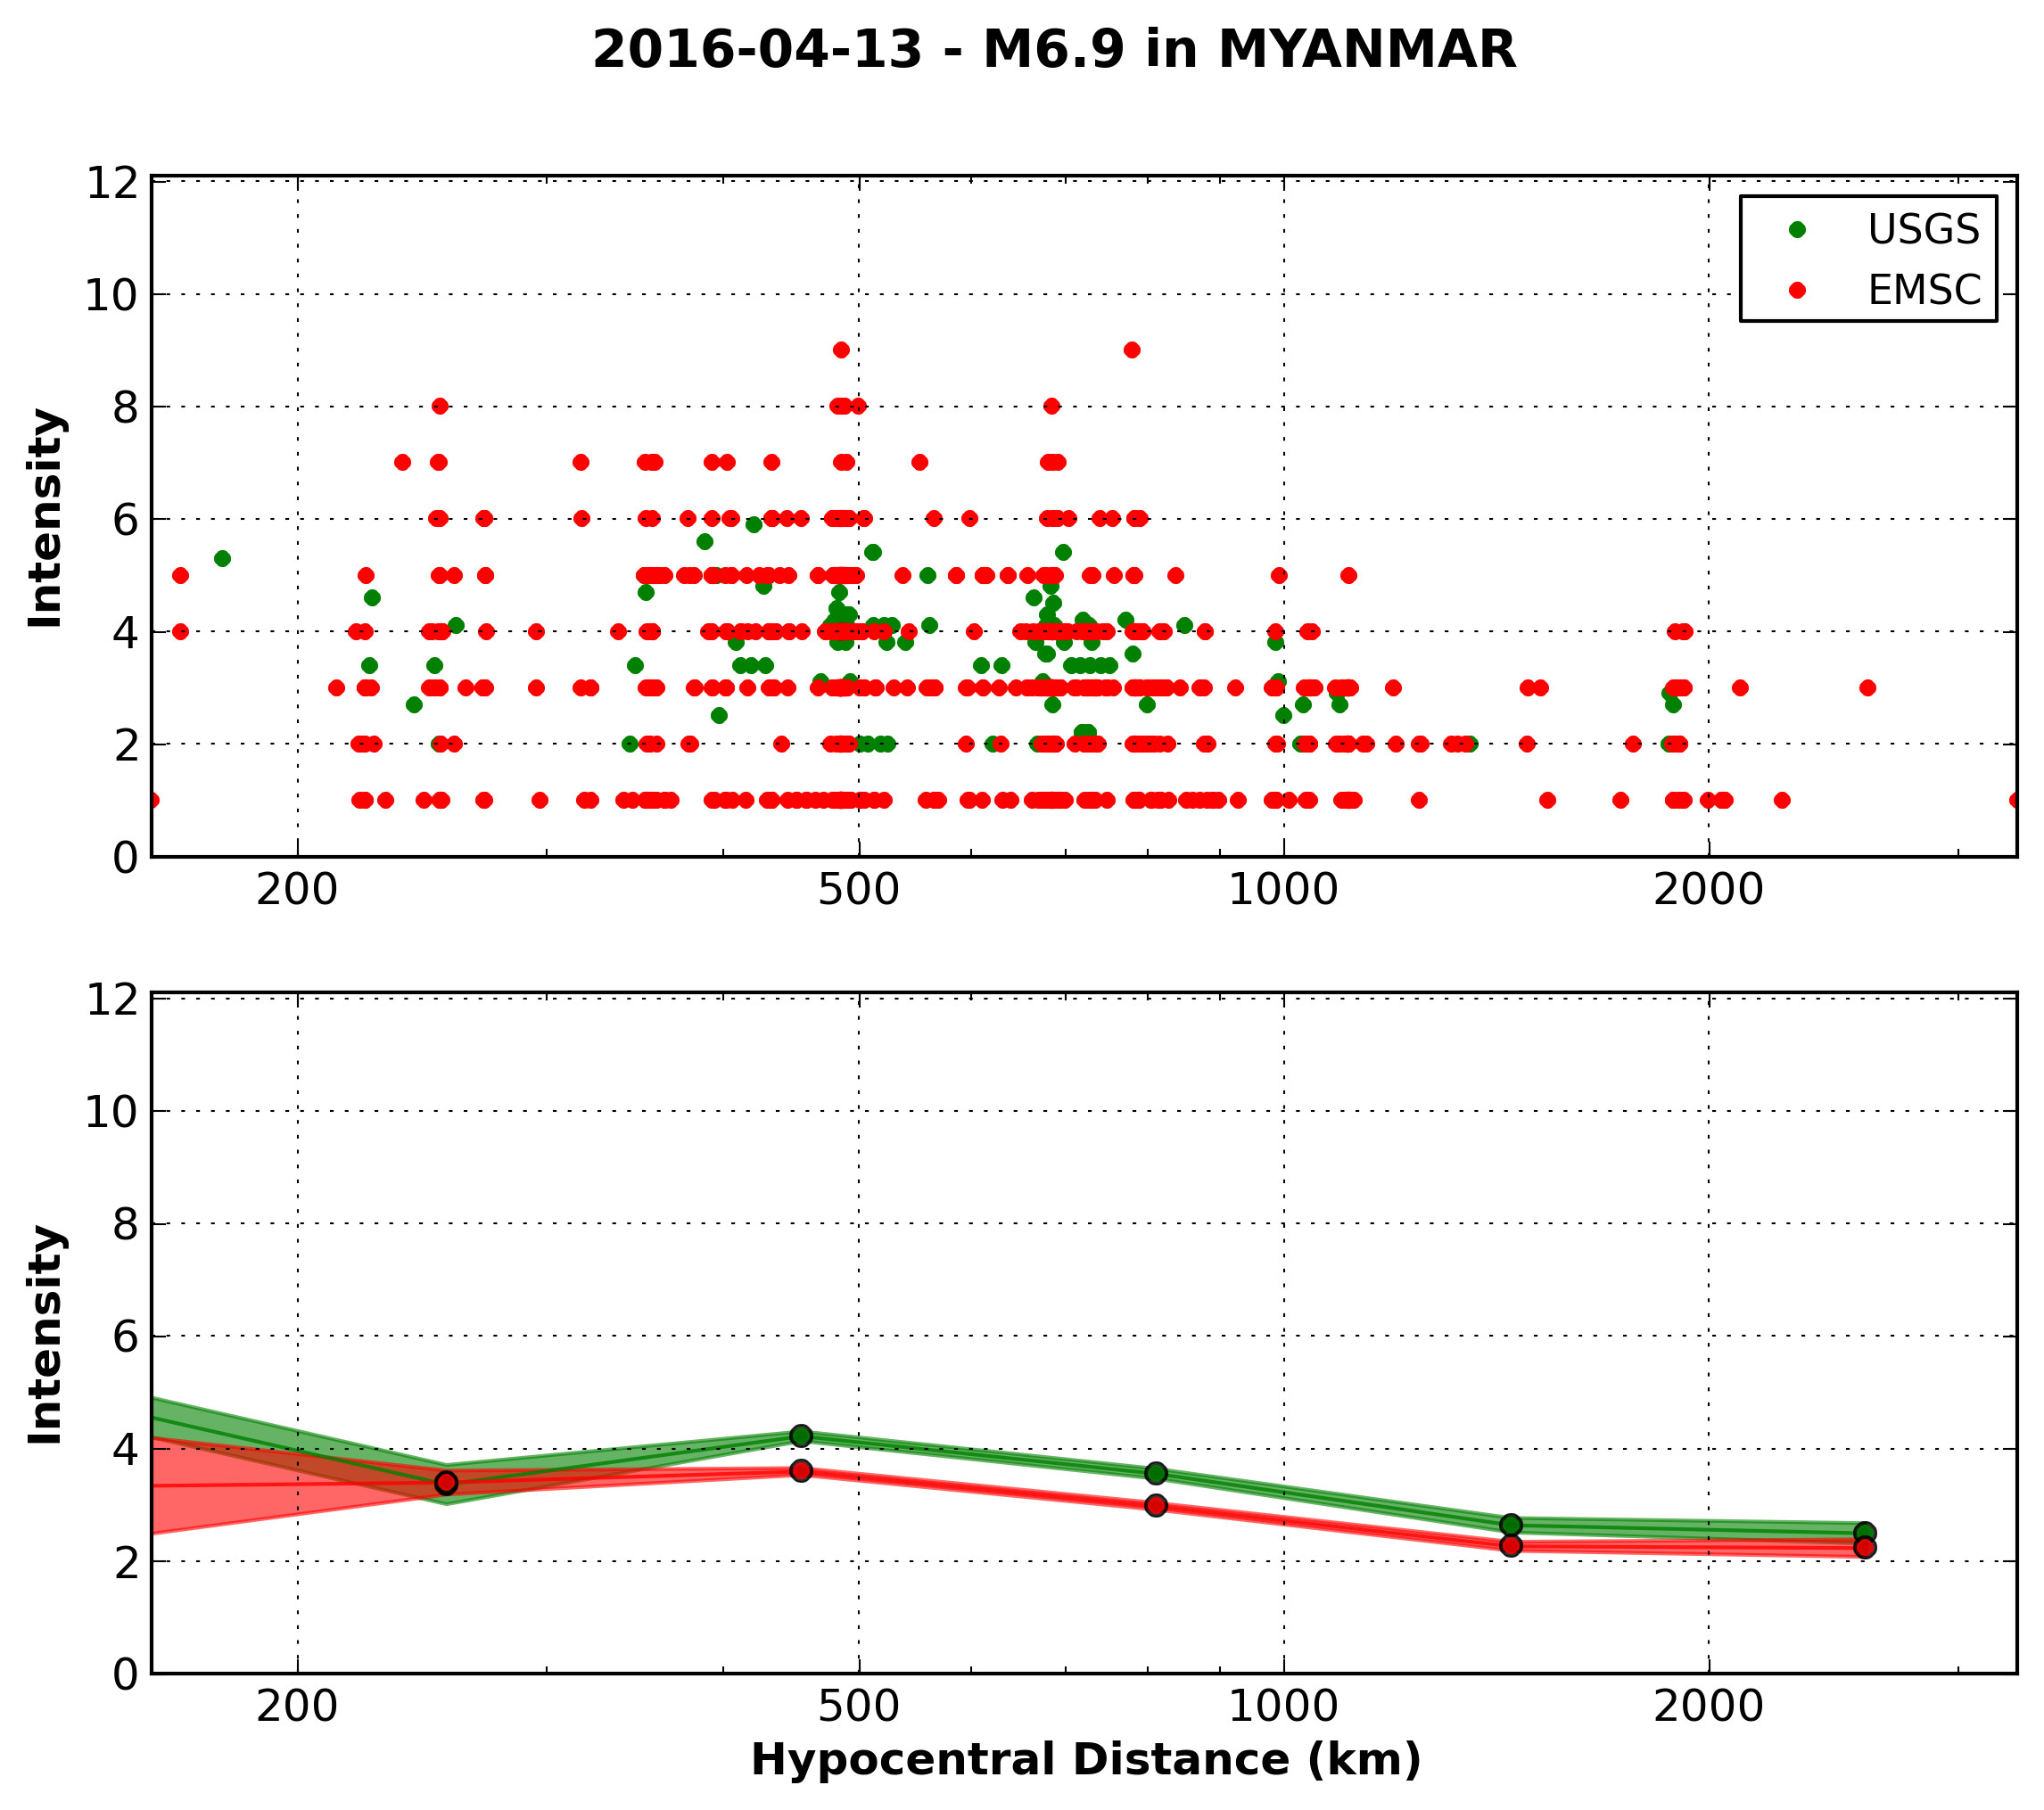
Figure S15. Same as Figure S3 for the 13 April 2015, M 6.9 Myanmar earthquake.
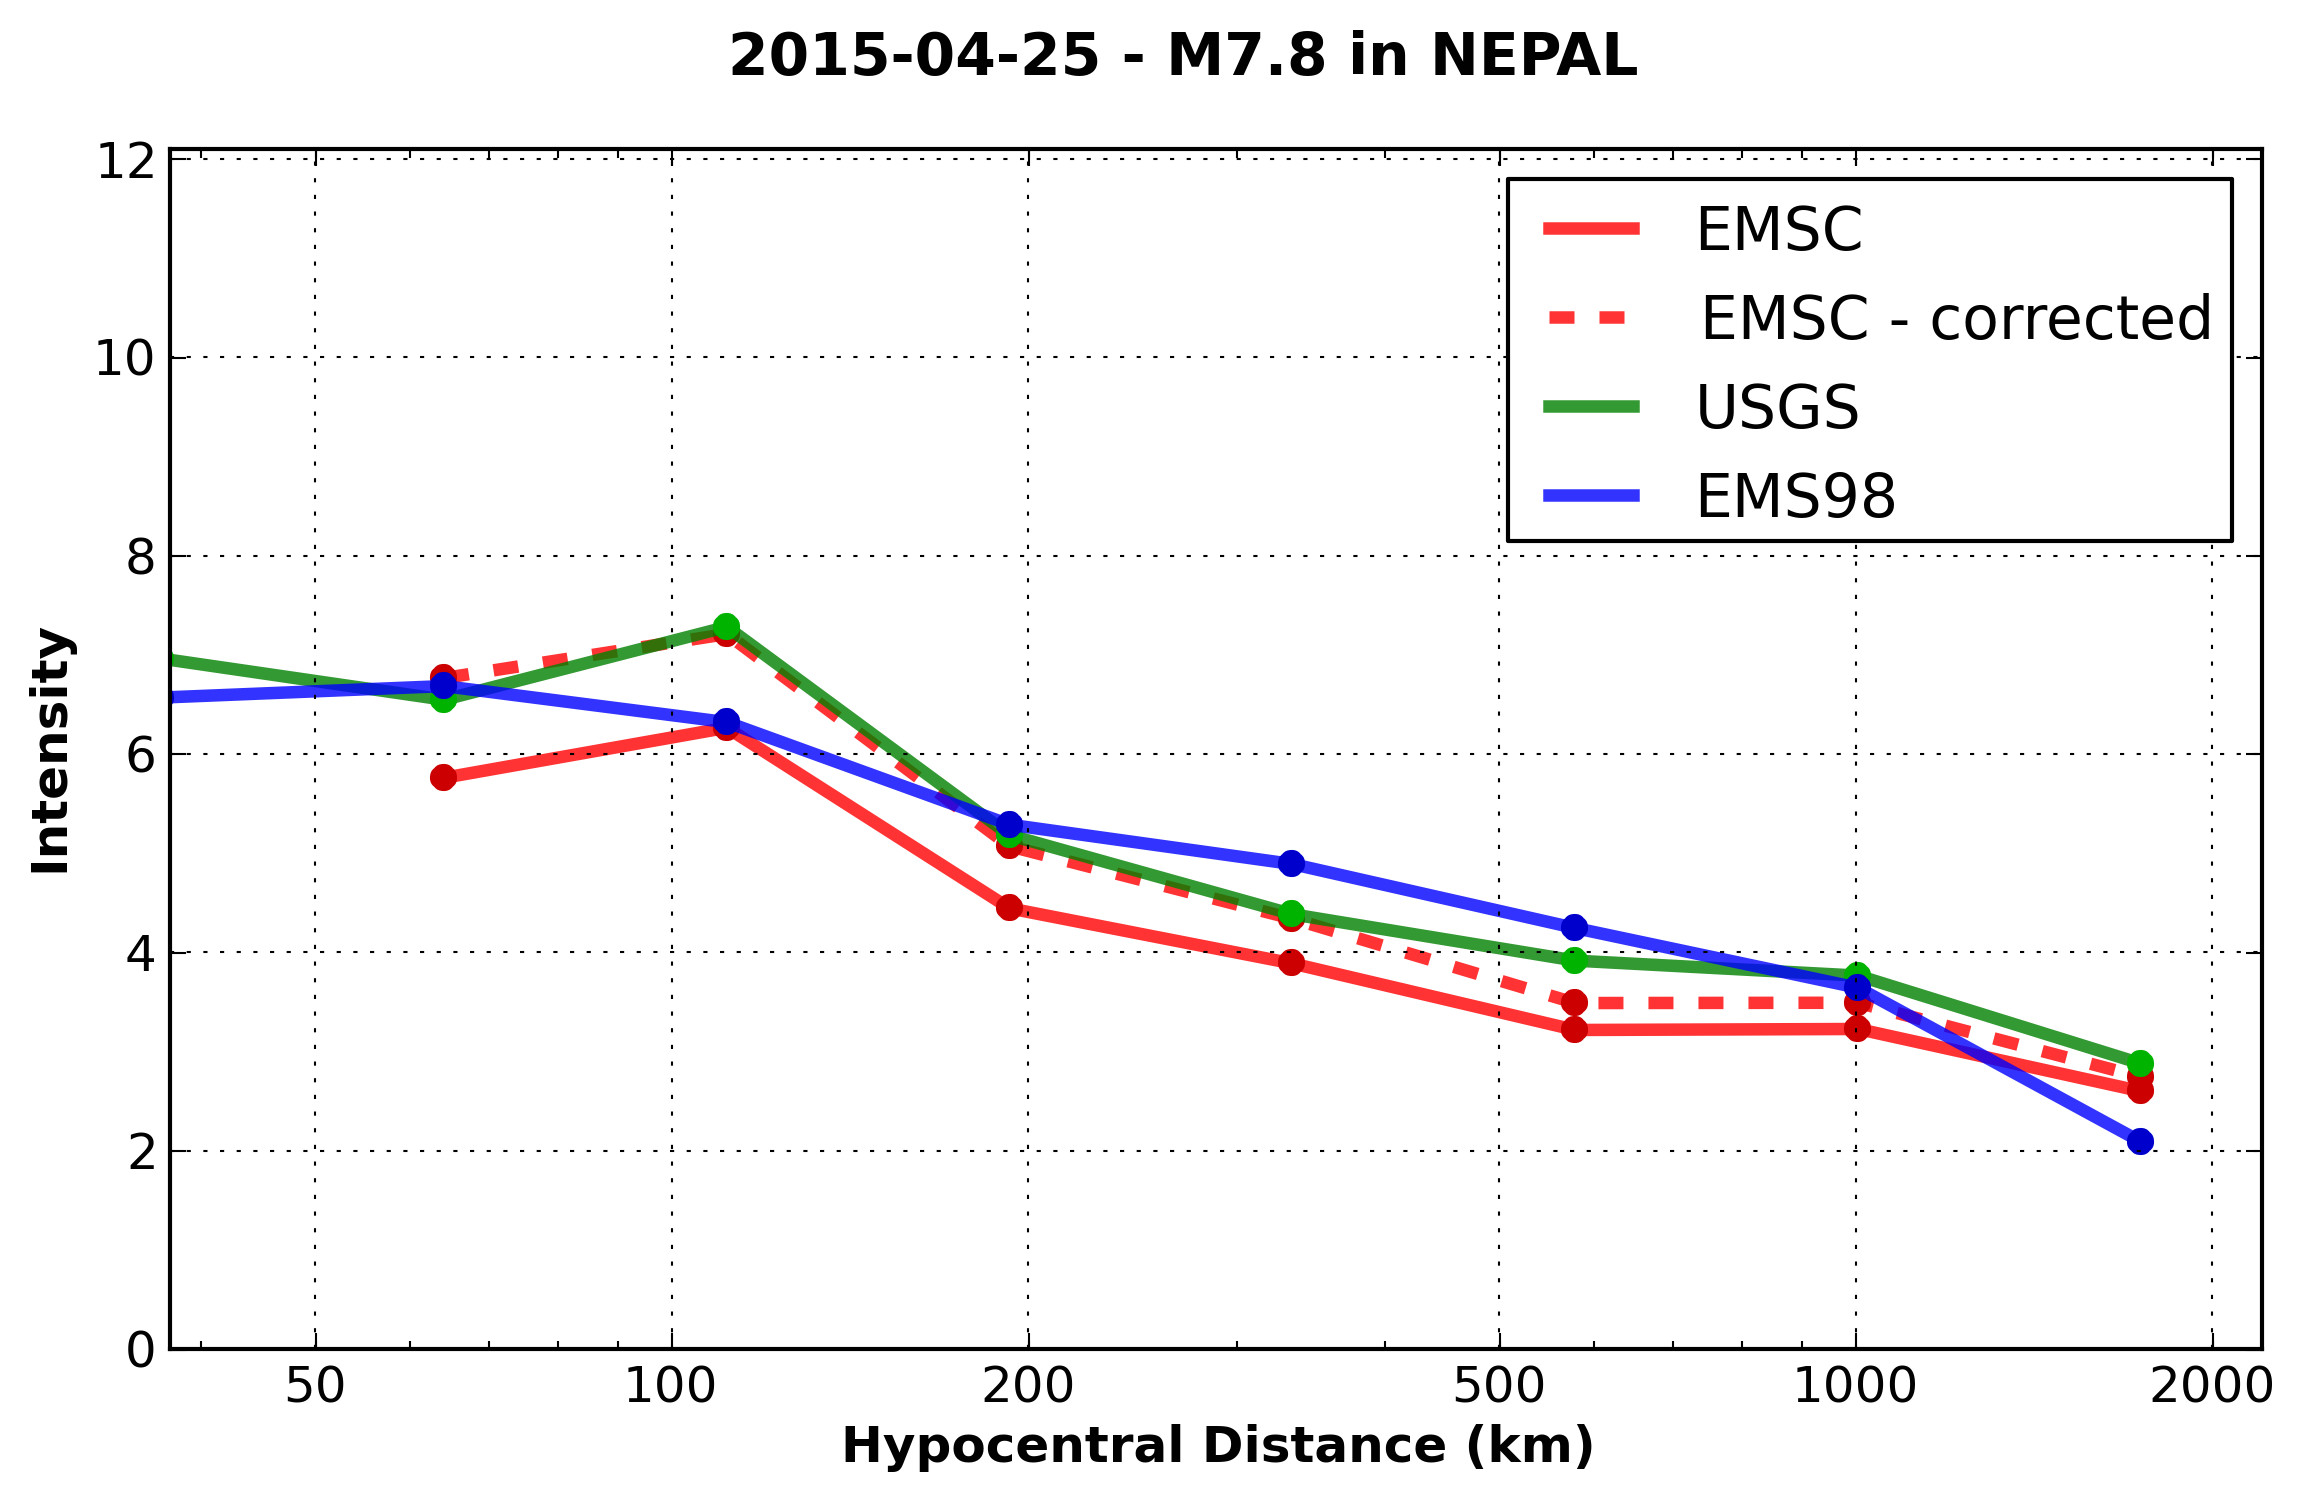
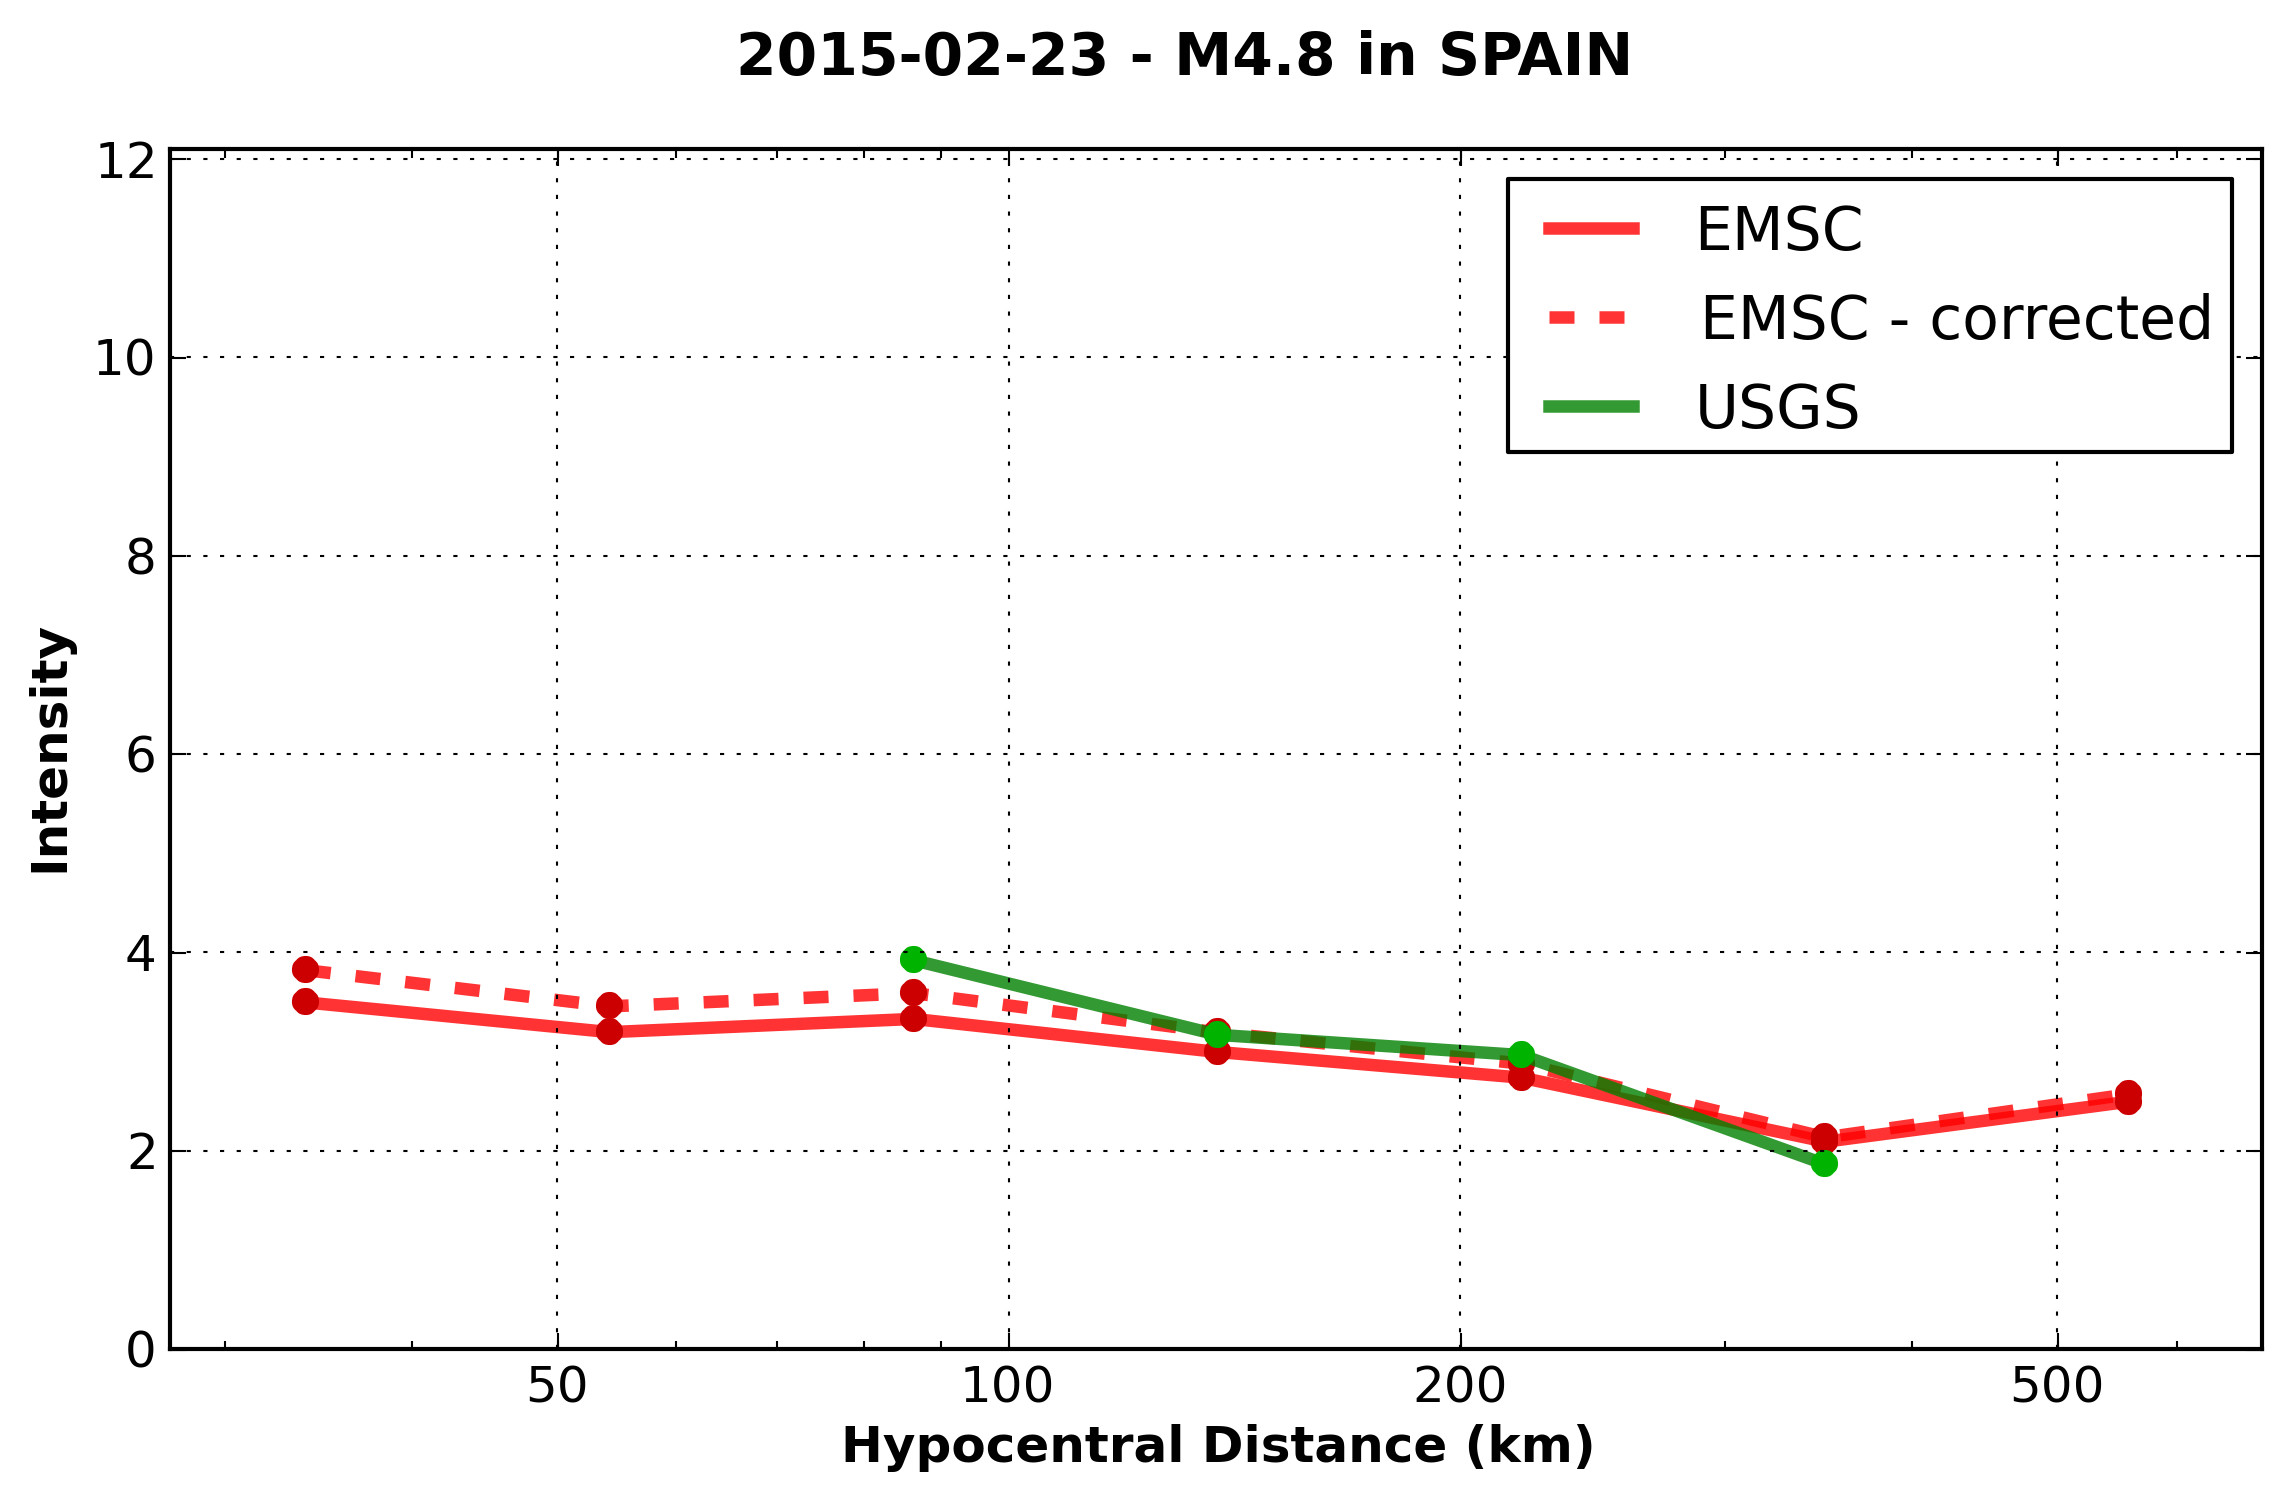
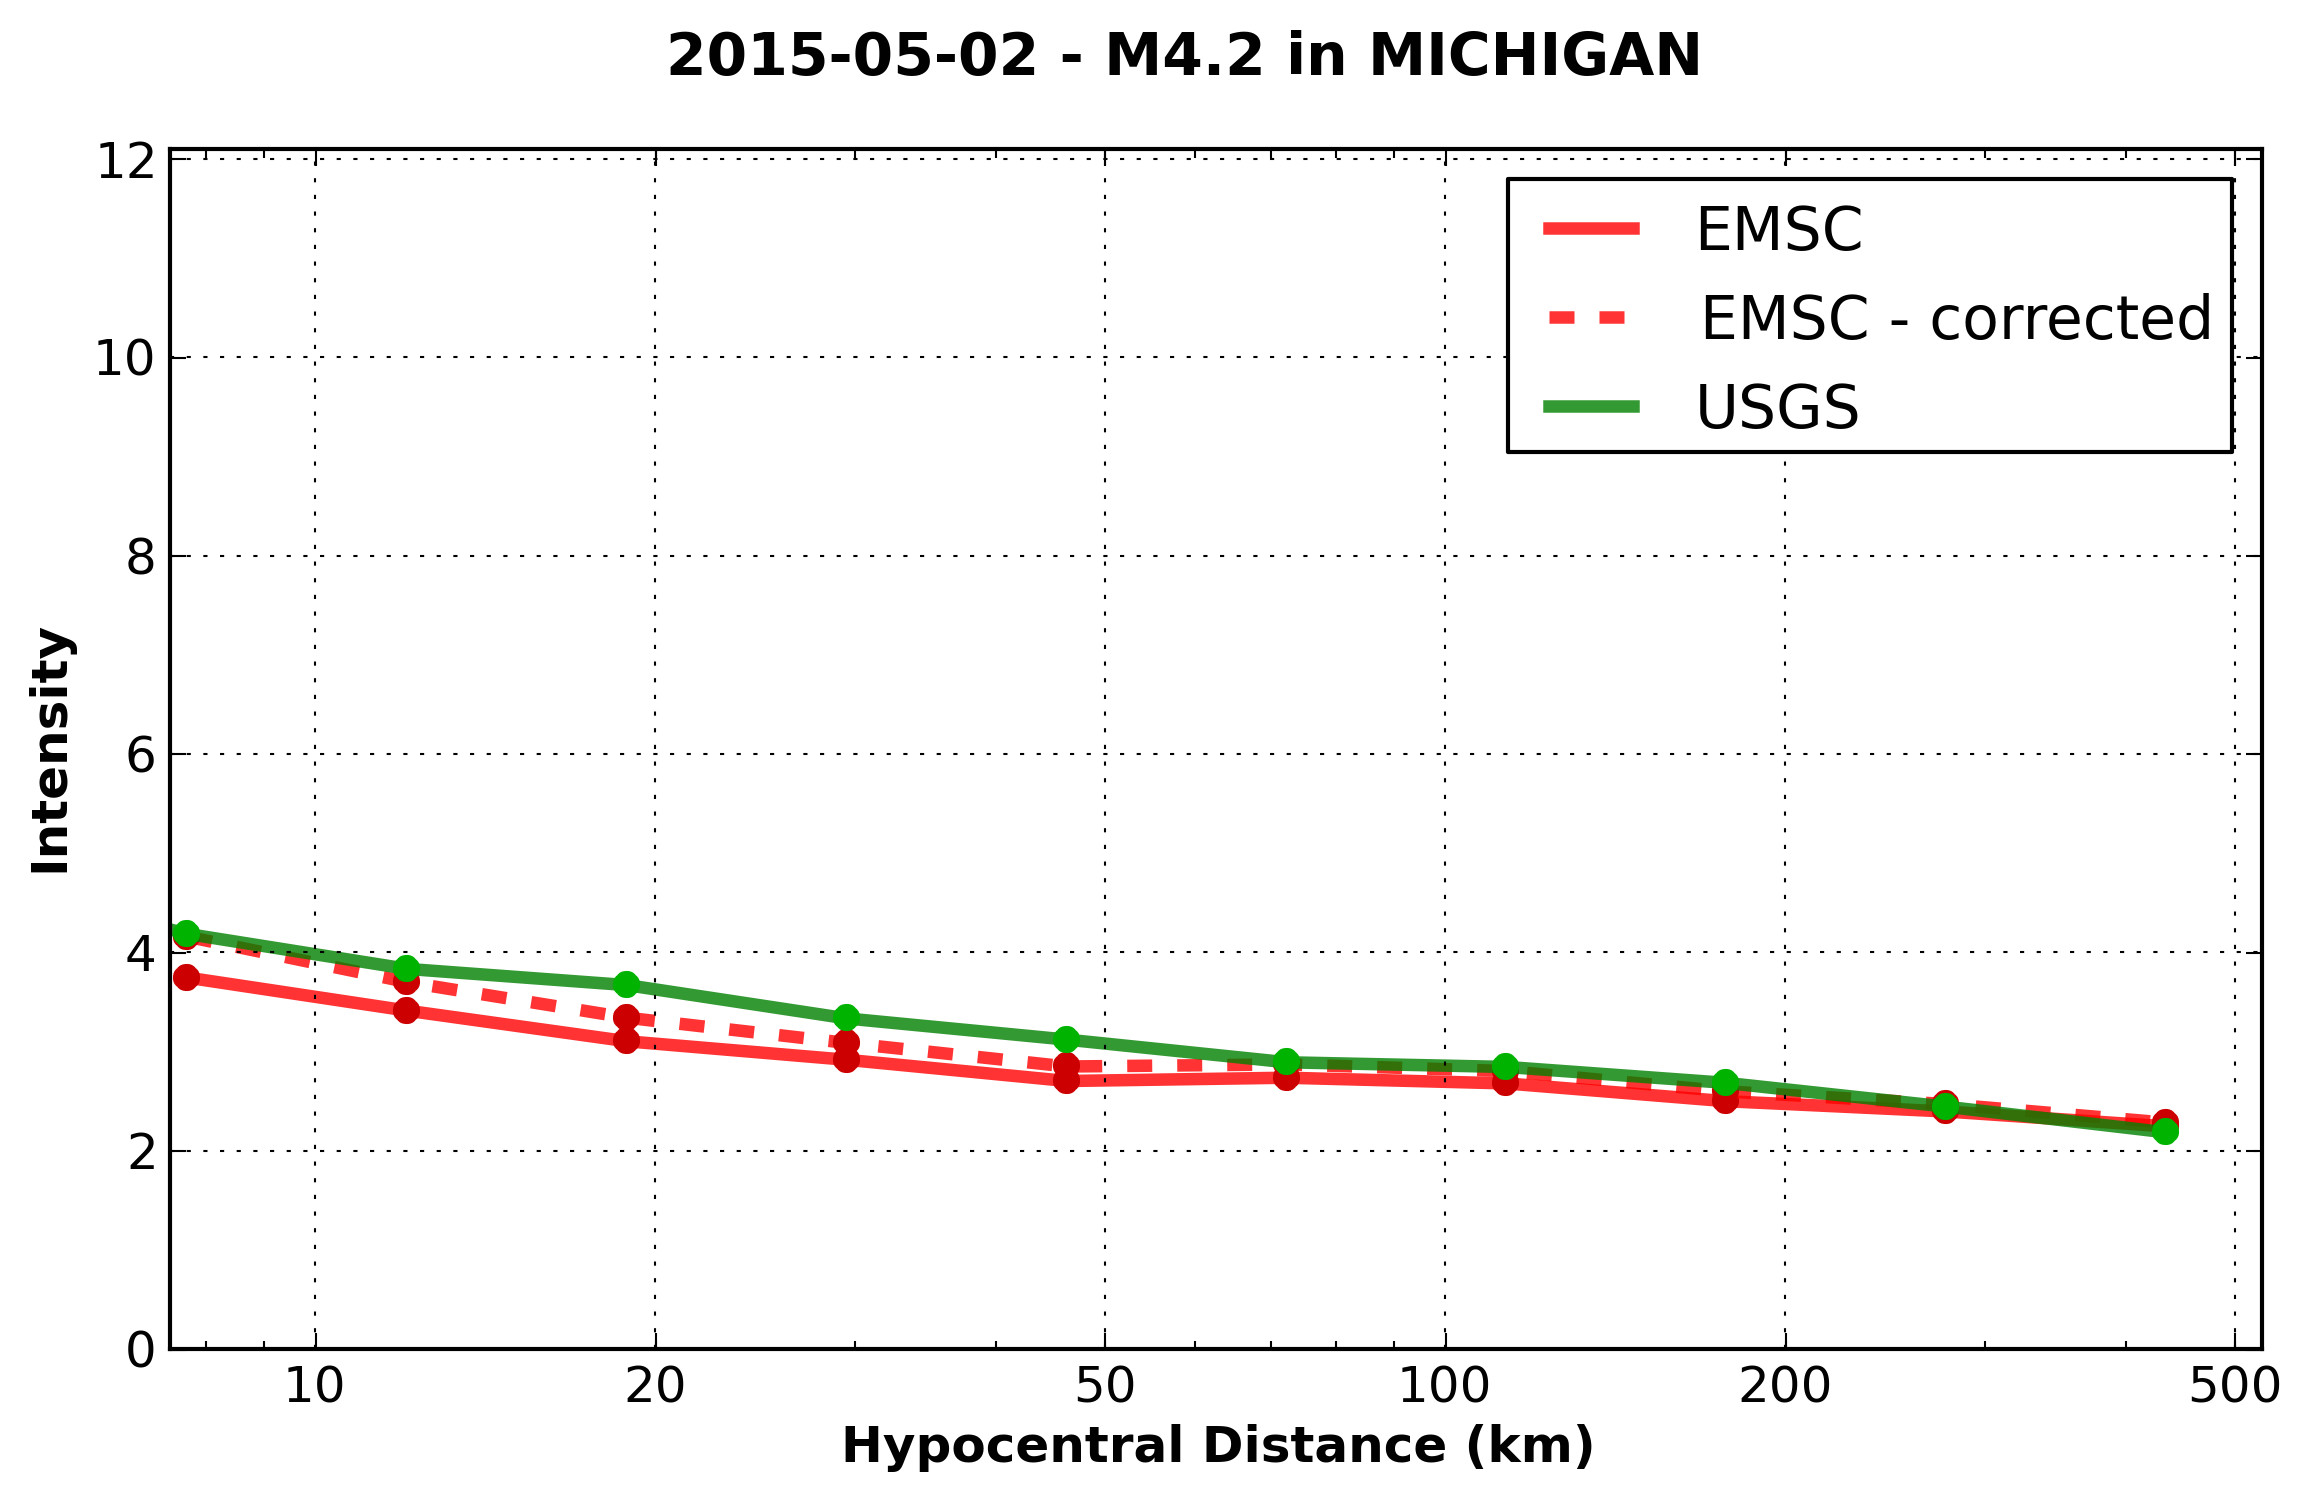
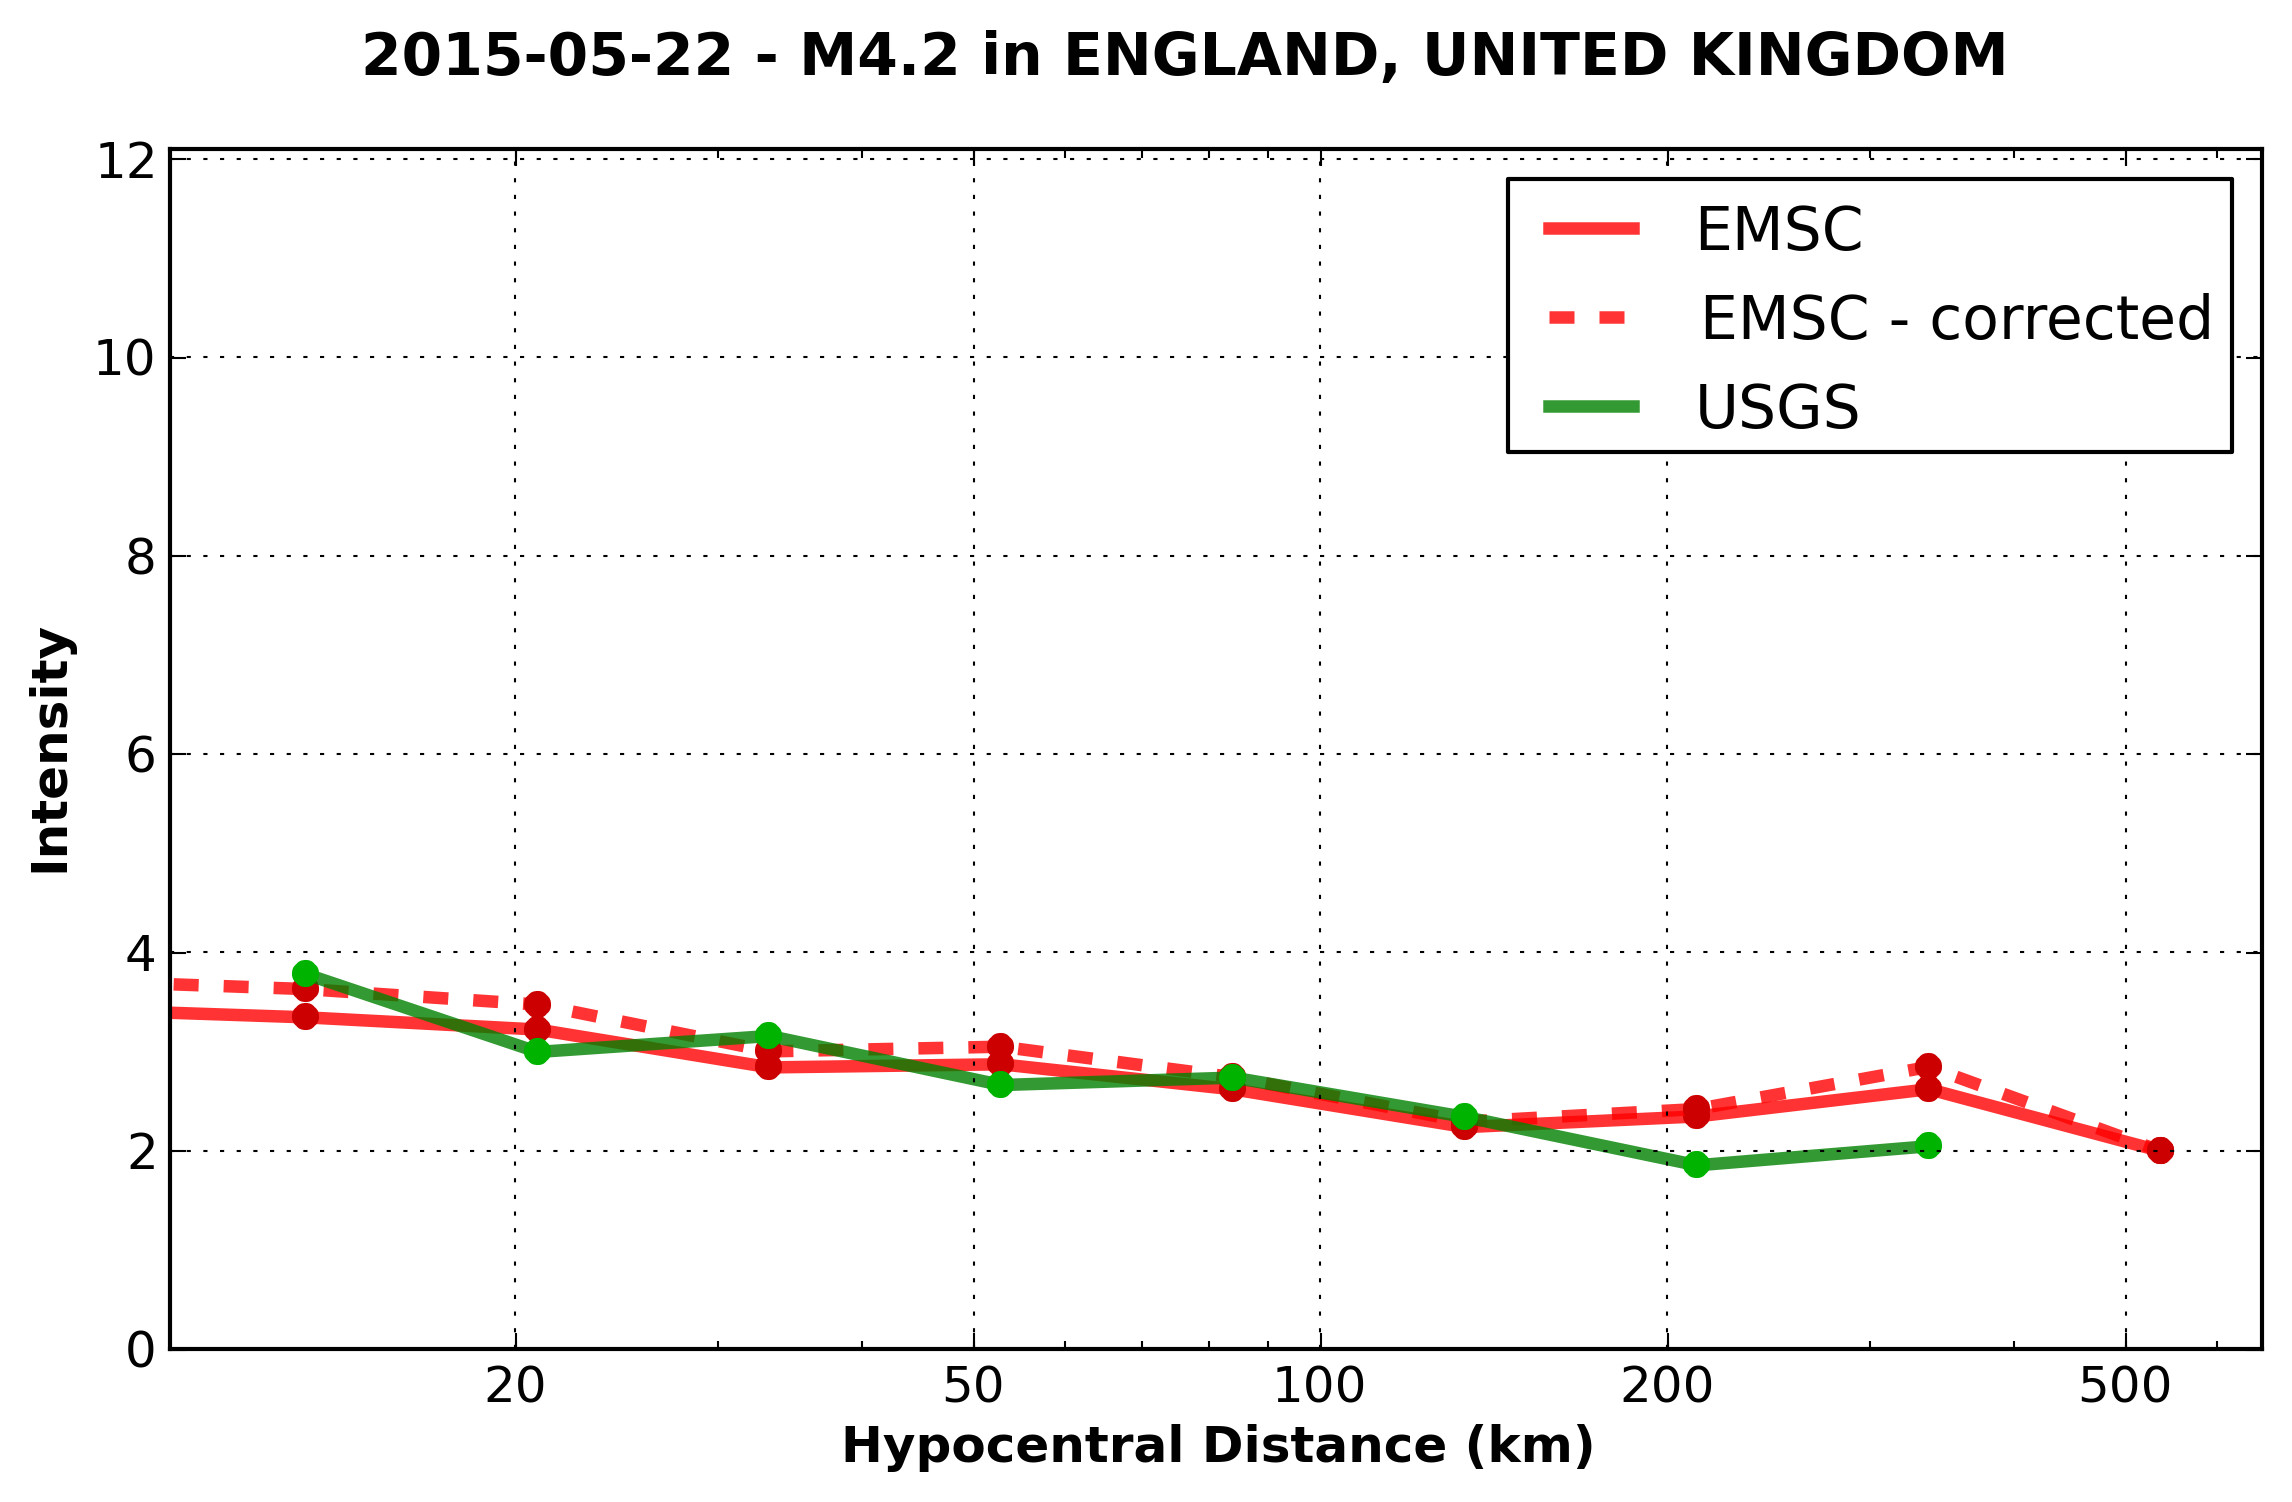
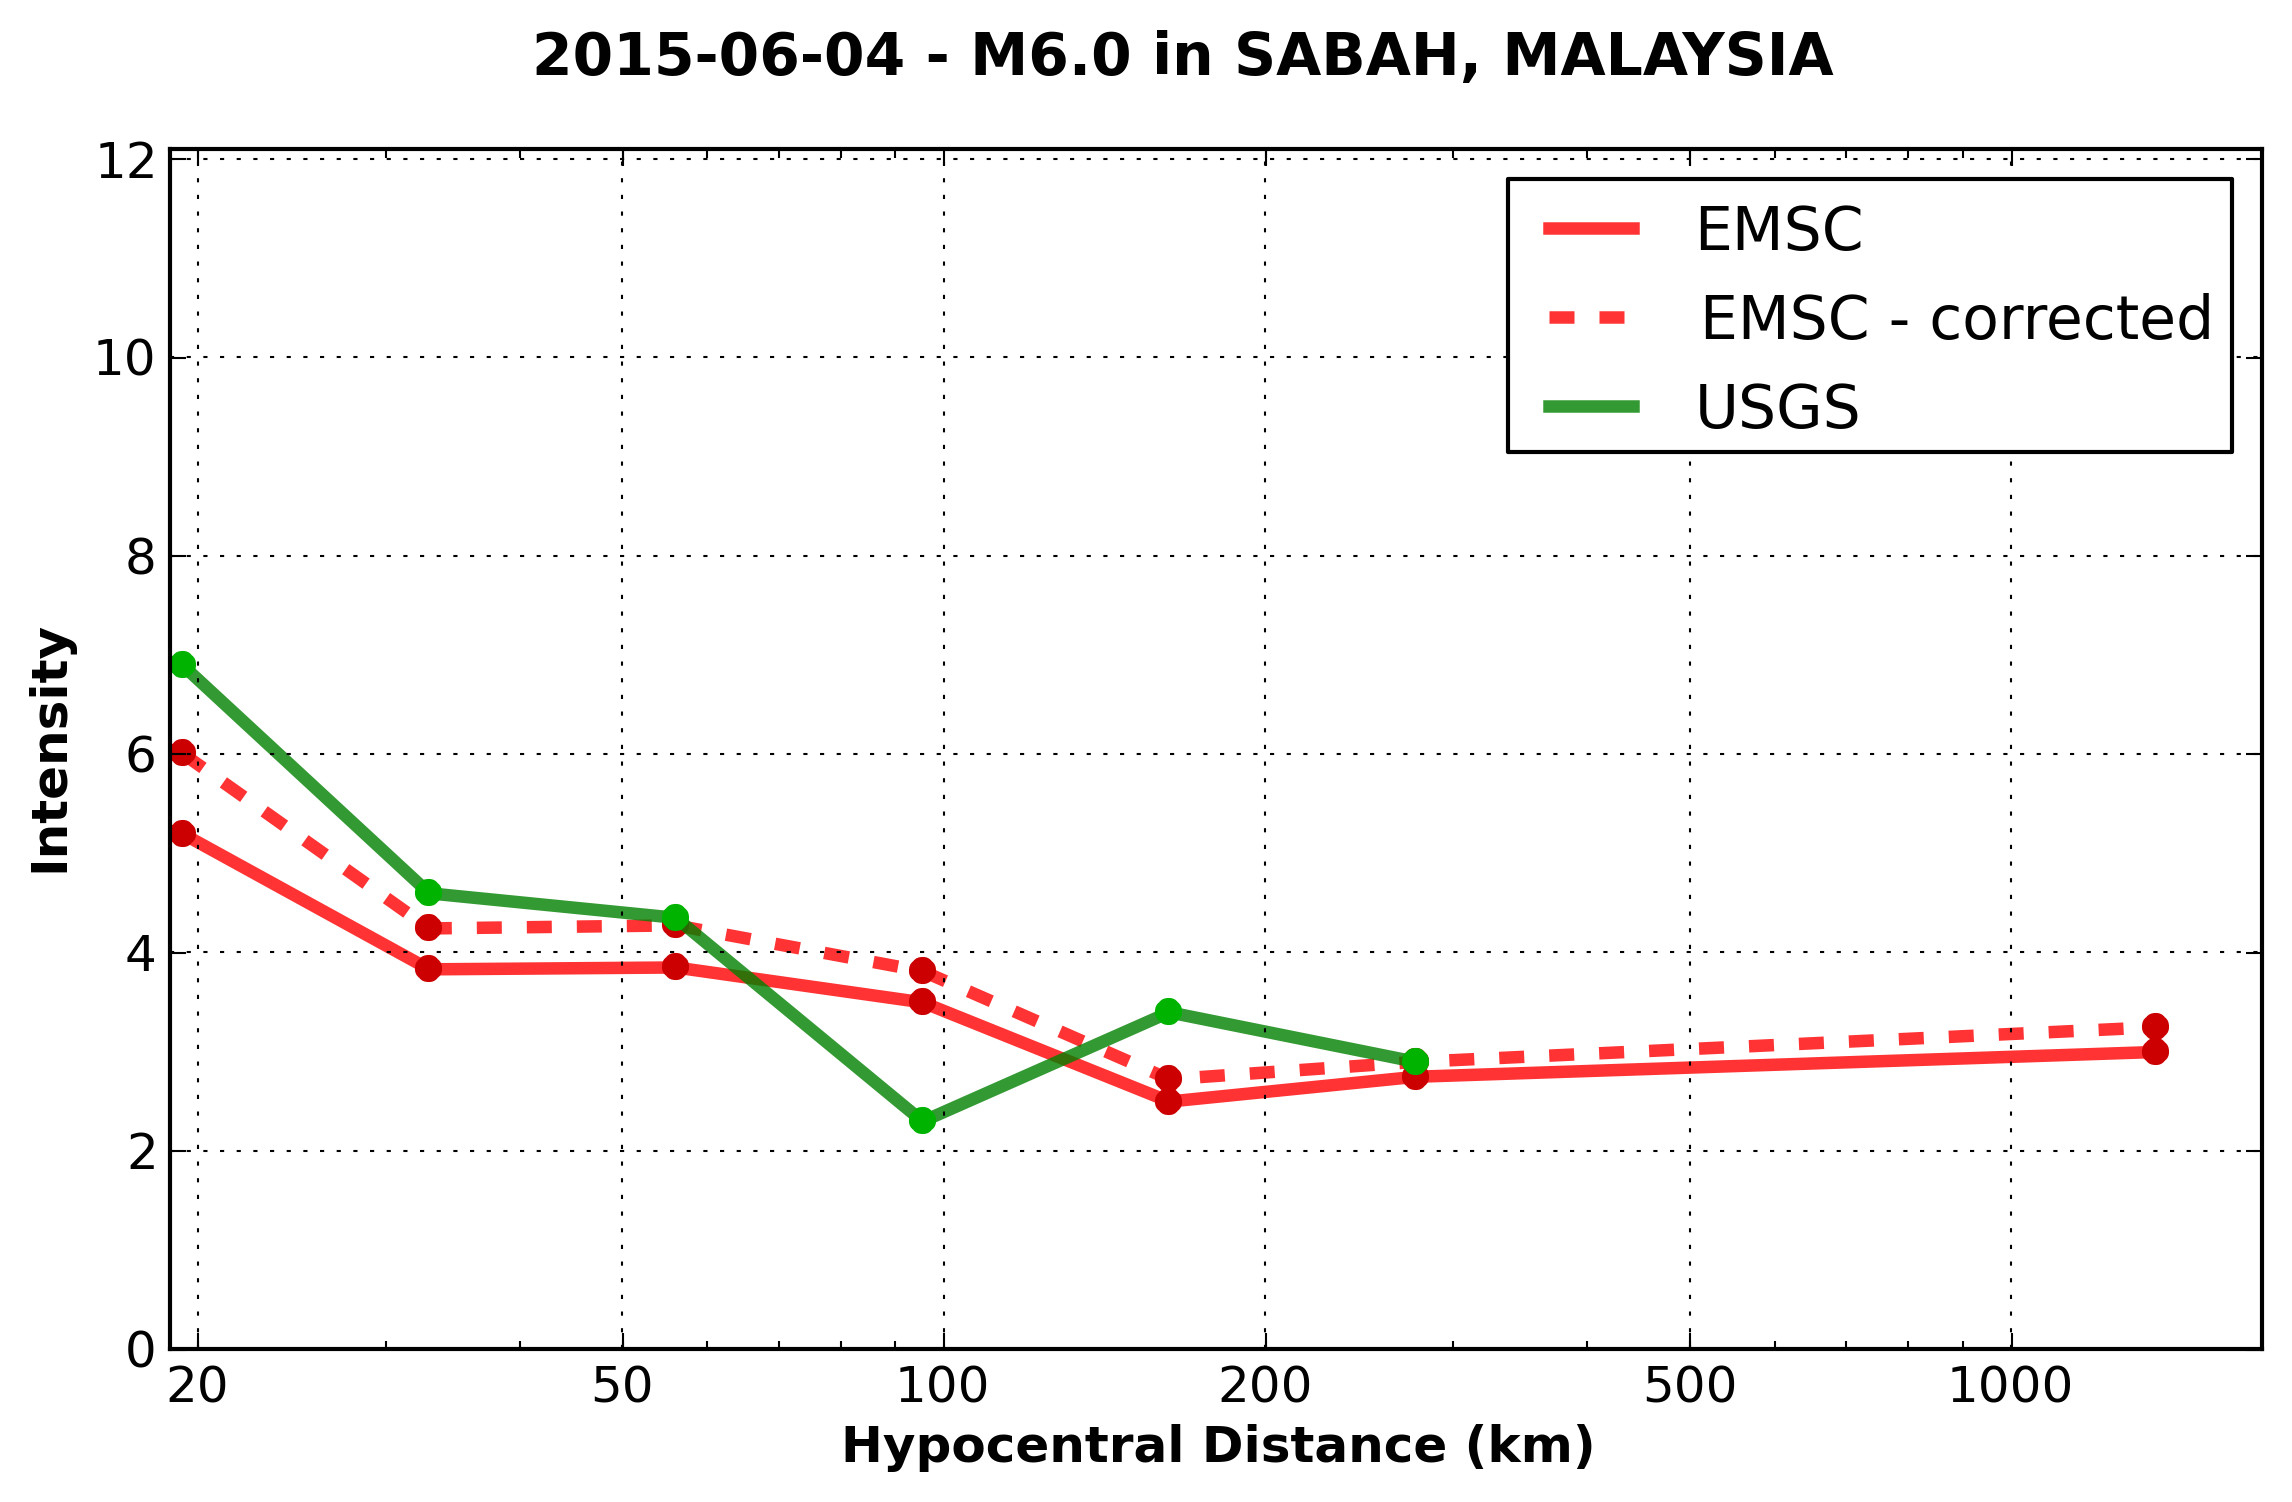
Figure S16. Comparison of EMSC corrected (following equation 1 of the main article) intensities (dashed red curve) with other intensity datasets for the 25 April 2015 M 7.8 Gorkha, Nepal, earthquake.
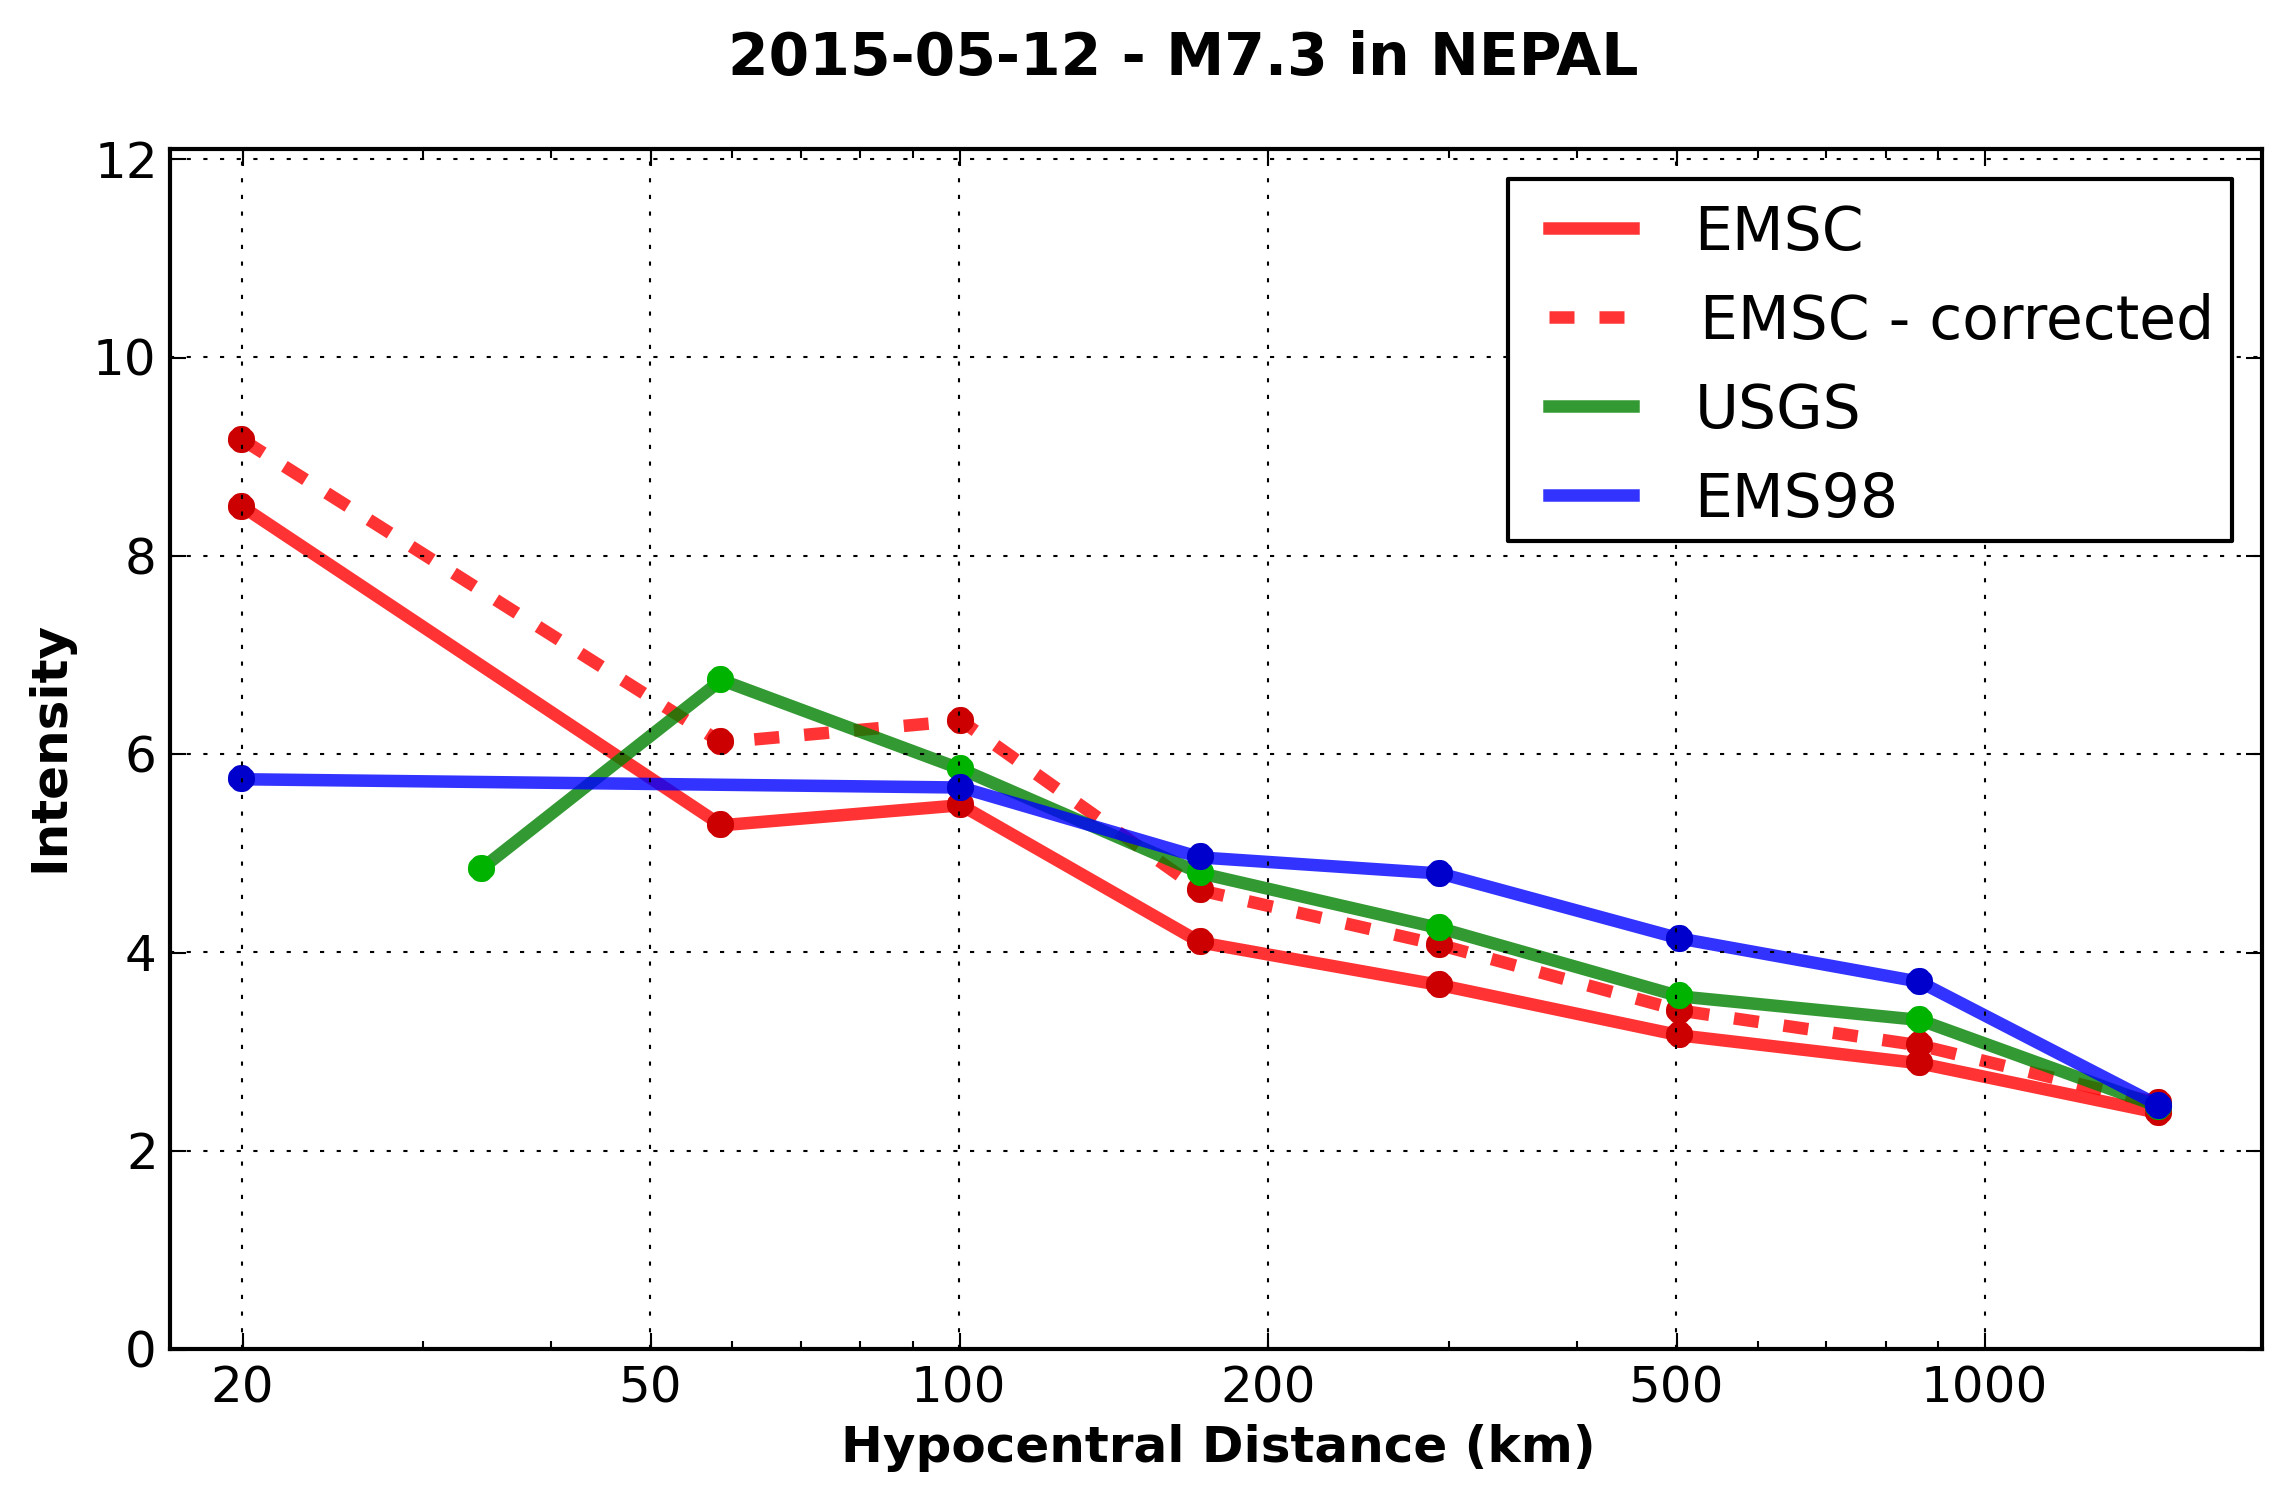
Figure S17. Same as Figure S16 for the 12 May 2015 M 7.3 Dolakha, Nepal, earthquake.
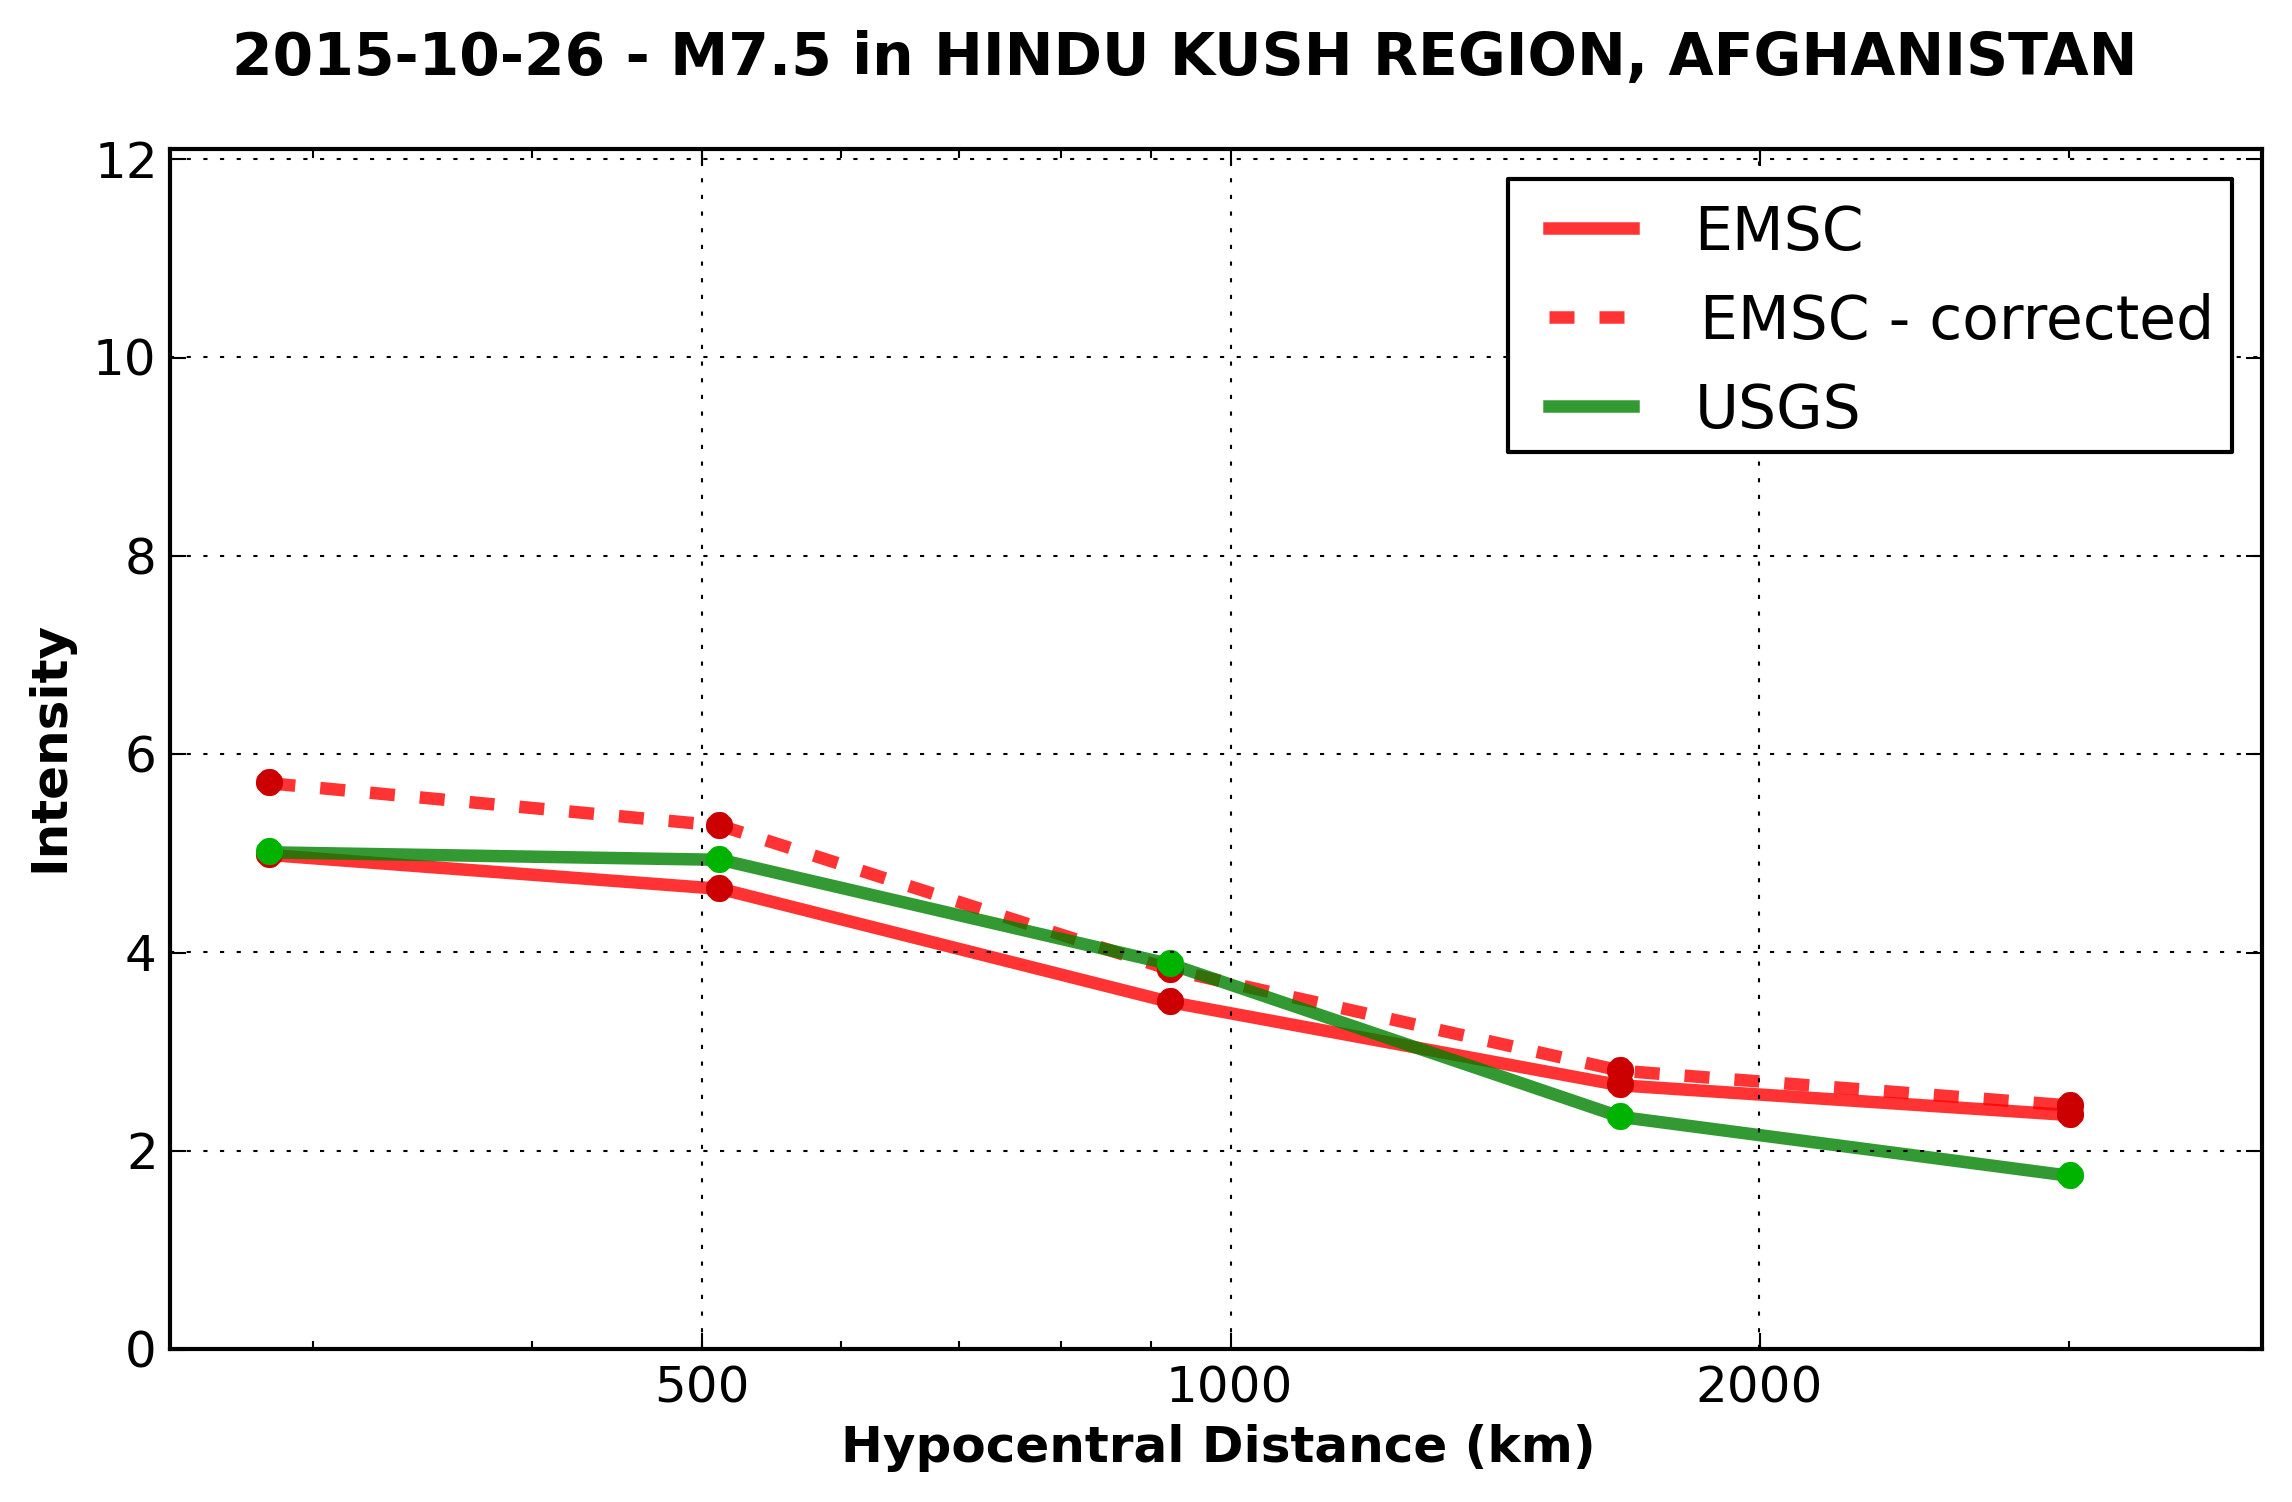
Figure S18. Same as Figure S16 for the 26 October 2015 M 7.5 Hindu Kush, Afghanistan, earthquake.
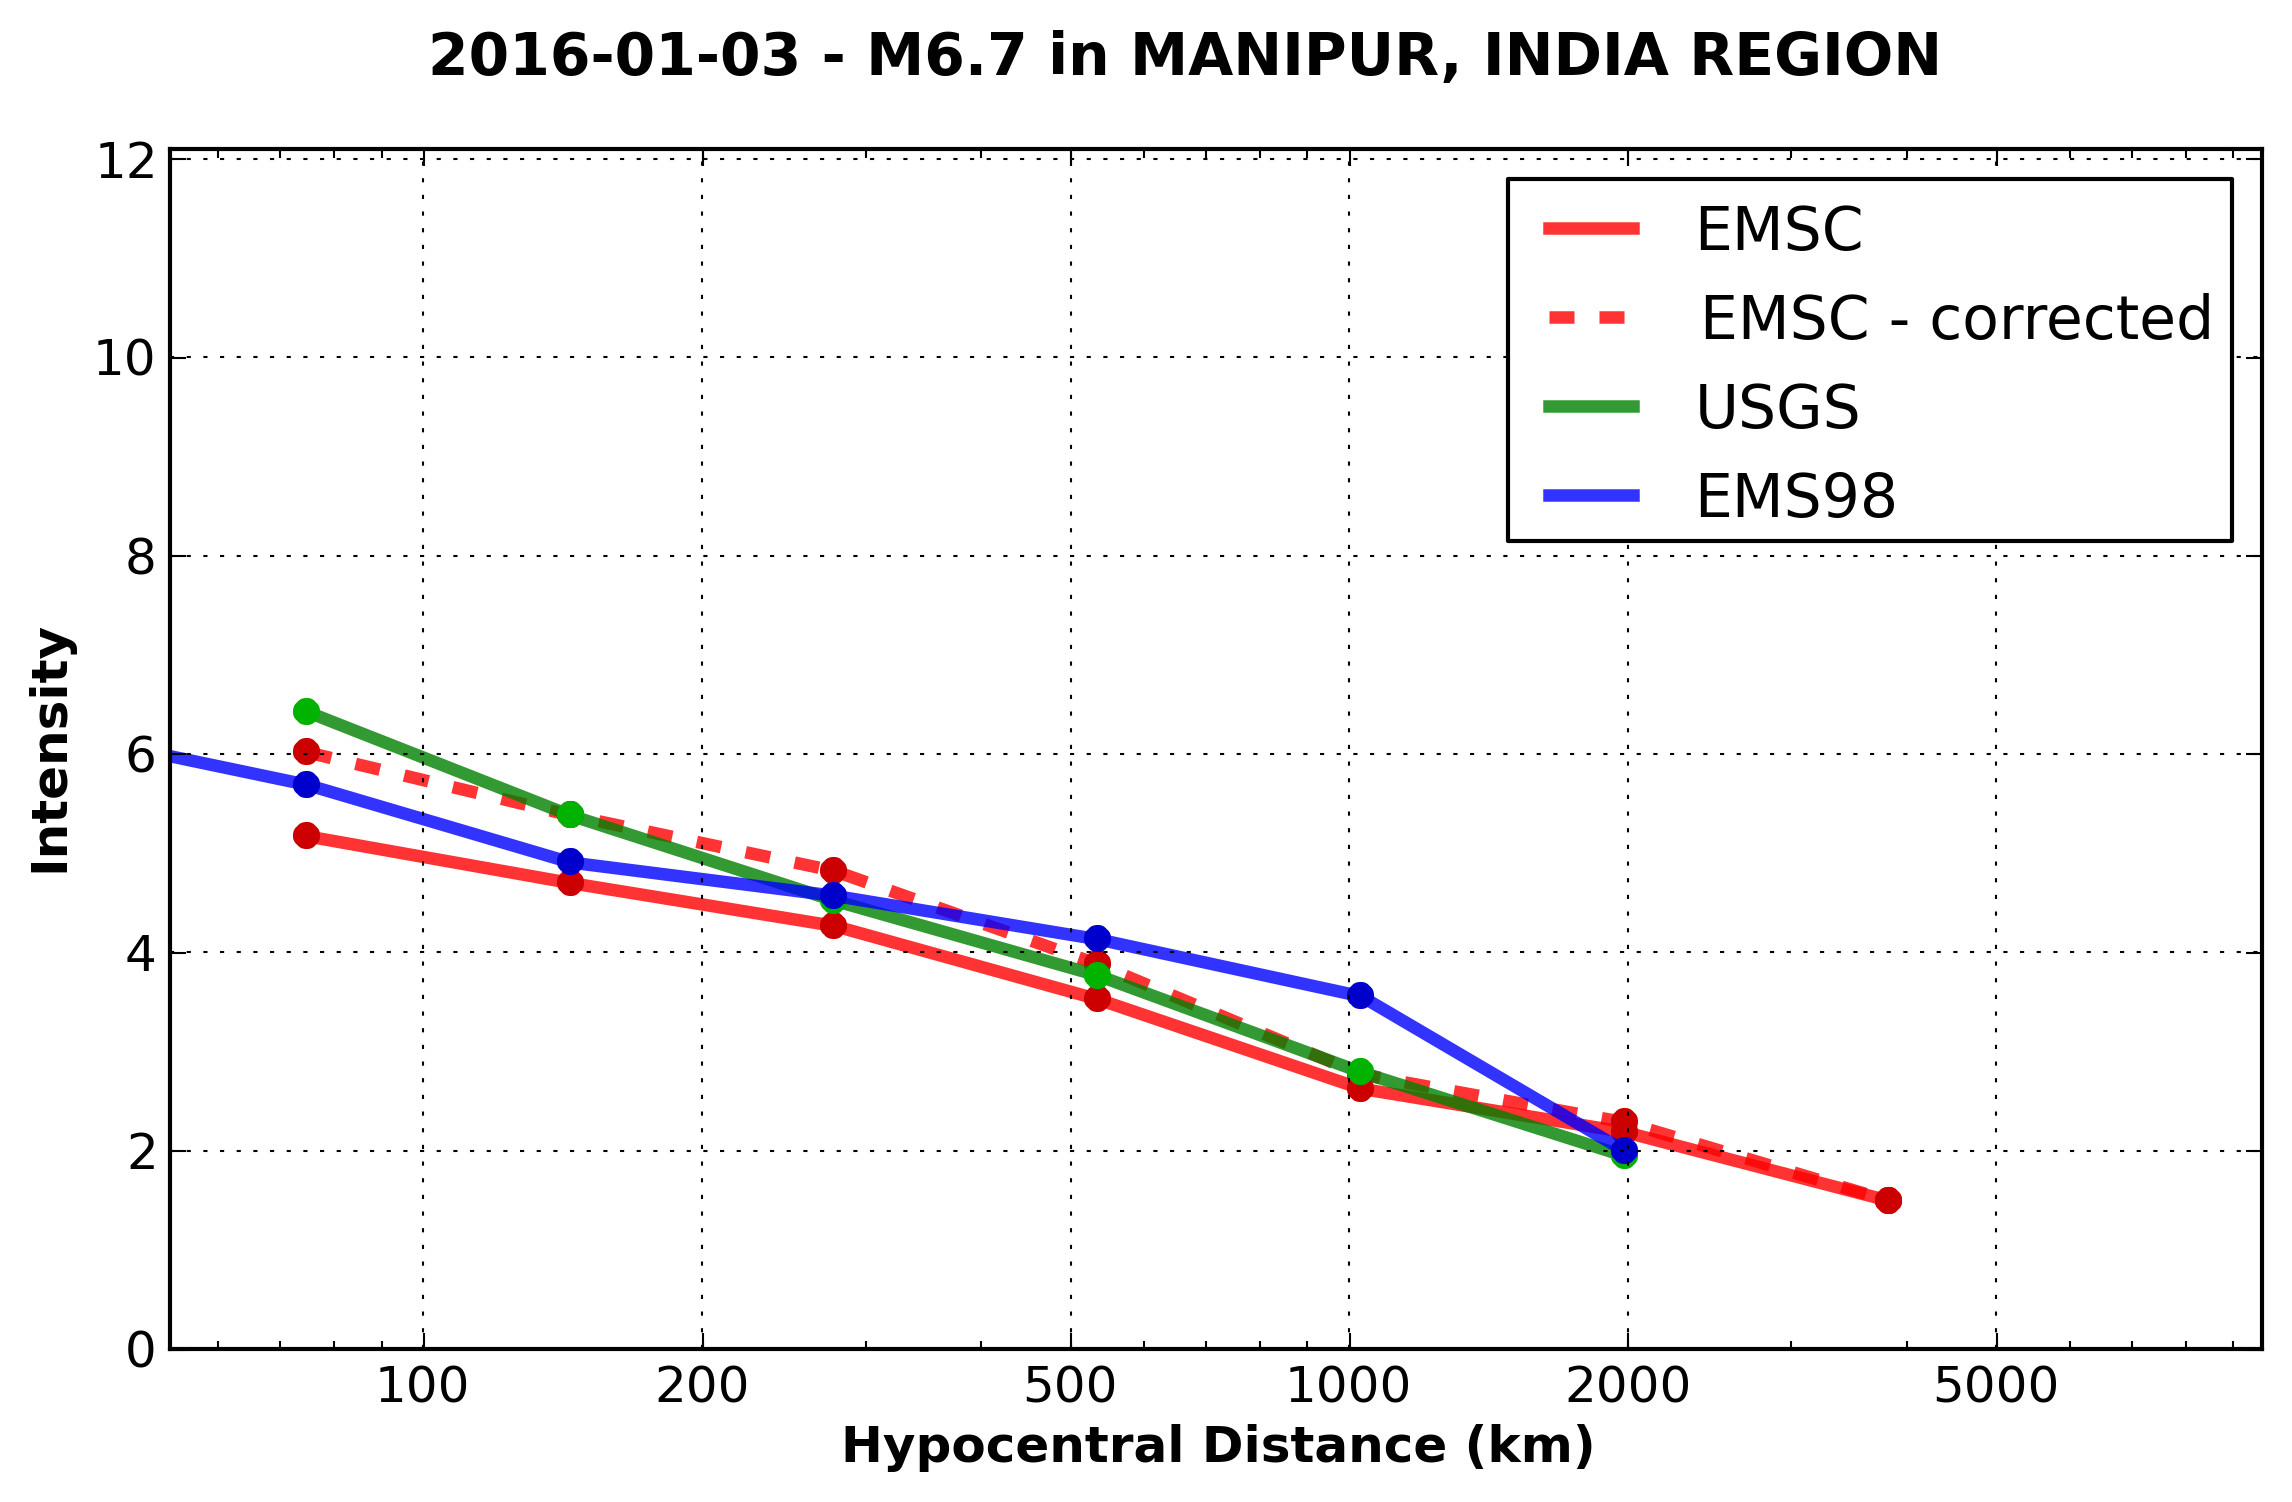
Figure S19. Same as Figure S16 for the 3 January 2016 M 6.7 Manipur, India, earthquake.
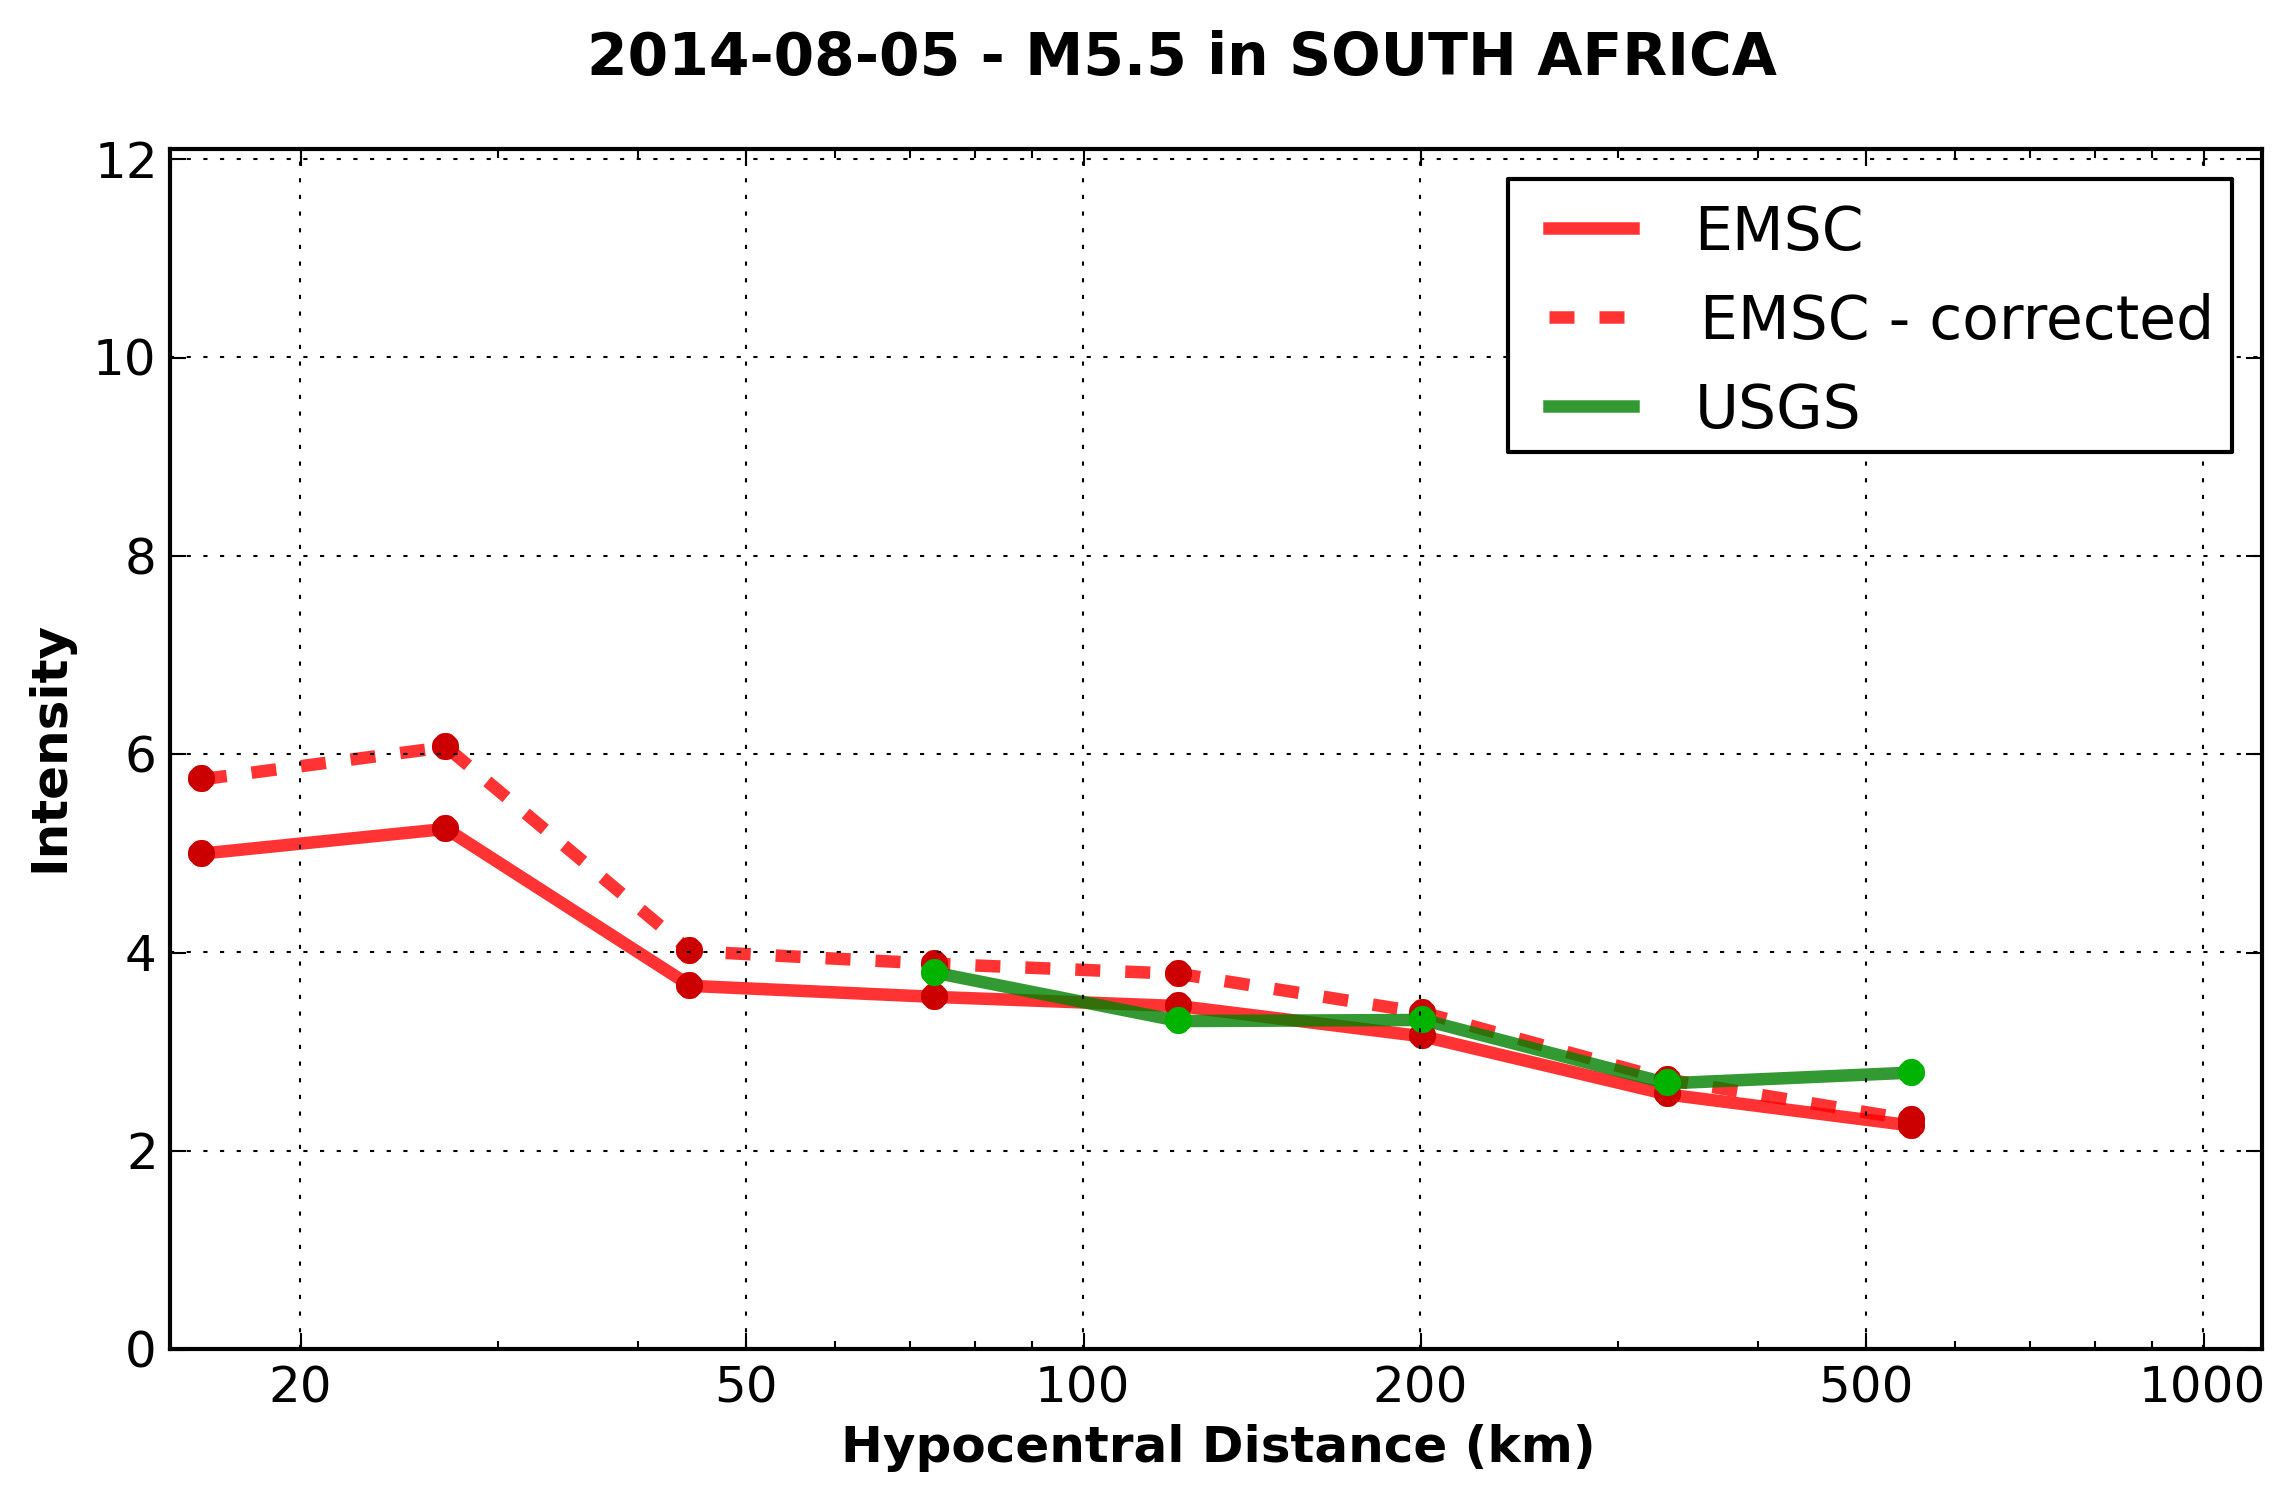
Figure S20. Same as Figure S16 for the 5 August 2014 M 5.5 South Africa earthquake.
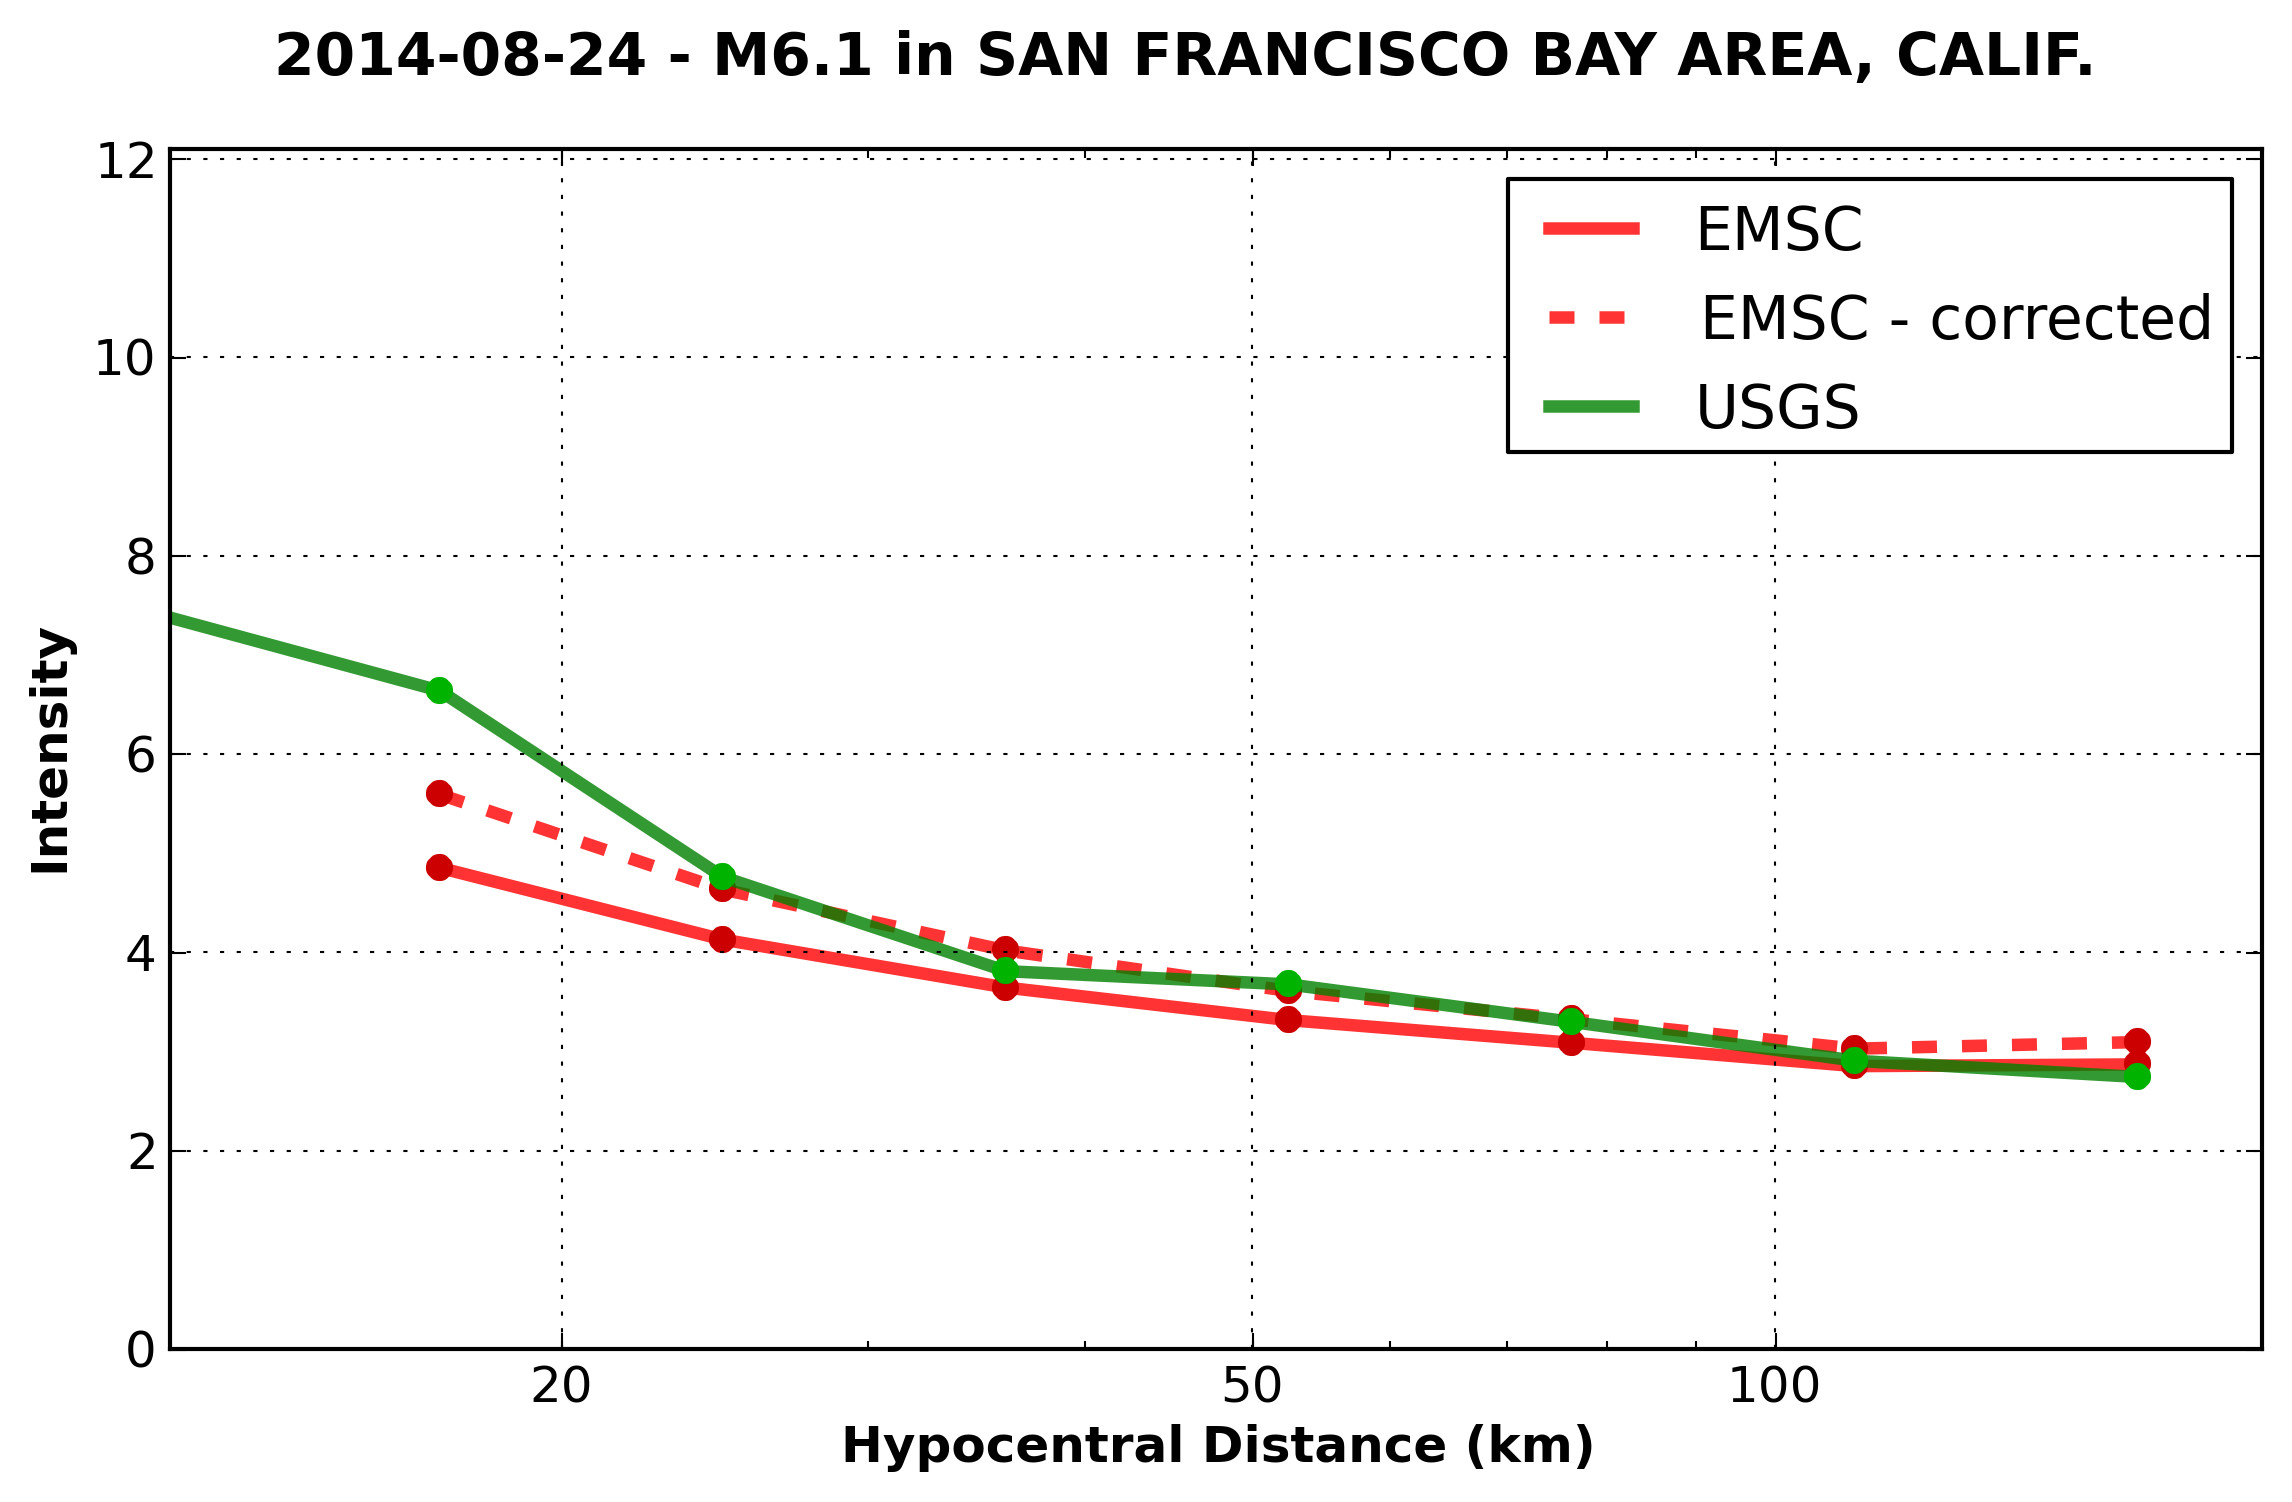
Figure S21. Same as Figure S16 for the 24 August 2014 M 6.1 Napa, California, earthquake.
Figure S22. Same as Figure S16 for the 23 February 2015 M 4.8 Spain earthquake.
Figure S23. Same as Figure S16 for the 2 May 2015 M 4.2 Michigan earthquake.
Figure S24. Same as Figure S16 for the 22 May 2015 M 4.2 England, United Kingdom, earthquake.
Figure S25. Same as Figure S16 for the 4 June 2015 M 6.0 Malaysia earthquake.
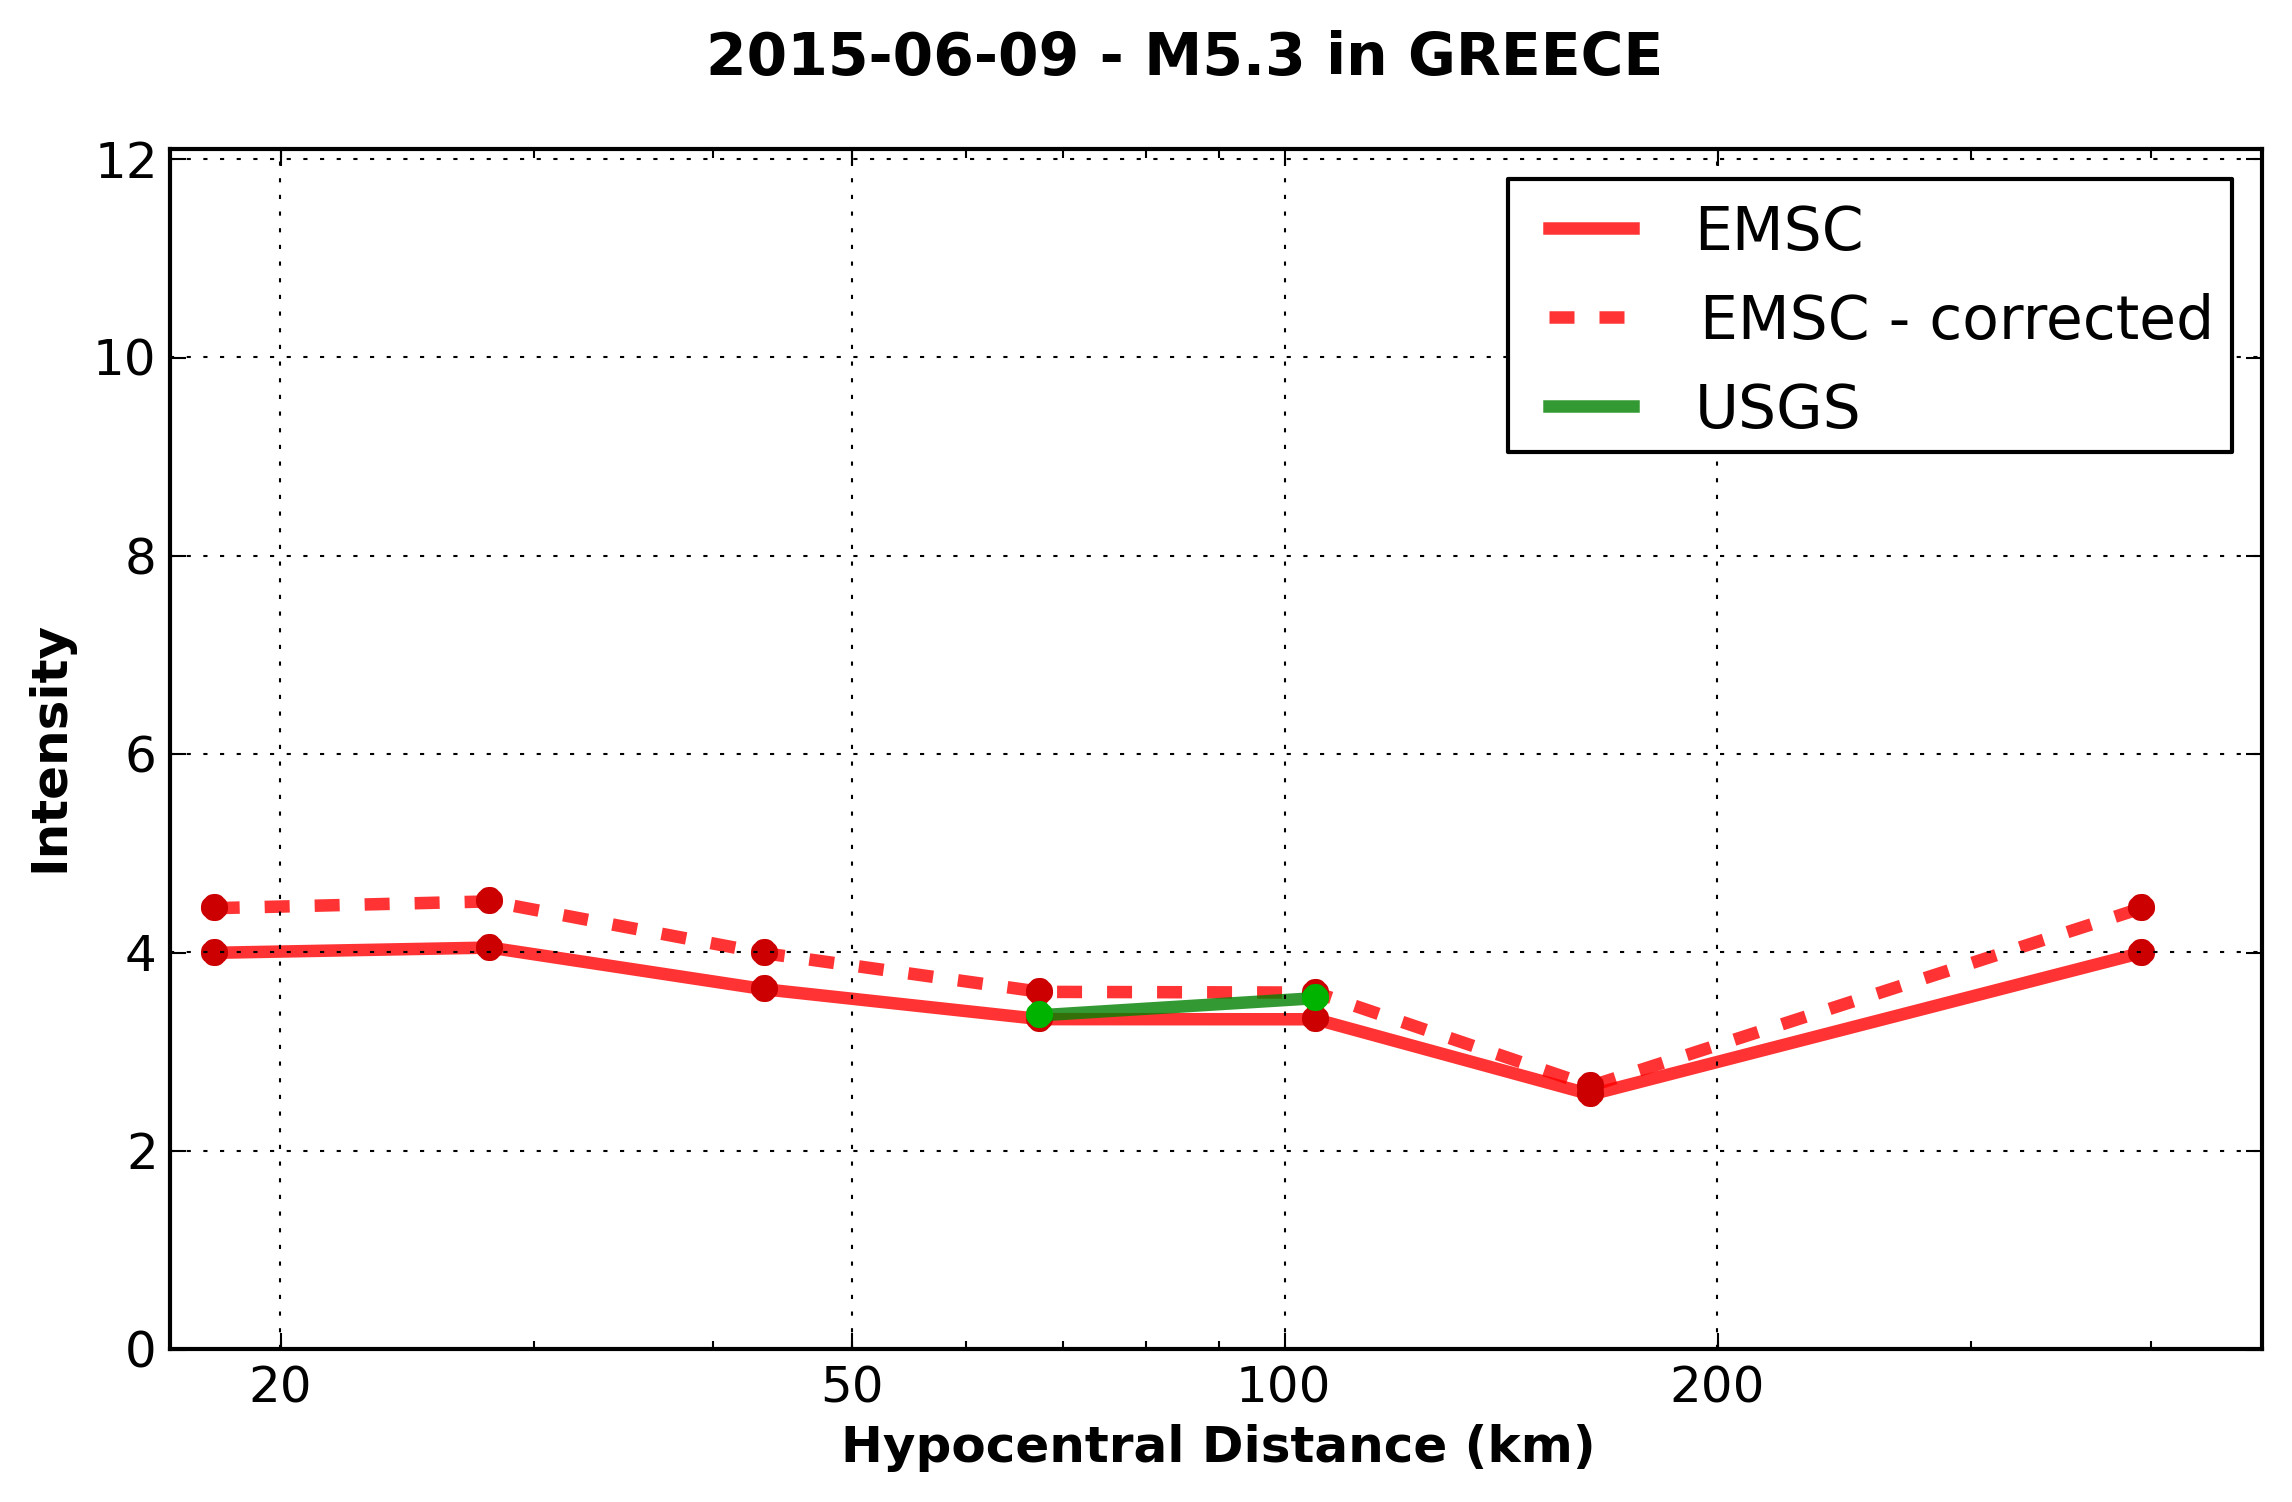
Figure S26. Same as Figure S16 for the 9 June 2015 M 5.3 Greece earthquake.
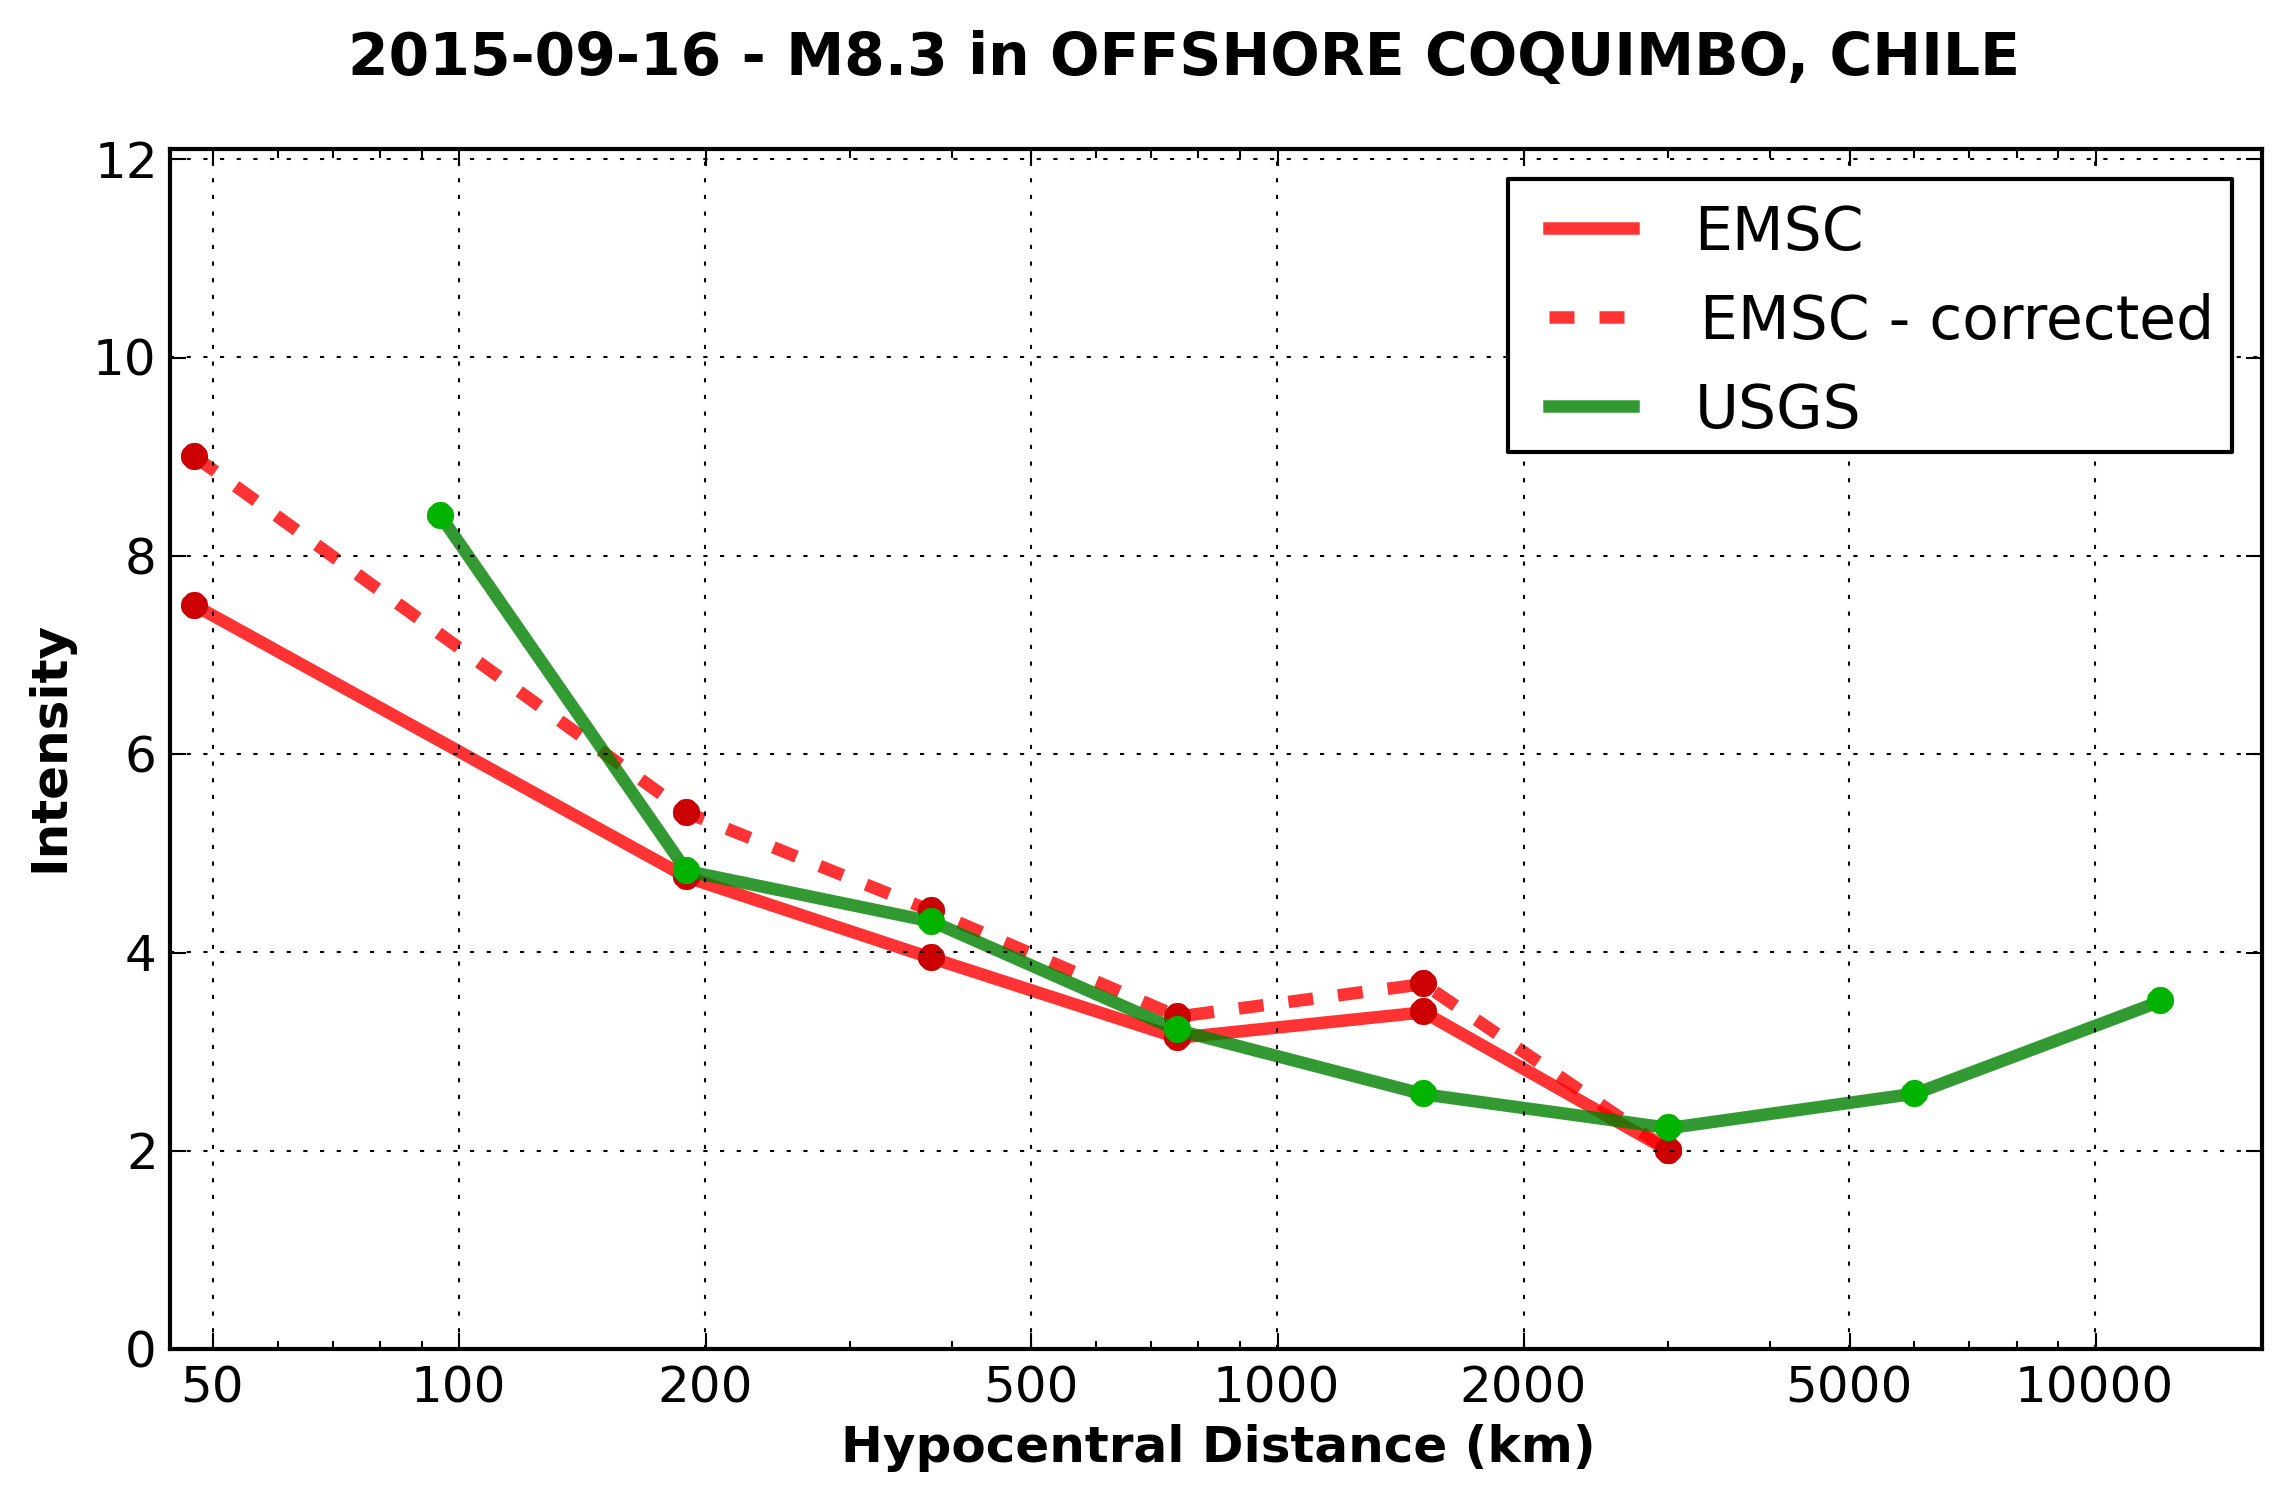
Figure S27. Same as Figure S16 for the 16 September 2015 M 8.3 Chile earthquake.
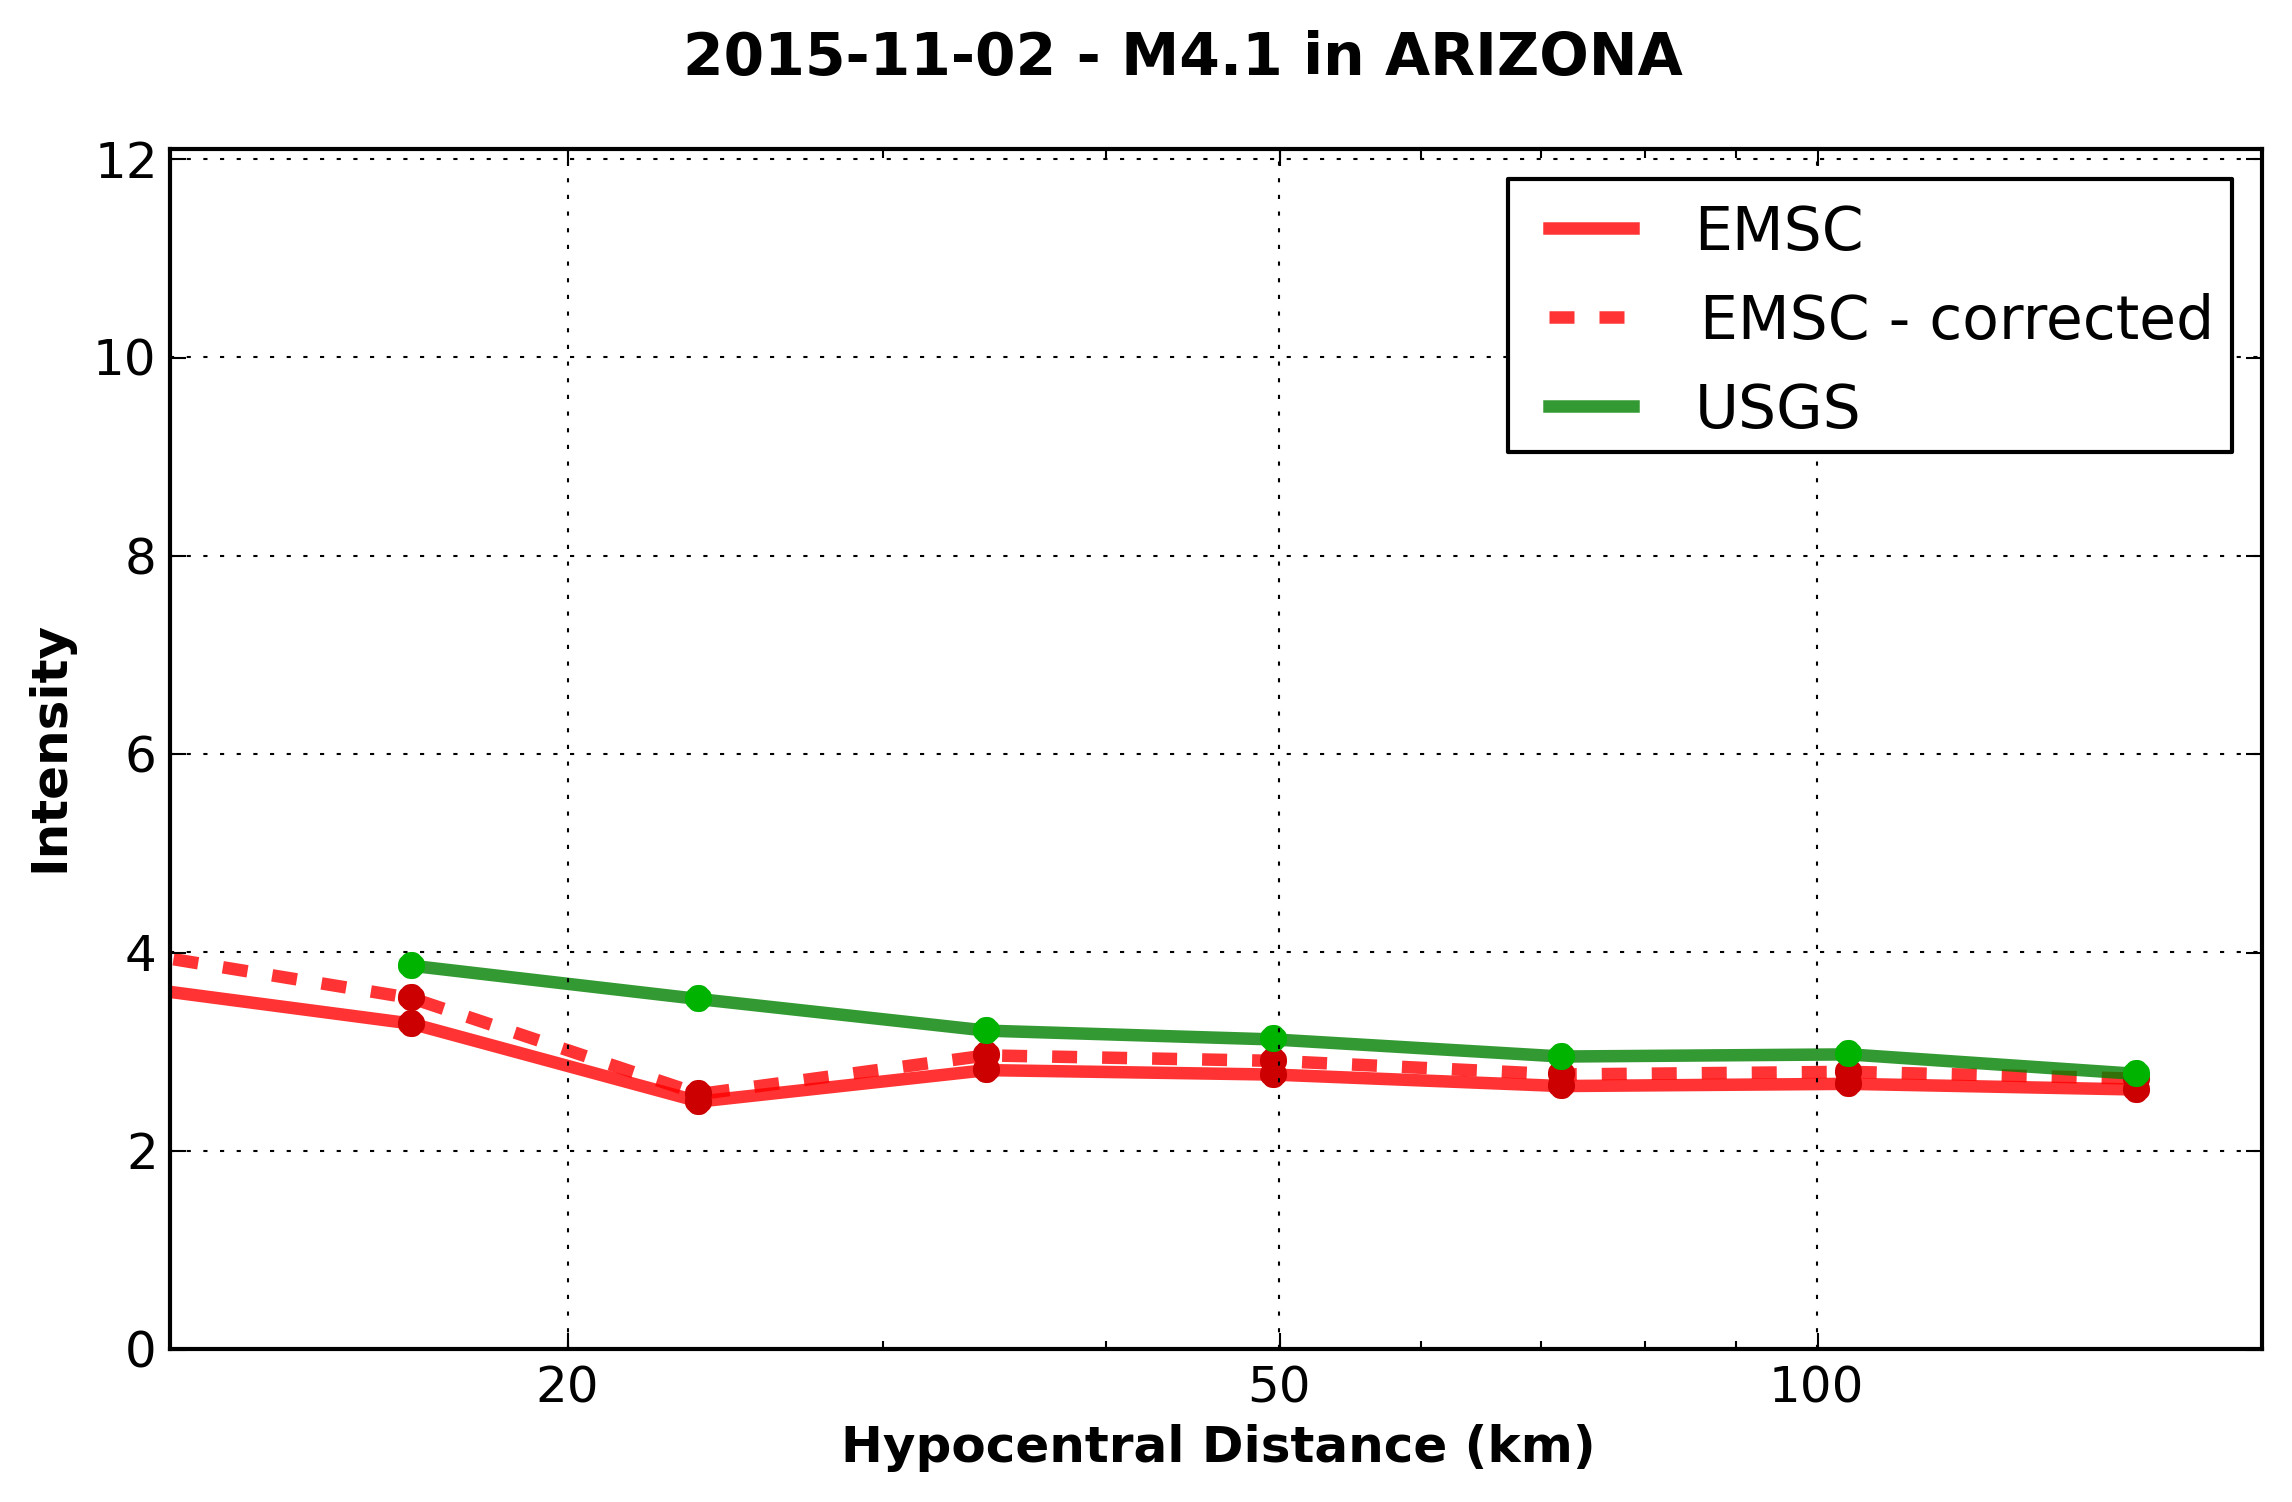
Figure S28. Same as Figure S16 for the 2 November 2015 M 4.1 Arizona, U.S.A., earthquake.
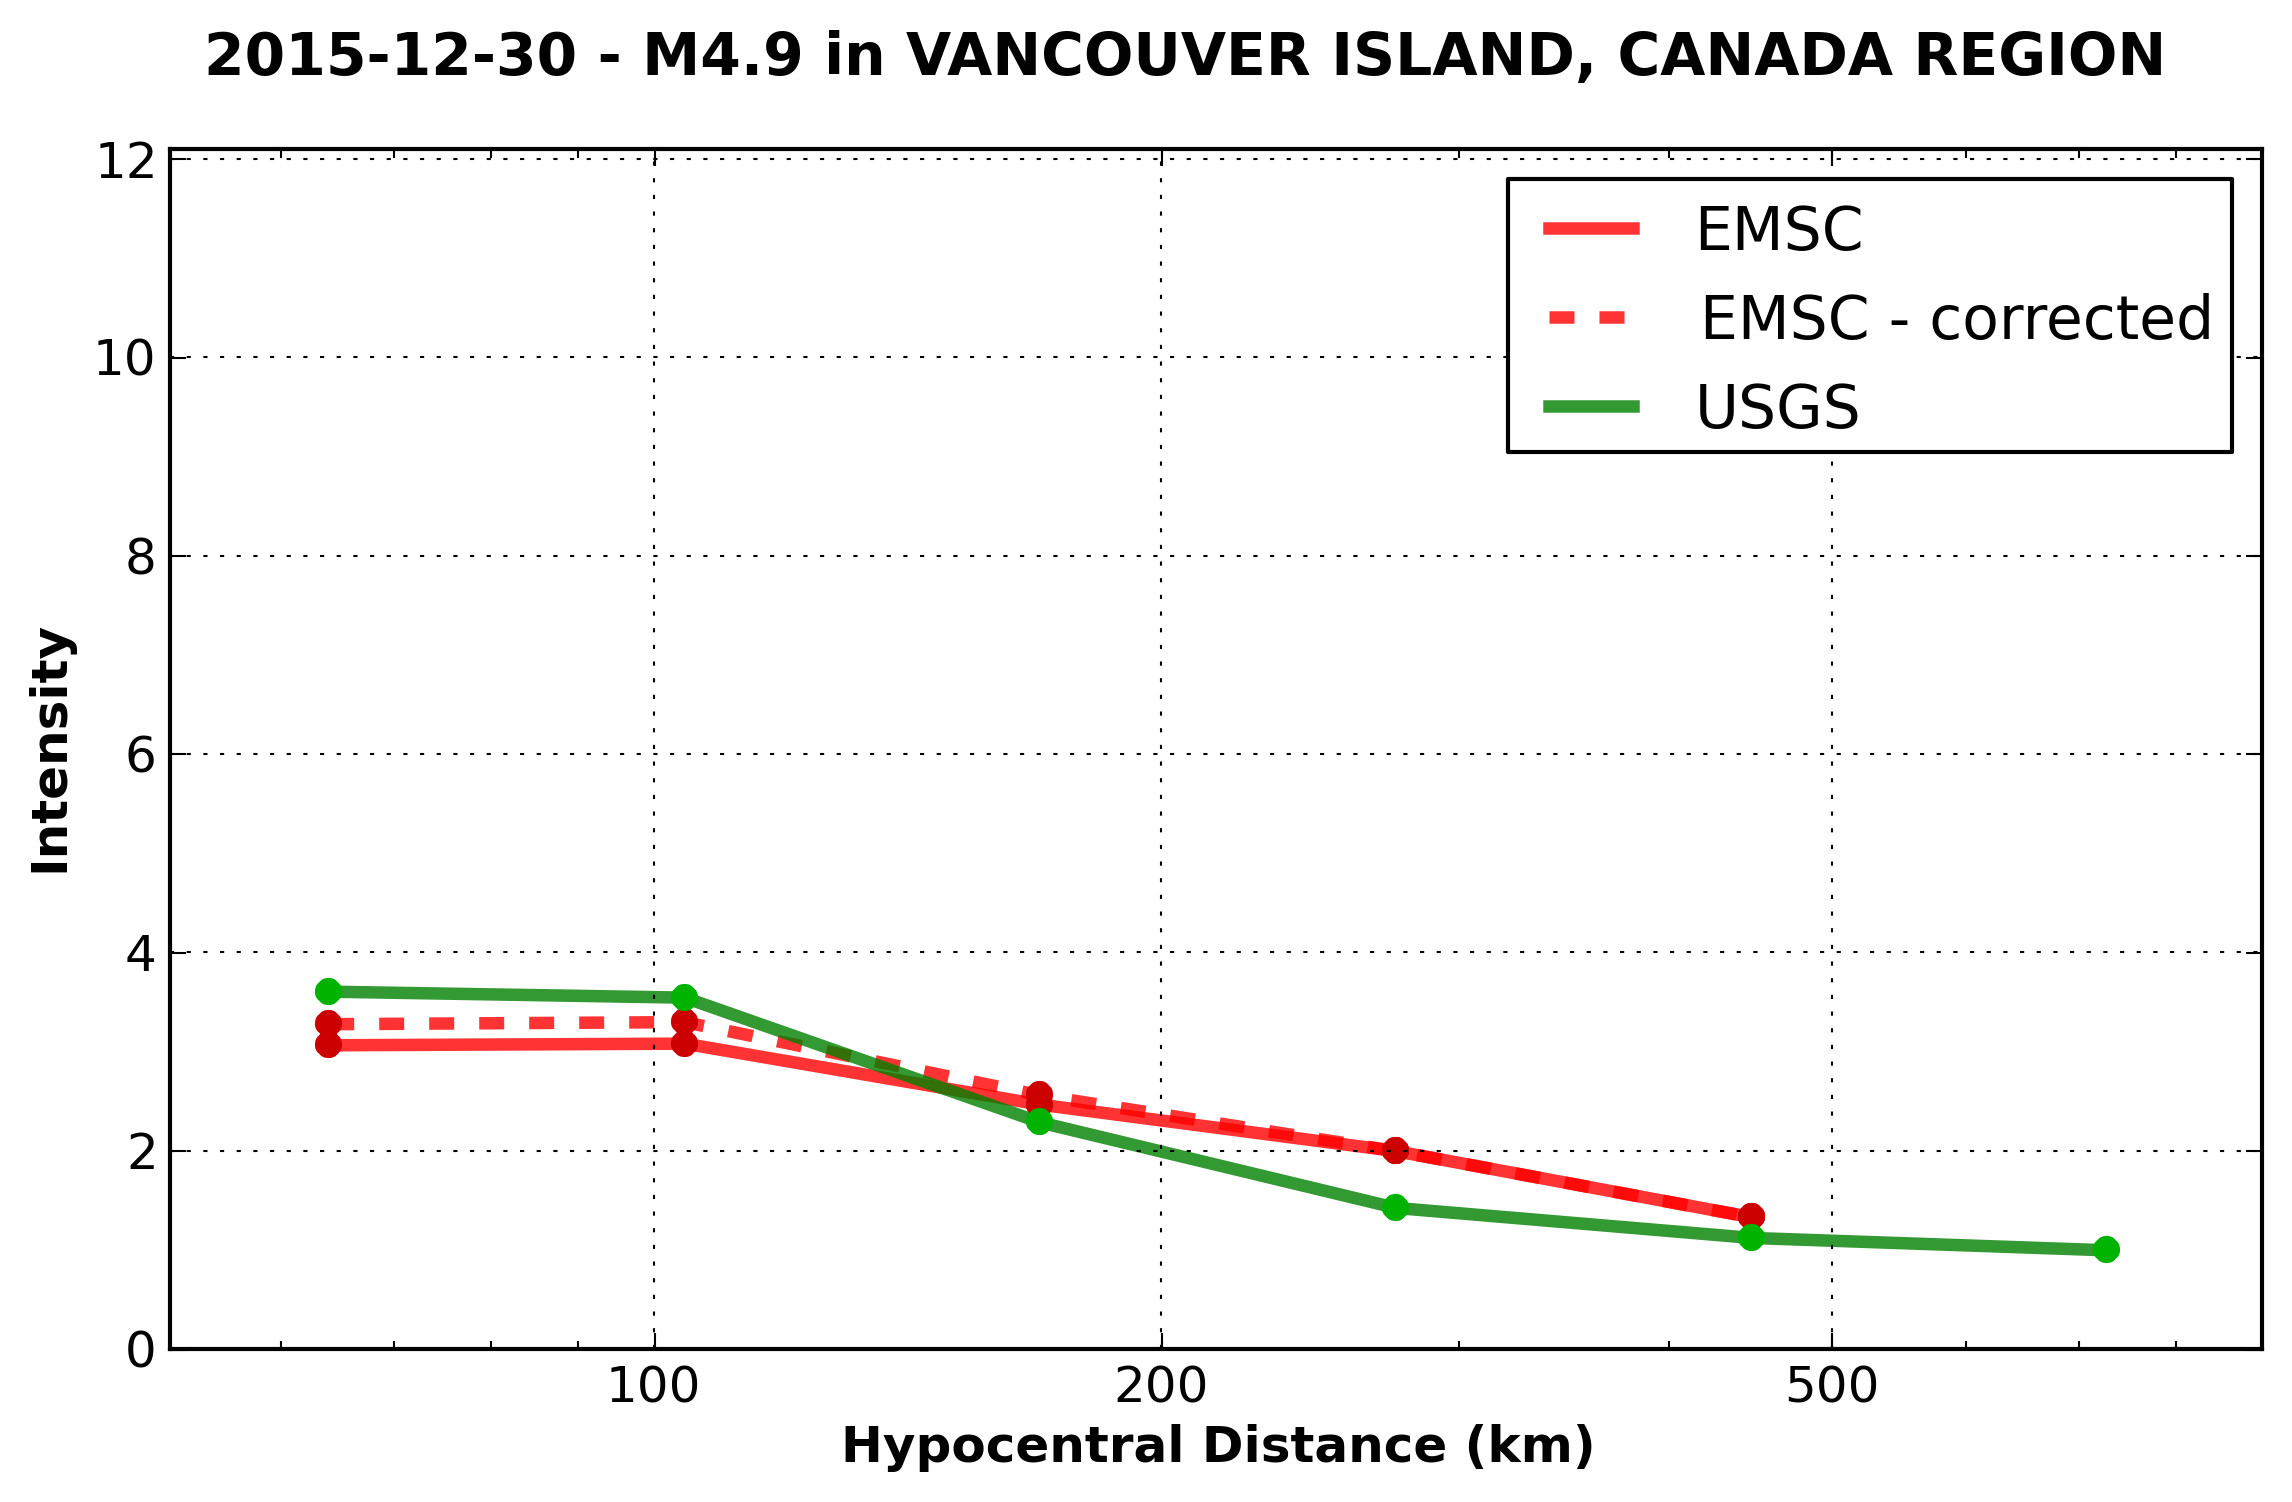
Figure S29. Same as Figure S16 for the 30 December 2015 M 4.9 Vancouver, Canada, earthquake.
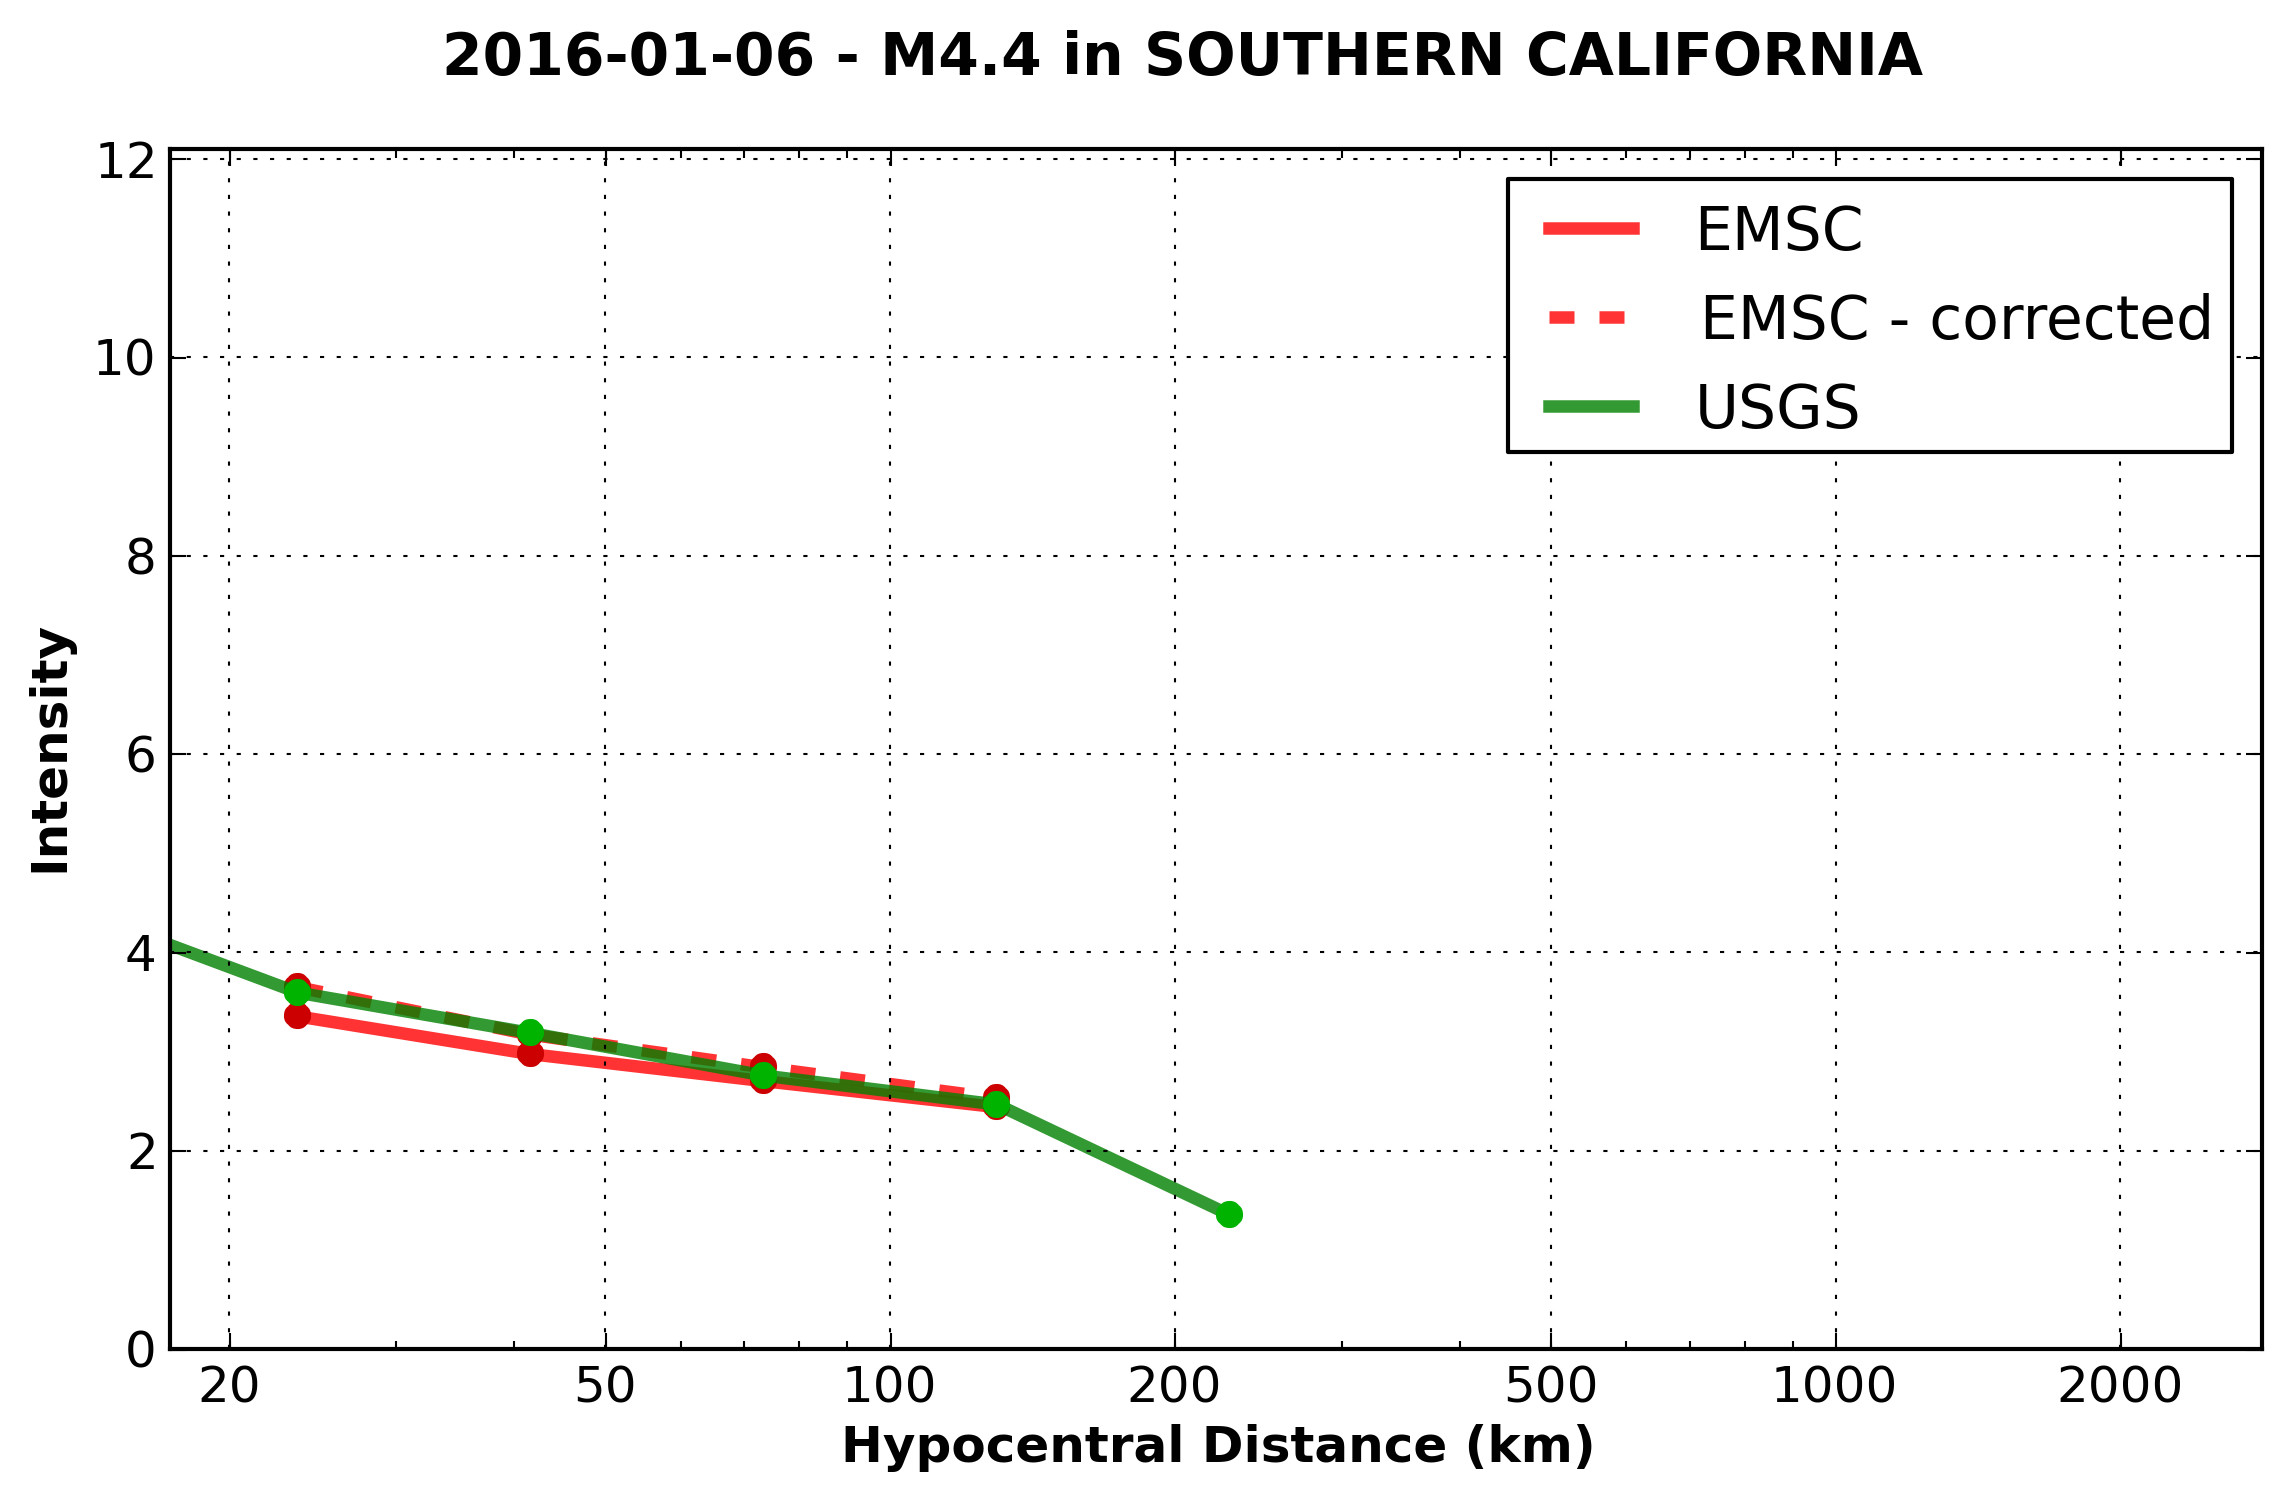
Figure S30. Same as Figure S16 for the 6 January 2016 M 4.4 California, U.S.A., earthquake.
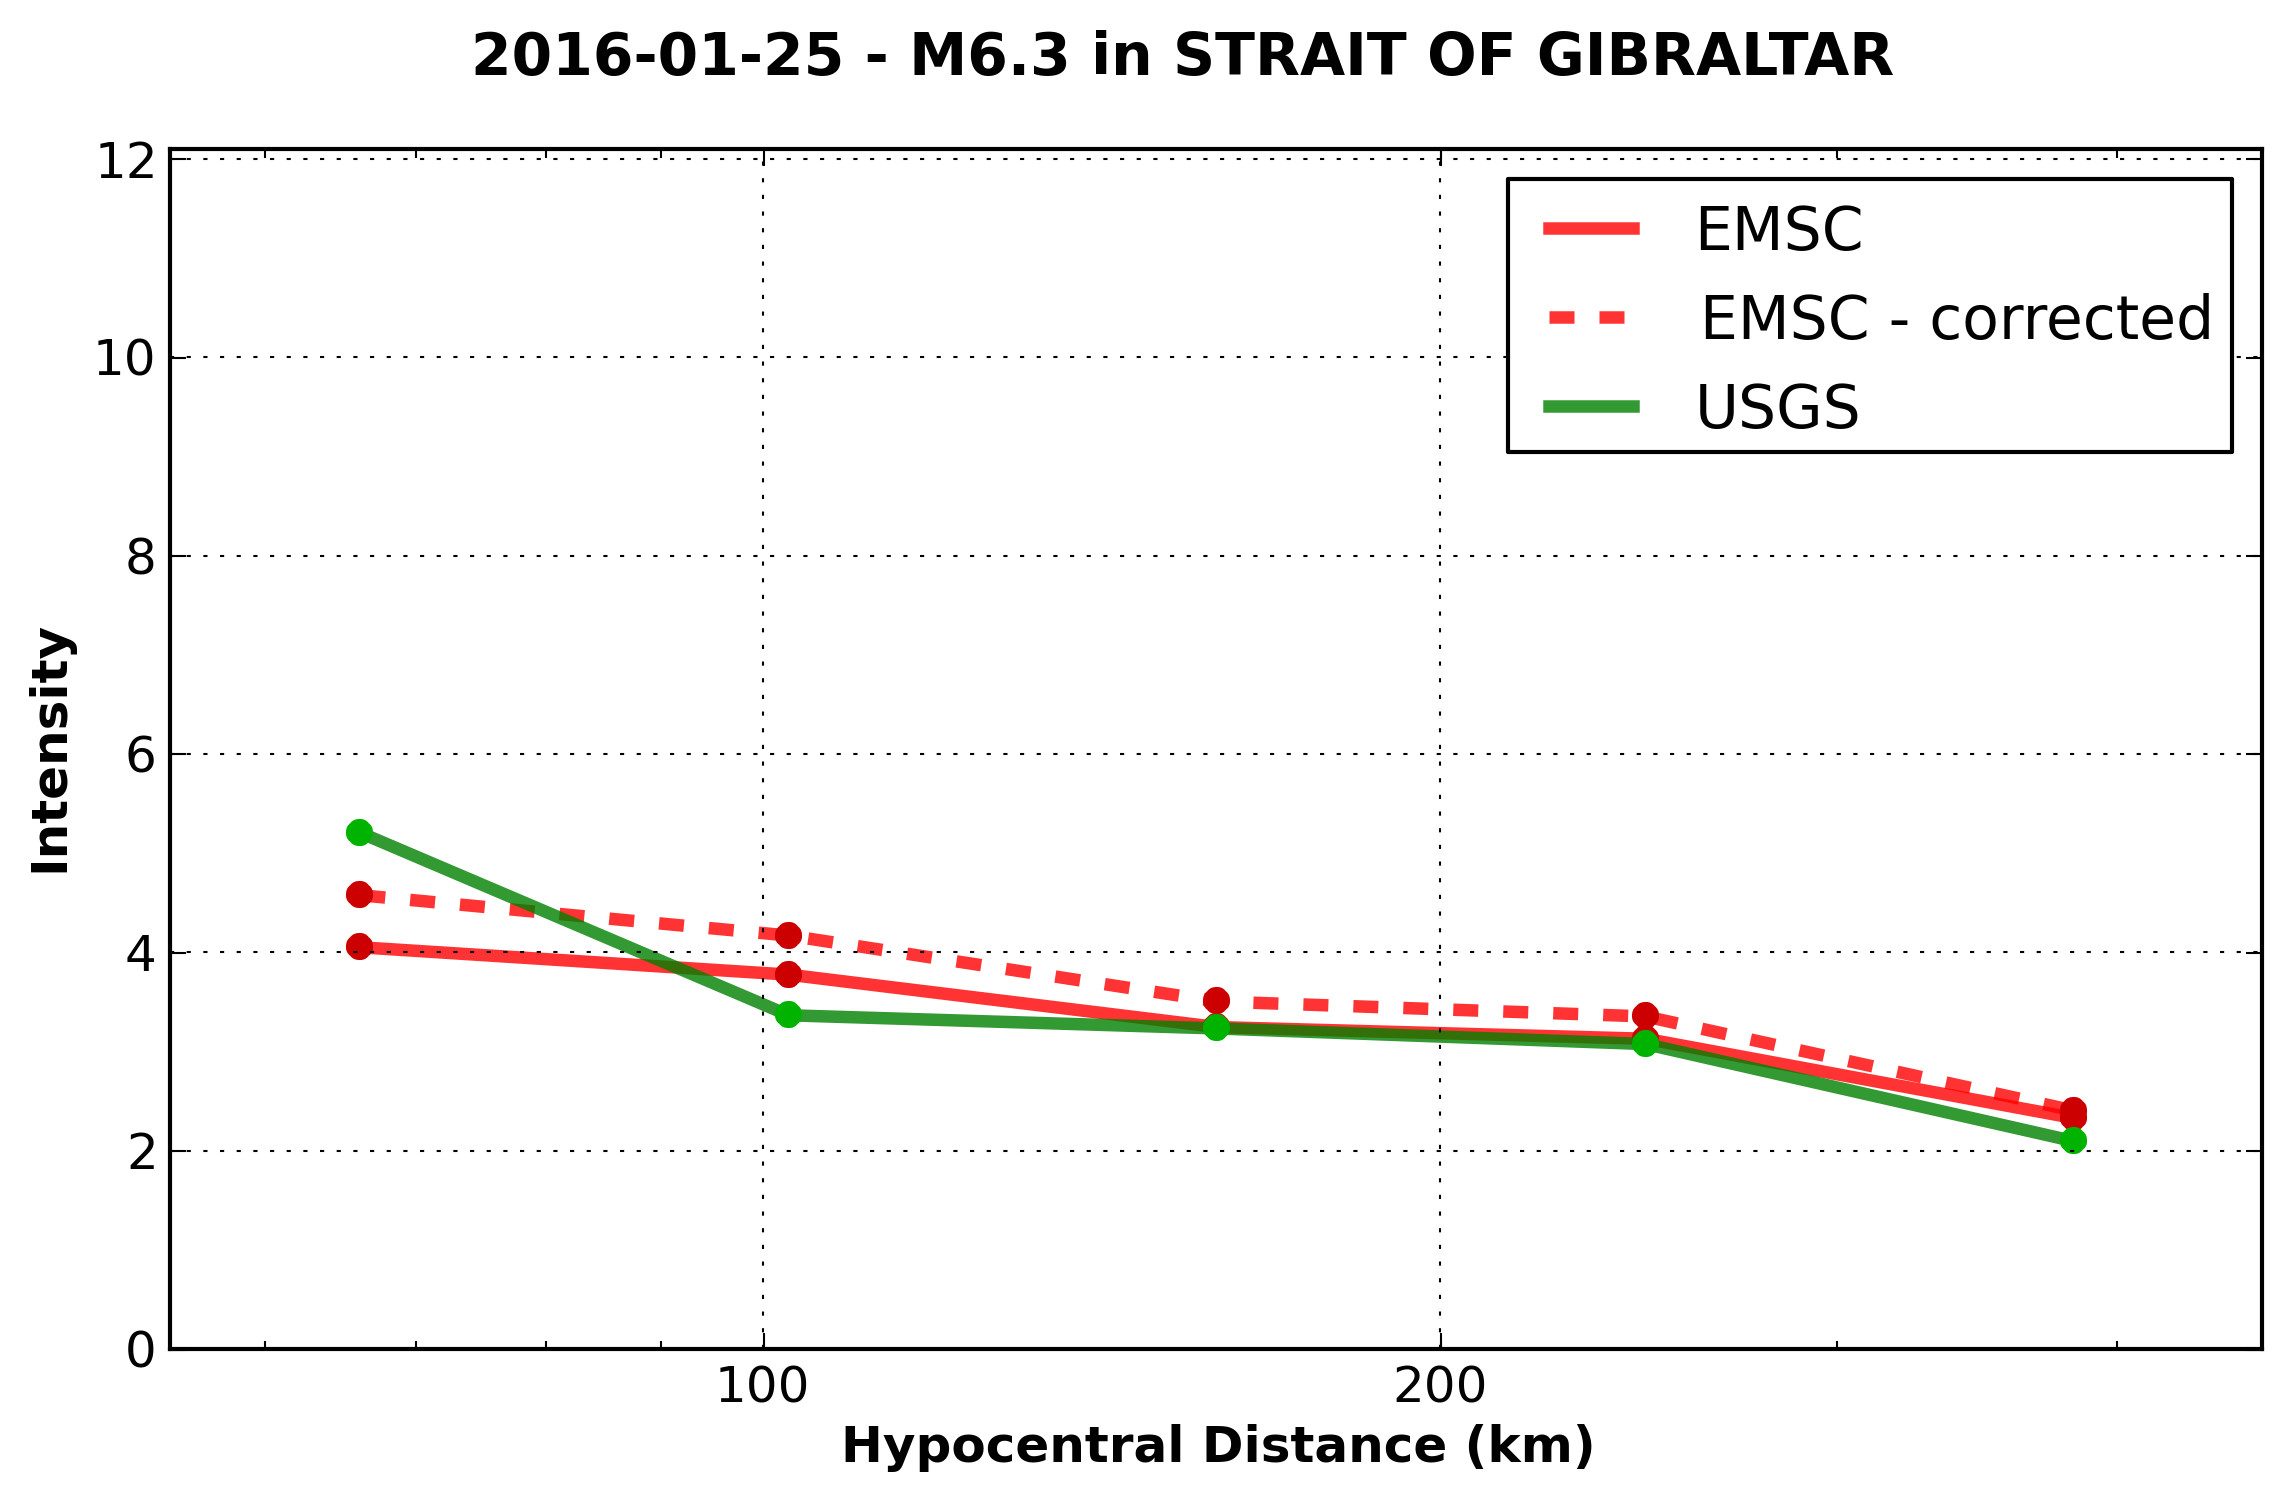
Figure S31. Same as Figure S16 for the 25 January 2016 M 6.3 Gibraltar earthquake.
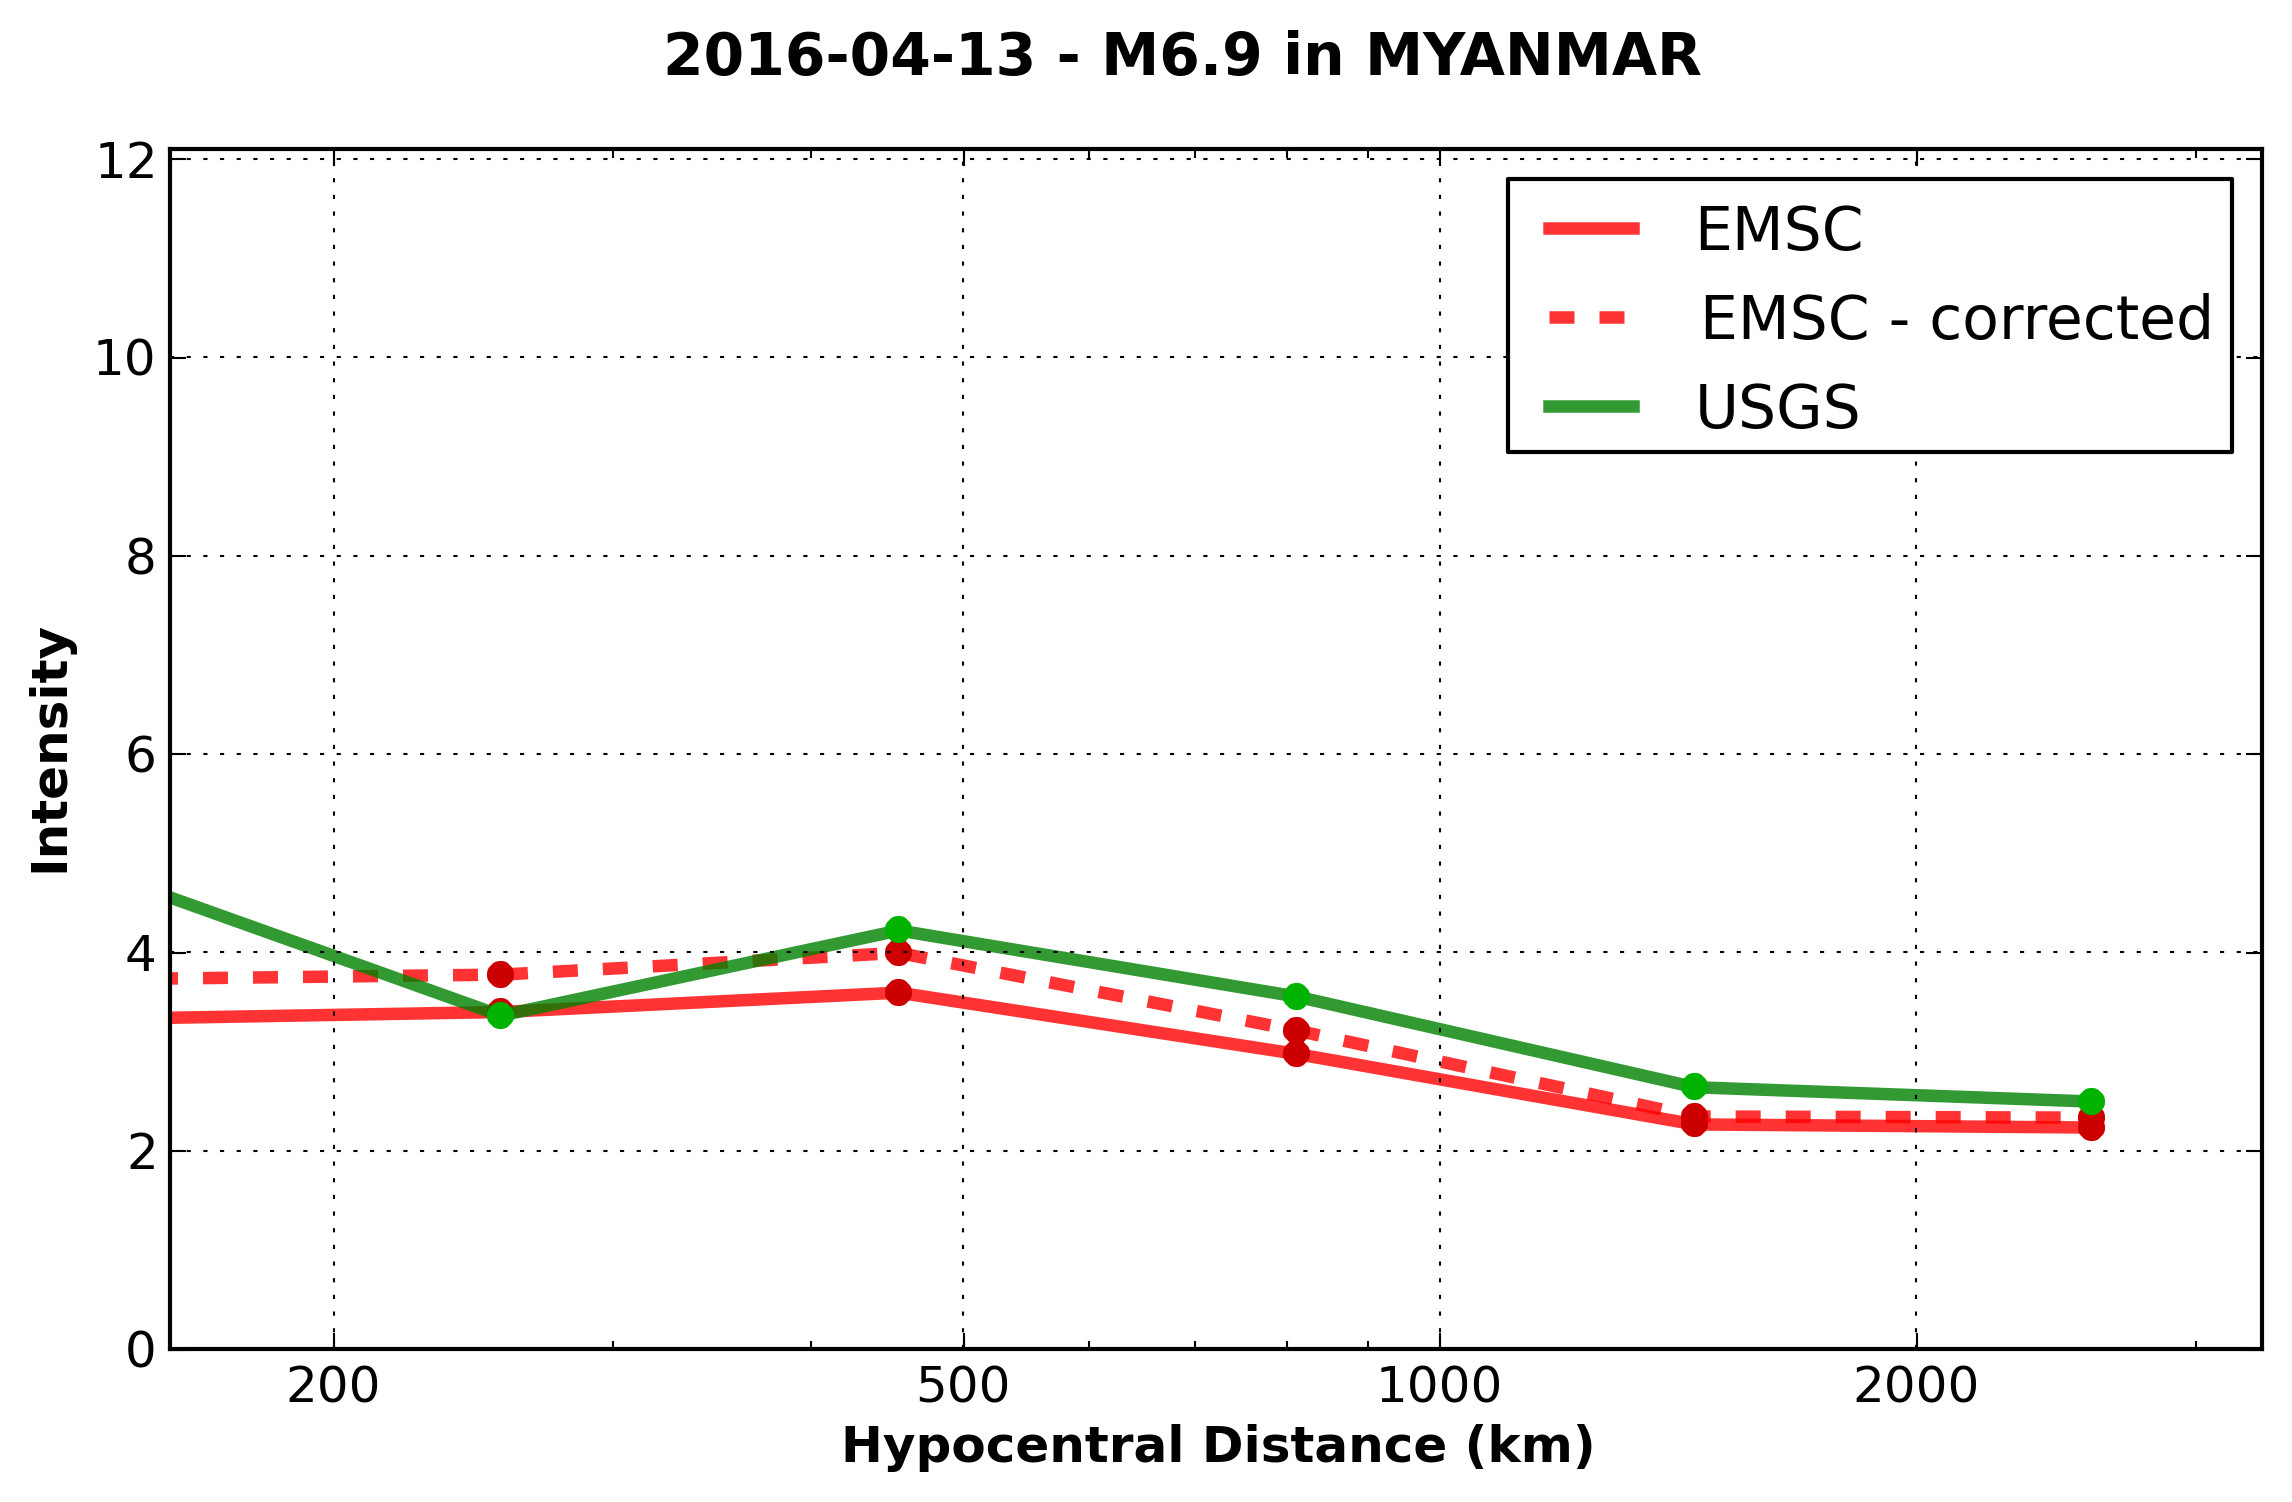
Figure S32. Same as Figure S16 for the 13 April 2015, M 6.9 Myanmar earthquake.
Ambraseys, N. N., and J. Douglas (2004). Magnitude calibration of north Indian earthquakes, Geophys. J. Int. 159, no. 1, 165–206.
Martin, S. S., S. E. Hough, and C. Hung (2015). Ground motions from the 2015 Mw 7.8 Gorkha, Nepal, earthquake constrained by a detailed assessment of macroseismic data, Seismol. Res. Lett. 86, no. 6, 1524–1532.
Szeliga, W., S. Hough, S. S. Martin, and R. Bilham (2010). Intensity, magnitude, location, and attenuation in India for felt earthquakes since 1762, Bull. Seismol. Soc. Am. 100, no. 2, 570–584.
Wald, D. J., V. Quitoriano, L. Dengler, and J. W. Dewey (1999). Utilization of the Internet for rapid community intensity maps, Seismol. Res. Lett. 70, 87–102.
Wald, D. J., V. Quitoriano, B. Worden, M. Hopper, and J. W. Dewey (2011). USGS “Did You Feel It?” Internet-based macroseismic intensity maps, Ann. Geophys. 54, no. 6, 688–707, doi: 10.4401/ag-5354.
[ Back ]