This electronic supplement contains tabulated data and figures that may be of interest to readers undertaking similar noise characterization studies in urban areas, and provides additional information about noise variability across the deployed network.
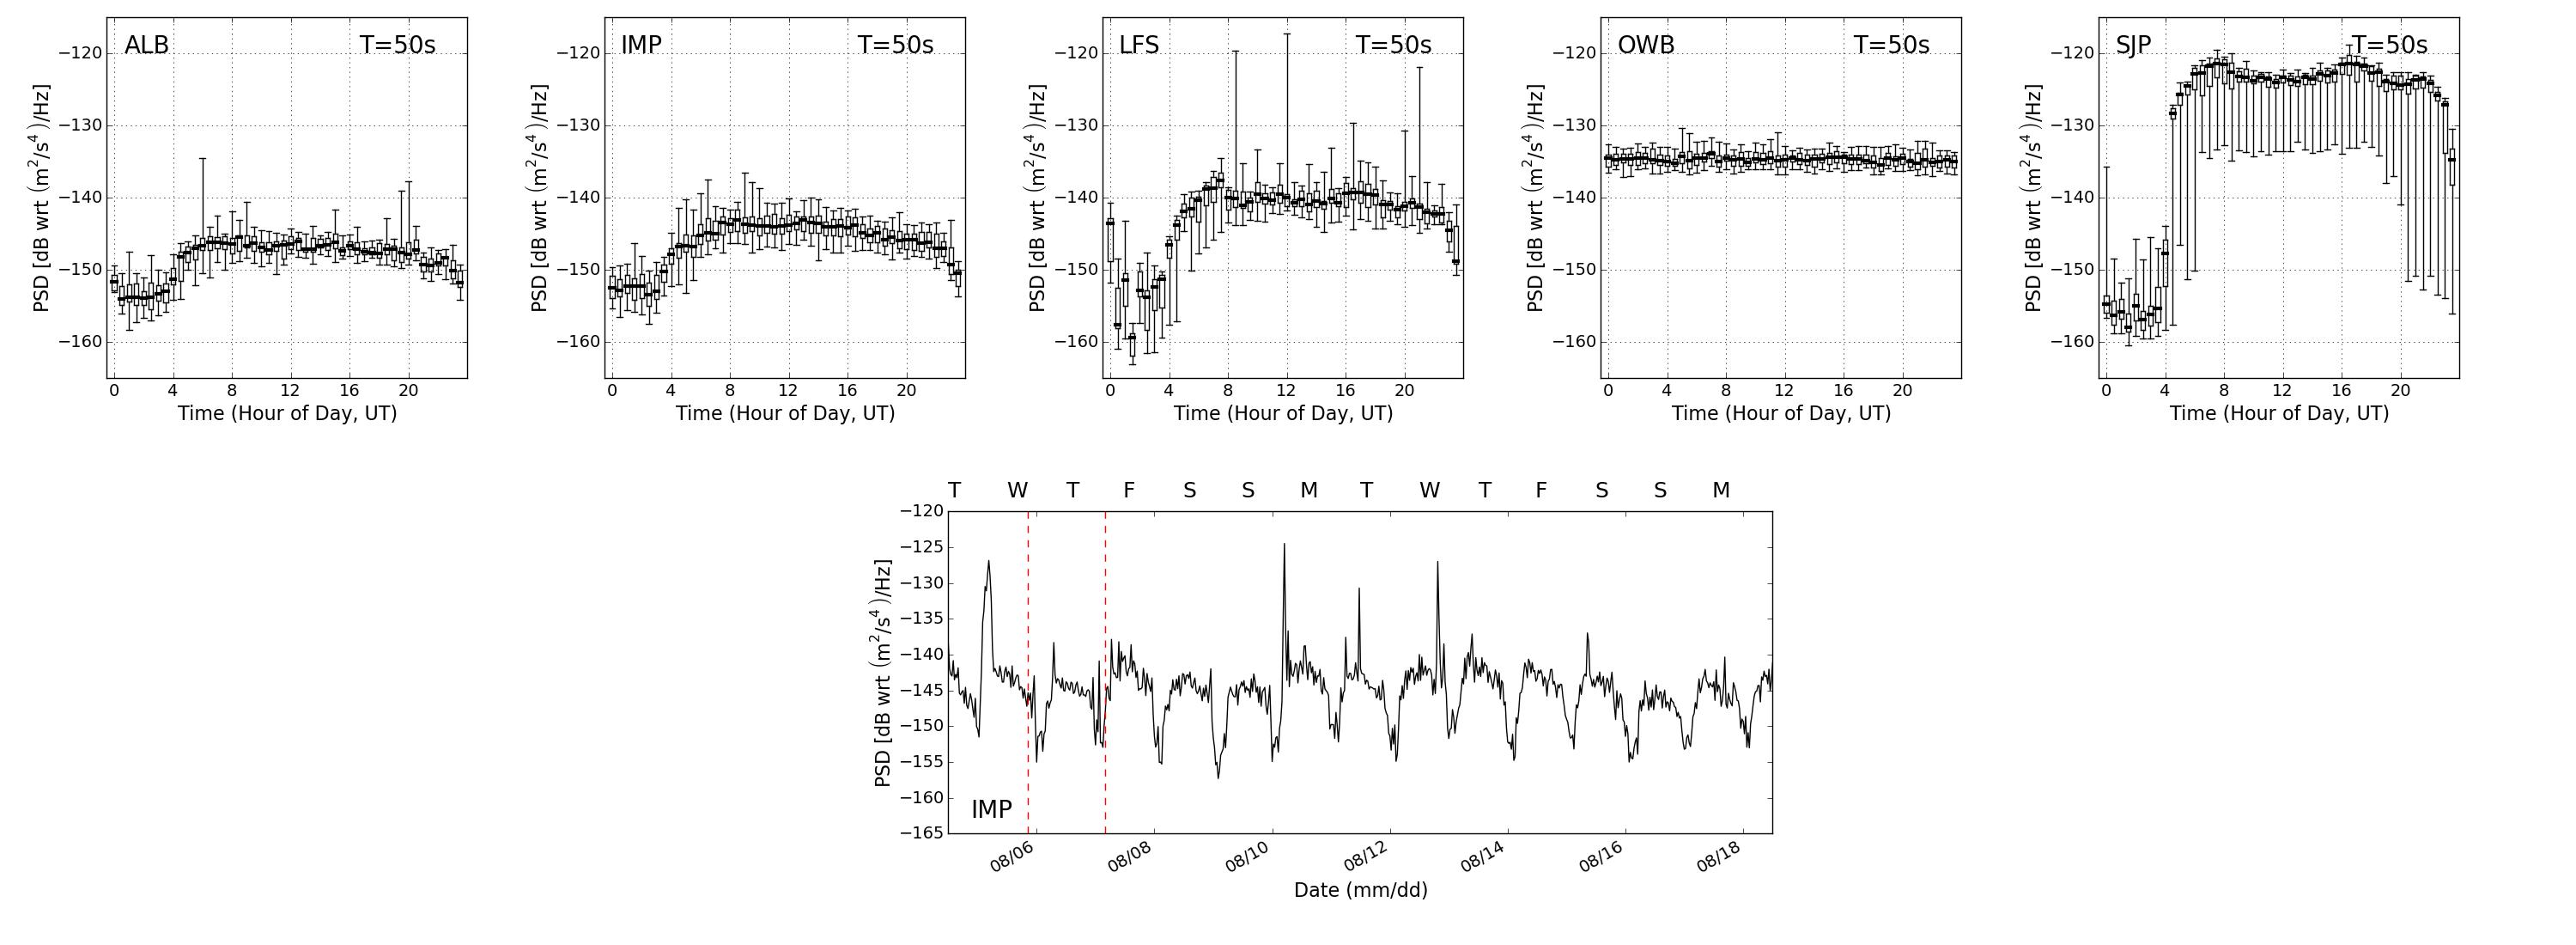
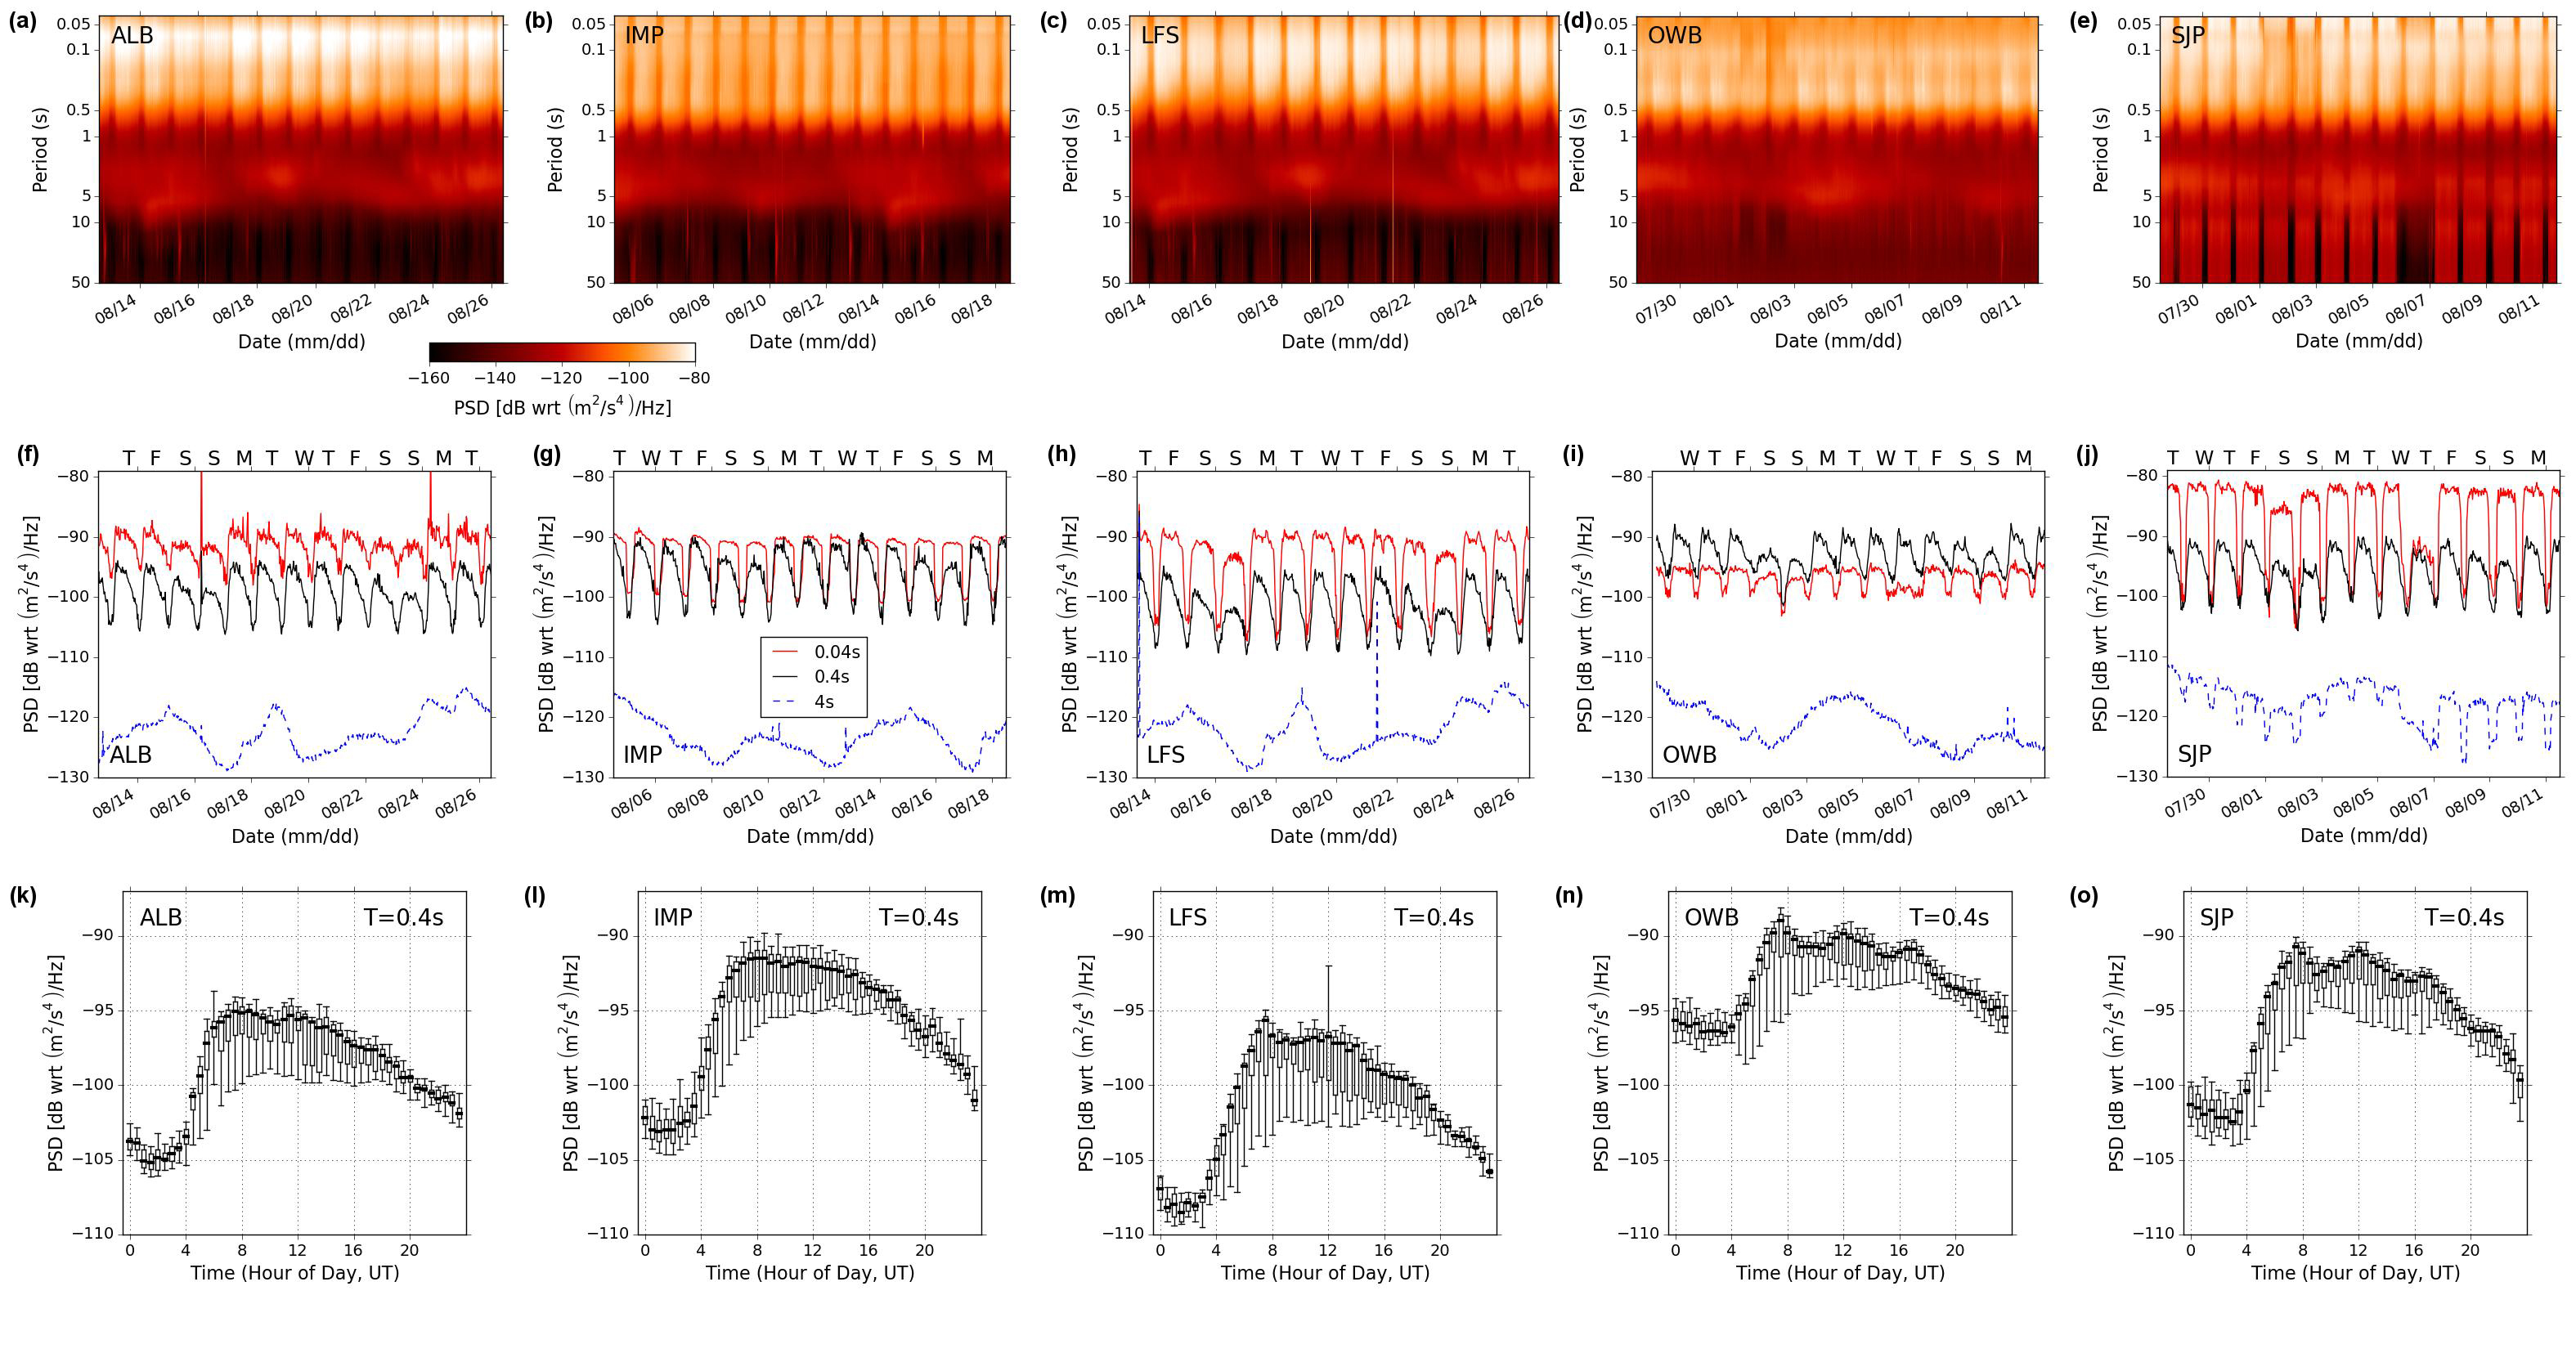
Figures S1 and S2 provide additional visual information with regard to the noise variability as a function of time across the stations within the deployed network. Figure S1 provides summaries of the variation in noise power at very low frequencies (T = 50 s) across all stations in the network to illustrate the observed diurnal variation at these periods. Figure S2 provides spectrograms and time series of power spectral density (PSD) values across all stations in the network and complements Figure 4 of the main article.
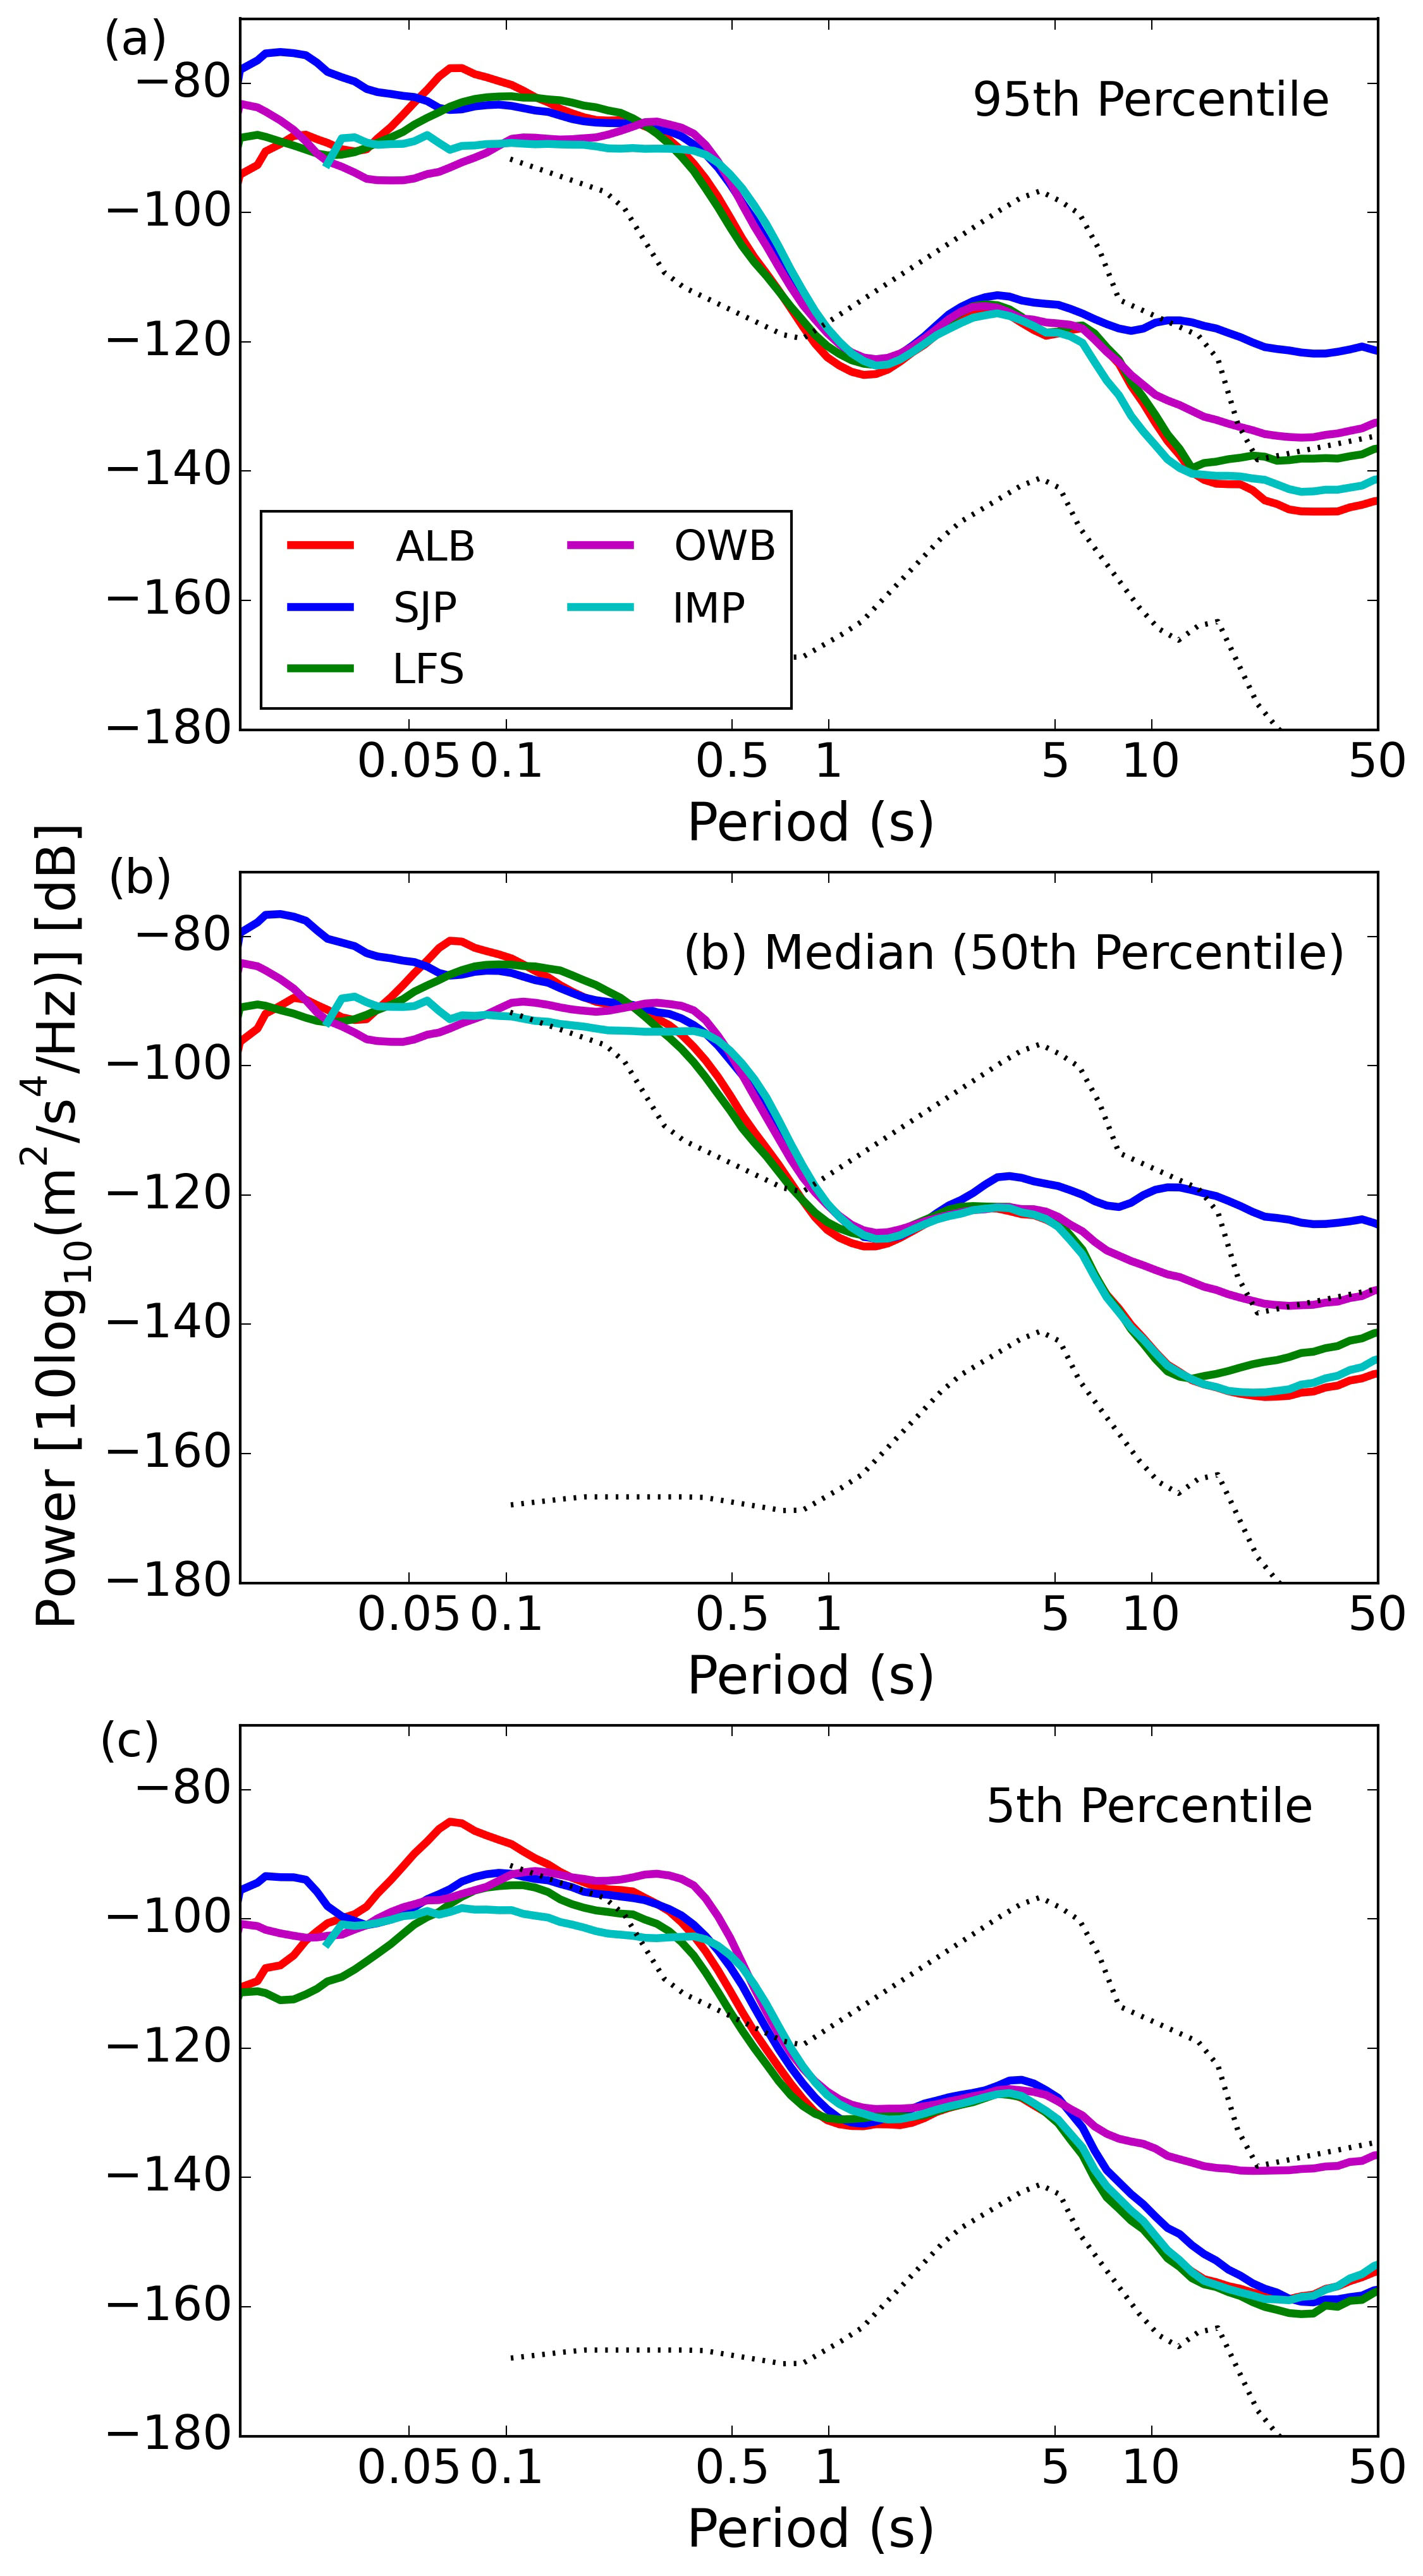
To allow future researchers to plot our results against other datasets, Table S1 provides values of vertical-component noise at three percentile values (5th, 50th, and 95th). These values are plotted in Figure S3.
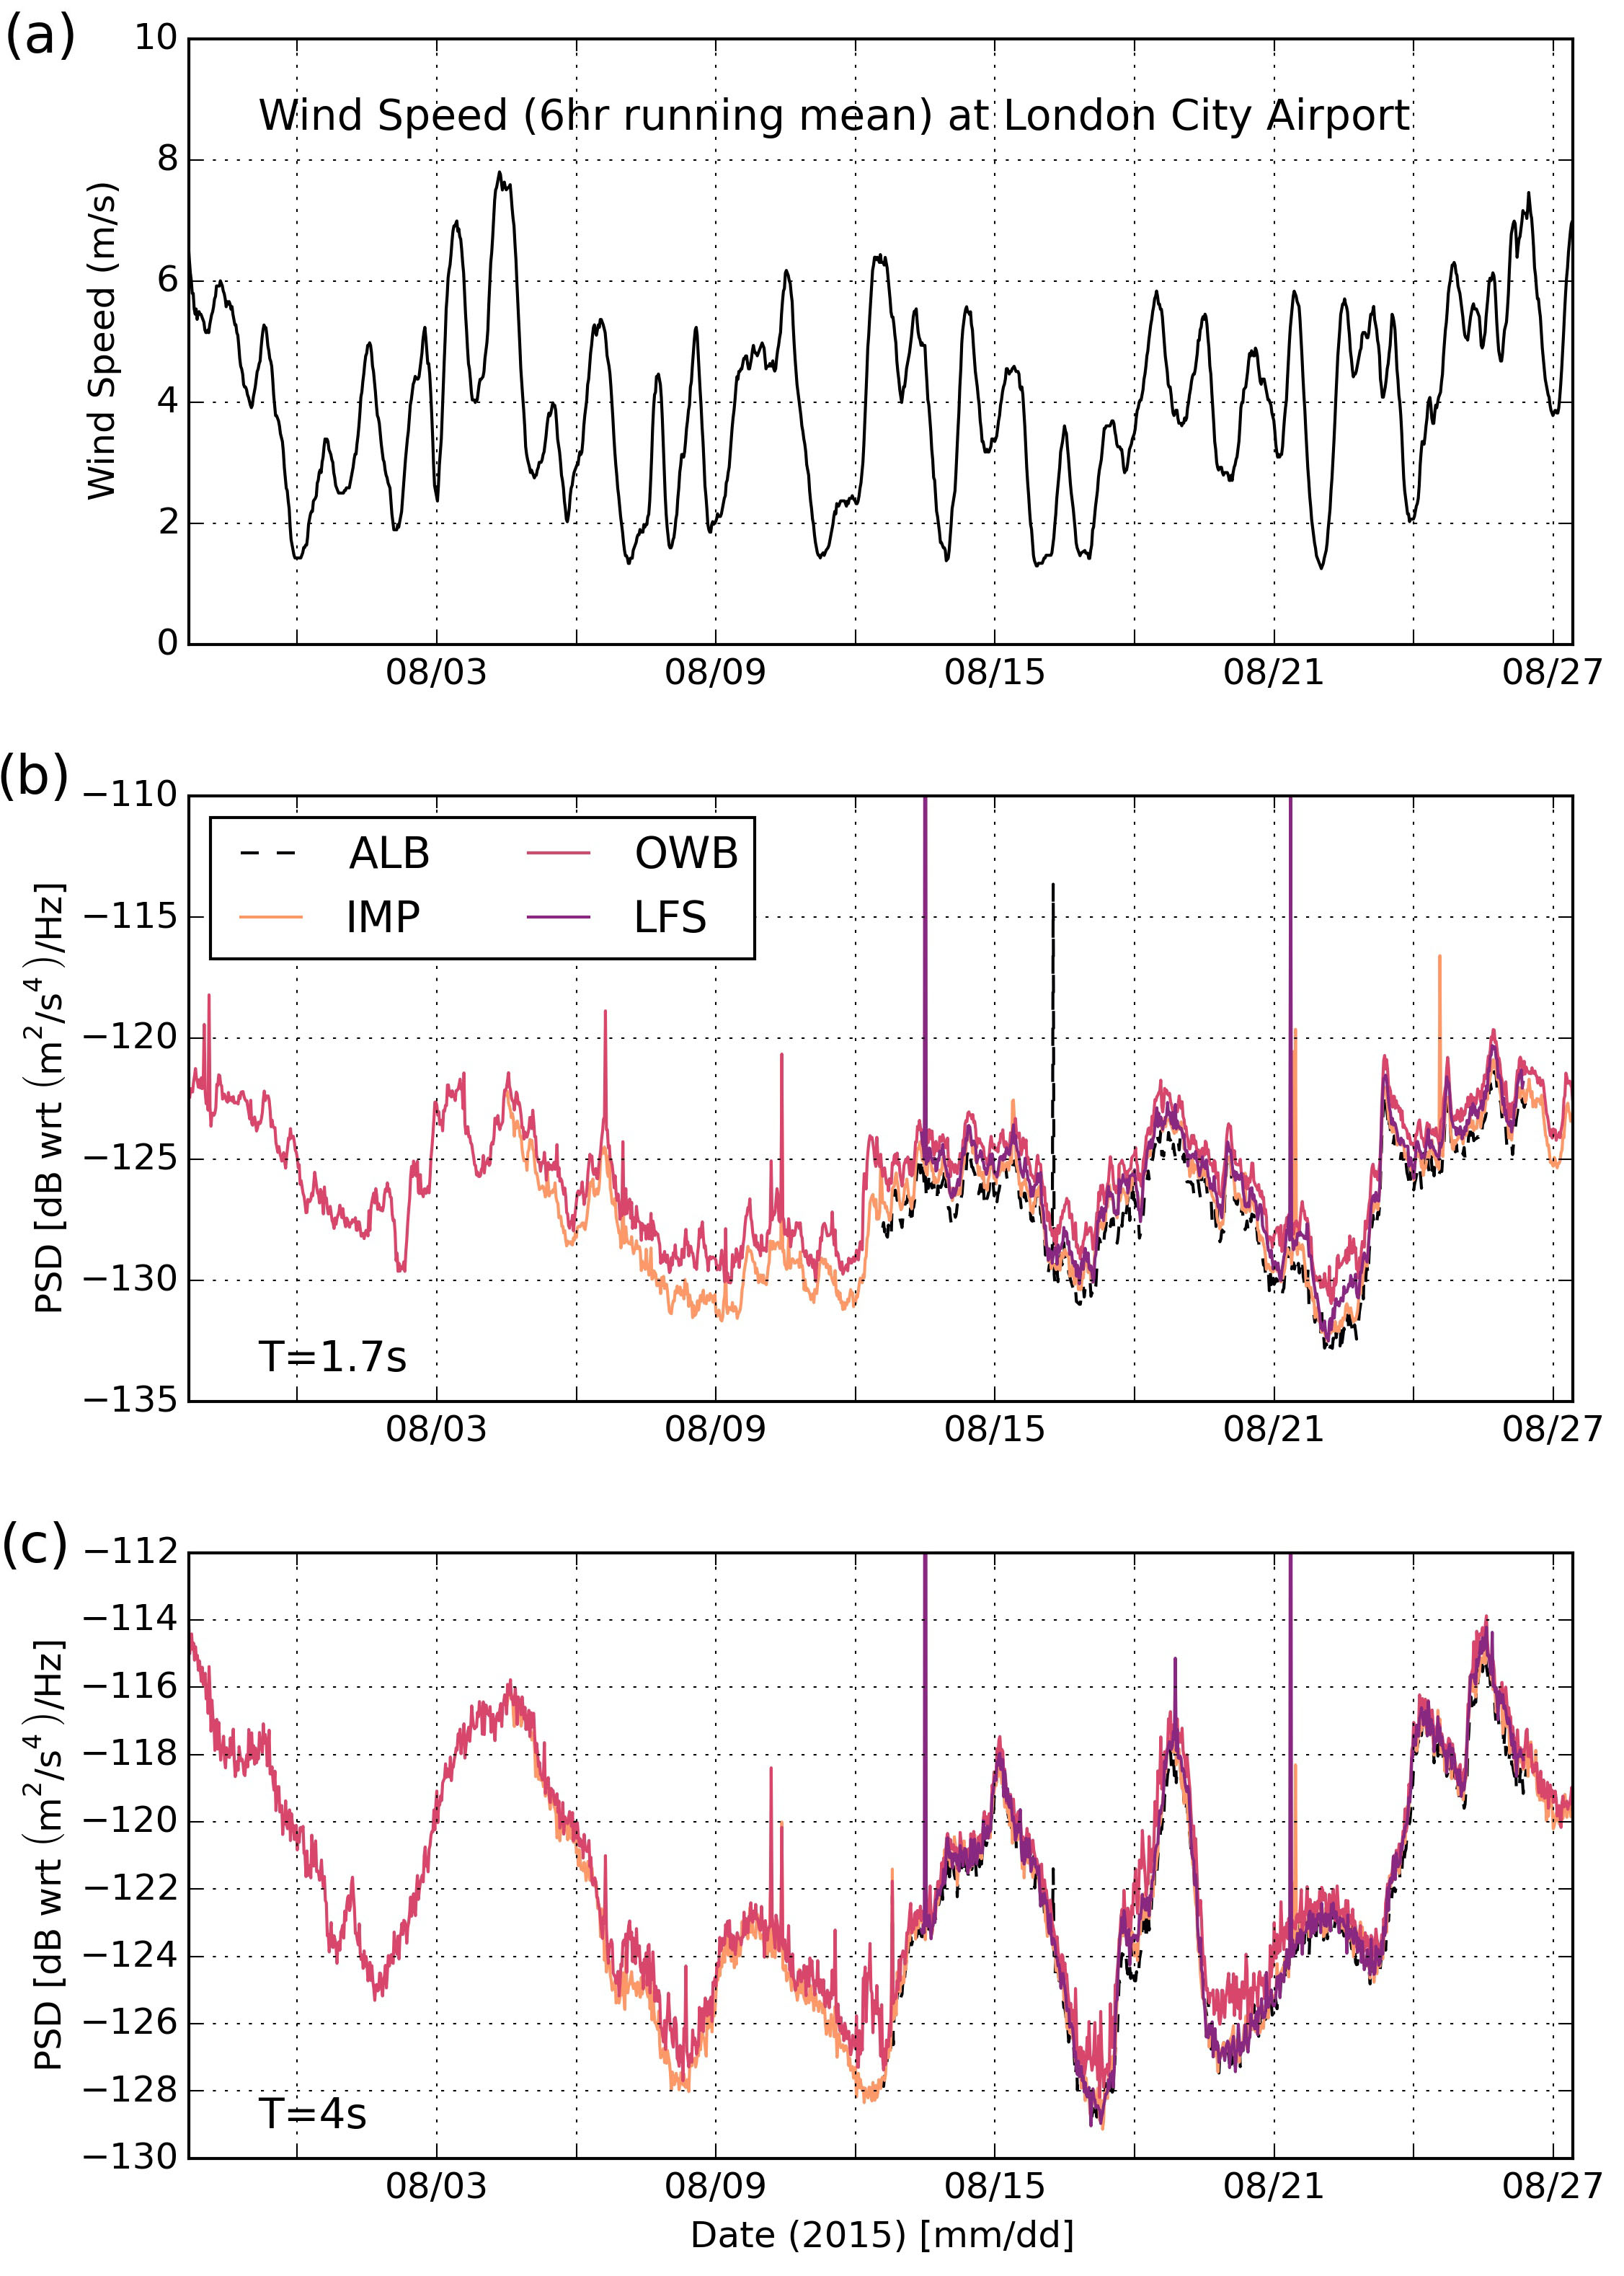
Figure S4 illustrates that wind variations have a minimal influence on seismic data across the London network. At periods <1.5 s, the PSD measurements are dominated by anthropogenic diurnally varying noise (see Fig. 4 of the main article and Fig. S2). At a period of 4 s, the PSD measurements are dominated by the secondary ocean microseism (Fig. 2 of the main article and Fig. S4c). In a very narrowband (between ~T = 1.5 and 2 s), the PSD measurements correlate well with the microseismic noise (Fig. S4b), but have additional small-amplitude variations with periods of a few hours that are correlated across the sensor network. These may be related to wind variations, as shown in a comparison with wind speeds measured at London City Airport that is located 12 km east of Westminster at 51.50528° N, 0.05528° E (Fig. S4a).
Table S1 [Plain Text Comma-separated Values; 12 KB]. Vertical-component noise values at given periods (T) for the 5th, 50th (median), and 95th percentiles of the probability density functions (PDFs) at each of the five broadband stations across central London. All noise values are provided as acceleration power in decibels with a reference acceleration of 1 m/s2 (dB with respect to 1 (m2/s4)/Hz). IMP is missing short-period data due to the lower sampling rate at this station. Results are shown graphically in Figure S1. NaN indicates “not a number.”
Figure S1. The upper five plots are boxplot summaries of the noise variation in half-hour bins across the entire station deployments at a period of 50 s. The thick central line indicates the median value, and the box limits are the 25th and 75th percentiles, whereas the whiskers represent the 5th and 95th percentiles of the noise distribution. The lower plot shows the temporal variation of the median noise values at a period of 50 s for a two-week period at station IMP; the red dashed lines indicate the approximate start and end times of the subway strike.
Figure S2. Diurnal variations of noise measurements across all stations, complementing Figure 4 in the main article. The upper panels show the variation of noise power as a function of time and period. Note that although the y-axis scales are identical, the time periods are different due to different deployment schedules. The middle panels show diurnal noise variations at three periods, representing horizontal slices through panels (a)–(e). The lower plots are boxplot summaries of the noise variations in half-hour bins across the entire station deployment at 0.4 s. The thick central line indicates the median value, and the box limits are the 25th and 75th percentiles, whereas the whiskers represent the 5th and 95th percentiles of the noise distributions.
Figure S3. The (a) 95th, (b) 50th (median), and (c) 5th percentiles of the noise PDFs for the five broadband stations deployed in central London. Values are provided in Table S1.
Figure S4. A comparison of (a) wind speed data recorded at London City Airport at a reference height of 10 m above the ground, with PSD values at periods of (b) 1.7 s and (c) 4 s measured across the London seismic network. Wind data obtained from the Weather Underground website (see Data and Resources).
Wind data can be found at www.wunderground.com (last accessed September 2016).
[ Back ]