This electronic supplement includes five figures (Figs. S1–S5). Figures of VS30 values based on topography versus rupture distance and difference between reference VS30 and VS30 based on topography versus distance, residuals, event terms, and intraevent standard deviations.
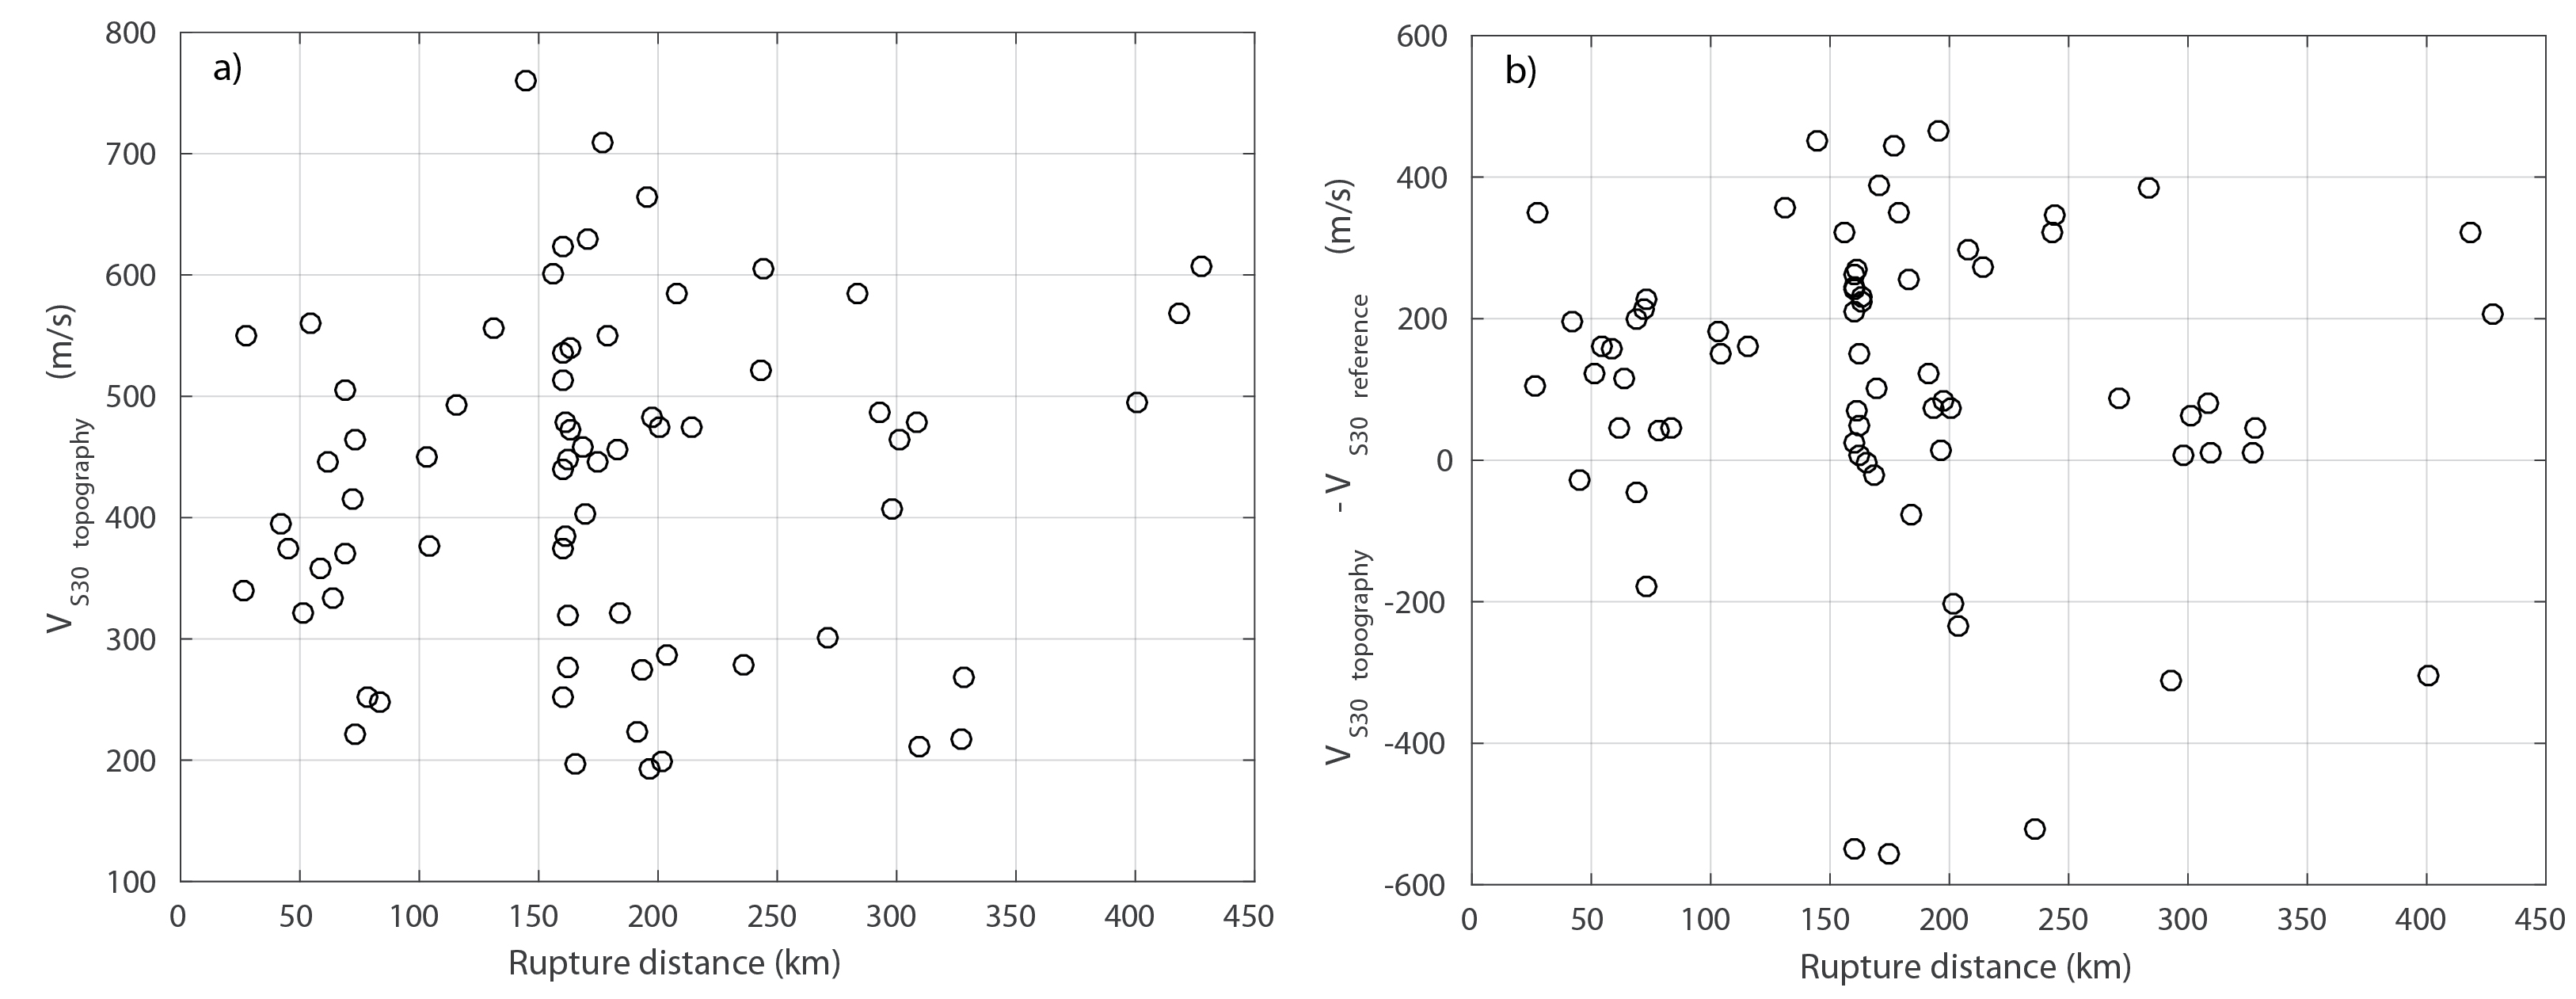
Figure S1. VS30 values based on topography versus rupture distance and difference between reference VS30 and VS30 based on topography versus distance (see the Strong-Motion Data section in the main article).
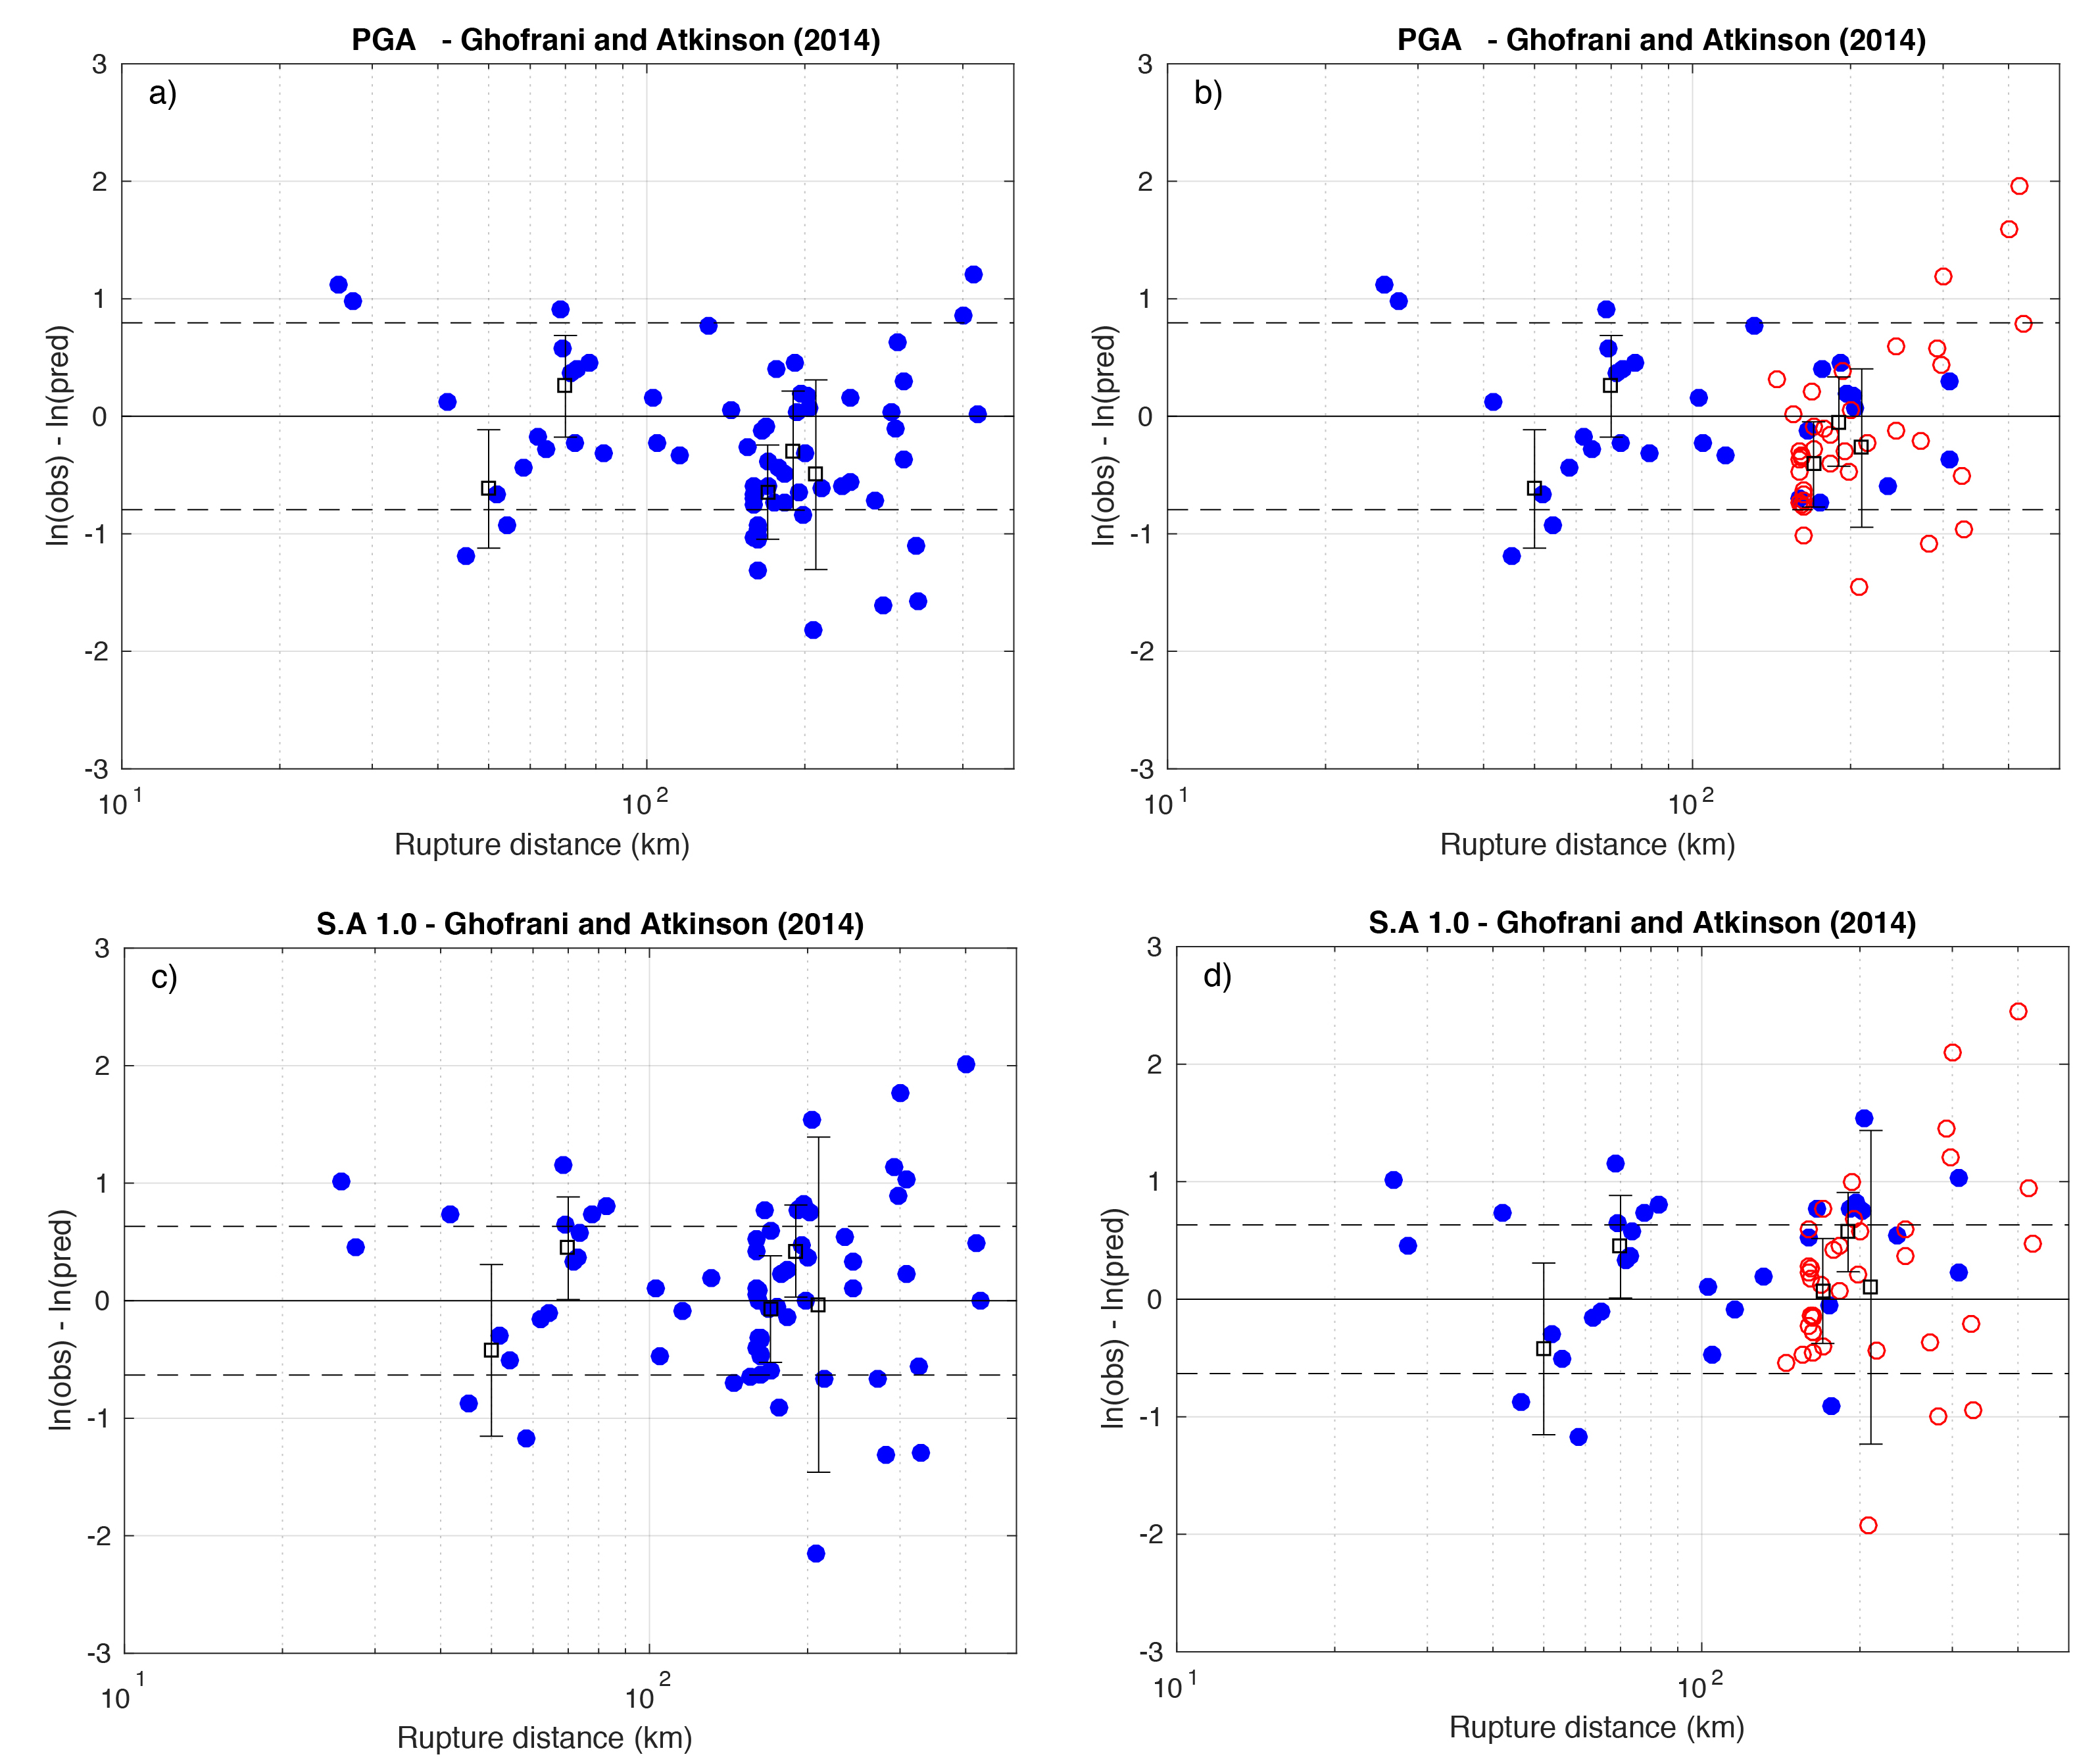
Figure S2. Mainshock, total residuals, the Ghofrani and Atkinson (2014) model. The residuals are binned into intervals of 20 km width, and the corresponding means (squares) and standard deviations (bars) are displayed when calculated on at least four values. Dashed lines indicate ± total sigma. Event term is the mean of the residuals. VS30 reference set considered (see the Strong-Motion Data section in the main article). Filled circles, fore-arc stations; empty circles, back-arc stations.
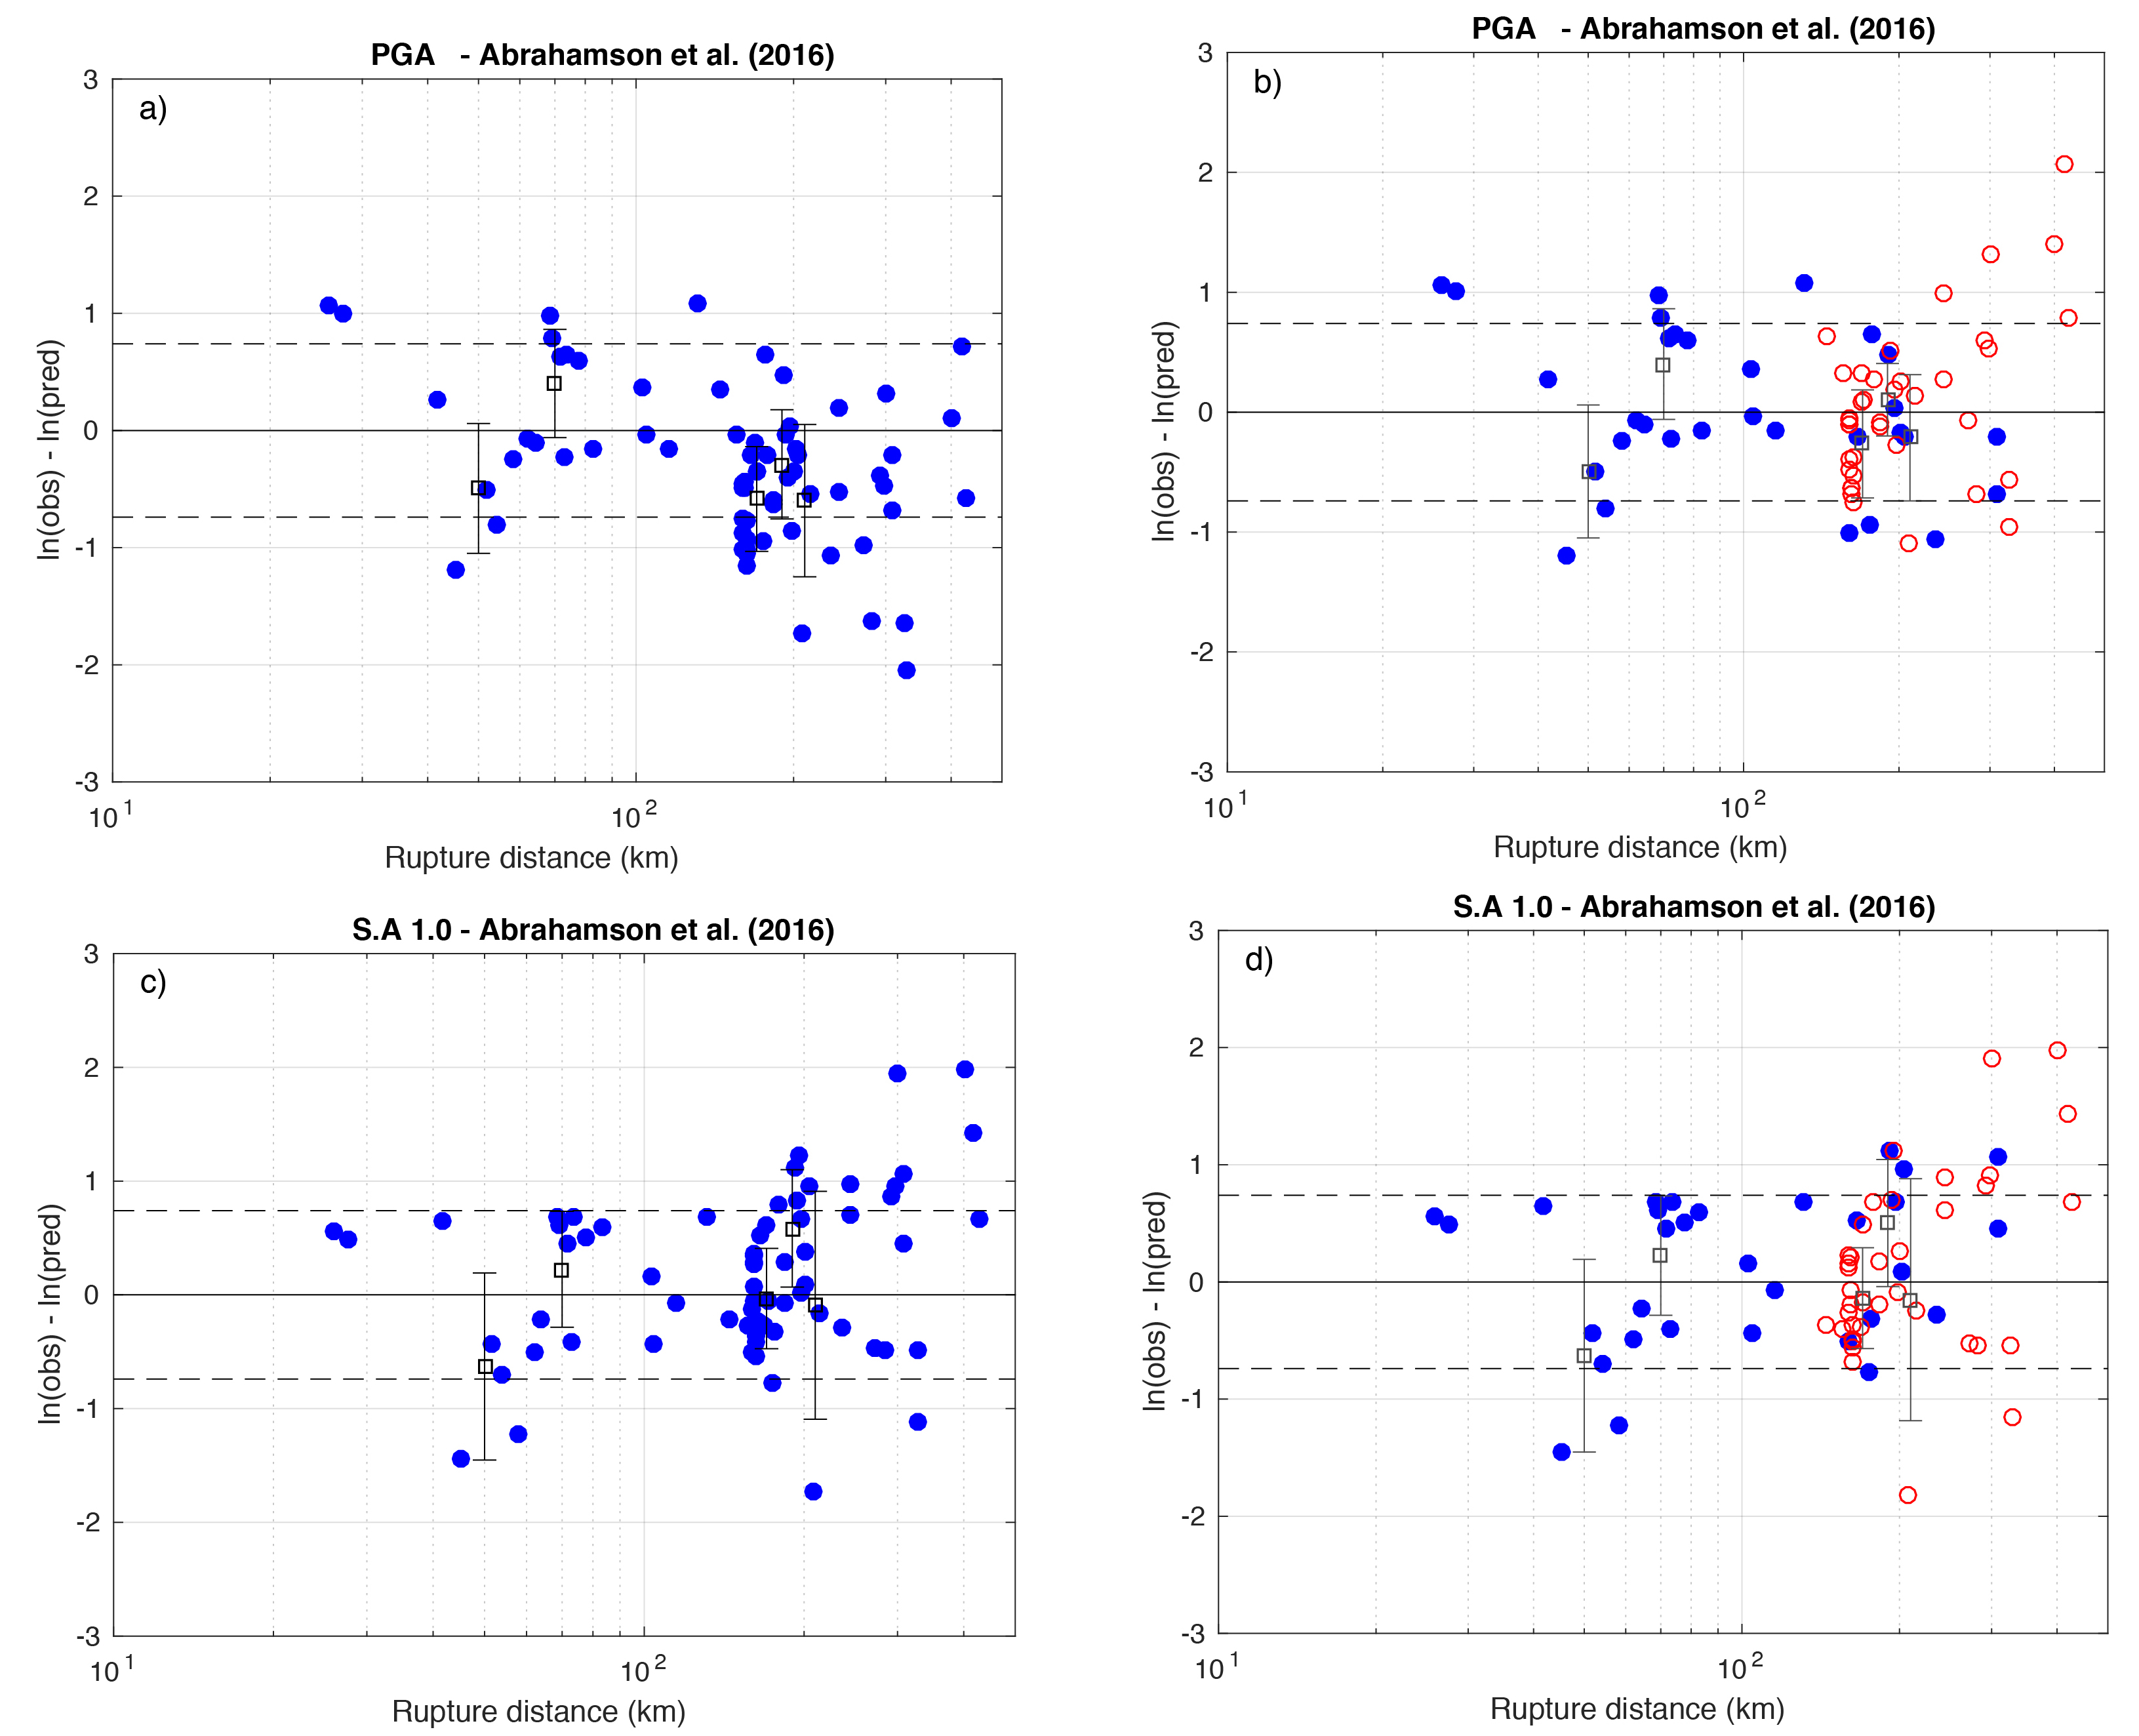
Figure S3. Mainshock, total residuals, the Abrahamson et al. (2016) model, using the VS30 values based on topography. The residuals are binned into intervals of 20 km width, and the corresponding means (squares) and standard deviations (bars) are displayed when calculated on at least four values. Dashed lines indicate total sigma. Residuals at distances larger than 300 km are outside the validity limit of the model. Filled circles, fore-arc stations; empty circles, back-arc stations.
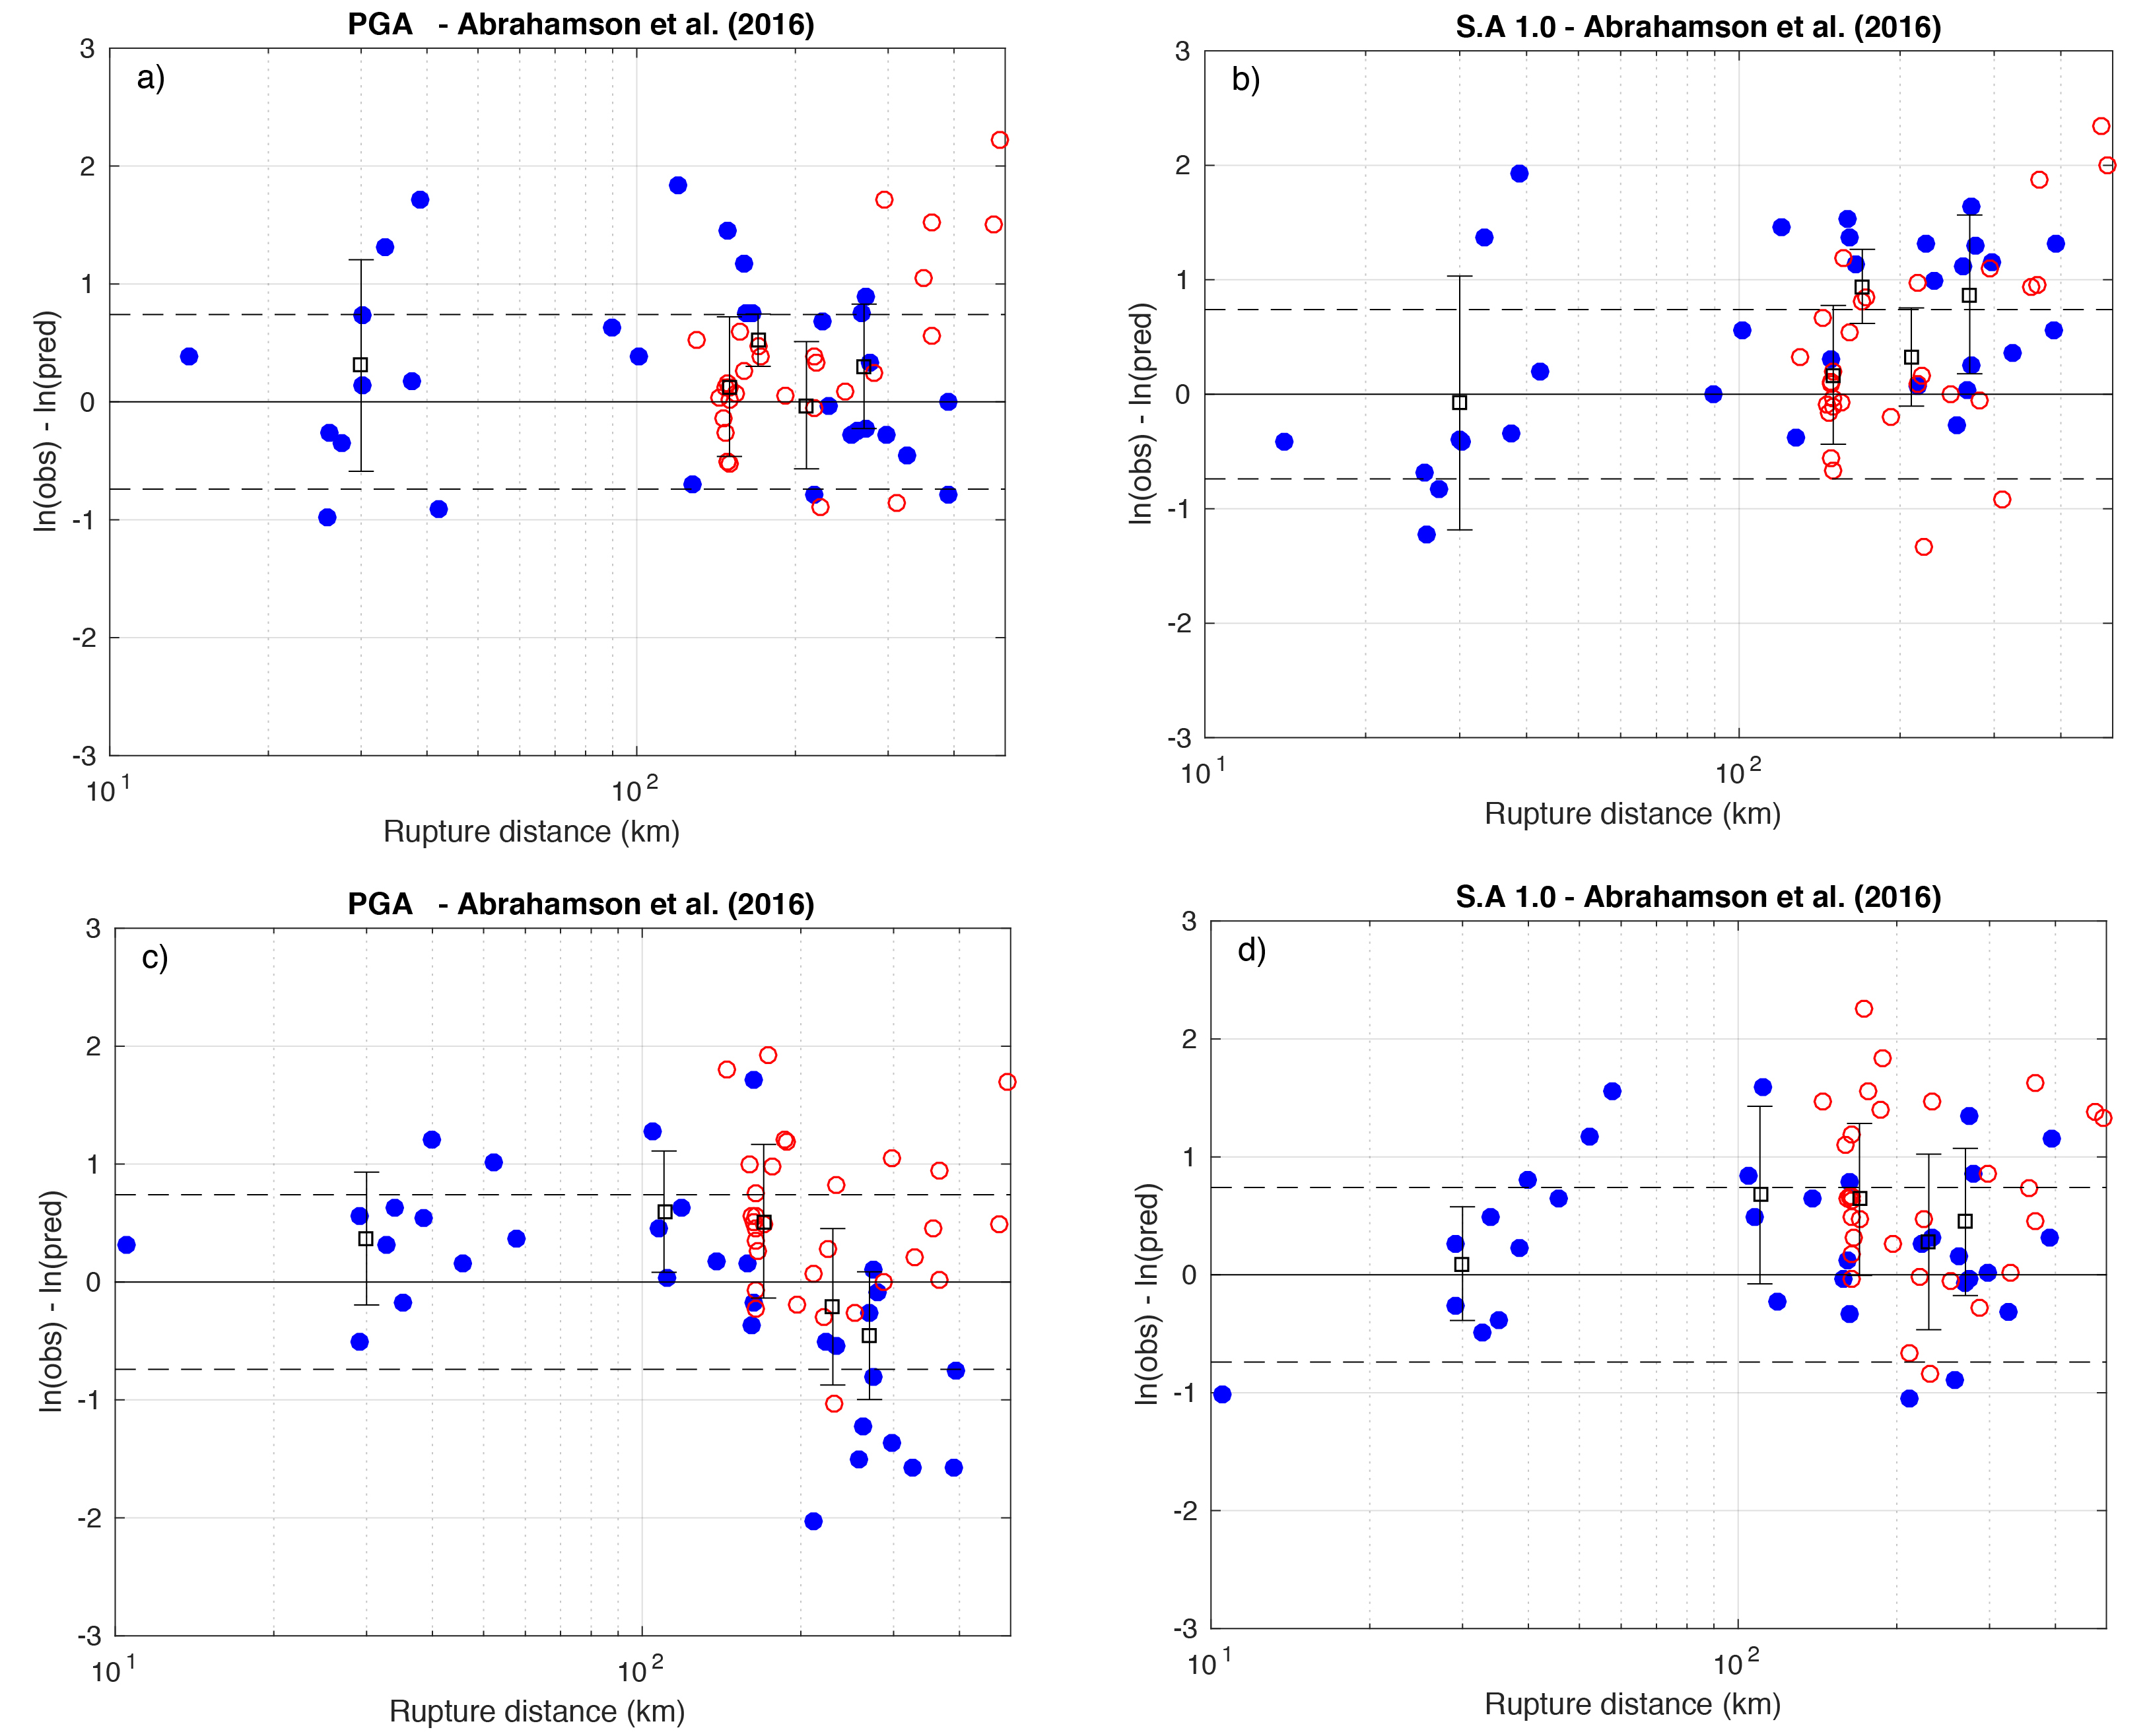
Figure S4. Aftershocks, total residuals, the Abrahamson et al. (2016) model, using the VS30 values based on topography. (a) and (b) Aftershock Mw 6.9; (c) and (d) aftershock Mw 6.7. Residuals at distances larger than 300 km are outside the validity range of the model. Filled circles, fore-arc stations; empty circles, back-arc stations.
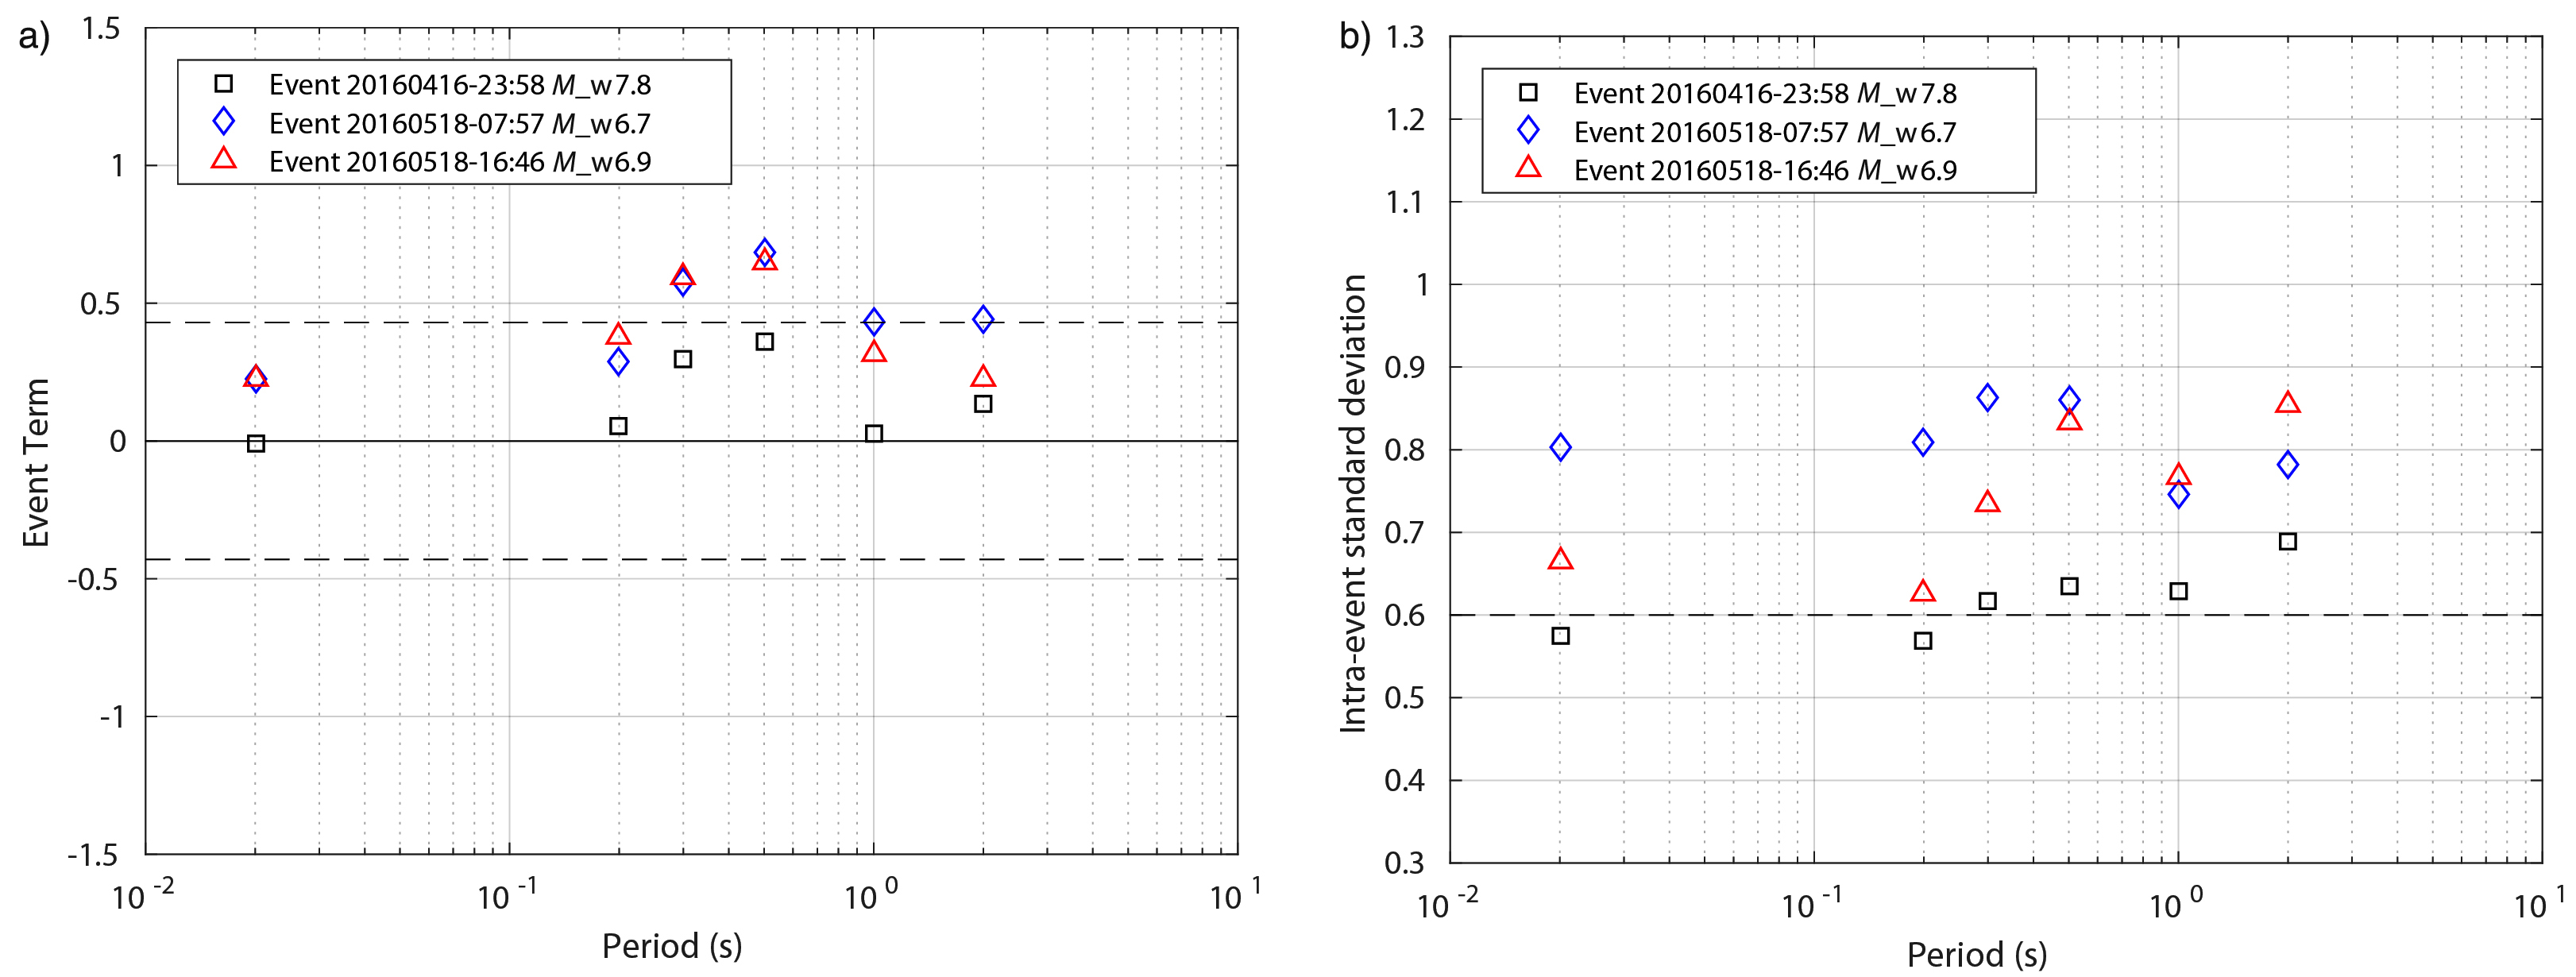
Figure S5. Same as Figure 9 in the main article but taking into account the VS30 values based on topography. (a) Event terms of the Pedernales mainshock and its two largest aftershocks, compared with the Abrahamson et al. (2016) interevent standard deviation τ (0.43); (b) intraevent standard deviation for the Pedernales mainshock and its two largest aftershocks compared with the Abrahamson et al. (2016) intraevent standard deviation ϕ (0.6).
Abrahamson, N., N. Gregor, and K. Addo (2016). BC hydro ground motion prediction equations for subduction earthquakes, Earthq. Spectra 32, no. 1, 23–44.
Ghofrani, H., and G. Atkinson (2014). Ground-motion prediction equations for interface earthquakes of M 7 to M 9 based on empirical data from Japan, Bull. Earthq. Eng. 12, 549–571.
[ Back ]