This electronic supplement contains maps of the Spanish Springs and Sheldon sequences with relocation uncertainty, and tables of velocity models and relocated catalogs for the Spanish Springs and Sheldon sequences.
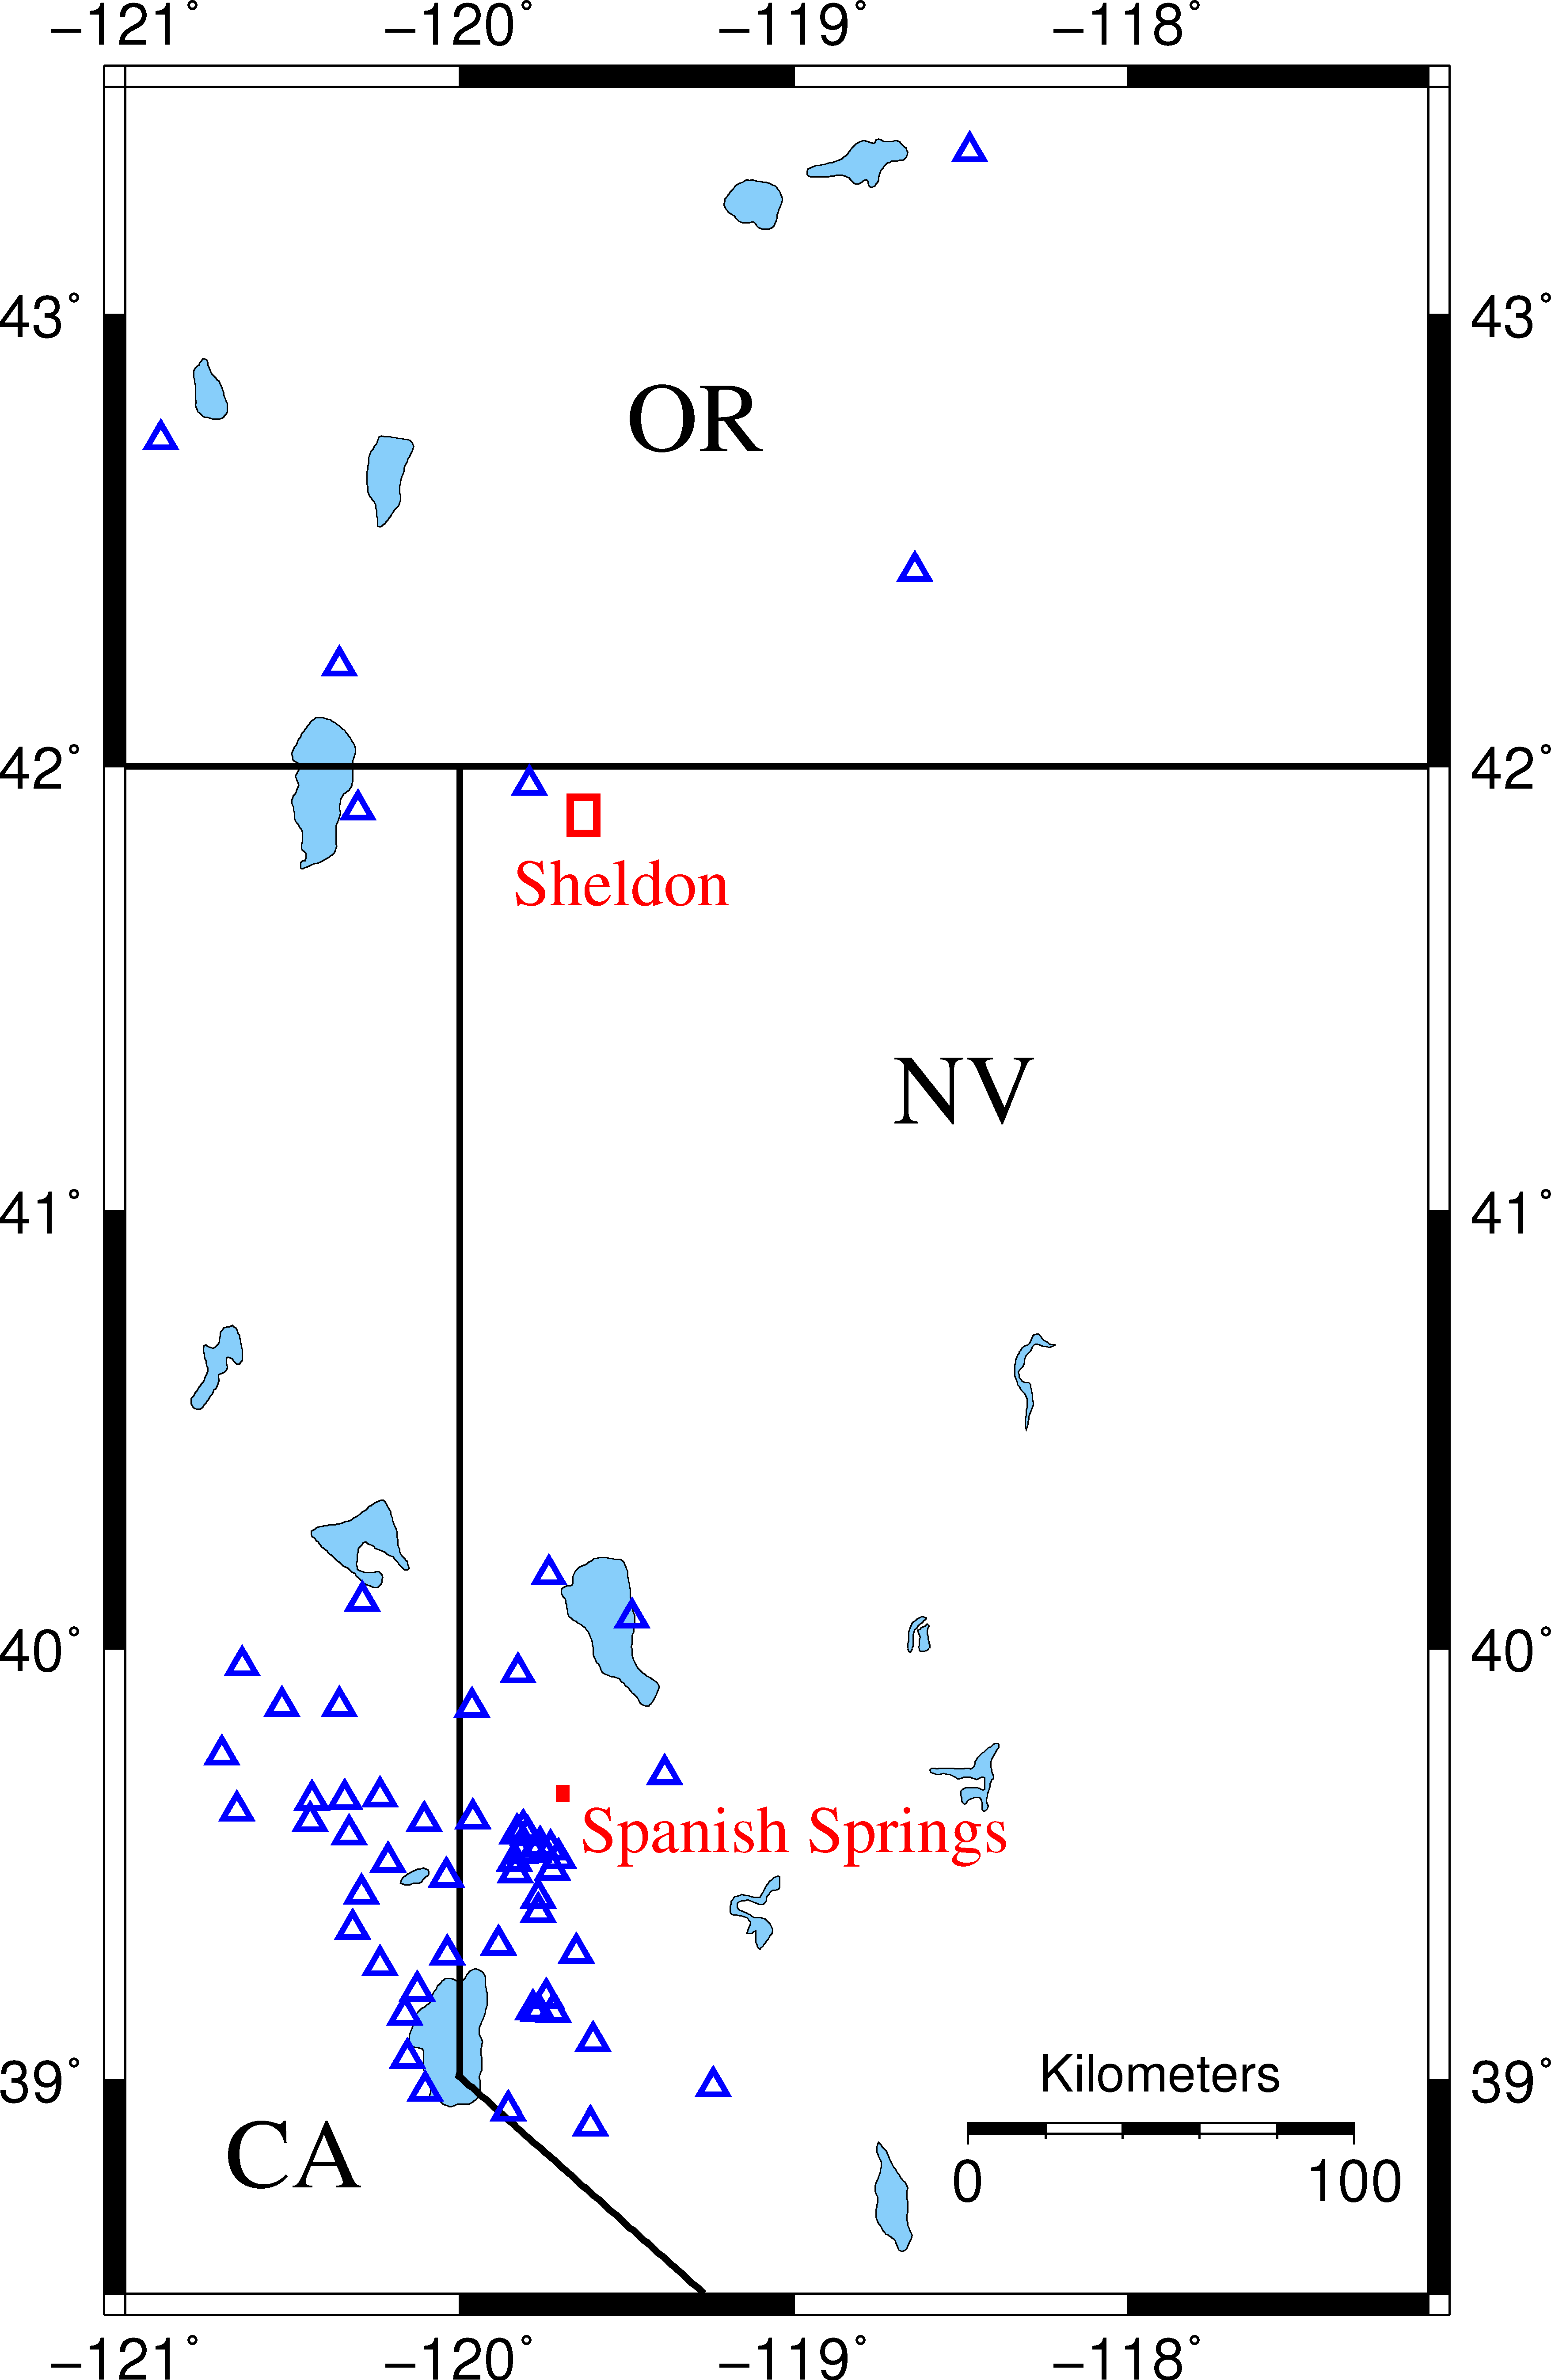
Figure S1 provides an overview map of the western Nevada study region, including the locations of the seismic stations used in this analysis. Figures S2 and S3 show the spatial distribution of relative location uncertainties for the Spanish Springs and Sheldon sequences, obtained through GrowClust’s nonparametric error analysis subroutines described in the main article.
Table S1 lists the velocity model assumed in the relocation results presented in this study. Tables S2 and S3 provide GrowClust-relocated earthquake catalogs for the Spanish Springs and Sheldon earthquake sequences, and these catalogs also contain the initial locations for all events as a point of reference.
Table S1. [space-delimited plain-text table; ~1 KB]. Velocity model used for GrowClust relocations. This table contains the assumed velocity model used for the GrowClust relocations of the Spanish Springs and Sheldon earthquake sequences and is consistent with the regional model used to derive the initial catalog positions for these events. Column 1 lists the depth to the top of each constant velocity layer (km), and column 2 lists the corresponding P-wave velocity for that layer (km/s). The velocity model assumes a layered structure with (VP/VS)2 = 3.
Table S2. [space-delimited plain-text table; ~280 KB]. Relocated catalog for the Spanish Springs sequence. This table contains the GrowClust relocated earthquake catalog for the Spanish Springs earthquake sequence. This file is automatically output file by the GrowClust program with the following standardized format. Each line corresponds to an event, and there 25 columns total:
Note that the catalog includes all events, including those that are not relocated. (These events have column 14 = 1 and columns 20–22 set to an output flag of −1.000.)
Table S3. [space-delimited plain-text table; ~237 KB]. Relocated catalog for the Sheldon sequence. This table contains the GrowClust-relocated earthquake catalog for the Sheldon earthquake sequence (18 November 2014 through 28 August 2016). The file format is identical to that of Table S2.
Figure S1. Regional map for the Spanish Springs and Sheldon sequences. The rectangular study regions for the two sequences are outlined with red rectangles, and the seismic stations associated with the waveform data used in this study are marked with blue triangles.
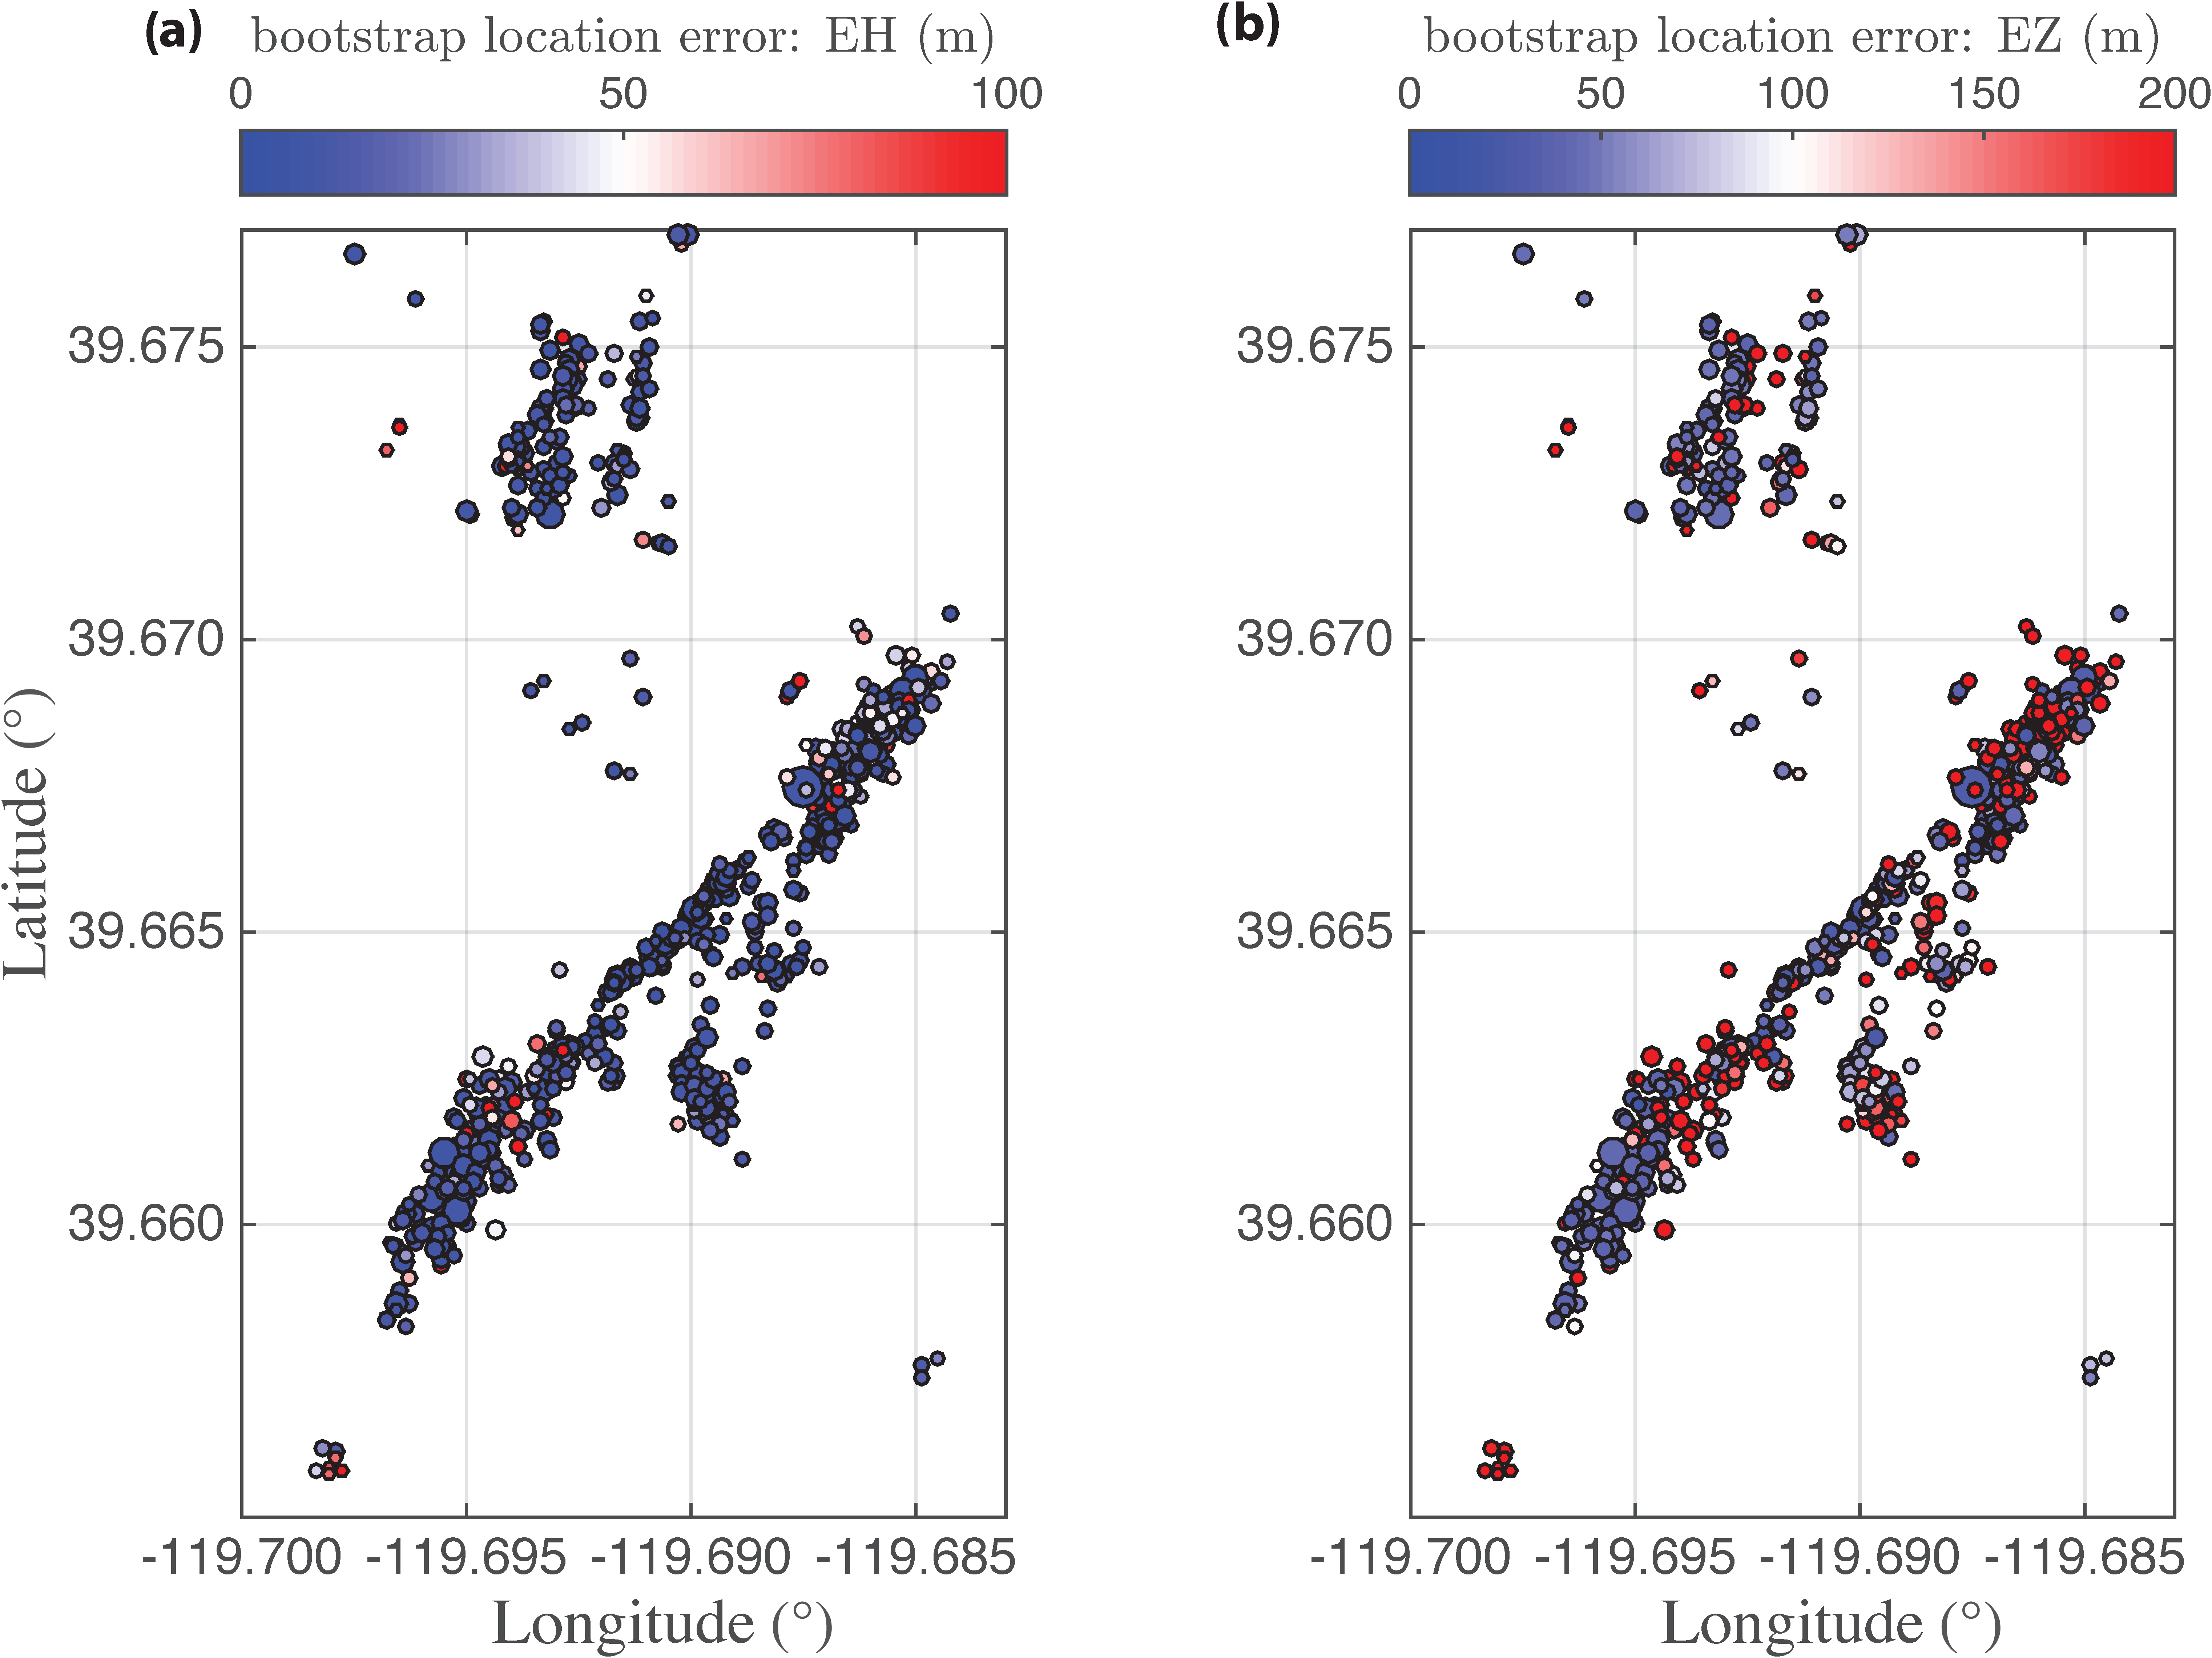
Figure S2. Map view of the Spanish Springs sequence, with events color-coded by (a) horizontal and (b) vertical location error. Uncertainty estimates are obtained via 100 bootstrap resamplings of the input cross-correlation data (see main article for details).
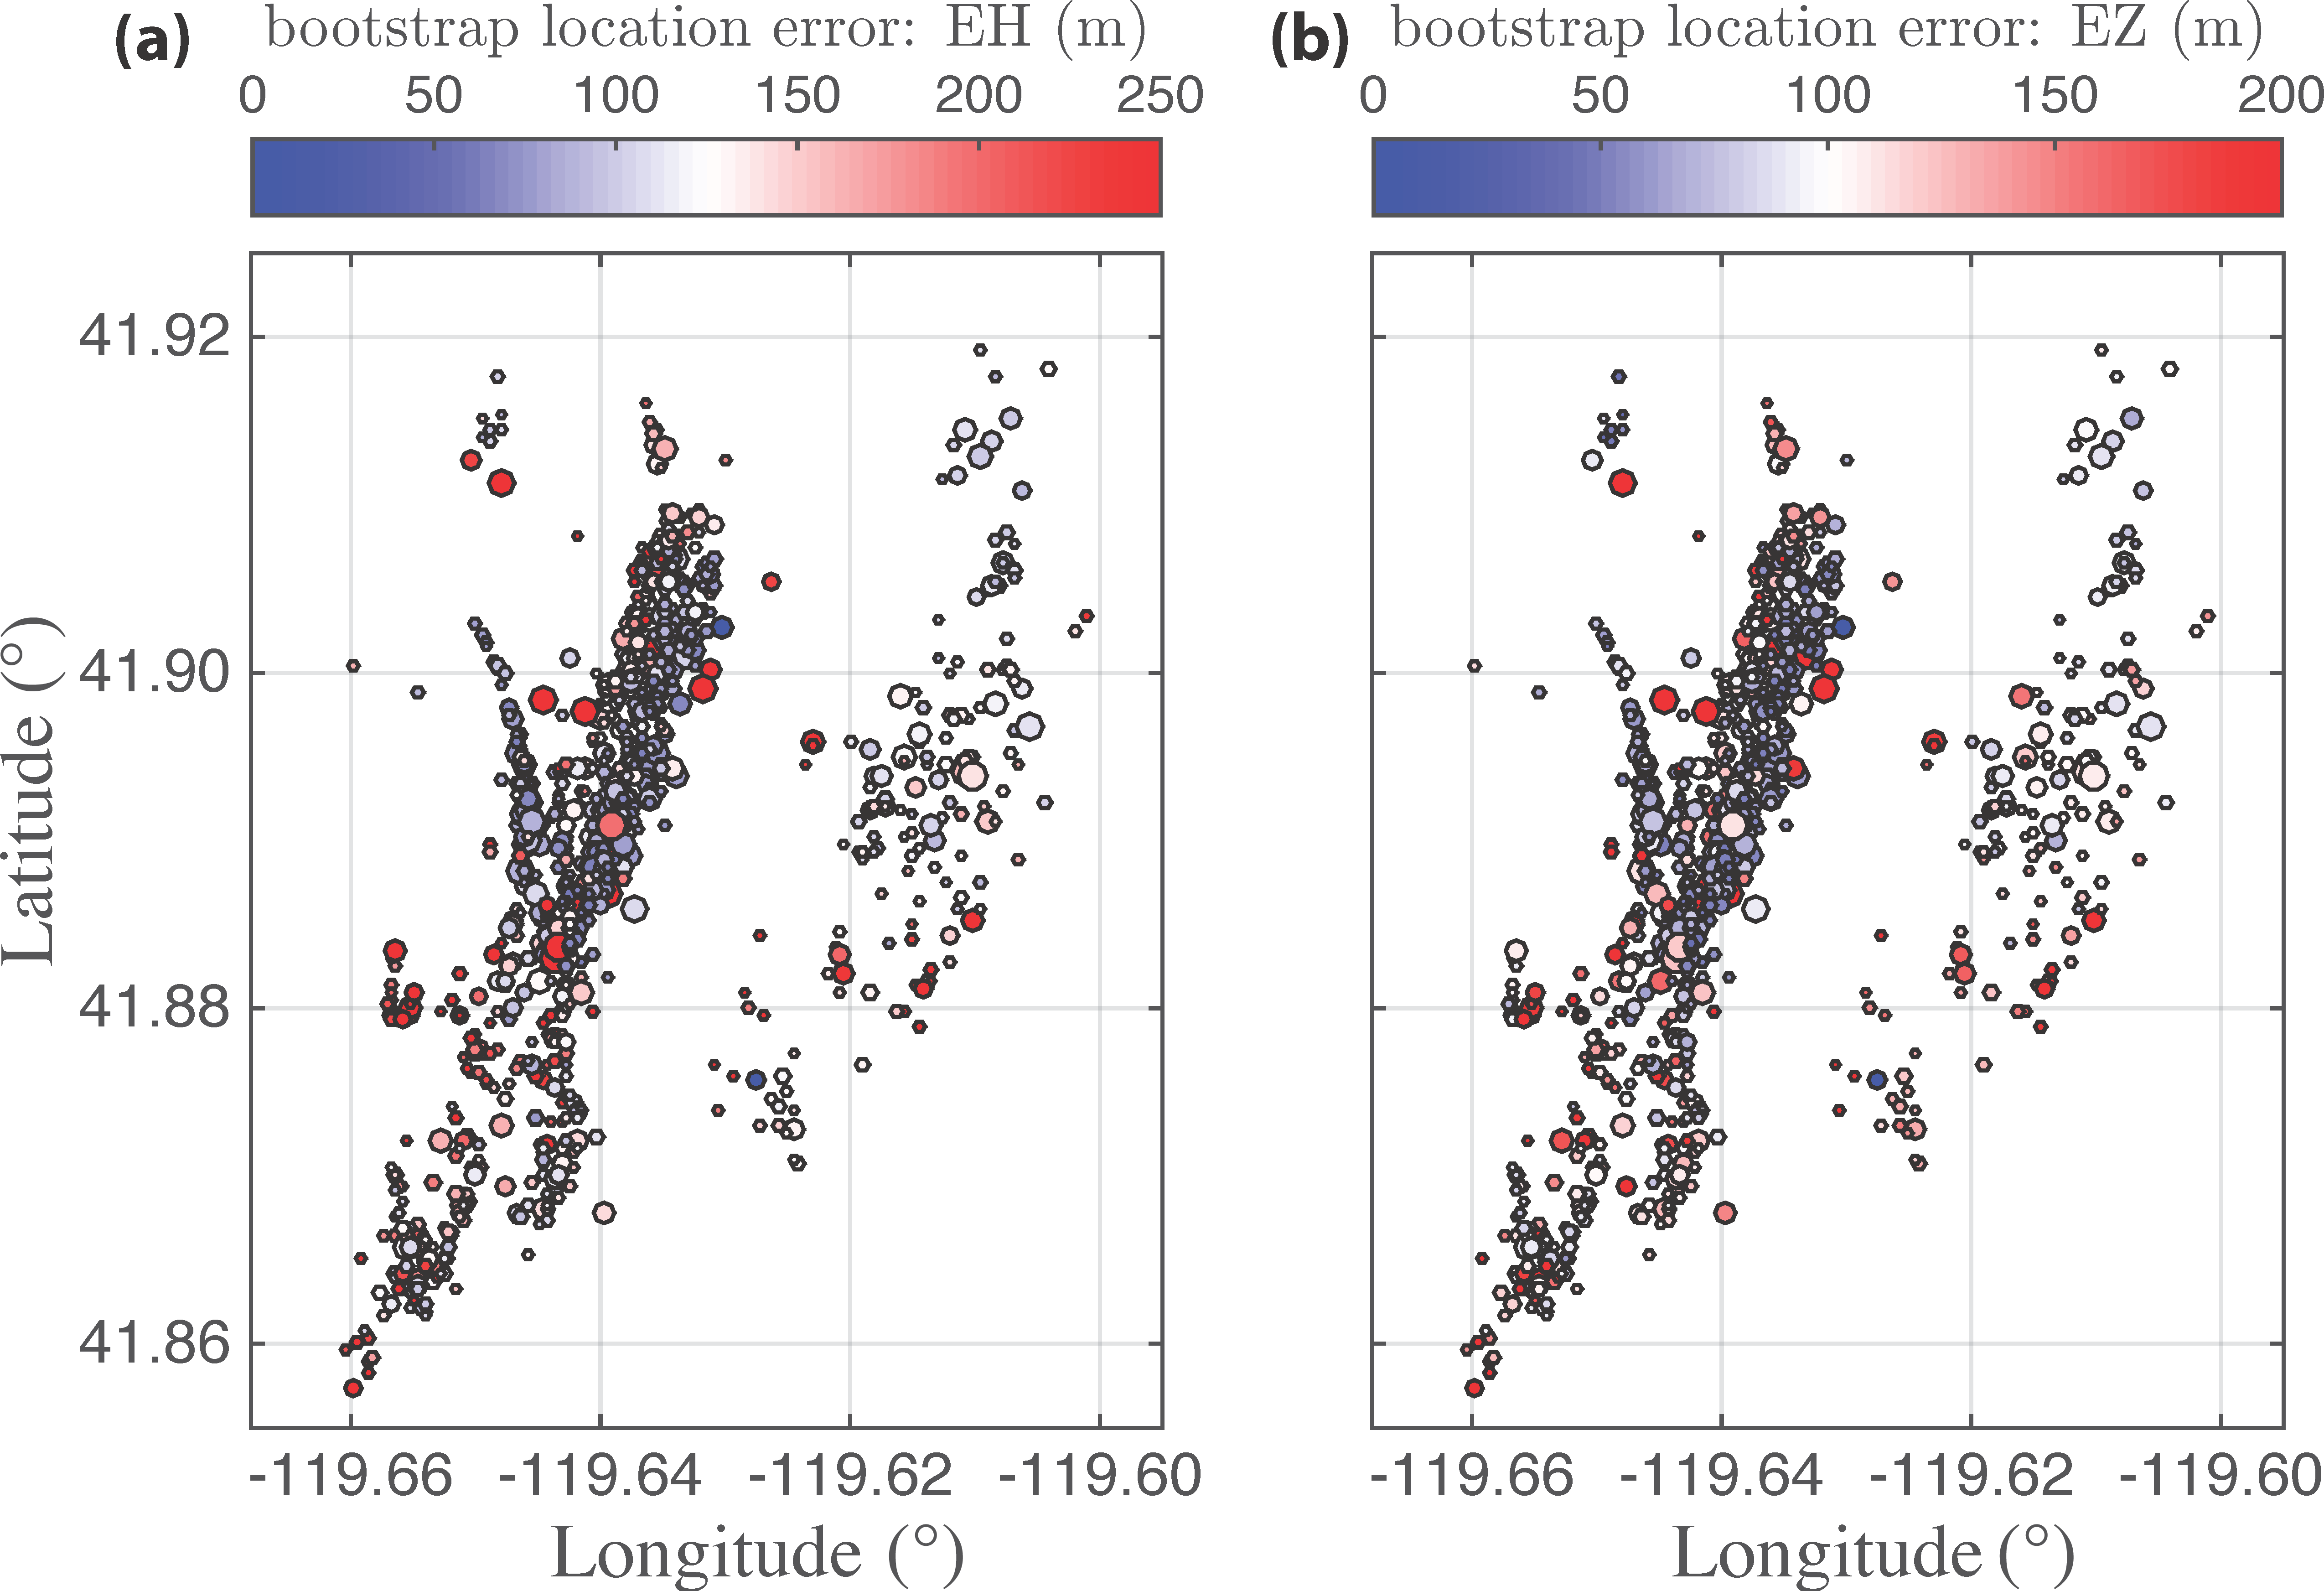
Figure S3. Map view of the Sheldon sequence, with events color-coded by (a) horizontal and (b) vertical location error. Uncertainty estimates are obtained via 100 bootstrap resamplings of the input cross-correlation data (see main article for details).
[ Back ]