This electronic supplement contains tables of modeled fault segment parameters and metadata of the observed ground motions from 162 GeoNet stations, figures showing distribution of mean peak ground acceleration (PGA), spatial variation of ground velocity at strong-motion stations, waveform comparisons, and a movie of wave propagation.
Table S1. Standard rupture format (SRF) parameters for modeled fault segments depicted in Figure 1 in the main article. FAULT NAME, as annotated in Figure 1 in the main article; ELON, ELAT, longitude and latitude of the reference point of the fault (at the top of the fault and halfway along strike); Mw, moment magnitude; L, W, length and width of the fault segment; DTOP, depth of top of fault plane; DIP, STRIKE, dip and strike of fault segment; RAKE, average rake on fault; DHYPO, SHYPO, along-dip and along-strike position of the hypocenter on the fault as measured downward from the fault top and leftward in the direction of the fault strike; TIME DELAY, time delay for initiation of hypocenter on each fault segment.
Table S2. Metadata of the observed ground motions from 162 GeoNet stations. STATION, GeoNet station code; VS30, time-averaged 30 m shear-wave velocity; Rrup, RJB, nearest and Joyner–Boore source-to-site distances; PGA, PGV, Ds595, geometric mean peak ground acceleration, peak ground velocity, and 5%–95% significant duration.
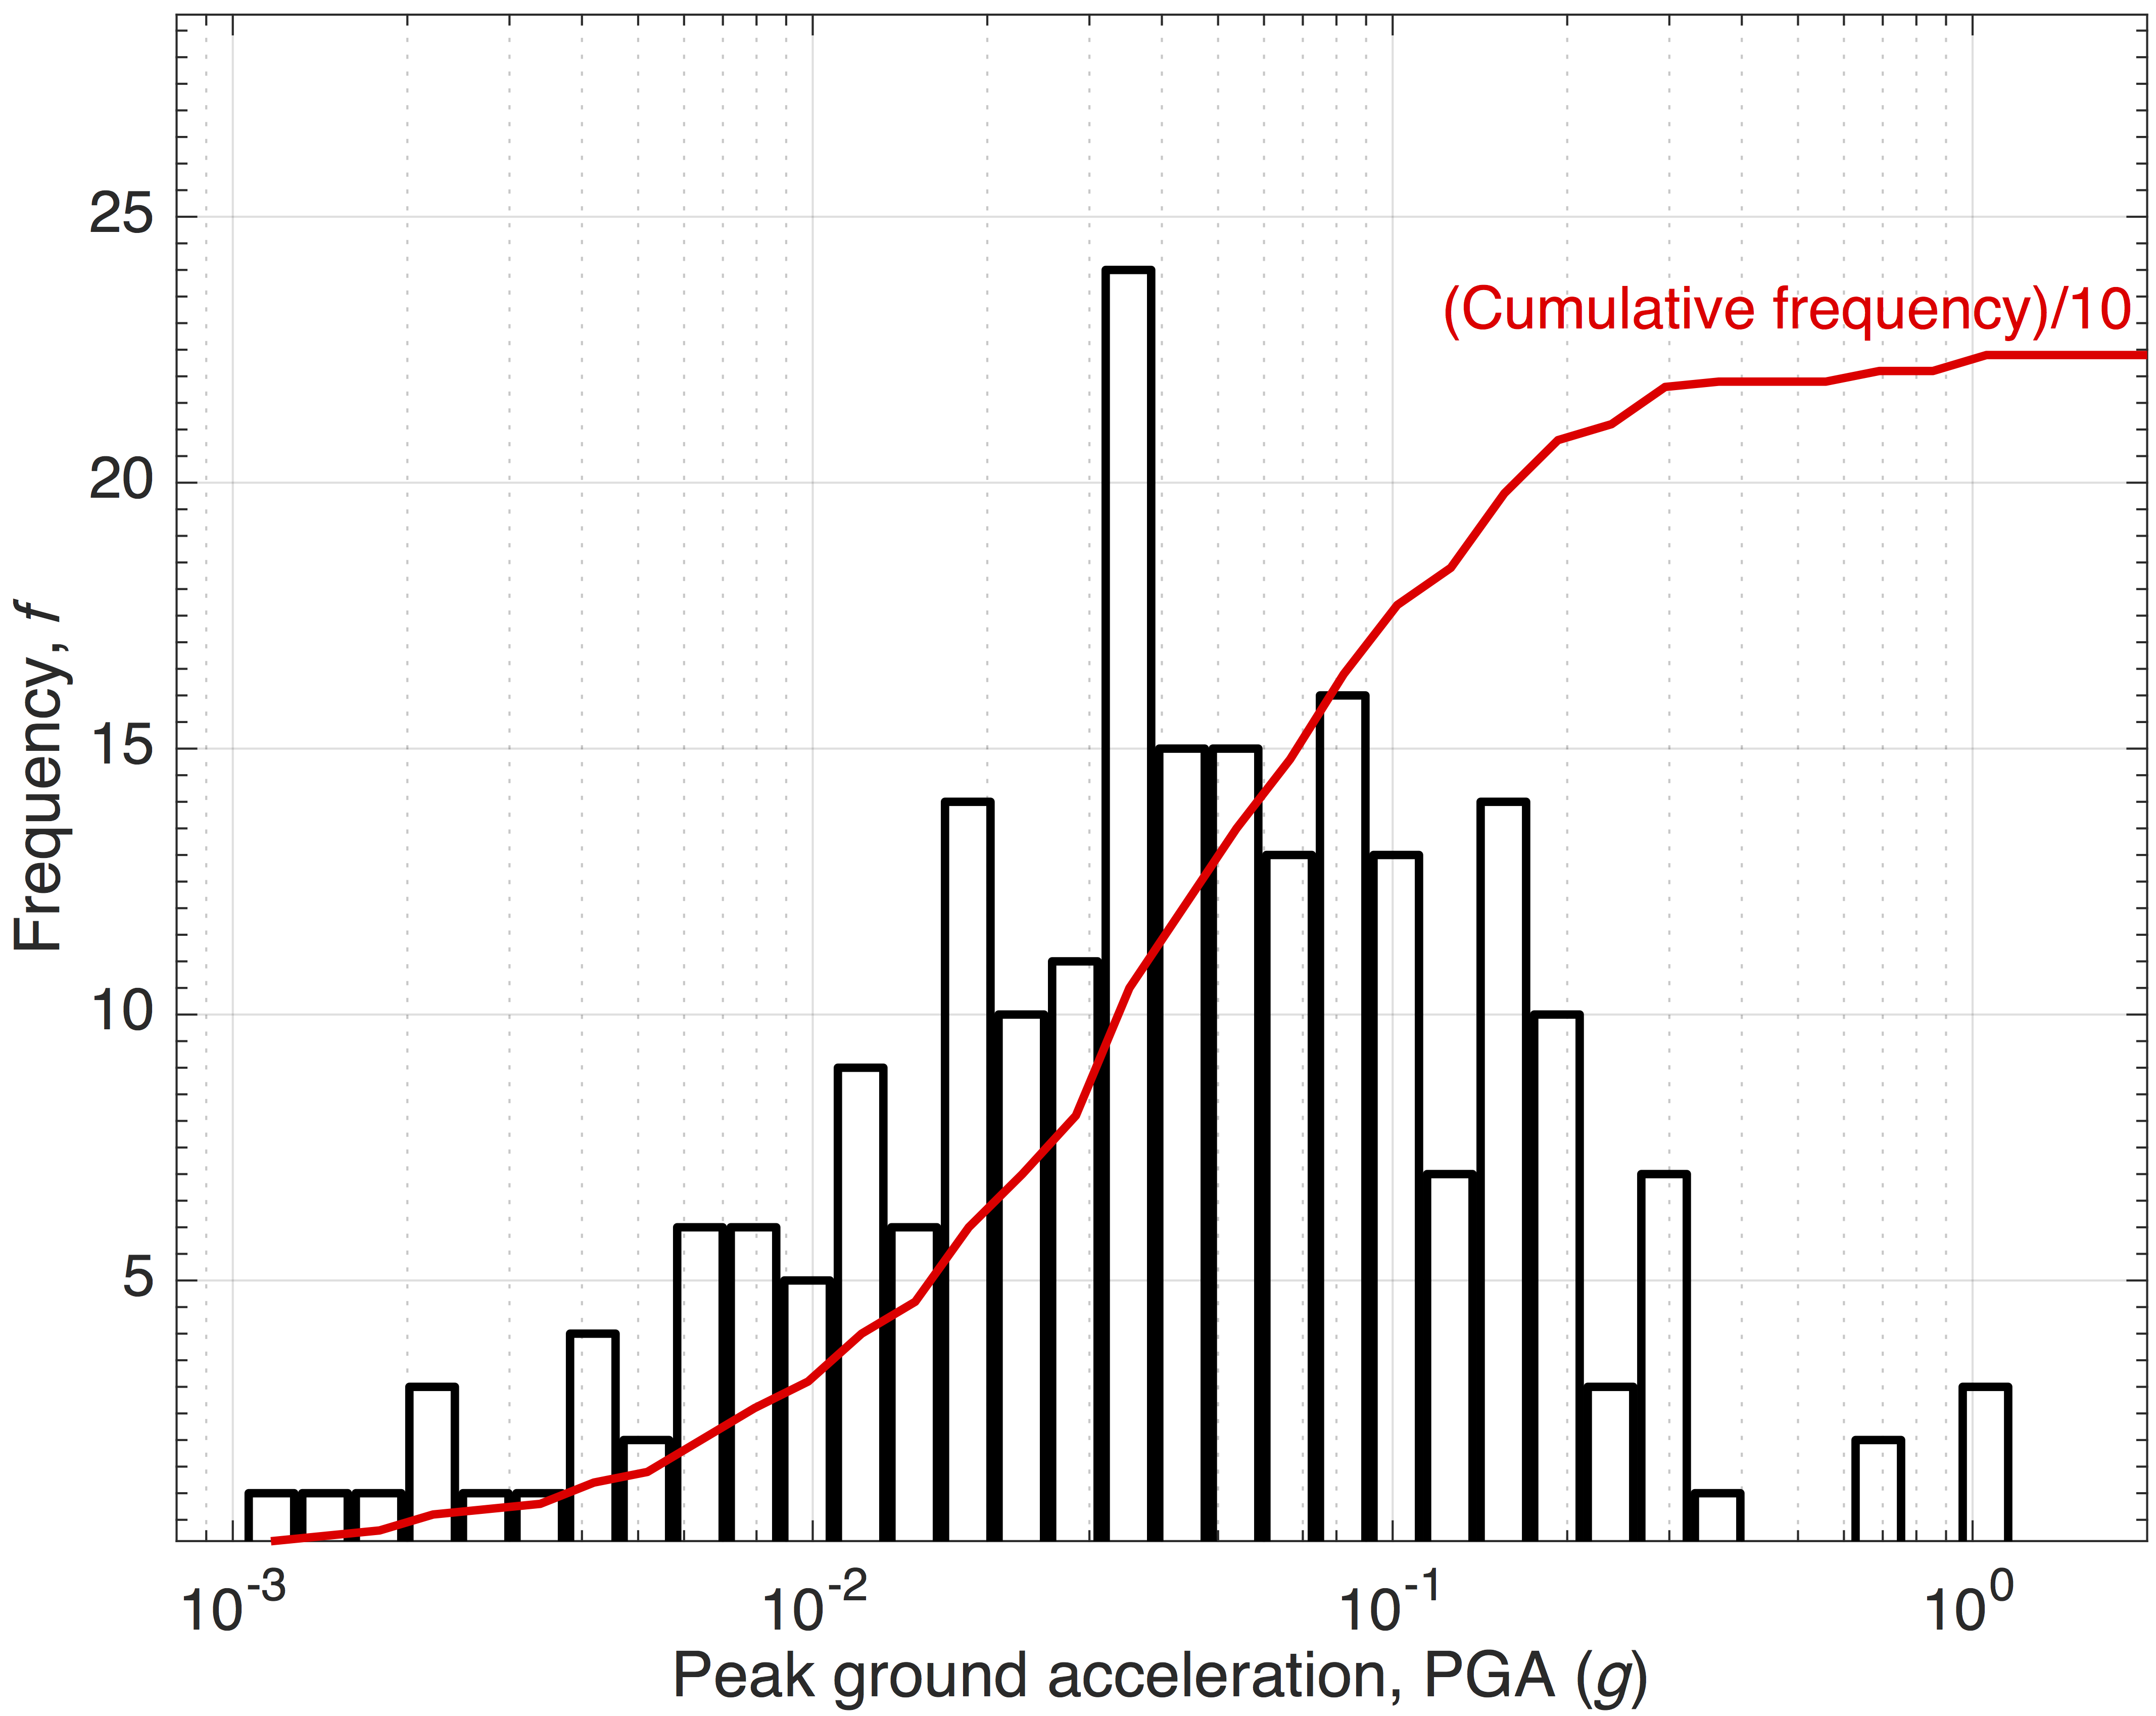
Figure S1. Distribution of geometric mean horizontal PGA recorded by strong-motion stations.
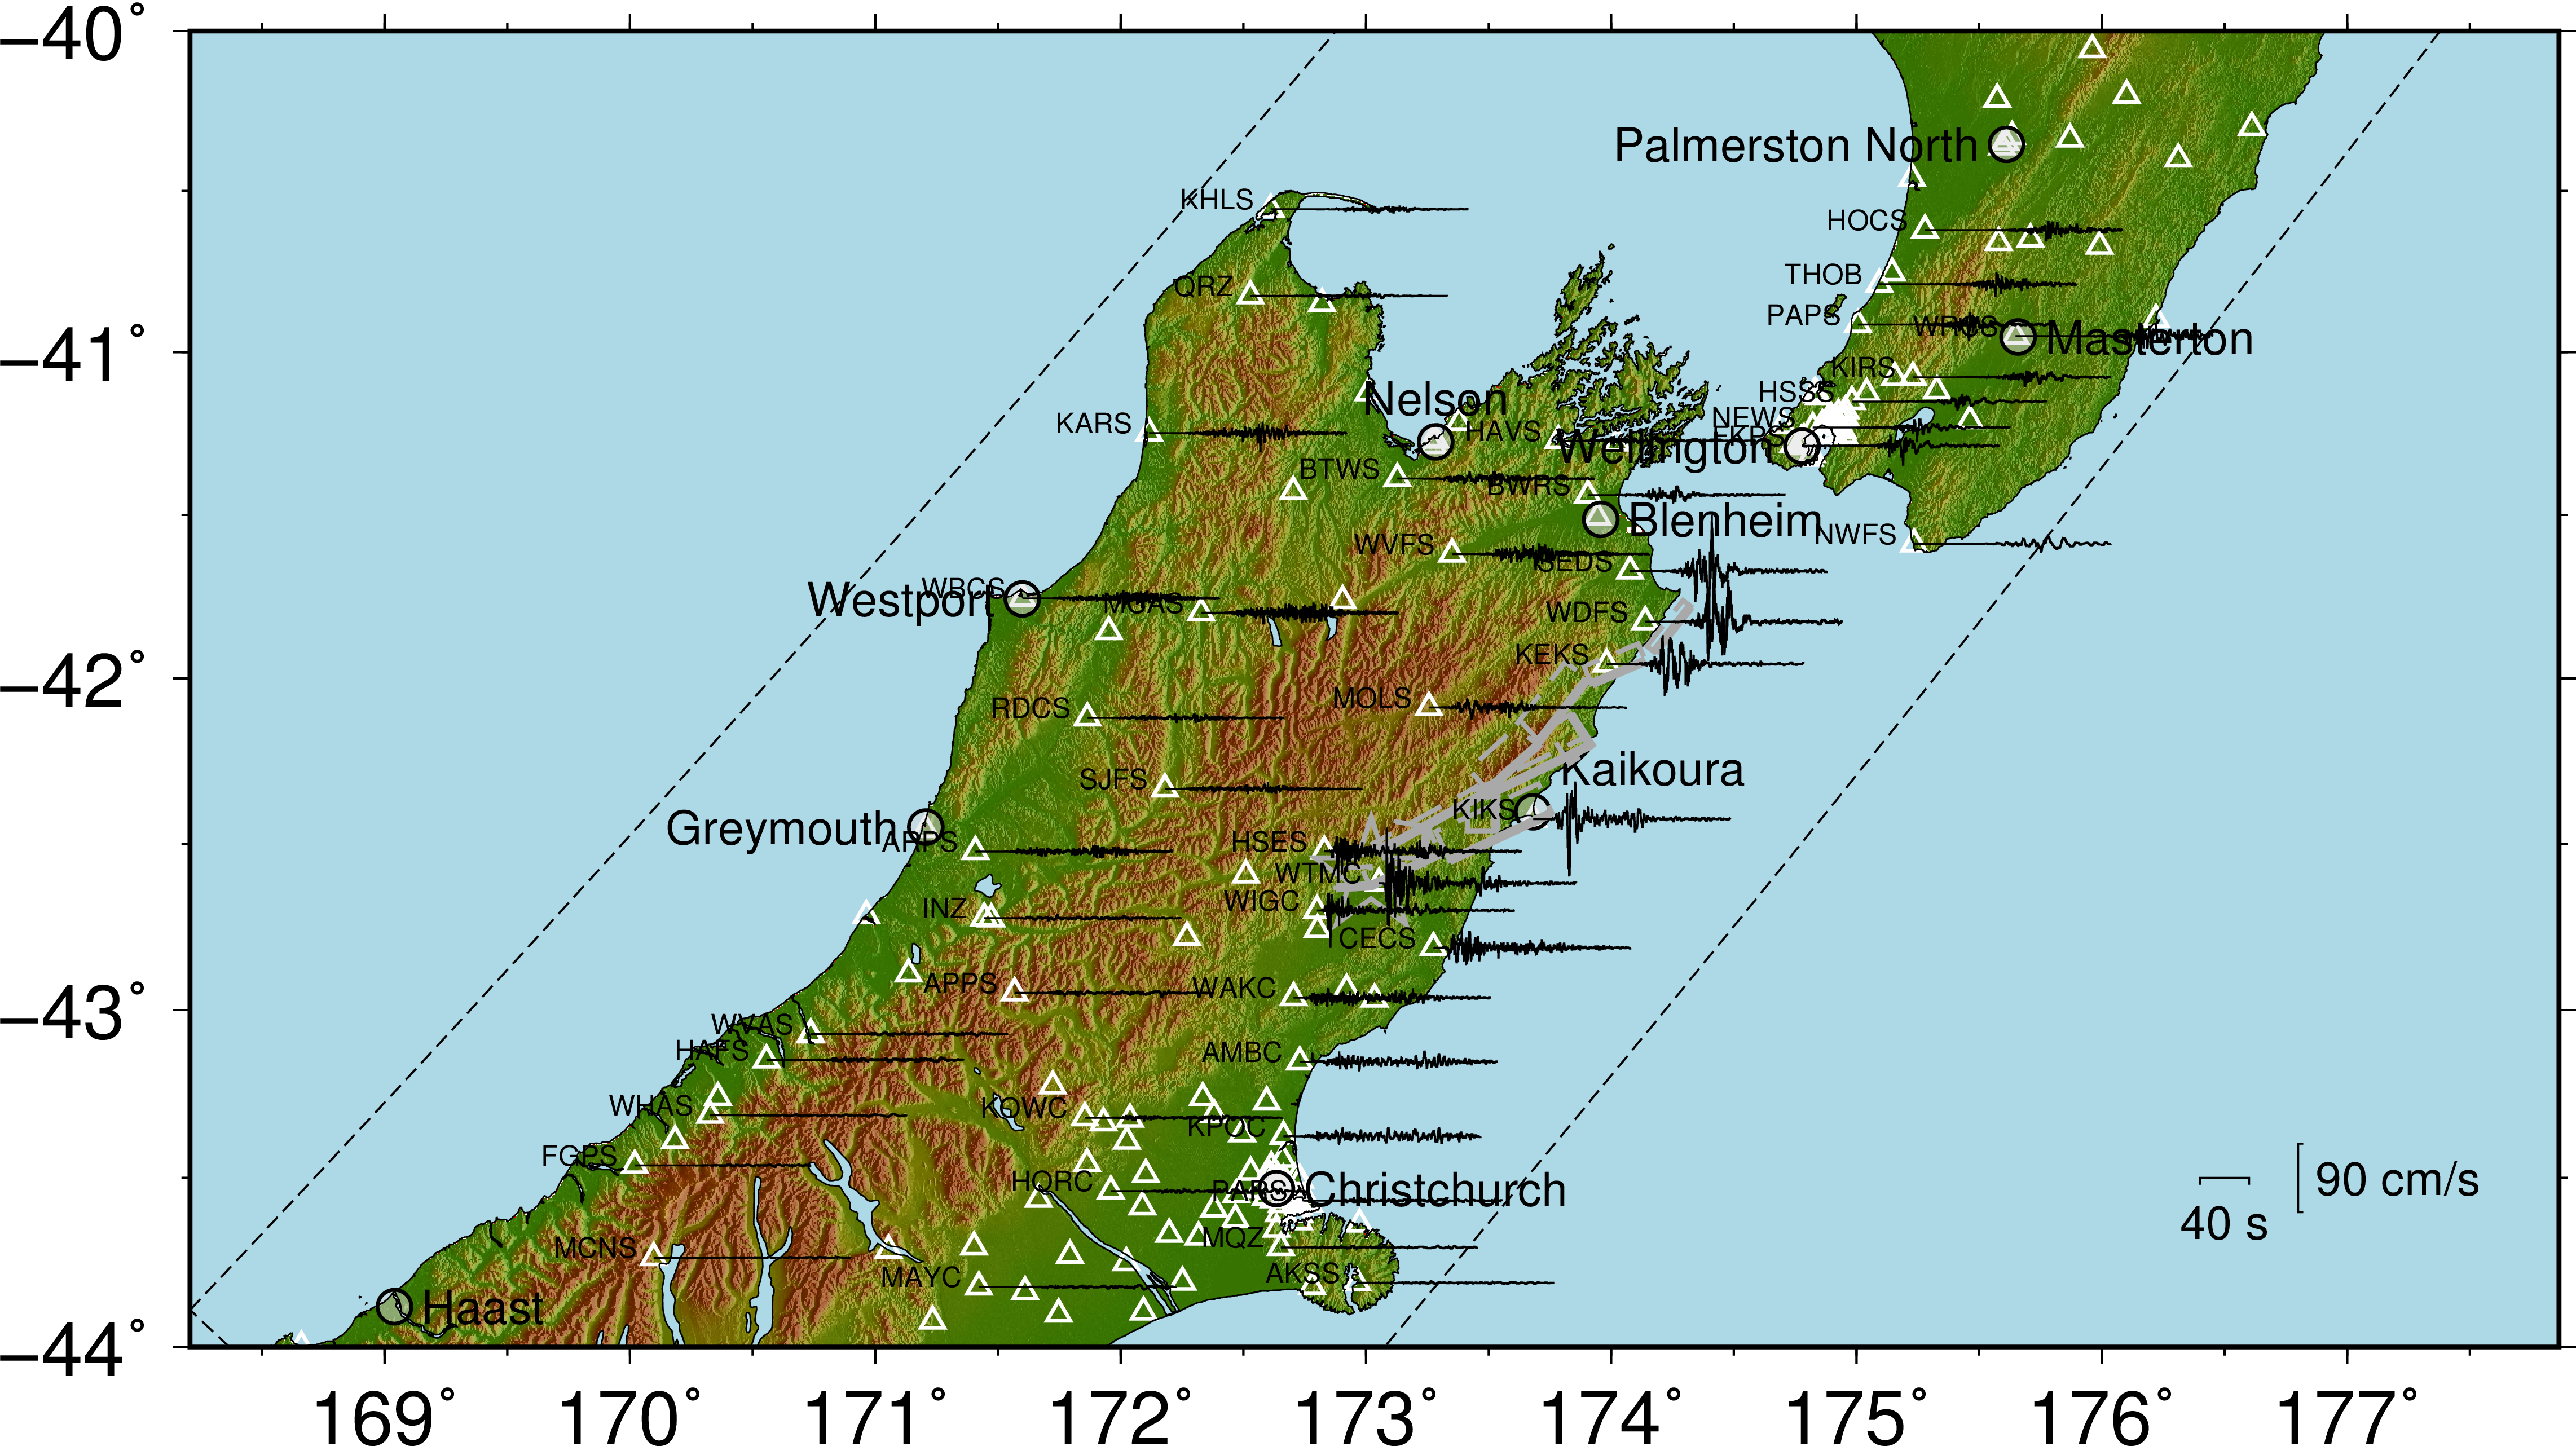
Figure S2. Spatial illustration of the variation in observed ground-motion velocities at selected strong-motion stations for (a) north–south (000), (b) east–west (090), and (c) vertical components.
Figure S3 [PDF; 33 pgs.; ~5.6 MB]. Comparison of observed and simulated velocity time series at 162 strong-motion stations in the simulation domain. Observed and simulated waveforms are shown in black and red, respectively, with the displayed amplitude normalized to the maximum observed value, which is provided at the right of each waveform. The three columns represent the 000 (north–south), 090 (east–west), and vertical components.
Movie S1 [h.264-encoded MPEG4 movie; ~14.5 MB]. Numerically simulated horizontal velocity (vector maximum of two components) at the ground surface as a function of time.
[ Back ]