This electronic supplement contains figures of user access statistics and source time functions (STFs; Figs. S1 and S2).
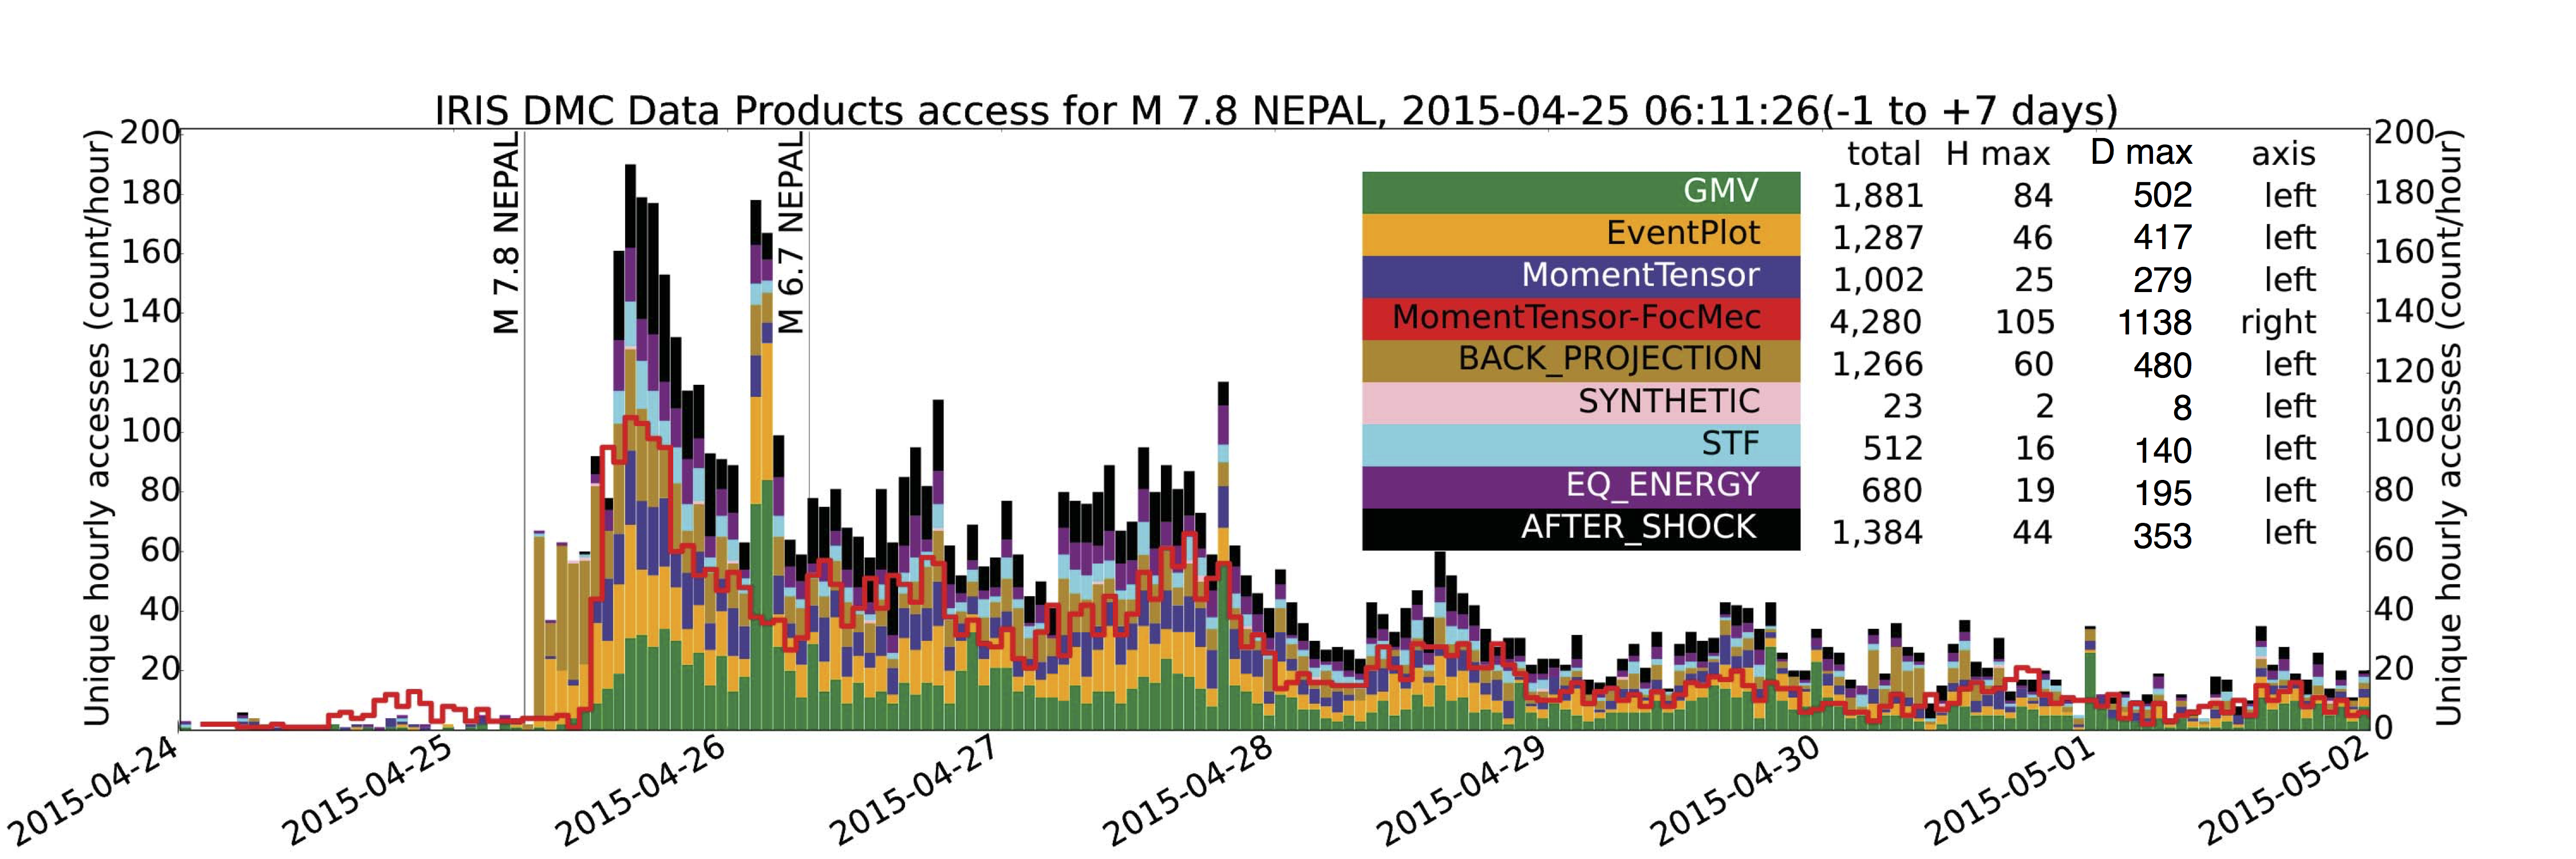
Figure S1 shows the typical pattern of user access to Incorporated Research Institutions for Seismology (IRIS)-hosted data products following a significant earthquake. The sharp increase in user inquiries and downloads of these event-based products after significant earthquakes and nuclear tests highlight their utilization by the research community. The relative proportion between downloaded products varies somewhat between events and is attributed to differences in event characteristics drawing attention to different products that highlight those characteristics.
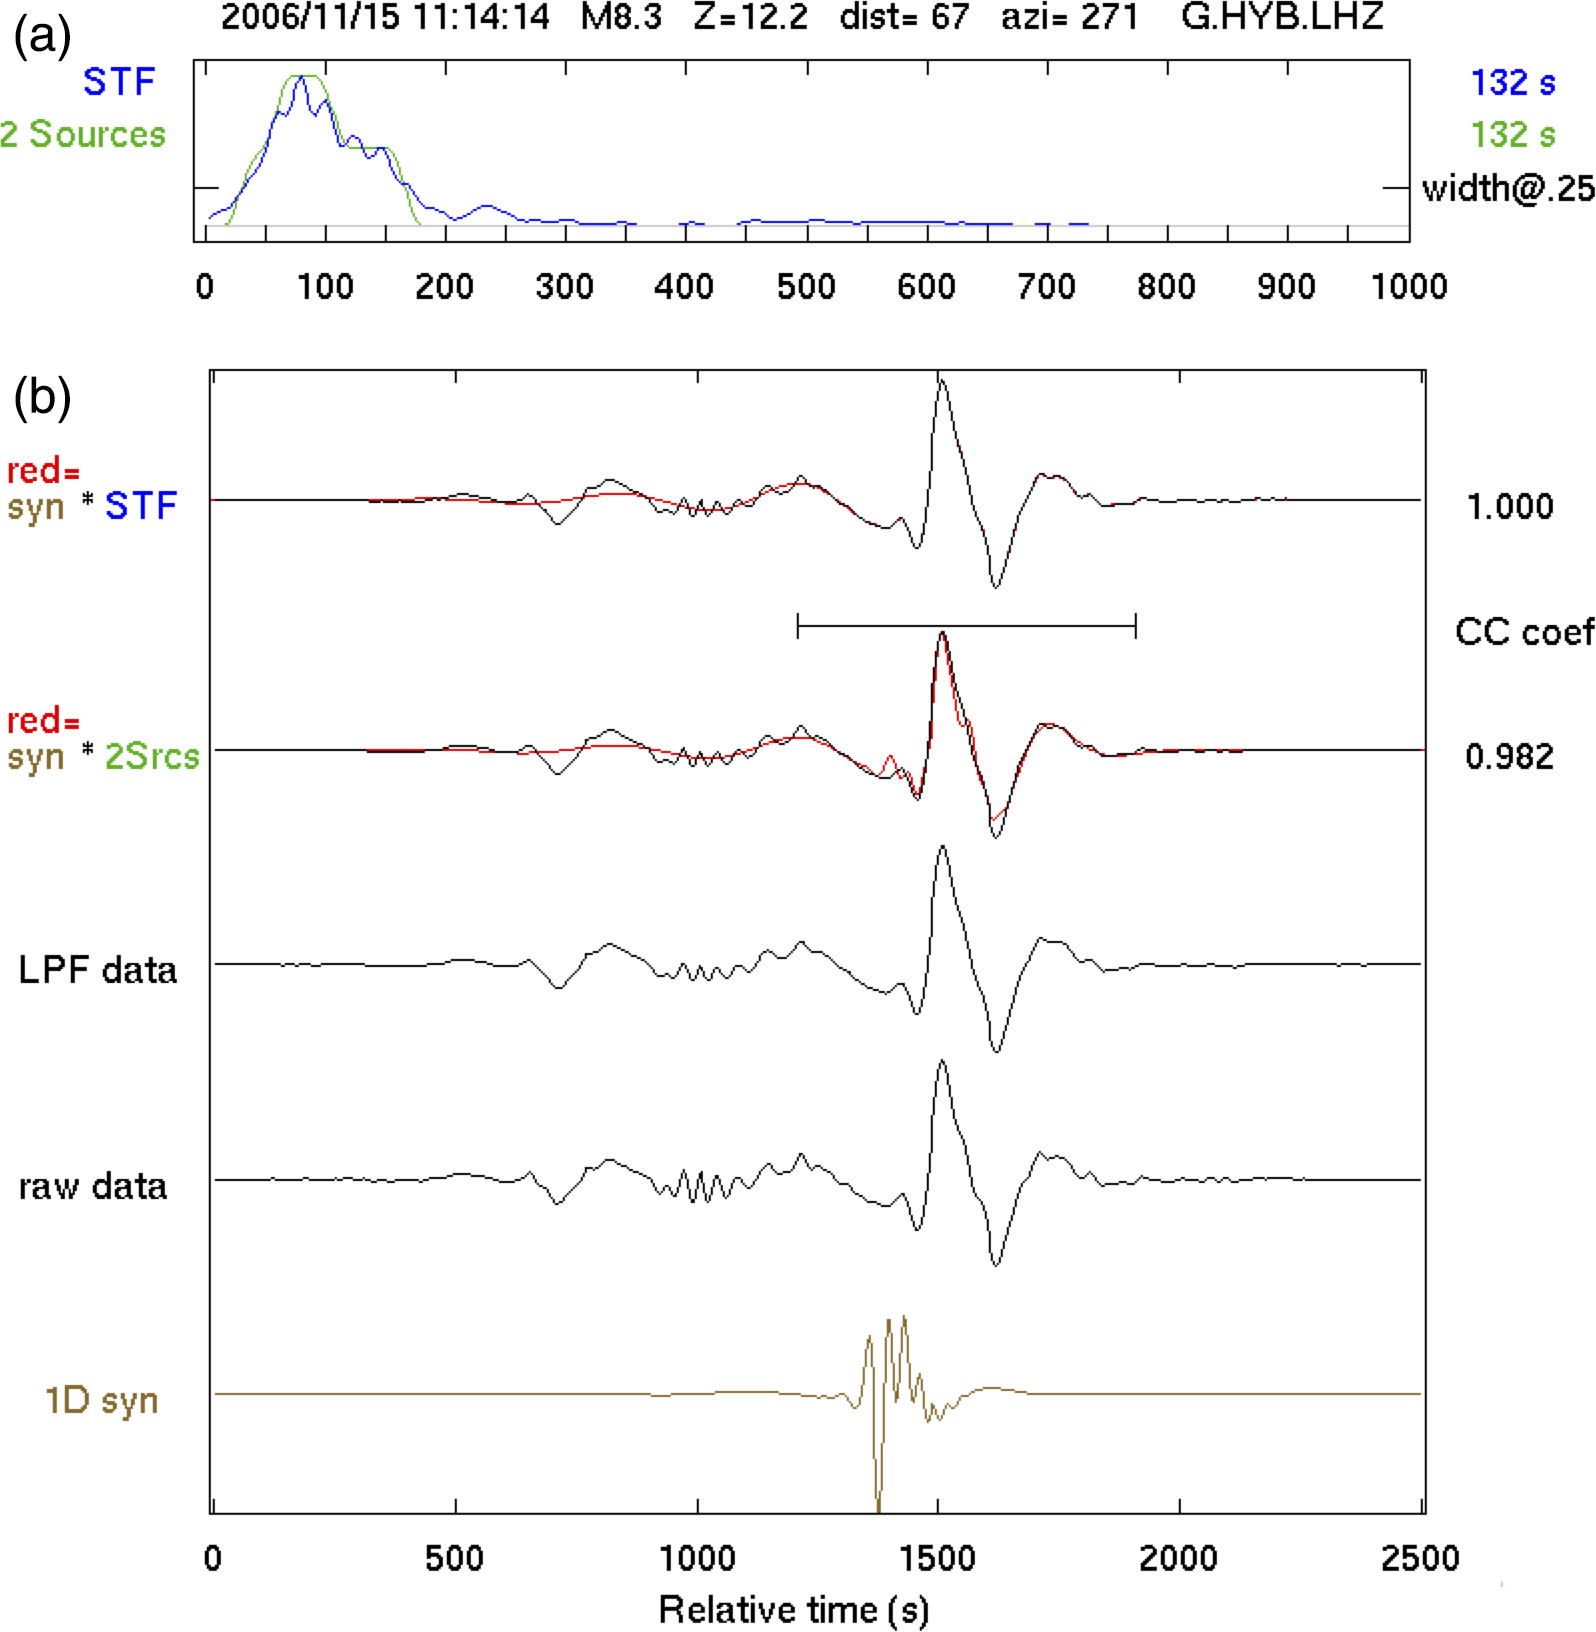
Figure S2 is an example of one of many individual station-level figures in the zip attachment available for each STF solution in our data product repository. To generate a synthetic seismogram suitable for comparison with data from large earthquakes, an STF must be convolved with the point-source synthetic seismogram. This figure illustrates a best-fitting two-source STF found by sweeping through all combinations of a variable-width triangle(s) and/or trapezoid(s) with variable relative offset and amplitudes.
Figure S1. User access statistics following the M 7.8 Nepal earthquake of 25 April 2015 and the 26 April 2015 M 6.7 aftershock show a sharp increase in user inquiry. The number of unique daily visitors, measured independently from hourly, spiked up to 502 for ground-motion visualizations (GMVs), 417 for event plots, 480 for backprojections, and 353 for aftershocks.
Figure S2. (a) The STF from the time-domain deconvolution is in blue, whereas the best-fitting simple two-source solution is in green. The widths (duration) of the functions at 25% of peak amplitude are given on the right. (b) The traces shown, bottom to top, are the preprocessed (R1 windowed, filtered, response corrected, and tapered) synthetic, raw data, the low-pass filtered data used in the comparisons; the top two traces show the data (black) overlain with either the synthetic trace (red) that has been convolved with the best-fitting two-source STF (lower) or the STF from the iterative deconvolution (top).
[ Back ]