This electronic supplement includes three figures (Figs. S1–S3) that describe the frequency–magnitude plot and plot of cumulative earthquakes and cumulative seismic moment for matched-filter earthquake catalogs, and a text file with the matched-filter catalog.
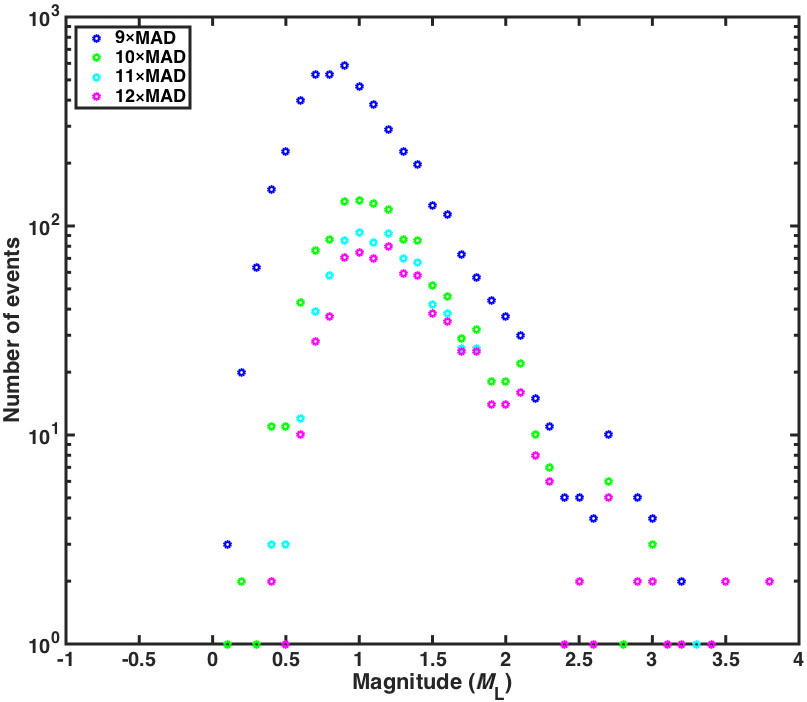
Figure S1. Frequency–magnitude distribution for matched-filter earthquake catalogs limited spatially by the zone shown in Figure 4 of the main article, including the foreshock and aftershock periods (mainshock event has been removed) with various median absolute deviation (MAD) thresholds.
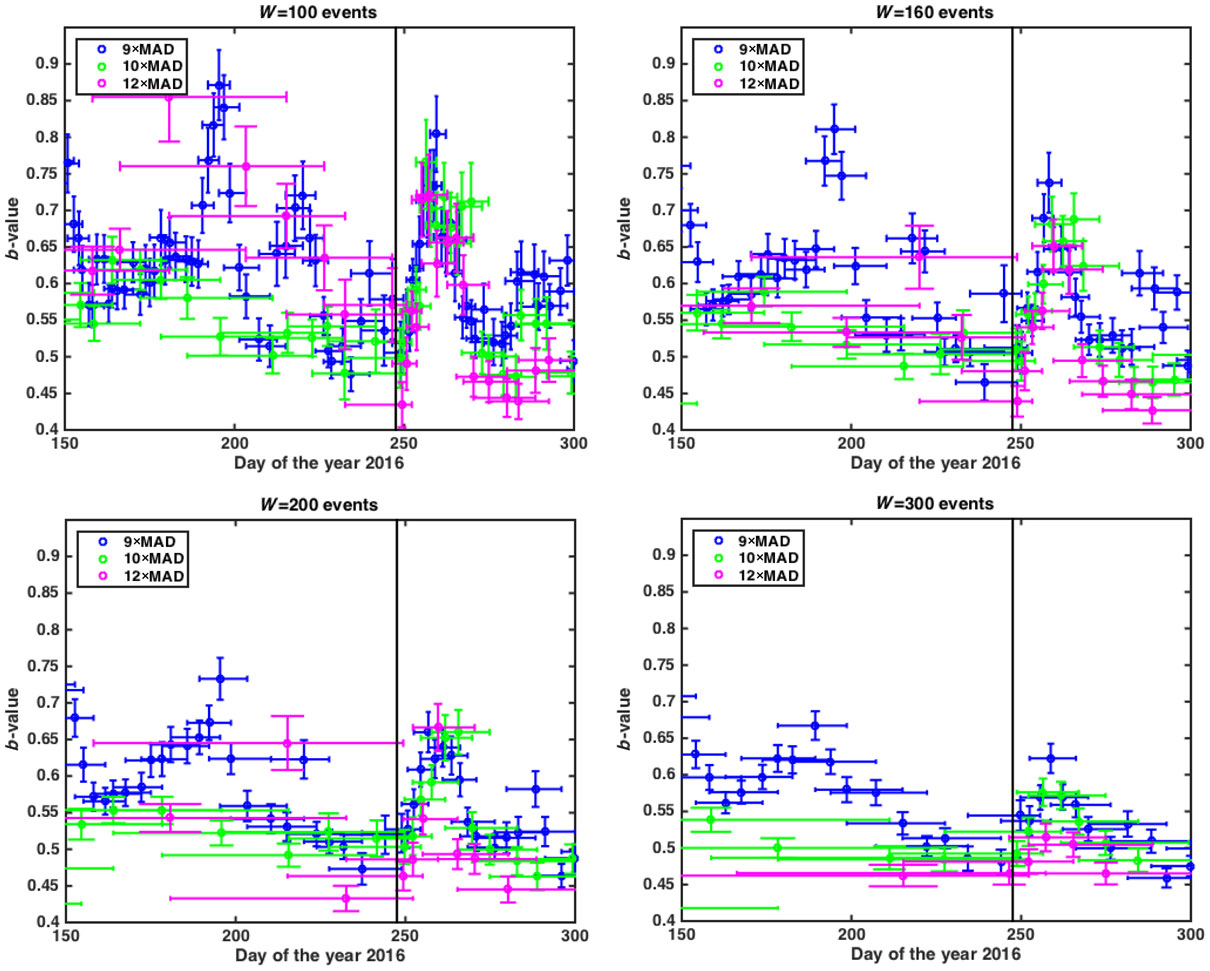
Figure S2. Same as Figure 4 in the main article, b-value plots for MAD thresholds, though with various different window sizes. Vertical error bars indicate standard error of the maximum-likelihood estimates, and horizontal error bars are the beginning and end of windows containing 120 events. The center of the window is plotted at the time corresponding to the timing of the center of the time window. The black vertical line is the timing of the Pawnee mainshock.
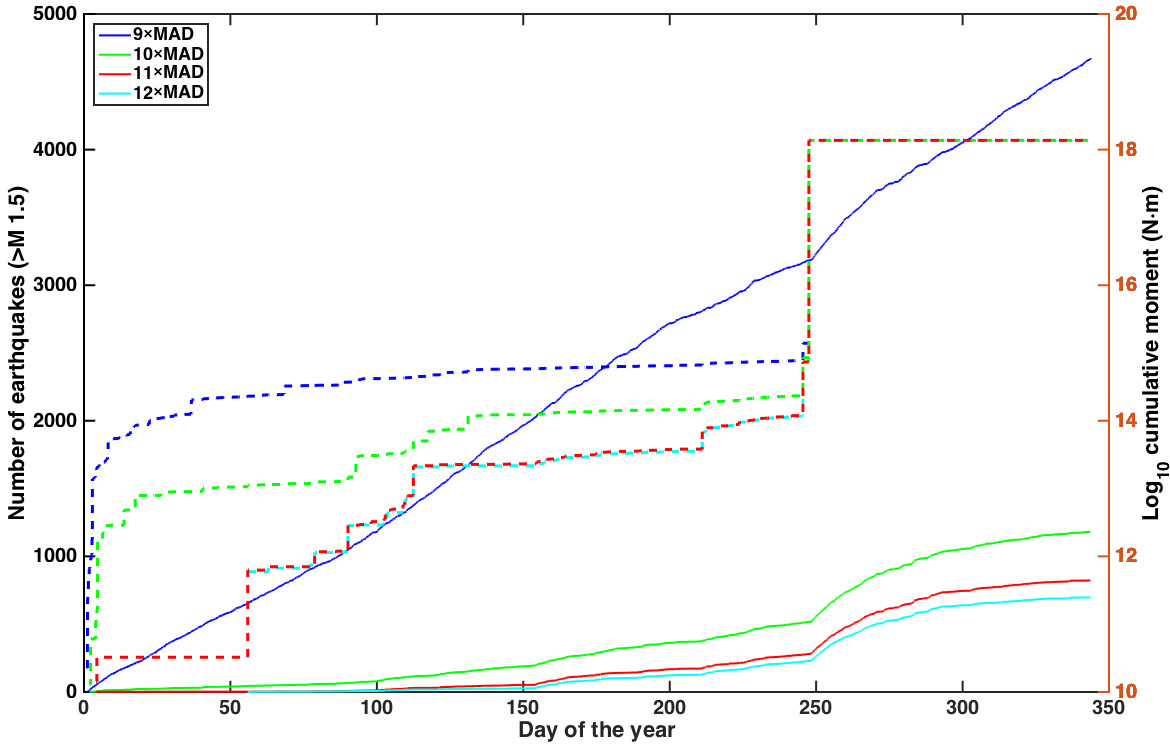
Figure S3. Cumulative earthquakes (solid lines) and cumulative seismic moment (dashed lines) for matched-filter earthquake catalogs limited spatially by the zone shown in Figure 4 of the main article, with various MAD thresholds.
Download: matched_filter_cat_pawnee [plain text, tab-delimited values; ~747 KB]. This file consists of a text file with columns corresponding to: day_of_the_year, cross_correlation_value, median_absolute_deviation, magnitude, latitude (decimal degree), longitude (decimal degree), event_id, year, month, day, hour, min, sec, depth (km), number_of_stations, decimal_year.
[ Back ]