Below, we include three figures that include co-seismic and post-seismic wrapped, unwrapped, and resampled interferograms used in our study. We also present a table of geometrical details for each fault used in our modeling (Figure 4). Lastly, we include two text files containing the resampled InSAR data and horizontal offsets derived from the optical imagery.
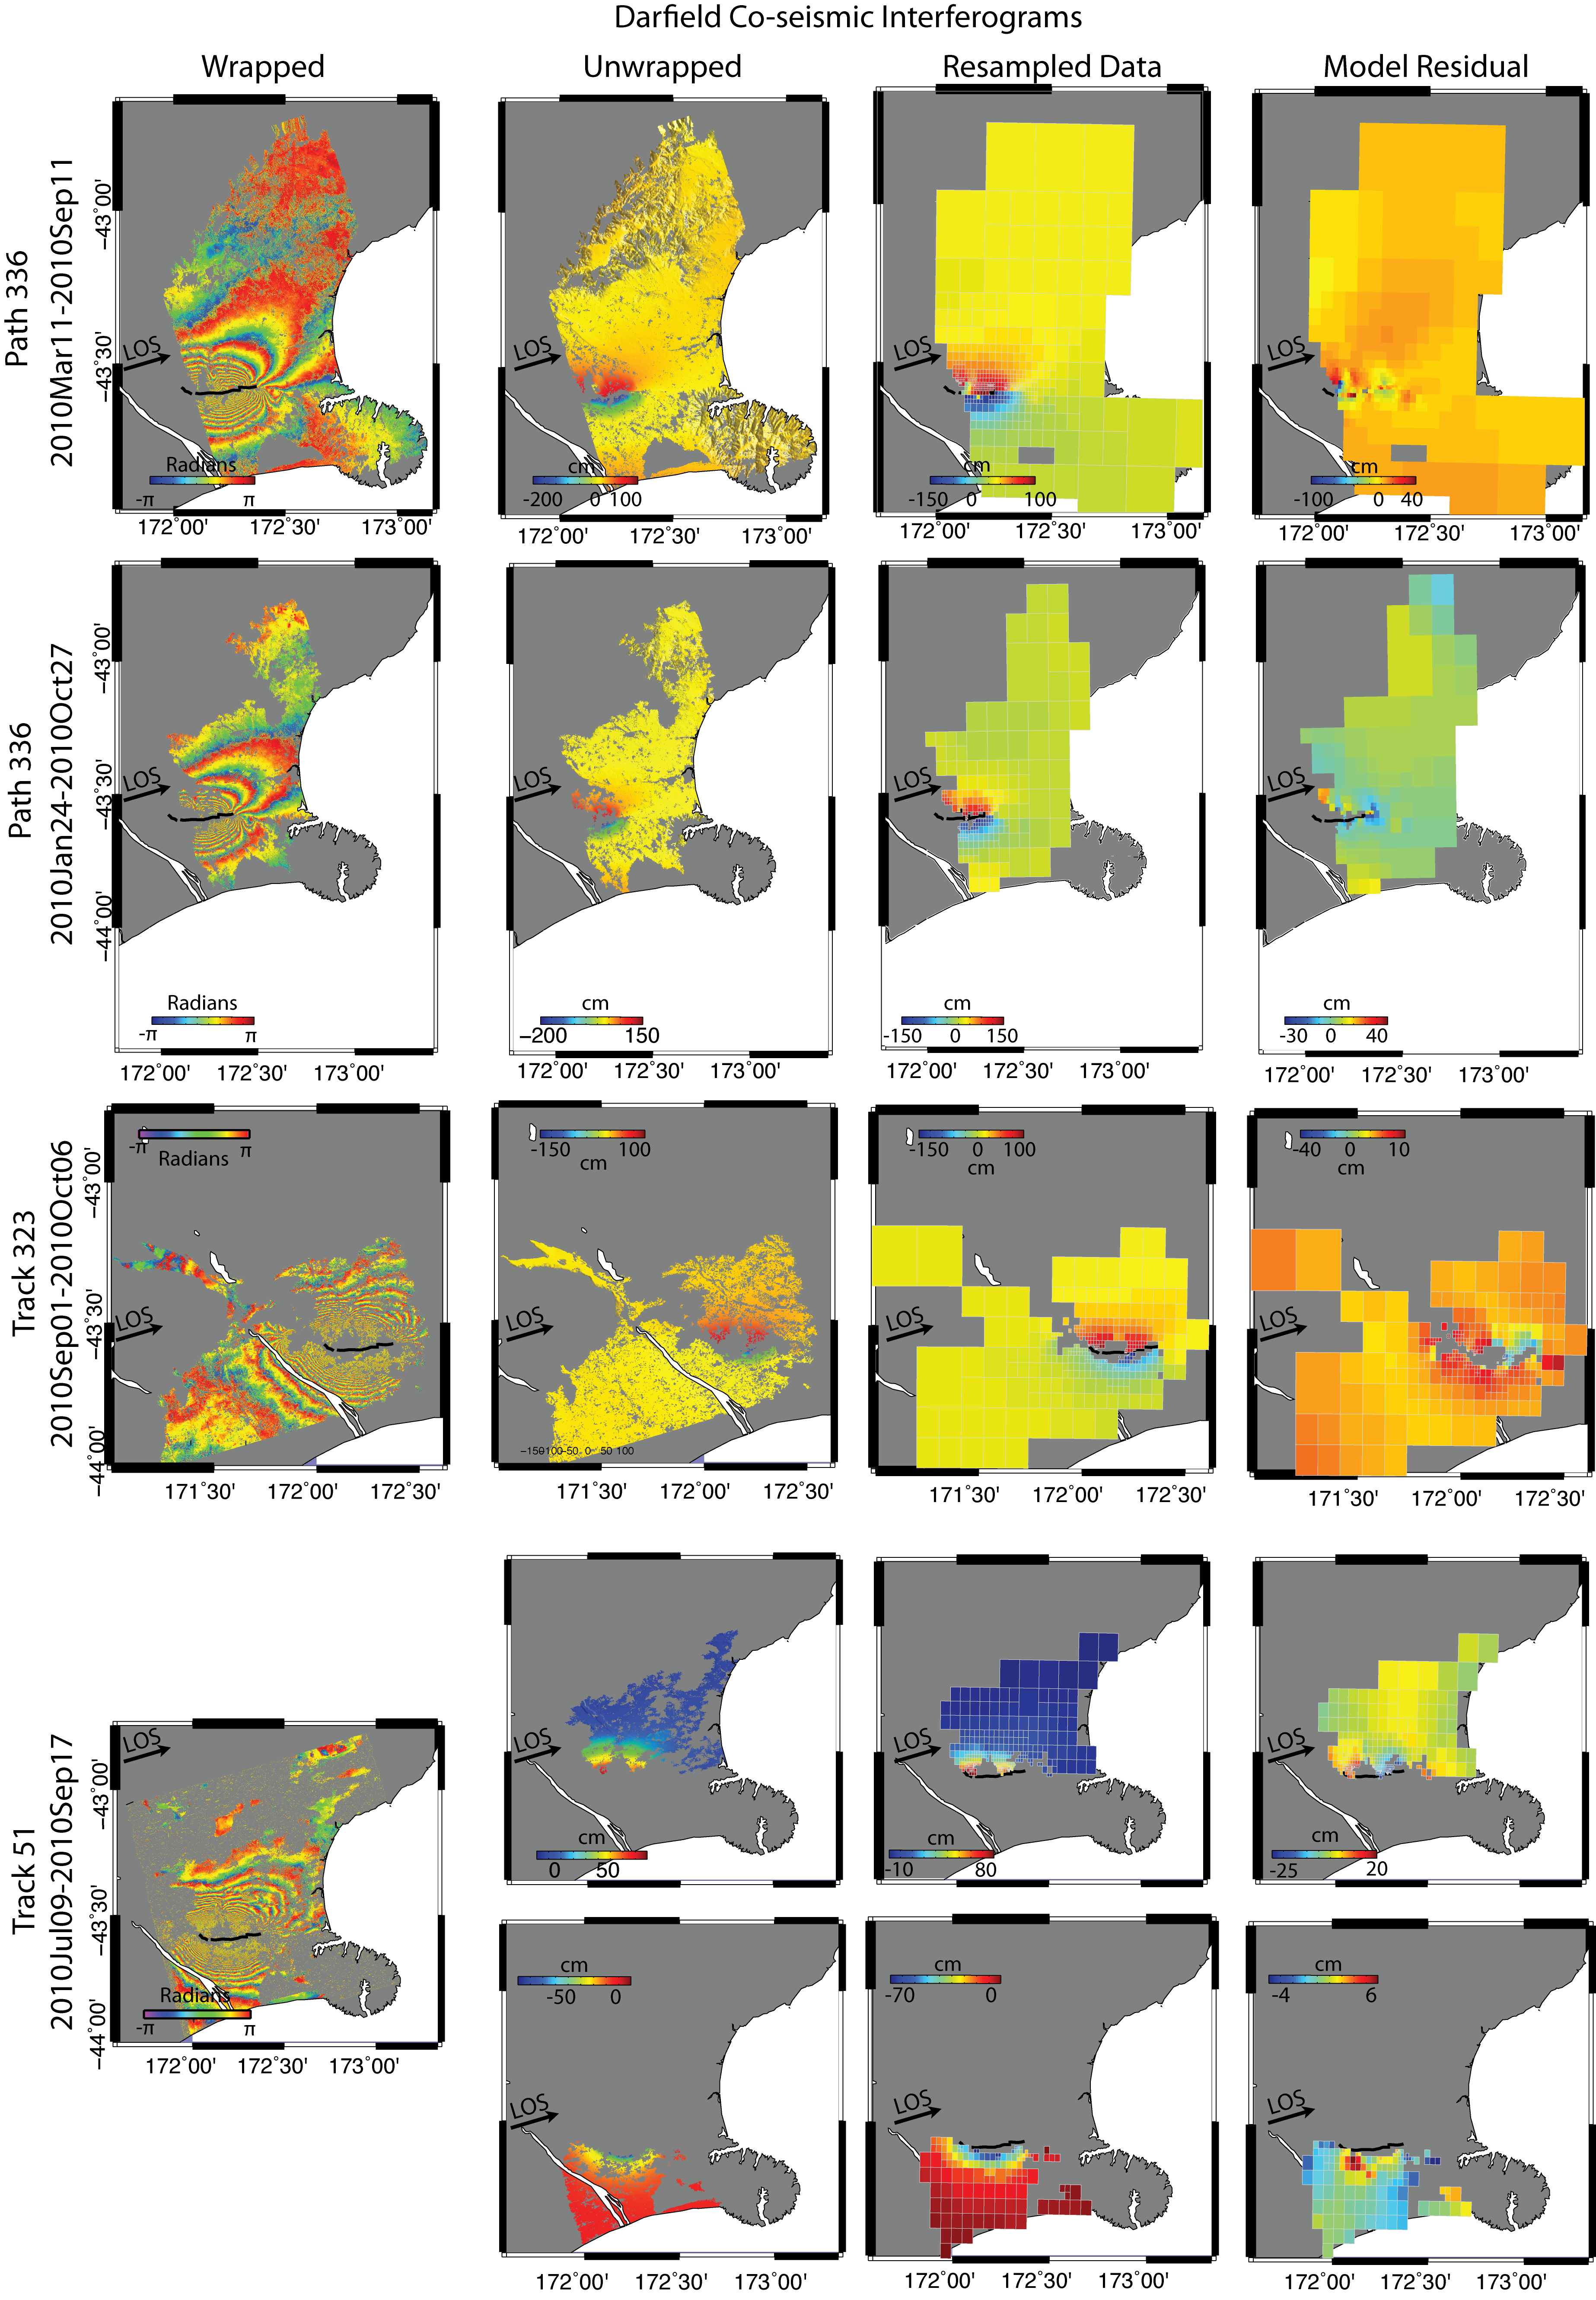
Figure S1. Co-seismic interferograms spanning the 4-Sept-2011 Darfield earthquake used in this study (See Figure 1, Table 1). From left to right, columns represent wrapped interferograms, unwrapped interferograms, resampled unwrapped interferograms, and data residual after removing a model based on the slip distribution shown in Figure 4a as well as a quadratic ramp. Color scales indicate displacements in the satellite line-of-sight (LOS, arrowd). Resampled data shown in column 3 are also available in Table S2.
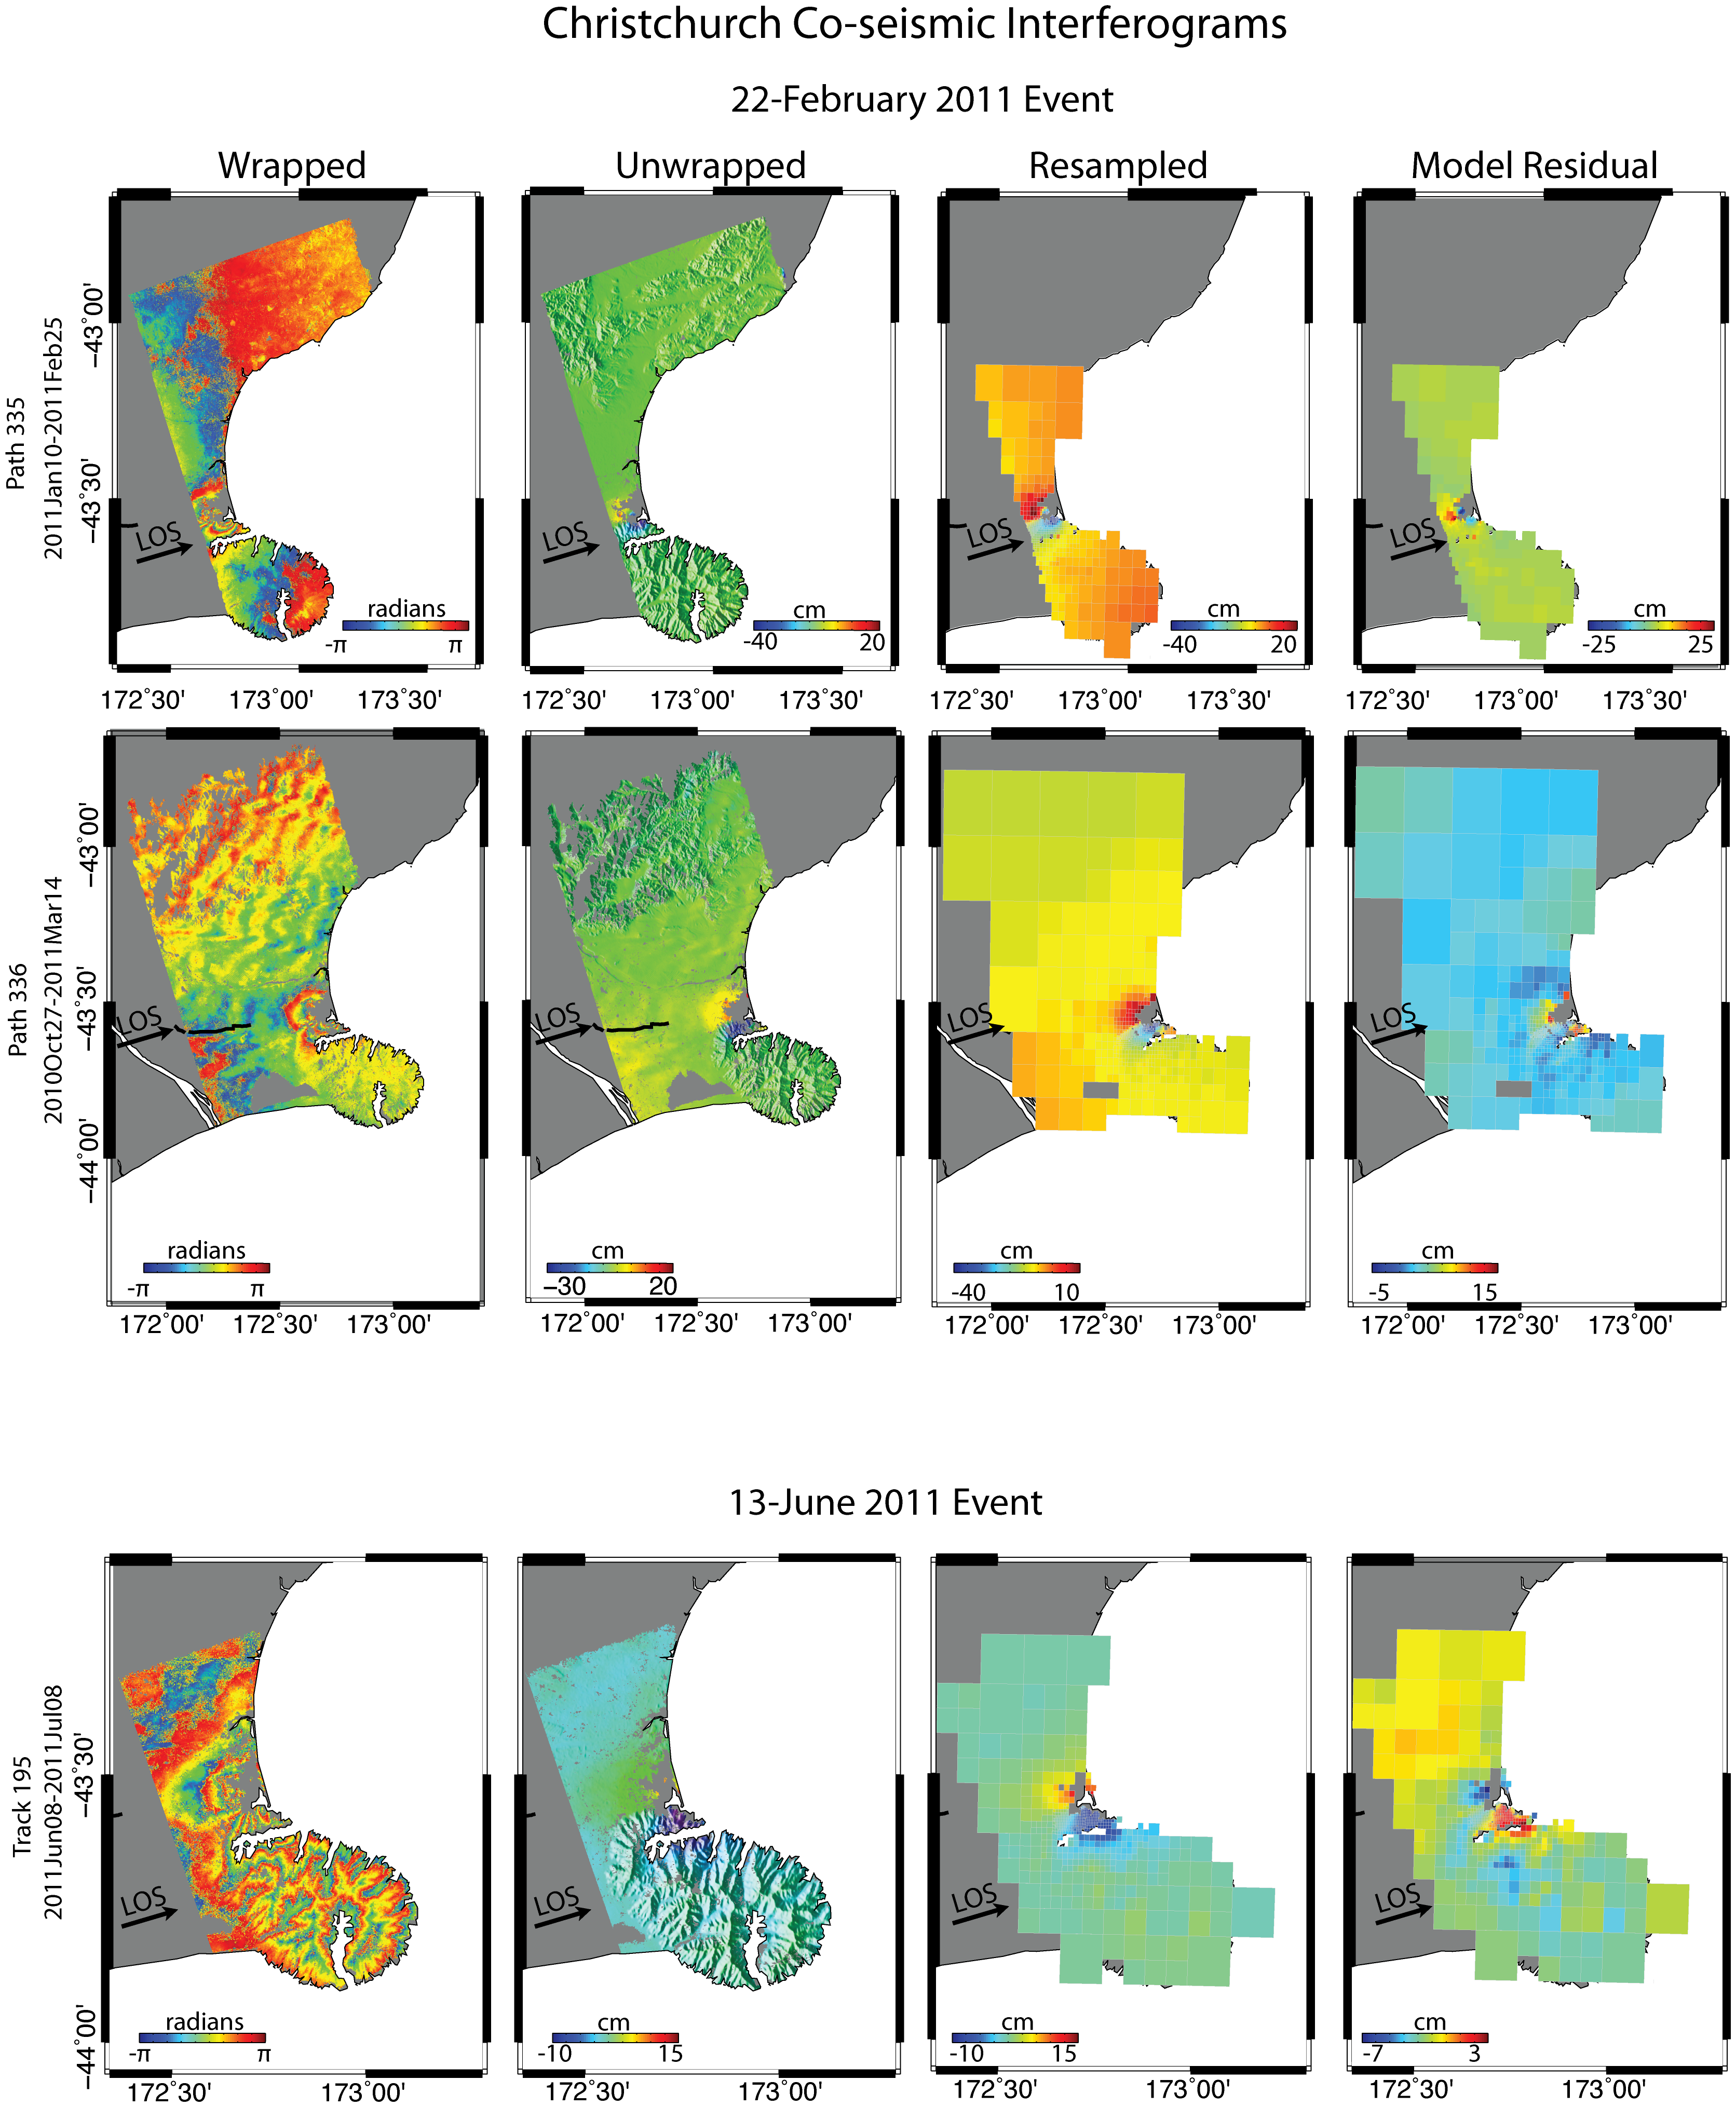
Figure S2. Co-seismic interferograms spanning the 22-Feb-2011 and 13-June-2011 Christchurch earthquakes used in this study (See Figure 1, Table 1). Columns and symbols as in Figure S1.
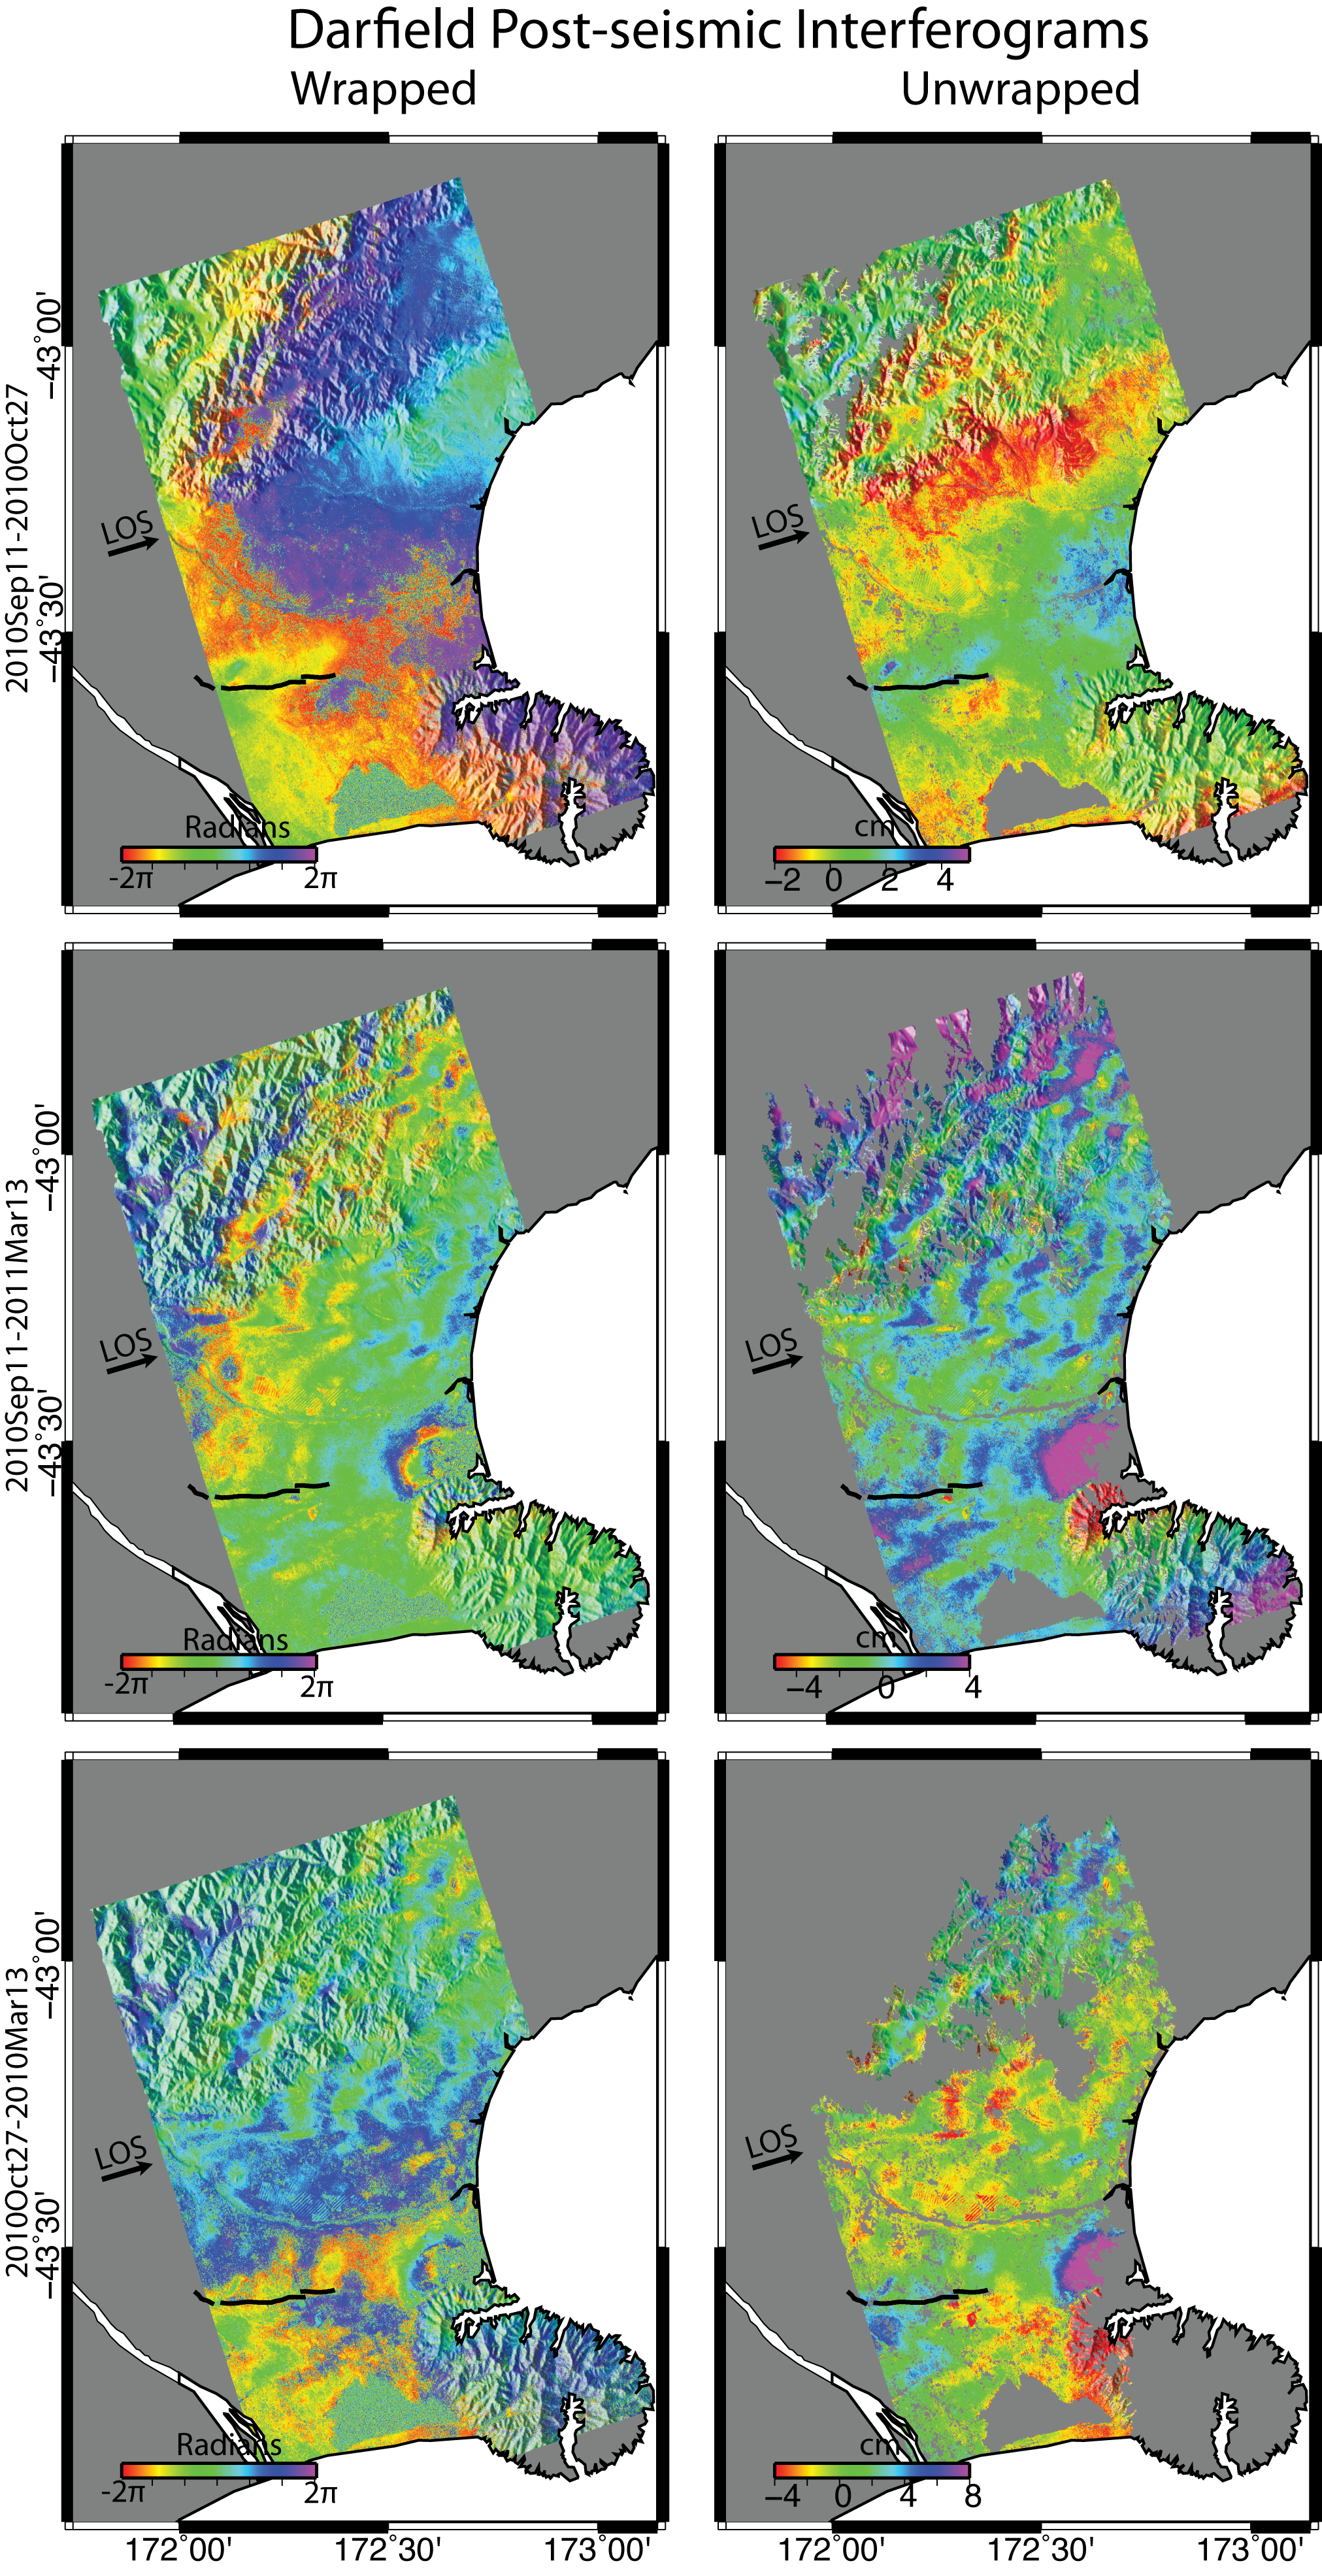
Figure S3. Post-seismic interferograms after the 4-Sept-2011 Darfield earthquake described in the text (Table 1, main body). Symbols as in Figure S1, columns indicate wrapped (left) and unwrapped (right) interferograms. Note colorscales have been adjusted to accent post-seismic deformation in interferograms where the Christchurch earthquake is also present.
Table files are comma-separated value ASCII text files.
Table S1. Model parameters for faults shown in Figure 4. Columns are ID (same as in Figure 4c), Lon-Lat of upper coordinates (decimal degrees), strike, dip, length (km), width (km), and depth (km) to the top of each fault plane. Plane ID number corresponds to the IDs in Figure 4.
Table S2. Details of resampled data shown in Figures S1 and S2 (3rd column). Header notation: ID= Earthquake (D=Darfield, Ch1=22-Feb Christchurch, Ch2=13-June Christchurch), X= longitude of averaged data point, Y= latitude of averaged data point, data= data value in meters, next eight columns are corner coordinates (in decimal degrees) of resampled boxes shown in Figures S1 and S2 (UL=Upper left, UR= Upper Right, LL= Lower Left, LR= Lower Right). Sx= X-component of look vector, Sy= Y-component of look vector, Sz= Z-component of look vector. Scenes are ordered in the order they appear in Figures S1 and S2.
Table S3. Details of pixel offset data shown in Figure 3. Header notation: X and Y = UTM (zone 59G) coordinates of each pixel offsets, dX = East-West offset, in meters, dY = North-South offset, in meters.
[ Back ]