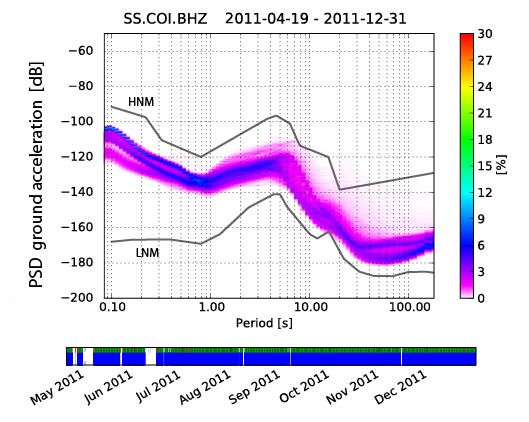
Figure S1 shows the background seismic noise recorded at station COI represented by the probability density function (PDF) of the power spectral density (PSD) of ground motion.
Figure S1. Probability density function (PDF) of the power spectral density (PSD) of the background noise recorded at station COI, channel BHZ (vertical). The analysis concerns data recorded by the broadband STS-2 sensor from April through December 2011. The bottom row shows the data used in the analysis: green patches represent available data, red patches represent gaps in streams that were added to the PSD, and blue patches represent the single PSD measurements that go into the histogram. The station has a lower noise level at longer periods compared to the noise level at shorter periods. At all frequencies the noise is between the low noise level and the high noise level (Peterson, 1993). There is a significant variability in the noise at all frequencies. The noise variability at long periods is normally attributed to earthquake signals and atmospheric processes (Zürn and Wielandt, 2007). The variability of seismic noise at higher frequencies is normally attributed to human activities and wind. This plot was created with ObsPy (Beyreuther et al., 2010).
Table S1 is an year-by-year list of seismograms and bulletins available at station COI.
Table S1. Inventory of seismograms and bulletins preserved at the Geophysical Institute of the University of Coimbra. A cross "x" marks years for which we have at least one seismogram for a given instrument. BO marks the year in which the sensor started to operate. "P" stands for published bulletins; "FNP" stands for final non-published – final, typed bulletins that did not get to be published; "A" indicates years for which we found seismograms analysis, with identification of phases, time arrivals, and time corrections; "*" marks years for which, according to staff inventory and notes, there should be final hand-written bulletins, which were handed in for typing; We have not yet been able to locate these bulletins.
Columns: Year / Milne / Astatic Wiechert / Vertical Wiechert and Wizine / Grenet / Short-period Geotech (S13) / Long-period Geotech (SL210) / Broadband STS-2 / Bulletins.
Beyreuther, M., R. Barsch, L. Krischer, T. Megies, Y. Behr, and J. Wassermann (2010), ObsPy: A Python toolbox for seismology, Seismological Research Letters, 81(3), 530–533, doi:10.1785/gssrl.81.3.530.
Peterson, J. (1993), Observations and modeling of seismic background noise, Tech. rep., United States Geological Survey Open-File Report 93-322, 95 pp.
Zürn, W., and E. Wielandt (2007), On the minimum of vertical seismic noise near 3 mHz, Geophysical Journal International, 168(2), 647–658, doi:10.1111/j.1365-246X.2006.03189.x.
[ Back ]