Electronic Supplement to
Evidence for Near-Horizontal Tensile Faulting at the Base of Gornergletscher,
a Swiss Alpine Glacier
by F. Walter, D. S. Dreger, J. F. Clinton, N. Deichmann, and M. Funk
Results and Discussion of Sensitivity Tests
As described in the manuscript the waveforms shown in Figure 3 suggest that the source is close enough to the glacier bed that the basal reflections amplify the direct P- and S-waves. As the GRANITE3D and TILL3D models contain merely an approximation to the true basal topography and the ice-bedrock interface, the Green’s Functions calculated with these models may not accurately reproduce the observed basal reflections. Therefore, we need to investigate how sensitive the moment tensor inversion is to errors in the Green’s Functions, which arise from inaccuracies of the modelled reflections and errors in the velocity profile in general.
We investigate how well the signals of a seismic source close to the ice-bedrock interface can be inverted using Green’s Functions of a wrong velocity model. Synthetic seismograms are calculated for a source placed 6m above the glacier bed in the GRANITE1D and the GRANITE3D model and 4m above the 4m thick low velocity layer in the TILL3D model. The GRANITE1D synthetics are inverted using Green’s Functions computed with the HOMOG model. The GRANITE3D synthetics are inverted with HOMOG and GRANITE1D Green’s Functions. Finally, we invert the TILL3D synthetics with GRANITE3D Green’s Functions. In all cases, we use the same source-station geometry as for the basal cluster.
The sensitivity tests were performed for two end-marker types of sources: a tensile crack and a pure double-couple fracture. We varied the strike and dip of the fault planes in increments of 10°. For the double-couple source the rake was fixed to 90°. The inversions in the sensitivity tests were performed automatically and the waveform fits were not visually inspected for each inversion run. The overall variance reduction was calculated using the median of the variance reductions of the individual stations. This is unconventional, as usually the arithmetic mean is used. However, the arithmetic mean is more susceptible to outliers, such as individual stations with extremely low fit quality. As we did not manually or automatically remove such stations in the sensitivity studies, we calculated the overall variance reduction with the median to reduce the impact that a single station has on the overall variance reduction. When inverting data seismograms, however, we conformed to the convention of using the arithmetic mean.
Figure S1A, C, E and G show the source-type plots (Hudson et al., 1989) of the sensitivity studies. Each dot corresponds to a fault with a different strike and dip. For all cases we notice that the inversion results separate into two populations, which are located in distinct regions of the grid according to whether the synthetic source is a tensile crack or a double-couple. This indicates that the inversion results correctly distinguish between a tensile crack and a double-couple source, even though the Green’s Functions model basal reflections incorrectly or not at all.
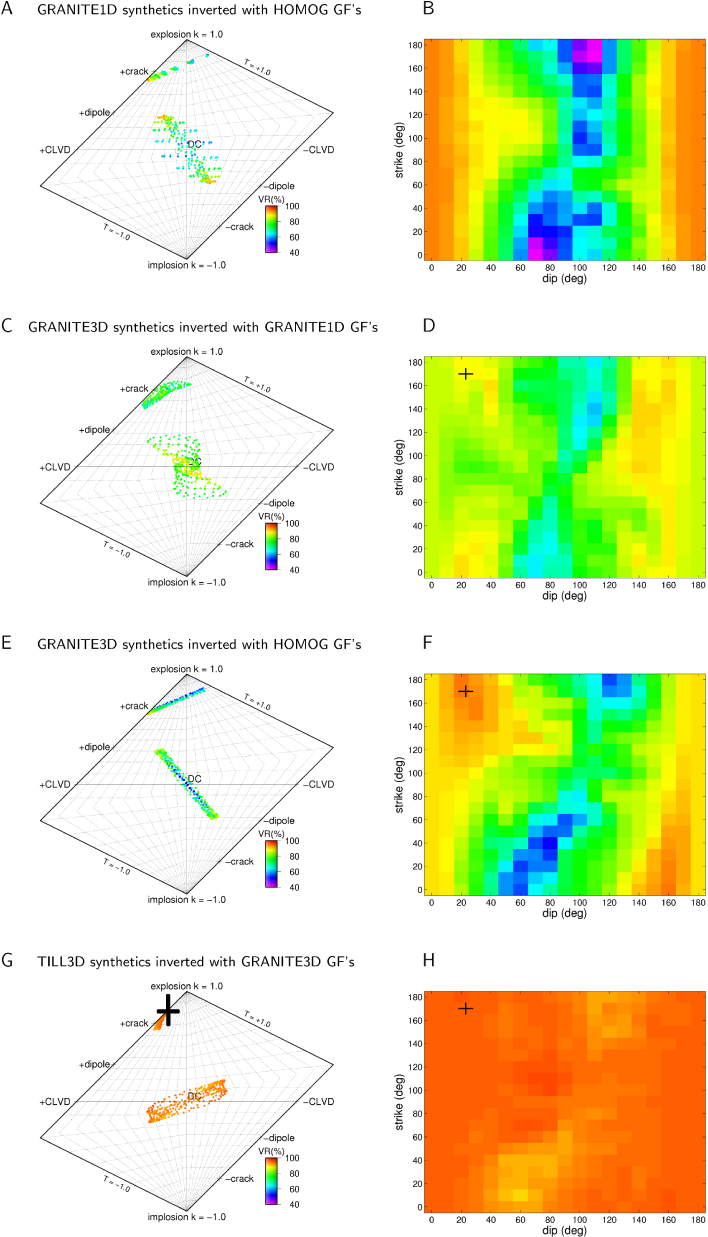
Figure S1. Results of sensitivity studies of the full moment tensor inversion: Source-type plots of inversion results of tensile crack and double-couple synthetics (left) and variance reductions for the tensile crack synthetics (right). A and B: Synthetic sources in the GRANITE1D model inverted with HOMOG Green's Functions. C and D: Synthetic sources in the GRANITE3D model inverted with GRANITE1D Green's Functions. E and F: Synthetic sources in the GRANITE3D model inverted with HOMOG Green's Functions. G and H: Synthetic sources in the TILL3D model inverted with GRANITE3D Green's Functions. In the source-type plots each dot is color-coded according to the variance reduction of the solution it represents. In all cases, the solutions separate into two populations corresponding to the inversions of tensile crack and double-couple synthetics. At the same time, large deviations from the true source type exist for some fault plane orientations. The fit quality depends on the orientation of the tensile crack fault planes. In case of the synthetic tensile crack in the GRANITE3D model, the highest fit quality is achieved for a strike and dip value similar to the orientation of the glacier bed near the source, as indicated by the black cross hairs. Notice that using HOMOG Green's Functions provides variance reductions of up to 94% when inverting GRANITE1D and GRANITE3D synthetic tensile cracks. In the latter case, the HOMOG Green's Functions can even perform better than the GRANITE1D Green's Functions, although large deviations from the correct source-type occur. For all fault plane mechanisms, GRANITE3D Green's Functions can invert TILL3D synthetics with high fit qualities (Panels G and H). The variance reductions lie between 90% and 96.5%. The large cross hairs in panel G correspond to the inversion of the tensile crack source with bed-parallel fault planes.
In most cases, the fit quality of the synthetic tensile cracks depends on the strike and dip (Figure S1B, D, and F) of the fault planes. In the case of the GRANITE1D synthetic tensile cracks inverted with HOMOG Green’s Functions (Figure S1B) there is a strong dependence on dip, and best results are achieved for near-horizontal fault planes. Variance reductions lie between 41% and 94%. There is a weaker dependence on the strike. This dependence is due to the station distribution as this is the only source of azimuthal variation for the generation of GRANITE1D synthetics.
Inverting GRANITE3D tensile crack synthetics with GRANITE1D Green’s Functions (Figure S1D) gives variance reductions between 61% and 90%. Somewhat surprisingly, Figure S1F shows that inverting GRANITE3D tensile crack synthetics with HOMOG Green’s Functions can give slightly better results than inversions with GRANITE1D Green’s Functions. However, this depends on the fault plane orientation of the tensile crack. Figure S1F shows that best results can be achieved for near-horizontal fault planes with strikes running approximately North-South. This coincides with the orientation of the bed of the GRANITE3D model in the vicinity of the synthetic source (black cross hairs in Figure S1D, F and H). A reason why HOMOG Green’s Functions perform better at specific fault plane orientations than GRANITE1D Green’s Functions may be found in small later arrivals, such as multiples or head waves. These are missing in the HOMOG synthetics whereas they are present in the GRANITE1D synthetics. However, in the latter case, the secondary arrivals may have phases and amplitudes, which are different from the secondary arrivals in the GRANITE3D synthetics. Modelling secondary arrivals incorrectly with GRANITE1D Green’s Function may thus have a more negative effect on the variance reduction than not modelling them at all, as in the case of the HOMOG Green’s Functions.
The sensitivity tests thus show that Green’s Functions of a homogeneous halfspace can model waveforms whose direct P- and S-wave trains were modified by reflections of an adjacent glacier bed. This holds for an inclined bed as in the GRANITE3D model as well as for a horizontal one as in the GRANITE1D model.
When using GRANITE3D Green's Functions to invert tensile crack synthetics of the TILL3D model, the variance reduction is high (> 90%) for all fault plane orientations (Figure 1H). This suggests that omitting the thin basal low-velocity layer in the generation of Green's Functions affects the inversion quality only marginally. However, the results for the double-couple can acquire a substantial CLVD component (Figure 1G). For the tensile crack with bed-parallel fault planes, the omission of the low-velocity layer leads to an artificial increase in isotropy, as indicated by the large cross in Figure 1G.
So far we have performed sensitivity tests for the full moment tensor inversion, only. Concerning the tensile crack moment tensor inversion, we now test how accurately the fault plane orientations of a synthetic basal tensile crack can be recovered with Green's Functions of an incorrect medium. We focus on three cases: TILL3D synthetics inverted with GRANITE1D Green's Functions, GRANITE3D synthetics inverted with GRANITE1D Green's Functions and TILL3D synthetics inverted with GRANITE3D Green's Functions. As before we vary the orientation of the fault planes. This time, however, we use the tensile crack moment tensor inversion. Saving computational time, we search strike and dip in increments of 10° and we search over 20 different moment magnitudes. We then calculate the angle between the tensile crack fault planes of the forward synthetics and the tensile crack fault planes as determined by the inversion.
Figure S2 shows the results of these sensitivity studies. In most cases the fit results agree with the initial fault plane orientations to within 20°. In the case of the TILL3D synthetics inverted with GRANITE3D synthetics the mismatch is 10° or smaller for all fault plane orientations (panel C). Only for the GRANITE3D sources inverted with GRANITE1D (panel B) there is a mismatch of up to 32°. The individual fit results show that in this case the recovered fault plane orientations are still vertical. Yet there can be a considerable mismatch, because the fitted fault planes dip in the opposite direction as fault planes of the forward synthetics. For this inversion as well as the TILL3D synthetics inverted with GRANITE1D Green's Functions (panel A) the largest mismatches occur predominantly for near-vertical fault planes with strikes above 110° or below 30°. GRANITE1D inversions of TILL3D synthetics recover horizontal fault planes to within 10° (panel A). In the other cases, near-horizontal fault planes are recovered exactly. The sensitivity studies thus indicate that the ability of the tensile crack moment tensor inversion to recover fault plane orientations is rather robust with respect to the basal topography and material. Specifically, most tensile crack fault plane orientations can be recovered to within 20° with inversions using Green's Functions calculated for a horizontal bed. The results furthermore suggest that ignoring a low velocity layer near the glacier base does not influence the calculation of fault plane orientations substantially.
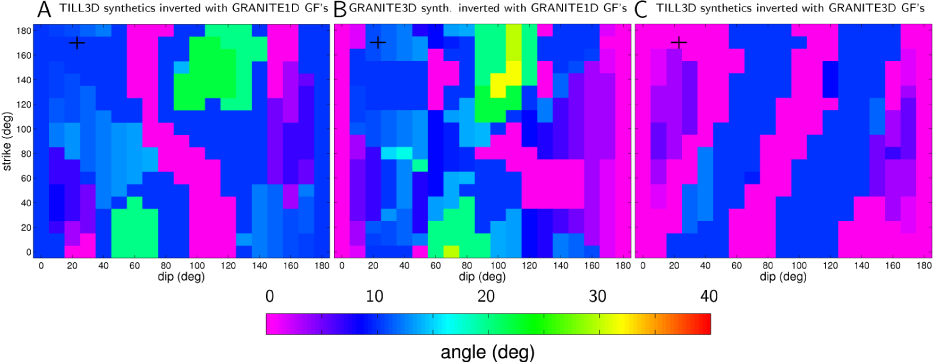
Figure S2: Results of sensitivity studies of the tensile crack moment tensor inversion. Shown is the angle that the input tensile crack fault planes make with the fault plane orientation calculated with the tensile crack moment tensor inversion. Note that this angle is never larger than 32°. For the TILL3D synthetics inverted with GRANITE3D Green's Functions the results agree to within 12% for all fault plane orientations. Disagreement usually occurs at near-vertical fault plane orientations, whereas near-horizontal fault plane orientations give good agreement. This resembles the performance of the full moment tensor inversion as shown in Figure S1.
Bibliography
Hudson, J. A., Pearce, R G., Rogers, R. M. (1989). Source type plot for inversion of the moment tensor. Journal of Geophysical Research, 94, 765-774.