Comparison with NGA Models: Campbell and Bozorgnia
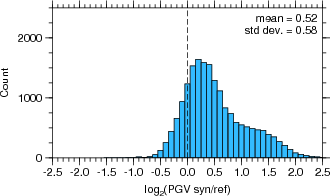
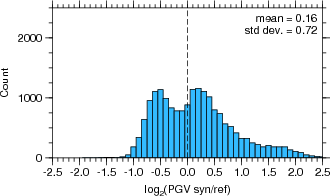
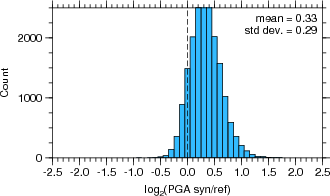
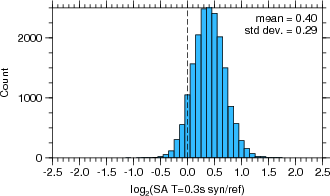
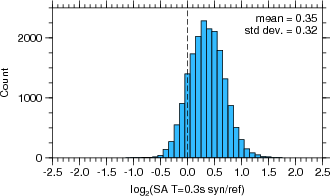
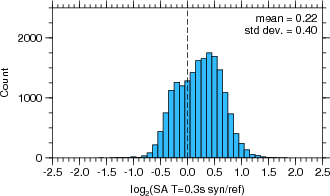
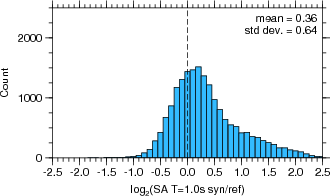
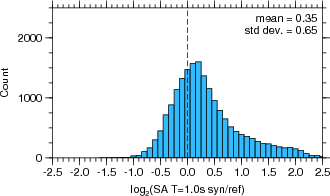
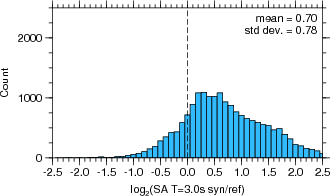
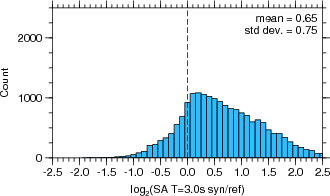
Comparison of ground motions from Graves's broadband (T > 0.1 s) simulations of Hayward South scenario earthquakes with Campbell and Bozorgnia's NGA ground-motion prediction model. The residuals in the histograms are normalized by log(2), so that a residual of 1.0 corresponds to a value that is larger by a factor of 2.0, and a residual of -2.0 corresponds to a value that is smaller by a factor of 4.0. Positive residuals (warm colors) indicate the ground motion from the 3D simulation is greater than that predicted by the NGA model, and negative residuals (cool colors) indicate the ground motion from the 3D simulation is lower than that predicted by the NGA model. All of the scenarios use slip distribution G01, rupture speed Vr92, and rise time Tr15.
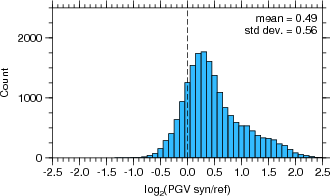
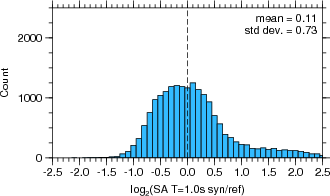
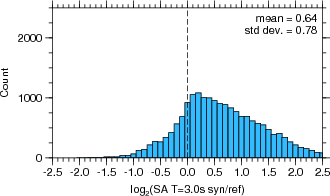
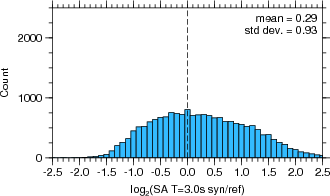
The Campbell and Bozorgnia ground-motion prediction equations predict ground motions, on average, similar to those generated by the simulations. The simulations do contain stronger rupture directivity, with greater discrepancies at longer periods. Applying the Spudich and Chiou directivity correction yields slight reductions in the mean residual and standard deviation.
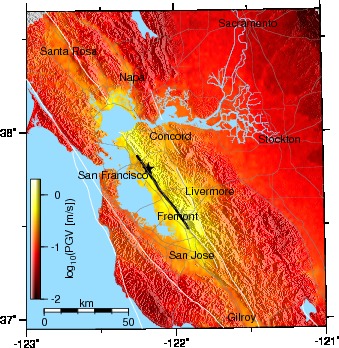
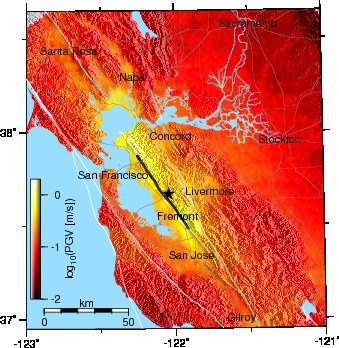
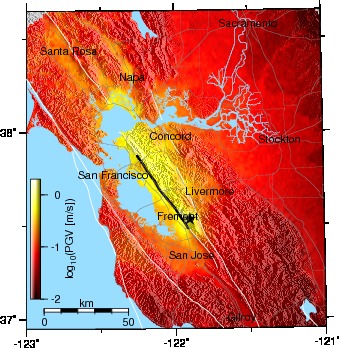
Peak Ground Velocity
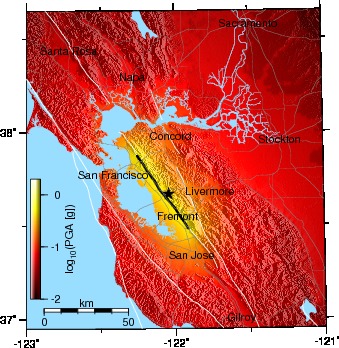
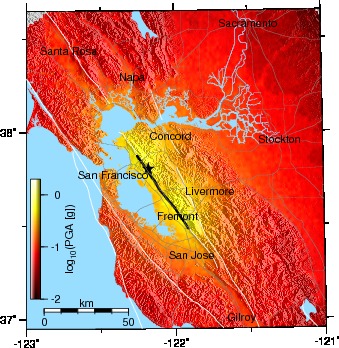
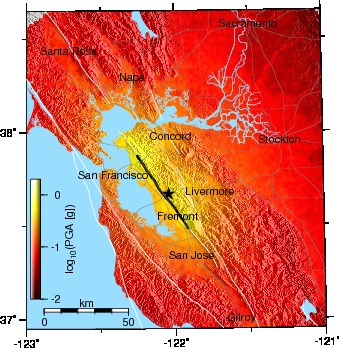
Map of peak horizontal ground velocity for a Mw 6.76 Hayward South earthquake using Campbell and Bozorgnia's NGA model.
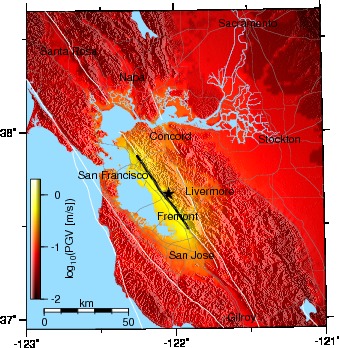 |
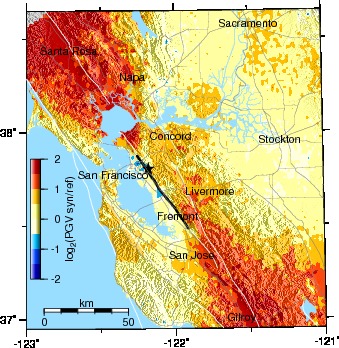
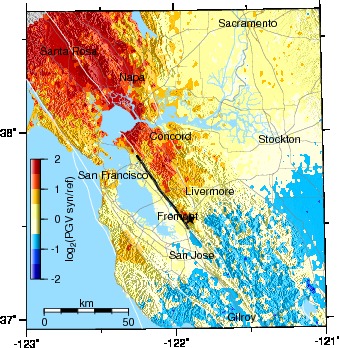
Maps of peak horizontal ground velocity for Graves's broadband simulations of Mw 6.76 Hayward South scenarios. Lower panels show the differences with respect to Campbell and Bozorgnia's NGA model.
| Oakland epicenter | Hayward epicenter | Fremont epicenter |
|---|---|---|
 |
 |
 |
 |
 |
 |
 |
 |
 |
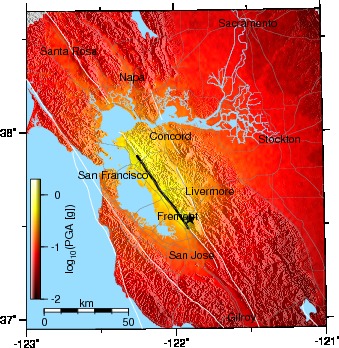
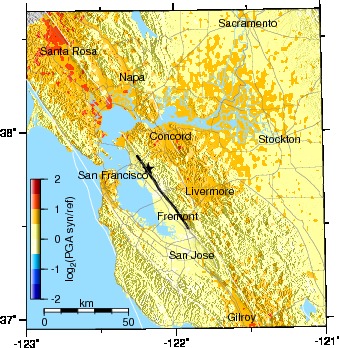
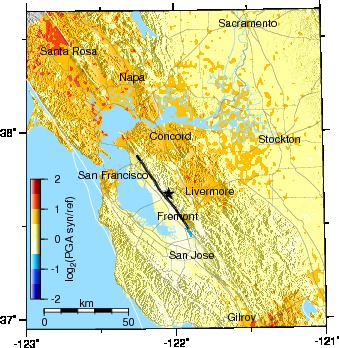
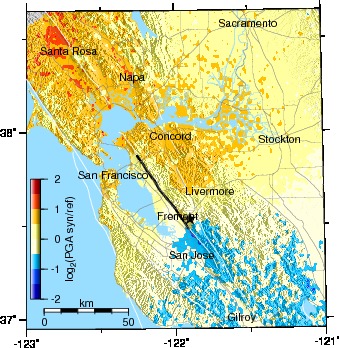
Peak Ground Acceleration
Map of peak horizontal ground acceleration for a Mw 6.76 Hayward South earthquake using Campbell and Bozorgnia's NGA model.
 |
Maps of peak horizontal ground acceleration for Graves's broadband simulations of Mw 6.76 Hayward South scenarios. Lower panels show the differences with respect to Campbell and Bozorgnia's NGA model.
| Oakland epicenter | Hayward epicenter | Fremont epicenter |
|---|---|---|
 |
 |
 |
 |
 |
 |
 |
 |
 |
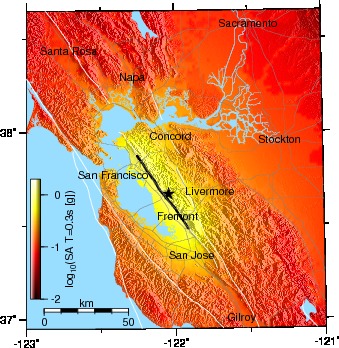
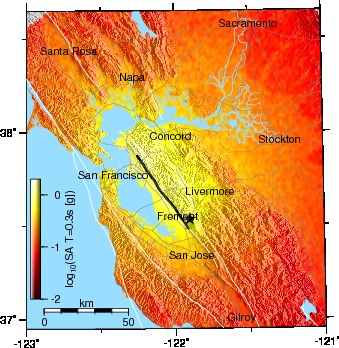
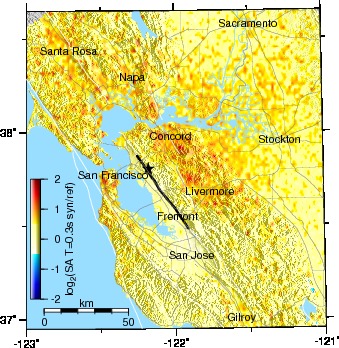
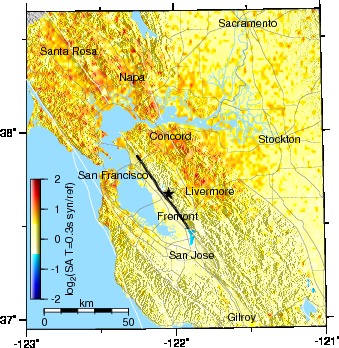
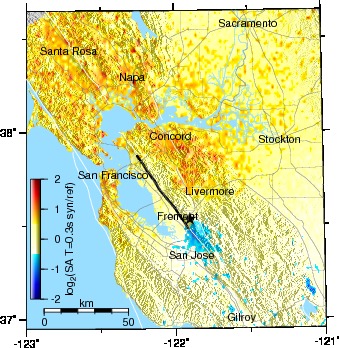
Spectral Acceleration at T = 0.3 s
Map of peak horizontal spectral acceleration at T = 0.3 s for a Mw 6.76 Hayward South earthquake using Campbell and Bozorgnia's NGA model.
 |
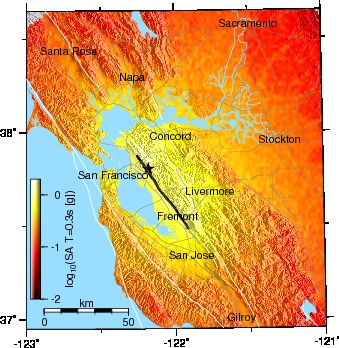
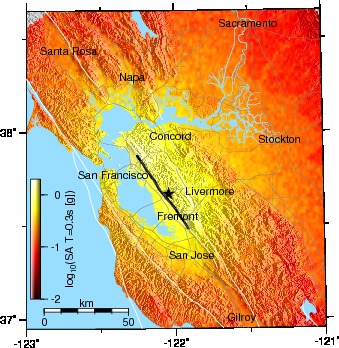
Maps of peak horizontal spectral acceleration at T = 0.3 s for Graves's broadband simulations of Mw 6.76 Hayward South scenarios. Lower panels show the differences with respect to Campbell and Bozorgnia's NGA model.
| Oakland epicenter | Hayward epicenter | Fremont epicenter |
|---|---|---|
 |
 |
 |
 |
 |
 |
 |
 |
 |
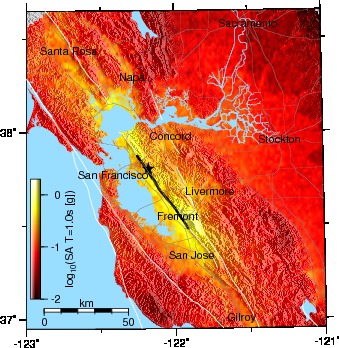
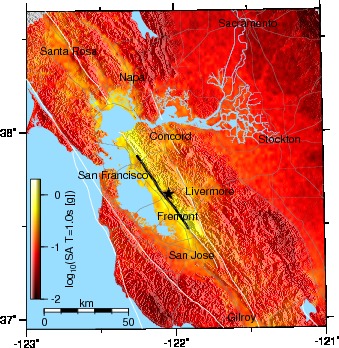
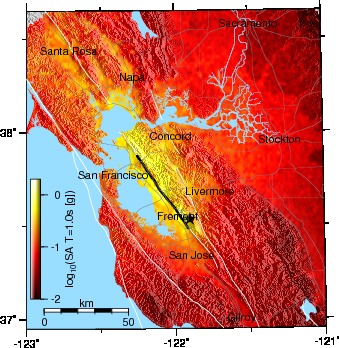
Spectral Acceleration at T = 1.0 s
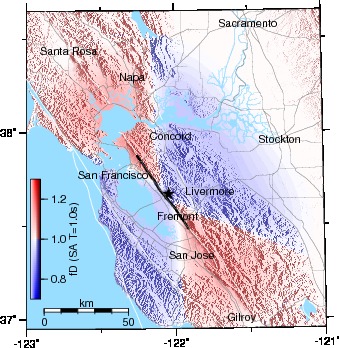
Map of peak horizontal spectral acceleration at T = 1.0 s for a Mw 6.76 Hayward South earthquake using Campbell and Bozorgnia's NGA model.
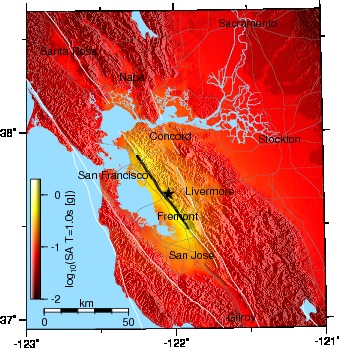 |
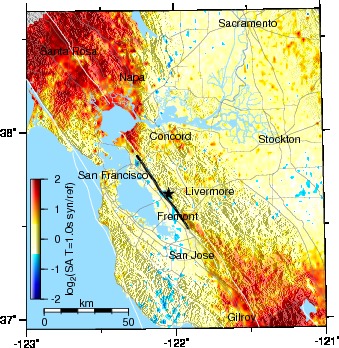
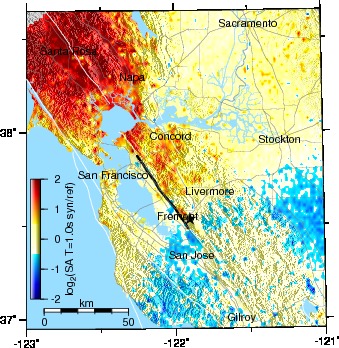
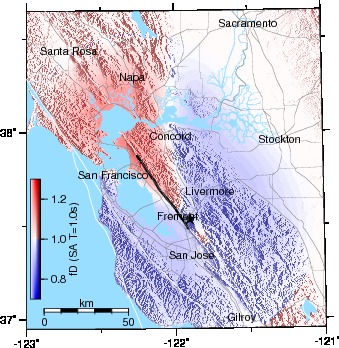
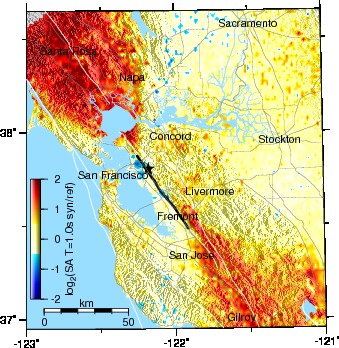
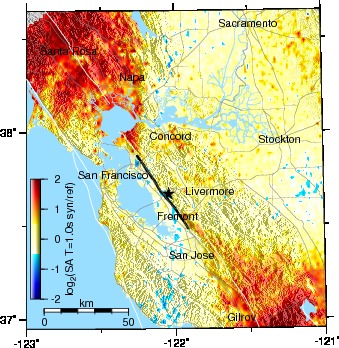
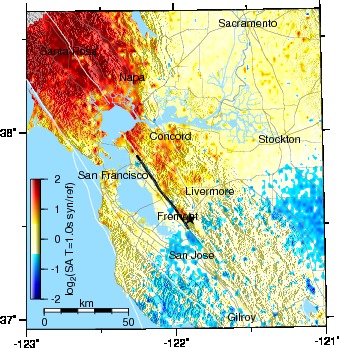
Maps of peak horizontal spectral acceleration at T = 1.0 s for Graves's broadband simulations of Mw 6.76 Hayward South scenarios. Lower panels show the differences with respect to Campbell and Bozorgnia's NGA model.
| Oakland epicenter | Hayward epicenter | Fremont epicenter |
|---|---|---|
 |
 |
 |
 |
 |
 |
 |
 |
 |
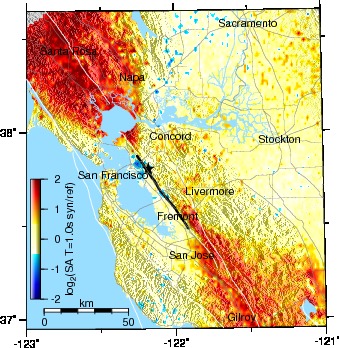
Spudich and Chiou Directivity Correction
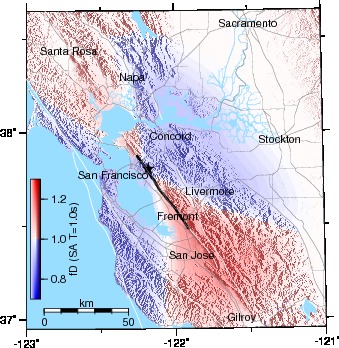
Map of Spudich and Chiou (2008) directivity correction for Campbell and Bozorgnia's NGA model at T = 1.0 s for the Mw 6.76 Hayward South scenario earthquakes.
| Oakland epicenter | Hayward epicenter | Fremont epicenter |
|---|---|---|
 |
 |
 |
Maps of peak horizontal spectral acceleration at T = 1.0 s for Graves's broadband simulations of Mw 6.76 Hayward South scenarios. The panels show the differences with respect to Campbell and Bozorgnia's NGA model with the Spudich and Chiou directivity correction.
| Oakland epicenter | Hayward epicenter | Fremont epicenter |
|---|---|---|
 |
 |
 |
 |
 |
 |
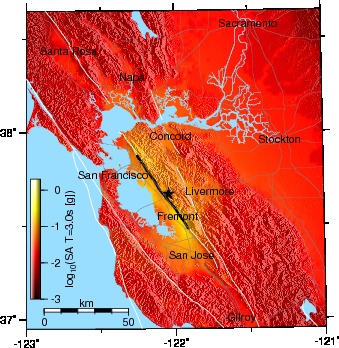
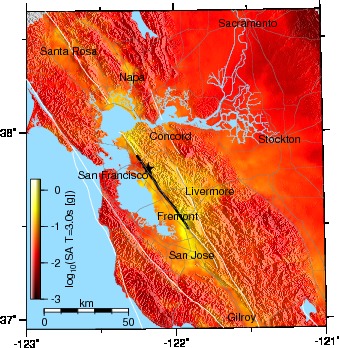
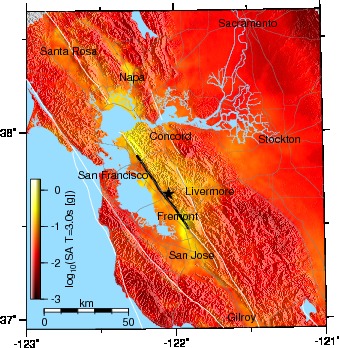
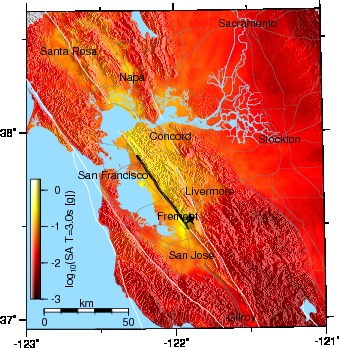
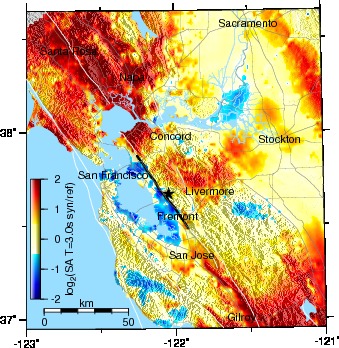
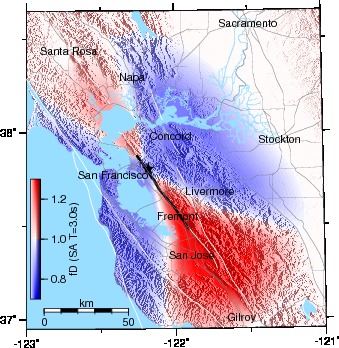
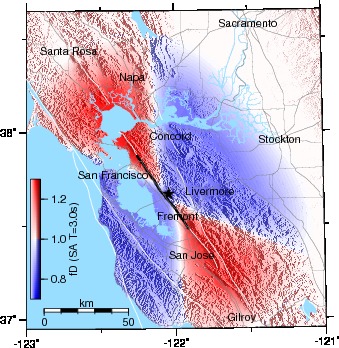
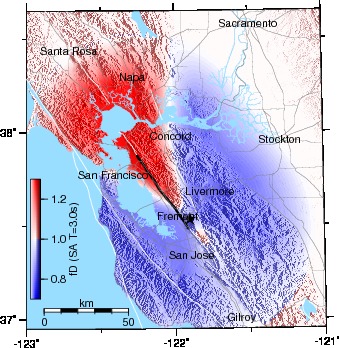
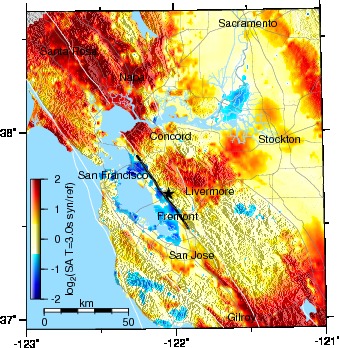
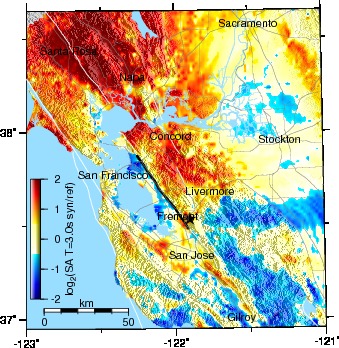
Spectral Acceleration at T = 3.0 s
Map of peak horizontal spectral acceleration at T = 3.0 s for a Mw 6.76 Hayward South earthquake using Campbell and Bozorgnia's NGA model.
 |
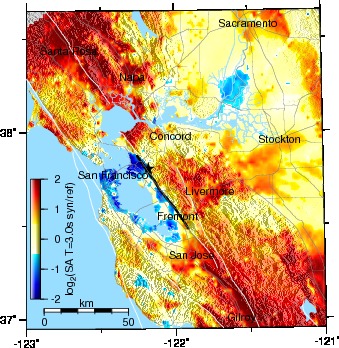
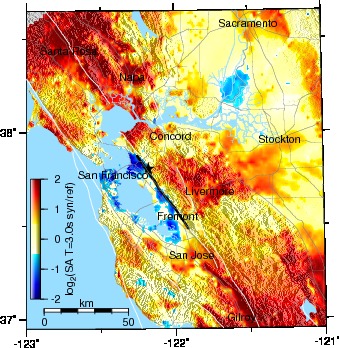
Maps of peak horizontal spectral acceleration at T = 3.0 s for Graves's broadband simulations of Mw 6.76 Hayward South scenarios. Lower panels show the differences with respect to Campbell and Bozorgnia's NGA model.
| Oakland epicenter | Hayward epicenter | Fremont epicenter |
|---|---|---|
 |
 |
 |
 |
 |
 |
 |
 |
 |
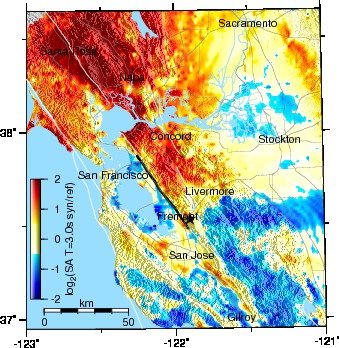
Spudich and Chiou Directivity Correction
Map of Spudich and Chiou (2008) directivity correction for Campbell and Bozorgnia's NGA model at T = 3.0 s for the Mw 6.76 Hayward South scenario earthquakes.
| Oakland epicenter | Hayward epicenter | Fremont epicenter |
|---|---|---|
 |
 |
 |
Maps of peak horizontal spectral acceleration at T = 3.0 s for Graves's broadband simulations of Mw 6.76 Hayward South scenarios. The panels show the differences with respect to Campbell and Bozorgnia's NGA model with the Spudich and Chiou directivity correction.
| Oakland epicenter | Hayward epicenter | Fremont epicenter |
|---|---|---|
 |
 |
 |
 |
 |
 |