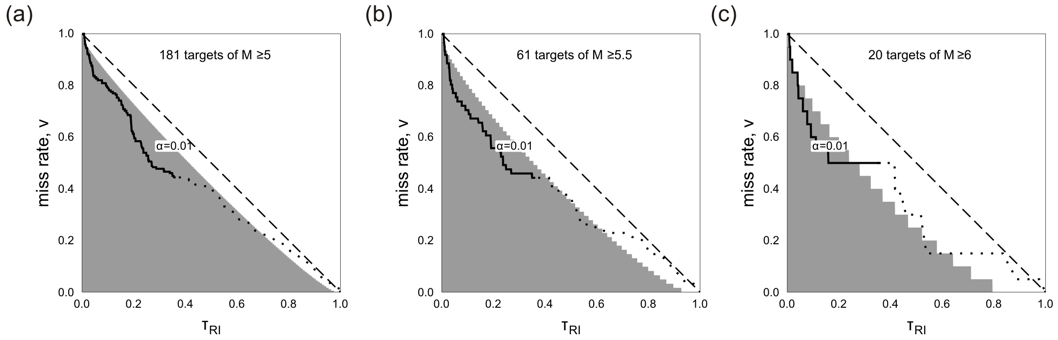
Figure S1.Retrospective evaluation of the EAST model in the California CSEP testing region from 1984 to 2008 for three Mtarget values: (a) Mtarget =5, (b) Mtarget =5.5, (c) Mtarget =6. Using Molchan diagram, we compare the prediction of the EAST model to the prediction of the RI reference model. The solid line is the Molchan trajectory calculated from the highest to the smallest threshold value Ea0 of the alarm function. The dotted line is the Molchan trajectory that incorporate zones where the Ea value cannot be defined (see text). The dashed diagonal line corresponds to an unskilled forecast model with respect to the reference model. The shaded area indicates the zone of the Molchan diagram in which the prediction of the EAST model is better than the prediction of the RI reference model at a level of significance α=1%.
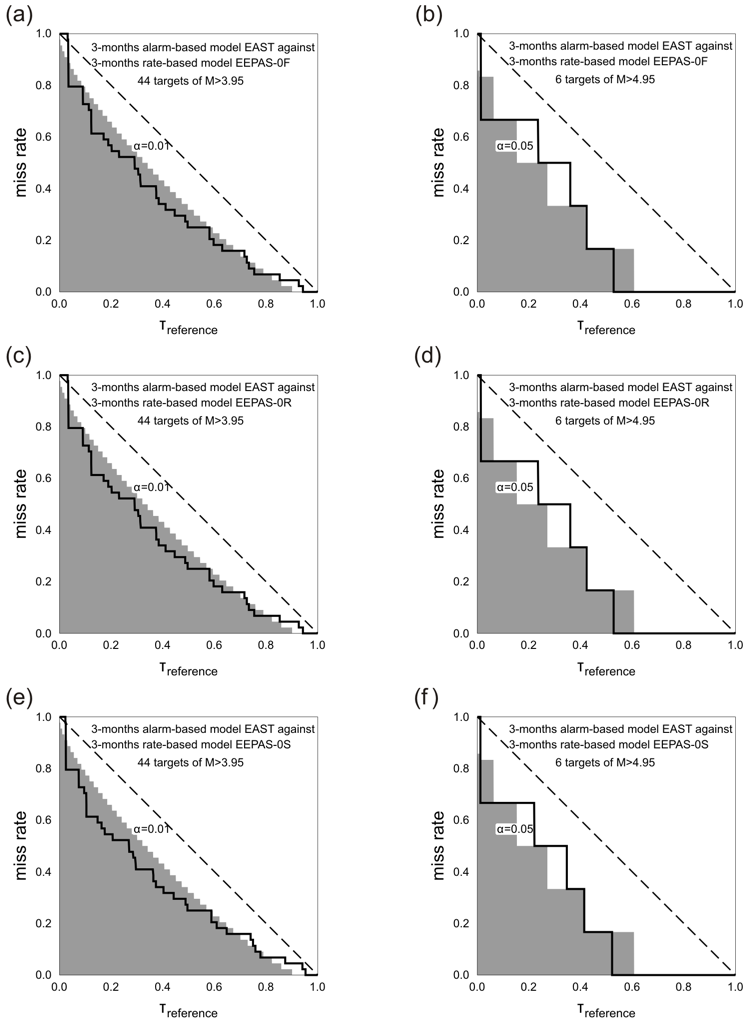
Figure S2. Comparison of the prediction of the EAST model with the prediction of three versions of EEPAS-0, a three-months rate-based clustering model proposed by D. Rhoades (2007) for Mtarget=4.95. Figures ((a)-(b), (c)-(d) and (e)-(f) correspond to models EEPAS-0F, EEPAS-0R and EEPAS-0S, respectively. For models with $ Mtarget=3.95 (left), we use an extrapolation of the Poisonian frequency of the models with Mtarget=4.95 (right) using the slope of the earthquake size distribution. The solid line is the Molchan trajectory calculated from the highest to the smallest threshold value Ea0 of the alarm function. The dotted line is the Molchan trajectory that incorporate zones where the Ea value cannot be defined (see text). The dashed diagonal line corresponds to an unskilled forecast model with respect to the chosen EEPAS-0 model. The shaded area indicates the zone of the Molchan diagram in which the prediction of the EAST model is better than the prediction of the chosen EEPAS-0 model at a level of significance α=1%.
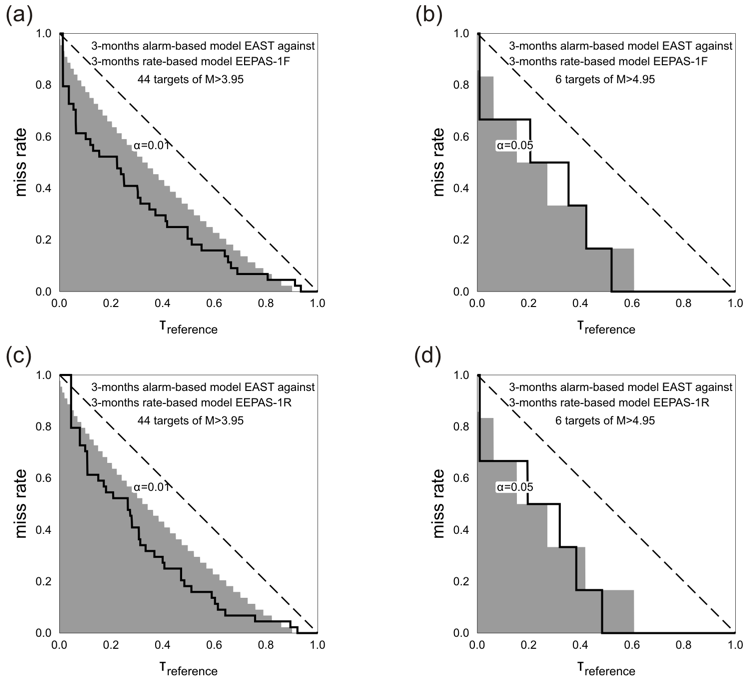
Figure S3. Comparison of the prediction of the EAST model with the prediction of two versions of EEPAS-1, a three-months rate-based clustering model proposed by D. Rhoades (2007) for Mtarget=4.95. Figures (a)-(b) and(c)-(d) correspond to models EEPAS-1F and EEPAS-0R, respectively. For models with $ Mtarget=3.95 (left), we use an extrapolation of the Poisonian frequency of the models with Mtarget=4.95 (right) using the slope of the earthquake size distribution. The solid line is the Molchan trajectory calculated from the highest to the smallest threshold value Ea0 of the alarm function. The dotted line is the Molchan trajectory that incorporate zones where the Ea value cannot be defined (see text). The dashed diagonal line corresponds to an unskilled forecast model with respect to the chosen EEPAS-1 model. The shaded area indicates the zone of the Molchan diagram in which the prediction of the EAST model is better than the prediction of the chosen EEPAS-1 model at a level of significance α=1%.
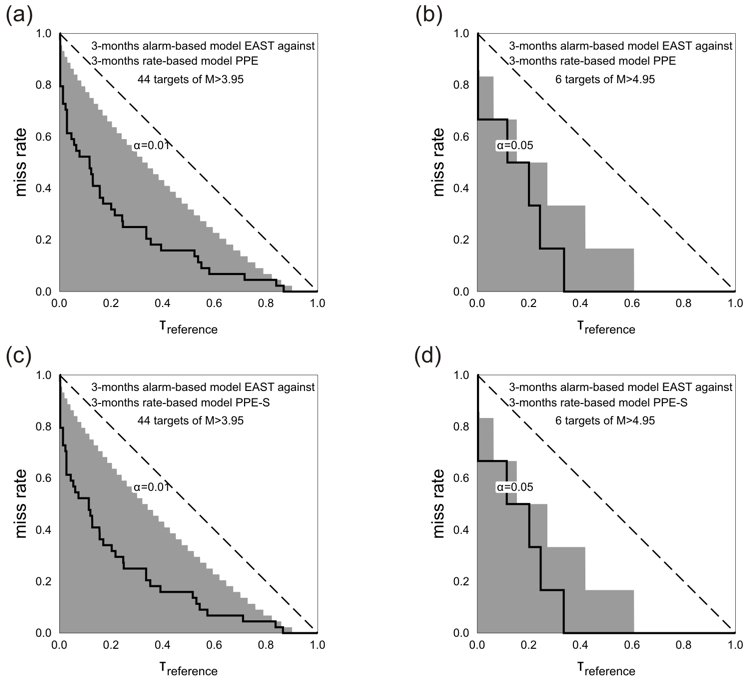
Figure S4. Comparison of the prediction of the EAST model with the prediction of three versions of PPE, a three-months rate-based clustering model proposed by D. Rhoades (2007) for Mtarget=4.95. Figures (a)-(b) and (c)-(d) correspond to models PPE and PPE-S, respectively. For models with $ Mtarget=3.95 (left), we use an extrapolation of the Poisonian frequency of the models with Mtarget=4.95 (right) using the slope of the earthquake size distribution. The solid line is the Molchan trajectory calculated from the highest to the smallest threshold value Ea0 of the alarm function. The dotted line is the Molchan trajectory that incorporate zones where the Ea value cannot be defined (see text). The dashed diagonal line corresponds to an unskilled forecast model with respect to the chosen PPE model. The shaded area indicates the zone of the Molchan diagram in which the prediction of the EAST model is better than the prediction of the chosen PPE model at a level of significance α=1%.
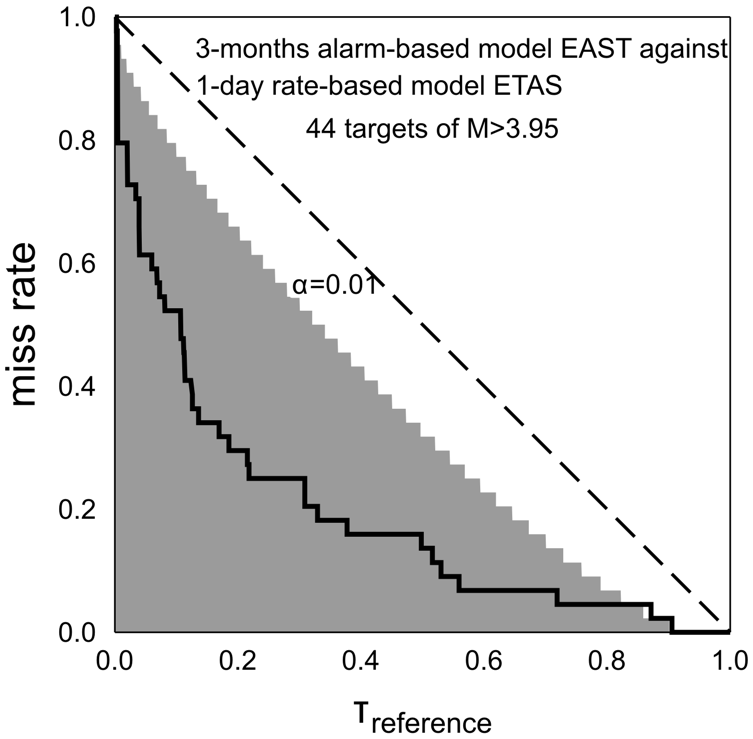
Figure S5. Comparison of the prediction of the EAST model with the prediction of a one-day ETAS model for Mtarget=3.95 (this model prepared for the test in California by Zhuang and Liukis following (Ogata, 1998). The solid line is the Molchan trajectory calculated from the highest to the smallest threshold value Ea0 of the alarm function. The dotted line is the Molchan trajectory that incorporate zones where the Ea value cannot be defined (see text). The dashed diagonal line corresponds to an unskilled forecast model with respect to the EAST model. The shaded area indicates the zone of the Molchan diagram in which the prediction of the EAST model is better than the prediction of the chosen ETAS model at a level of significance α=1%.
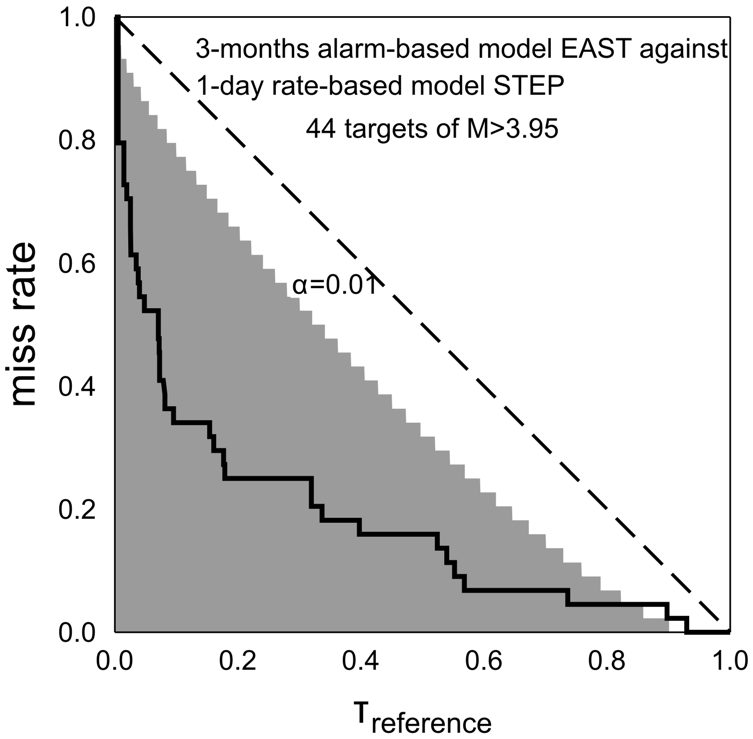
Figure S6. Comparison of the prediction of the EAST model with the prediction of a one-day STEP model for Mtarget=3.95 (Gerstenberger et al., 2005). The solid line is the Molchan trajectory calculated from the highest to the smallest threshold value Ea0 of the alarm function. The dotted line is the Molchan trajectory that incorporate zones where the Ea value cannot be defined (see text). The dashed diagonal line corresponds to an unskilled forecast model with respect to the STEP model. The shaded area indicates the zone of the Molchan diagram in which the prediction of the EAST model is better than the prediction of the chosen STEP model at a level of significance α=1%.
Rhoades, D. A., 2007. Application of the EEPAS Model to Forecasting Earthquakes of Moderate Magnitude in Southern California, Seism. Res. Lett., 78, 110-115.
Ogata, Y., 1998. Space-time point-process models for earthquake occurrences, Ann. Inst. Statist. Math., 50(2), 379-402.
Gerstenberger, M.C., Wiemer, S., Jones, Lucile M., Reasenberg, P.A., 2005. Real-time forecasts of tomorrow’s earthquakes in California. Nature 435, 328-331. doi: 10.1038/nature03622.