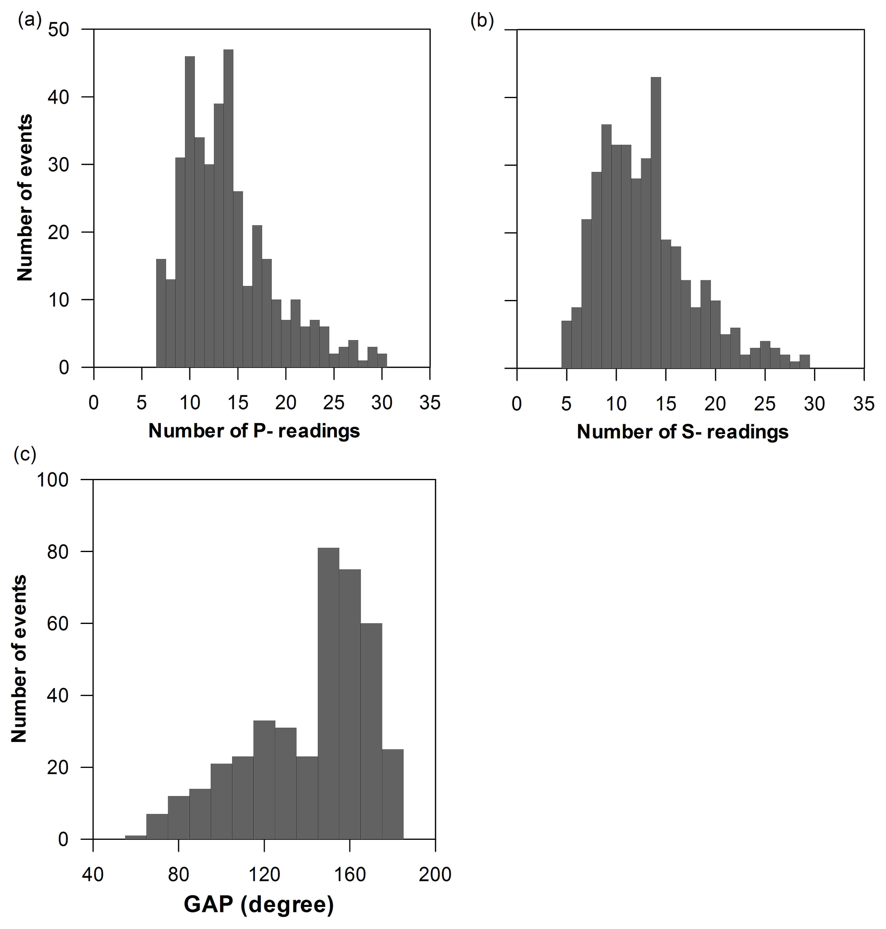
Figure S1 and Figure S2 show the constrains and distribution of the data respectively, used for joint inversion of 1-D velocity model and hypocenter locations. Table S1 shows the P- and S-wave corrections obtained from travel time inversion.
Figure S1. Constrains on the data used for inversion of 1-D velocity model and hypocentre location. Histograms show the number of events with (a) P- readings, (b) S-readings, (c) azimuthal gap in observations.
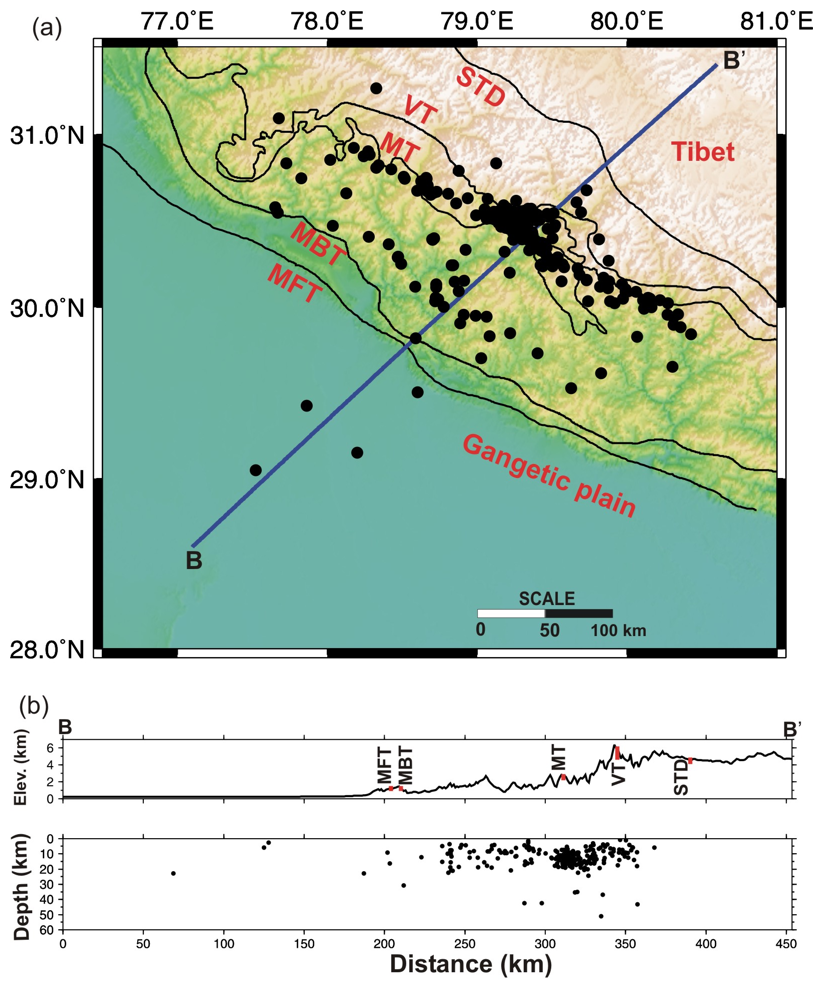
Figure S2. (a) Distribution of 385 earthquakes used in joint inversion for hypocenter and velocity parameters using VELEST. (b) Earthquake depth distribution is projected along the BB' cross-section. Topography along the cross-section is also plotted.
Table S1. P- and S-wave corrections obtained from travel time inversion.
[ Back ]