Electronic Supplement to
Empirical Calibration of Local Magnitude Data Sets Versus Moment Magnitude in Italy
by Paolo Gasperini, Barbara Lolli, and Gianfranco Vannucci
Section 3. Analysis of frequency-magnitude distributions of revalued Mw datasets.
In Fig. S14, we show the G&R plots (see details in main text) of the merged dataset of direct Mw estimates and Mw proxies (upper panels) and of the original dataset of ML estimates (bottom panels), for the entire CSTI catalog from 1981 to 1996. The revalued dataset show a b-value slightly lower than 1 that is closer to the global average than the original ML dataset (about 1.1).
We can note in both plots the rates lower than predicted and the change of the G&R slope for M>4.5 that might reflect both a real property of seismic release in Italy or a bias related to the difficulty of reliably sizing earthquakes when most stations (and particularly the closest ones) saturate. The decrease of rates with increasing magnitude is more gradual and starts at larger magnitudes for the revalued Mw catalog than for the original ML one.
In the rightmost panels we can note how the behavior of the b-value as a function of the cut-off magnitude Mmin is more stable for the revalued dataset (top) than for the original ML one (bottom). In both plots the clear increase of the b-value for Mmin>4.0 reflects the clear decrease of the earthquakes frequencies evidenced by the G&R plots.
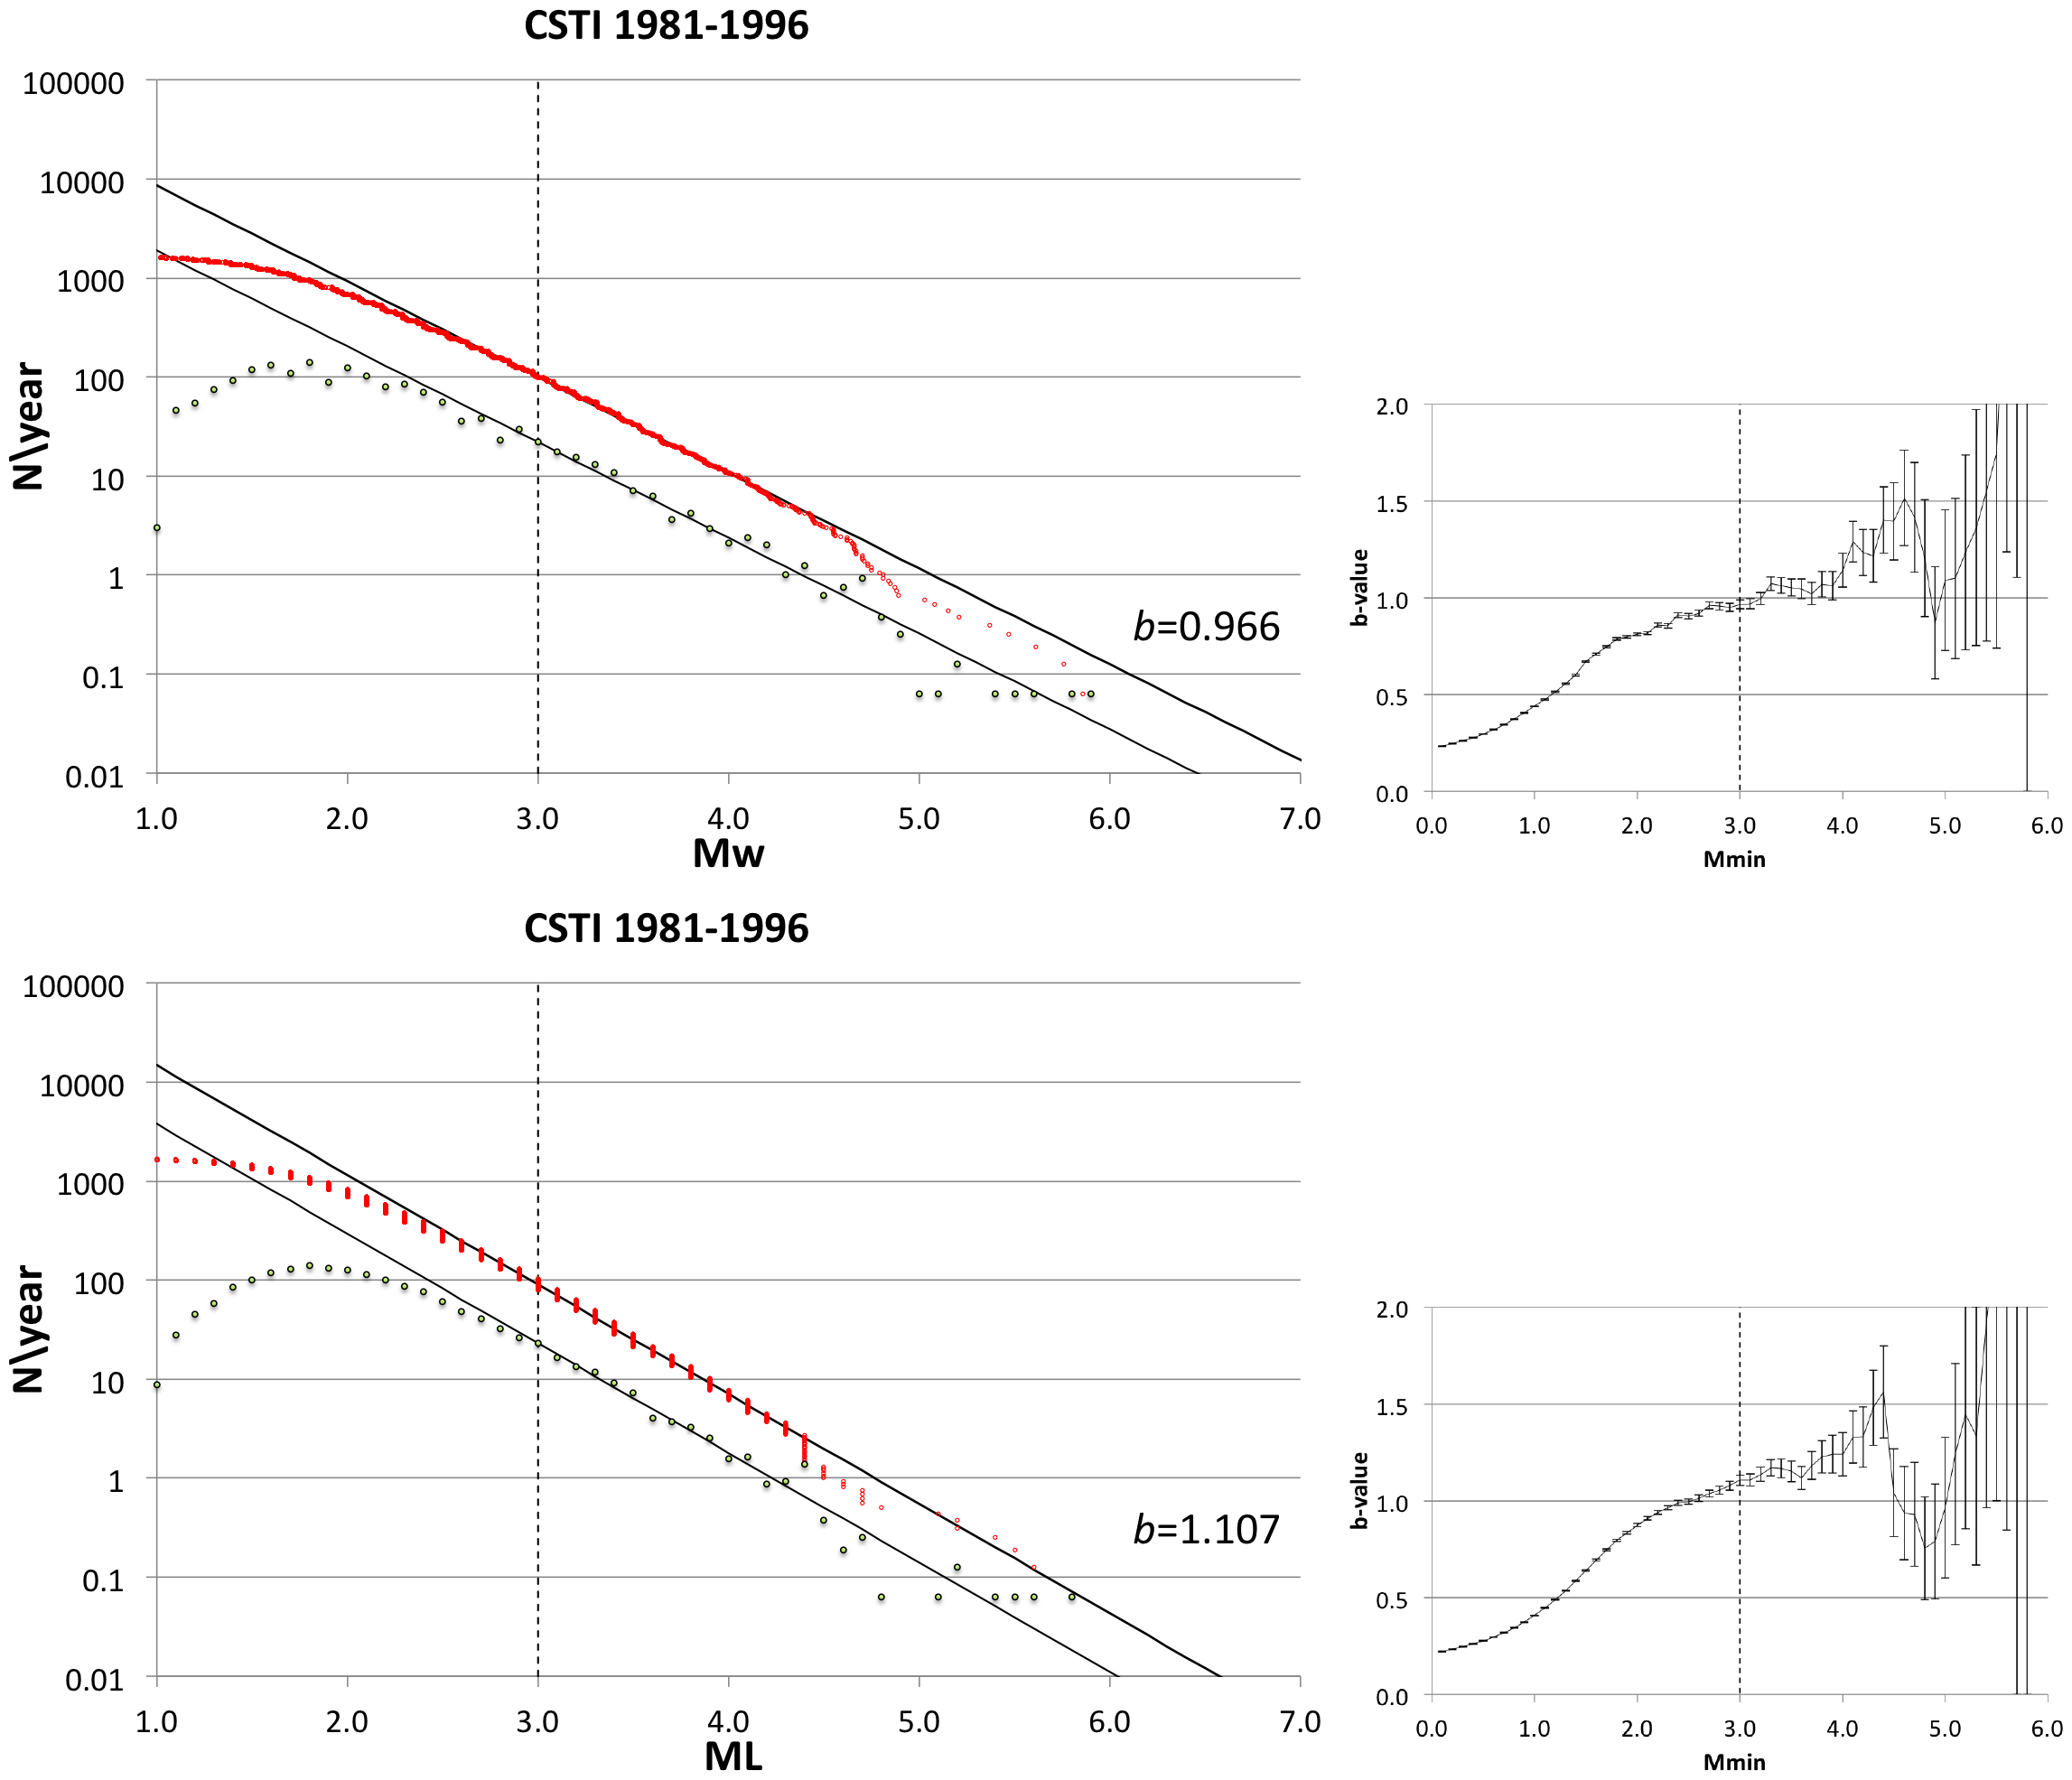
▲ Figure S14. Frequency-magnitude plots for the entire CSTI dataset from 1981 to 1996. Left panels reports cumulative numbers of earthquakes per year with magnitude larger than or equal to the abscissa (red circles) and number of earthquakes per year within bins of 0.1 magnitude units centered in the abscissa (black circles). The superimposed G&R lines are computed considering only magnitudes not lower than that indicated by the vertical dashed lines. Right panels display the behavior of the b-value as a function of minimum magnitude Mmin. Top panels refer to Mw revalued according to calibration equations deduced in this work, while bottom panels to the original ML dataset.
As the quality of the Italian network strongly improved at the end of the 1980's (see Fig. S1), we show in Fig. S15 the same plots for the time interval from 1990 to 1996. Although the deviation from the G&R line is slightly smaller than for the entire catalog and the approximated completeness threshold can be lowered down to about M≥2.5, the plots substantially confirm the results shown in Fig. S14 for the entire period from 1981 to 1996 and particularly the rates lower than predicted for Mw>4.5.
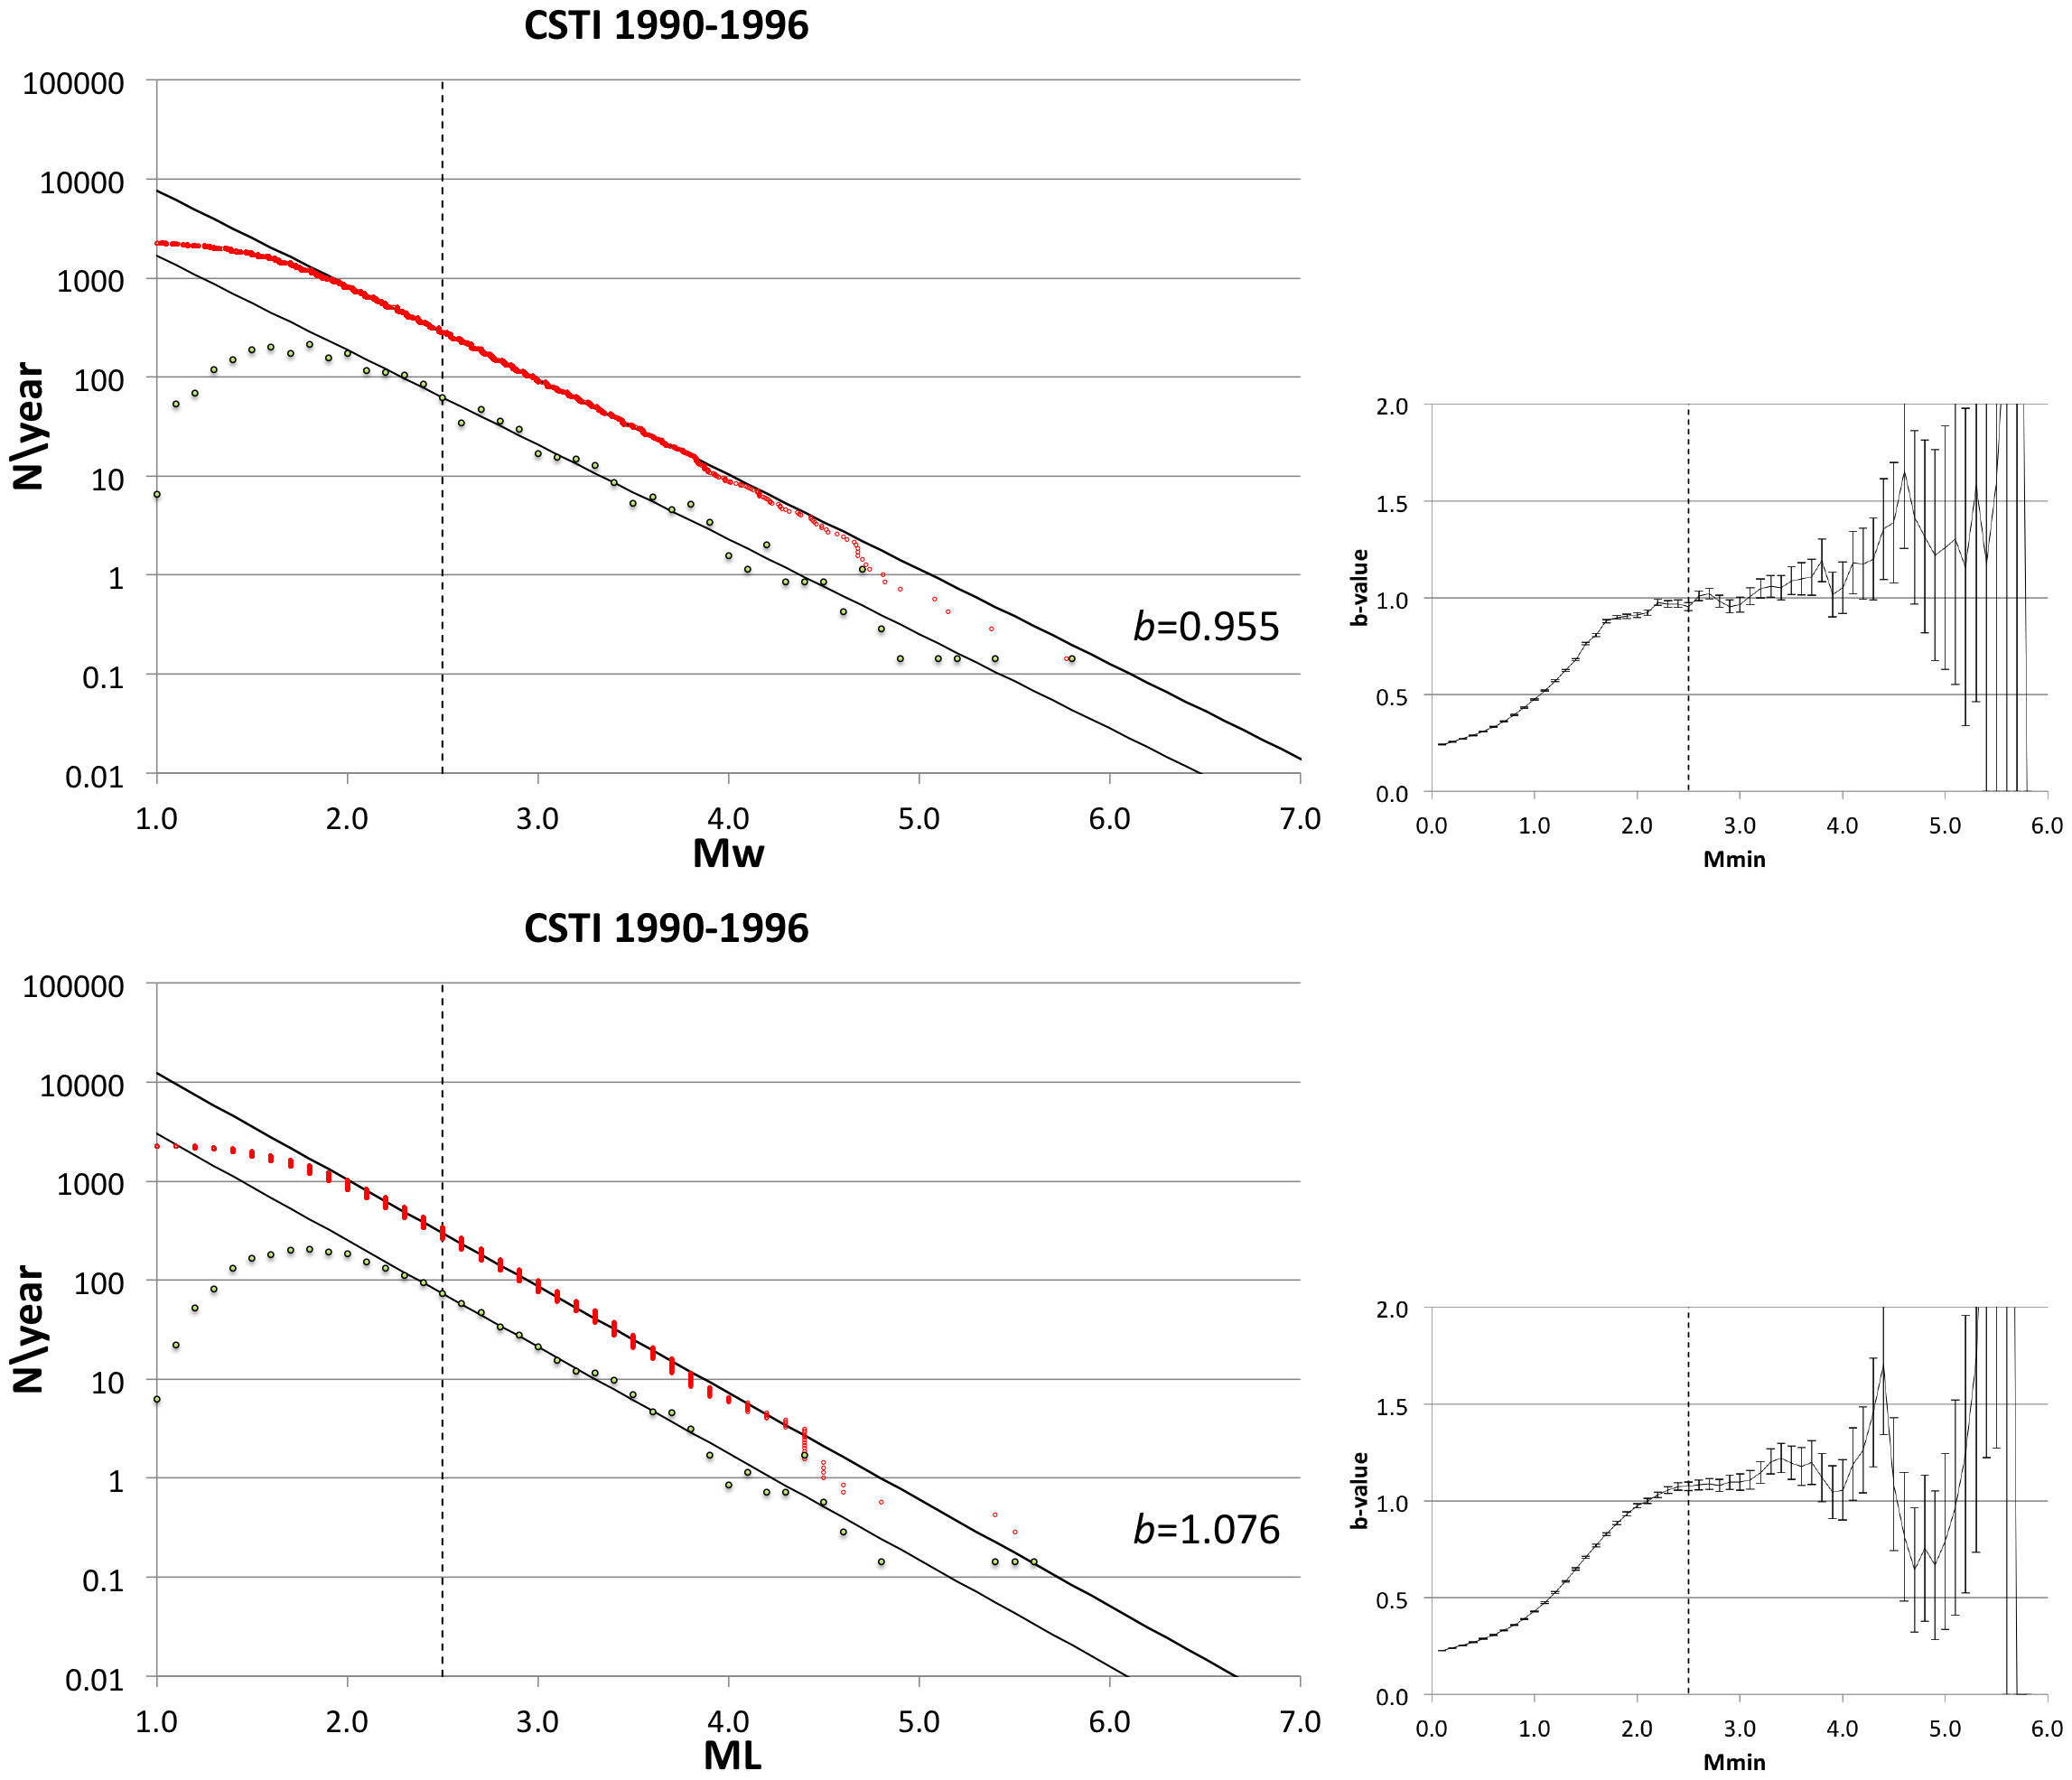
▲ Figure S15. Same as Fig. S14 but for the time interval from 1990 to 1996.
For the CSI dataset, we can note in Fig. S16 a clear slope change and rates lower than predicted for magnitudes larger than about 4.3 for both the revalued (top) and the original datasets (middle) but while for the former dataset, the rates remain below the G&R line up to the maximum magnitude (about 6.0), for the latter the observed rates overestimates the predicted one for ML>5.0.
We indicate different completeness thresholds for the revalued (Mw≥2.5) and the original (ML≥2.2) datasets because the calibration correction consisted essentially of a uniform up shift of about 0.3 units. Such simple shift also implies that the b-values are very similar among the two datasets and that the rates of the revalued Mw dataset are larger of a factor of about 2 than that of original ML dataset. The rates of the revalued Mw dataset are also definitely larger than the rates of the CSTI in the time interval 1981 to 1996. This might indicate that the time interval from 1997 to 2002, characterized by the occurrence of several long aftershock sequences (e.g. Umbria-Marche 1997-1998 and Appennino Romagnolo in 2000), was more productive than the previous one but it might even evidence some inconsistency of our magnitude revaluation.
To better understand this point we display in bottom panels of Fig. S16 the same plots for a dataset obtained by substituting the available direct Mw estimates in the original ML dataset. We can note how the G&R line in this case tends to underestimate the observed Mw rates for ML>4.0. This behavior is clearly inconsistent from the physical point of view; then, we can be confident that or magnitude revaluation is reasonably consistent with real Mw data and that the change of slope for Mw>4.3 and the rates higher than in the previous time periods are real properties of the seismic release in Italy in the time interval 1997-2002.
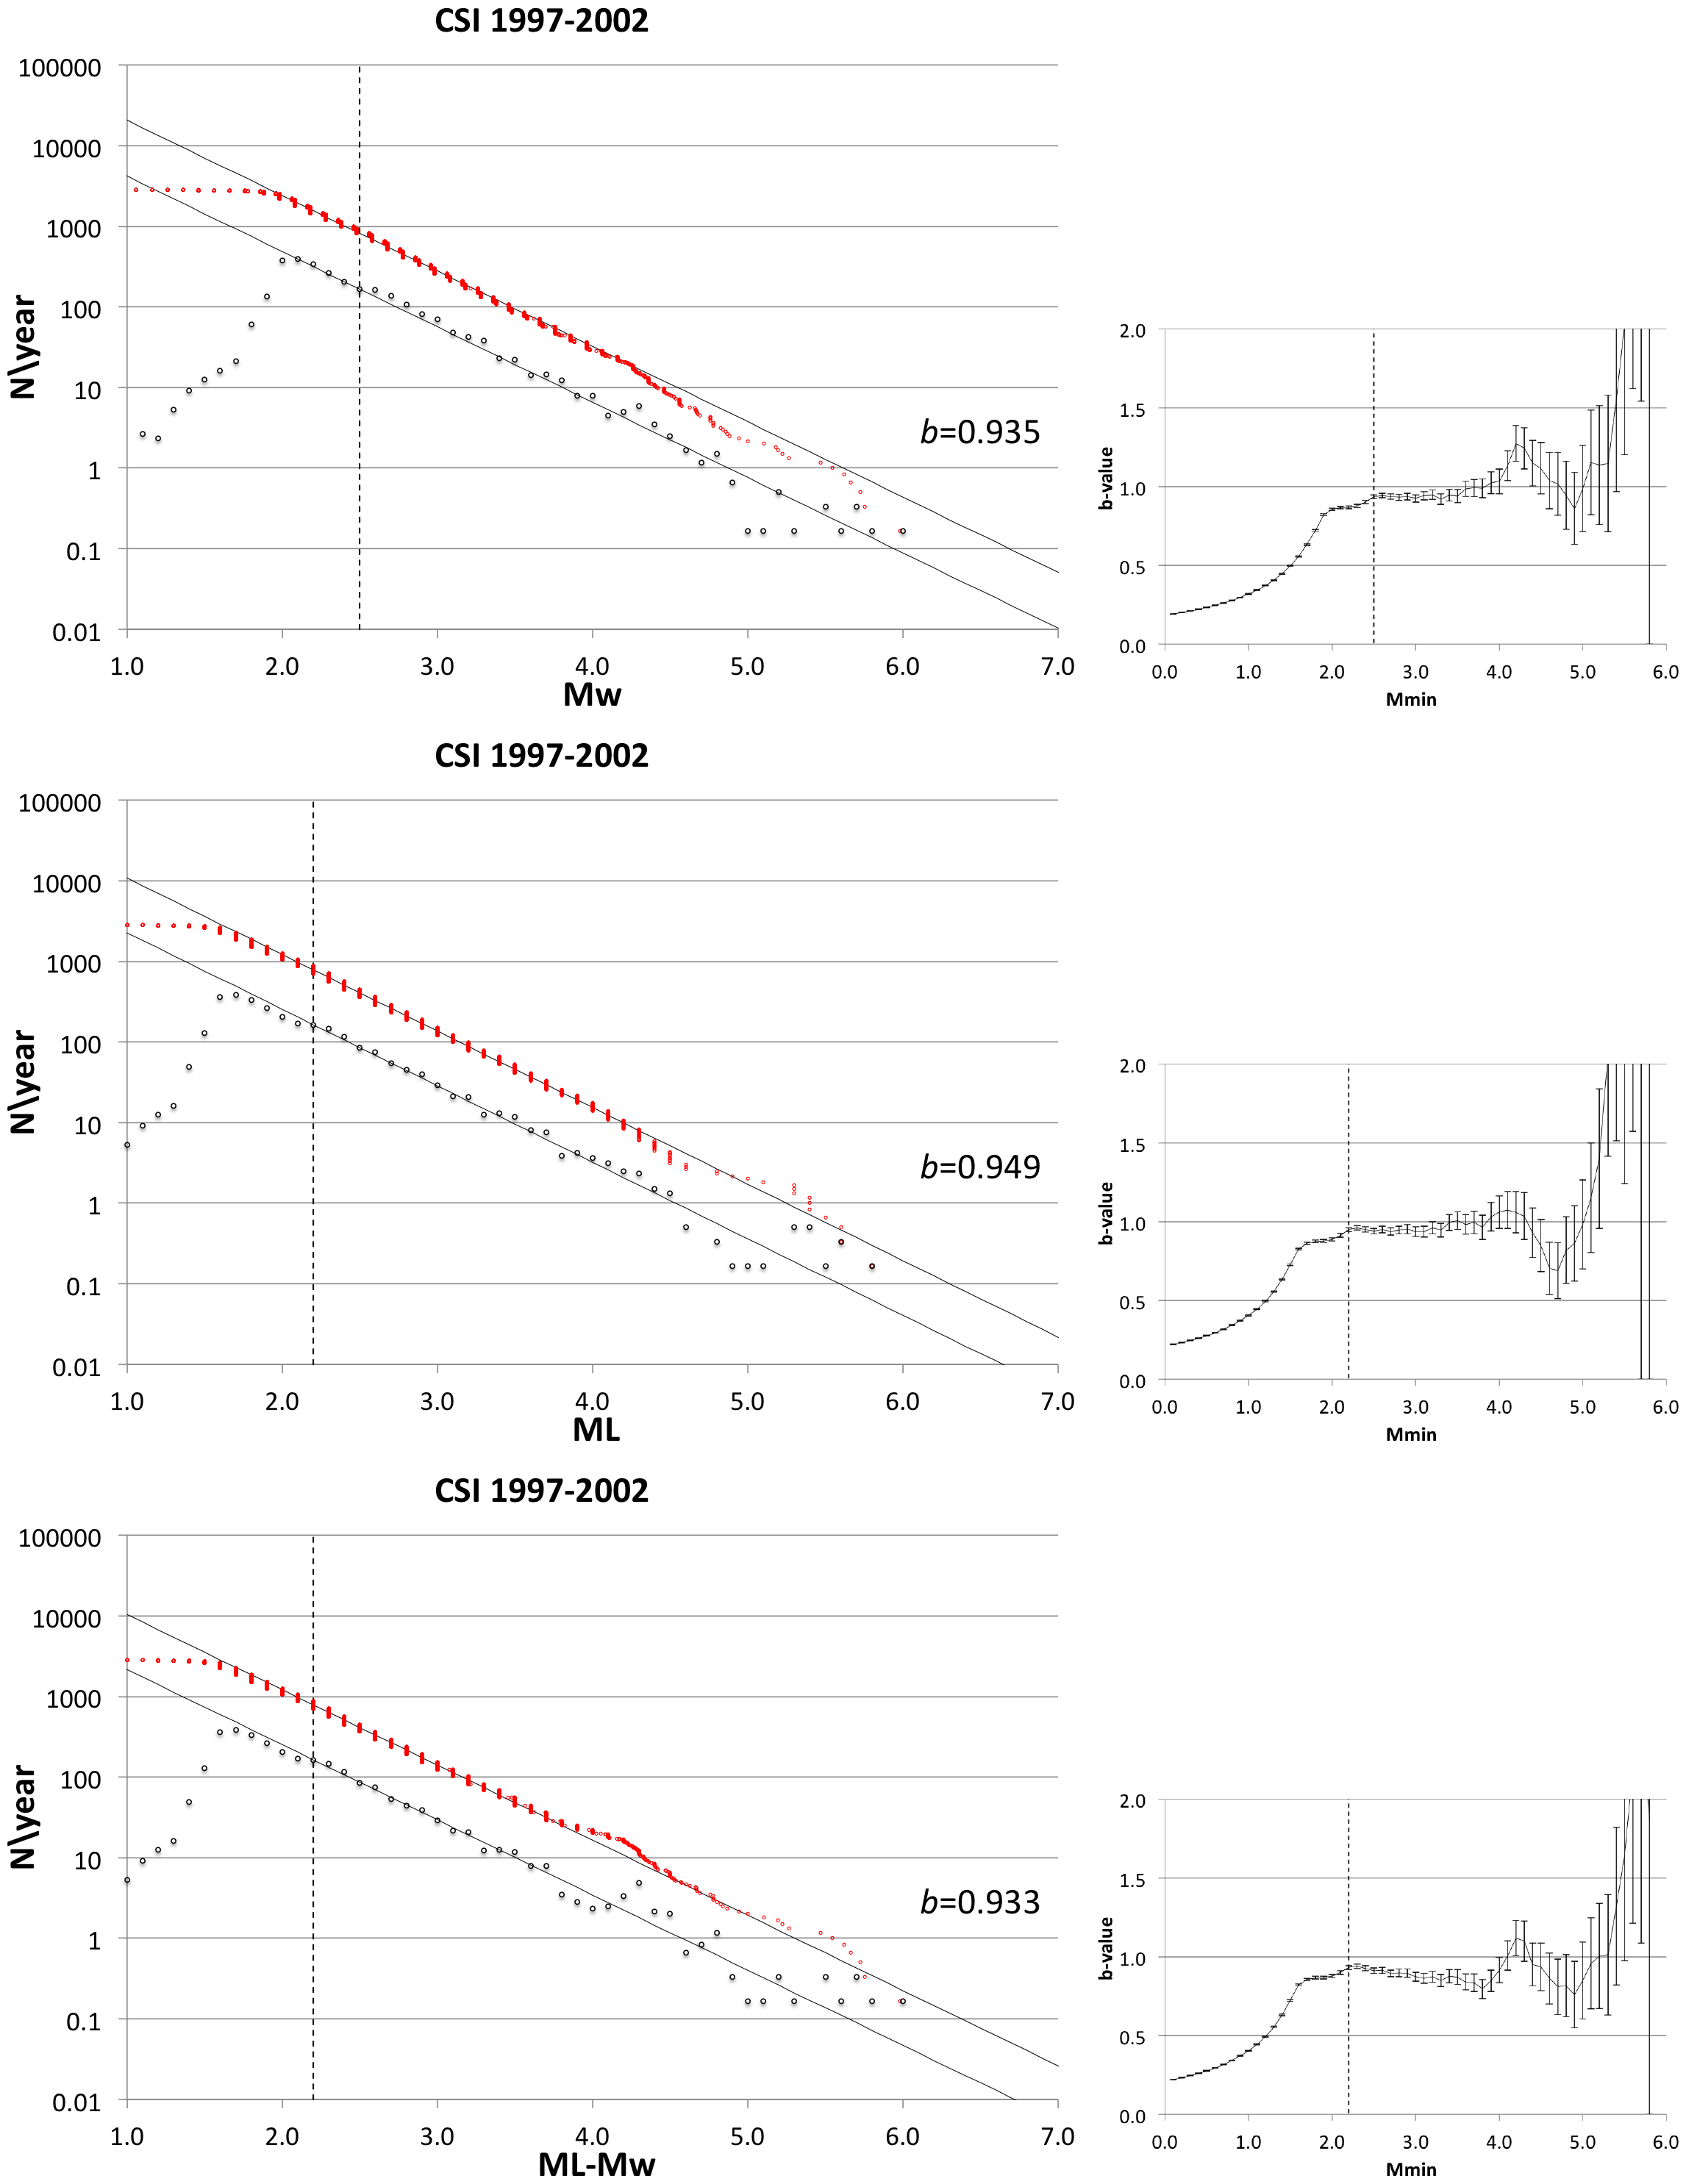
▲ Figure S16. Frequency-magnitude plots for the CSI dataset from 1997 to 2002. Symbols as in Fig. S14. Top panels refer to Mw revalued according to the calibration equations deduced in this work, middle panels to the original ML dataset and bottom panels to the original ML dataset integrated with true Mw estimates.
For the BSI revalued Mw dataset (Fig. S17 top) the G&R plot indicates a b-value close to 1 and a rather linear decay of rates for Mw>2.1. The original ML dataset (bottom) shows instead a very high b-value for ML>2.5 and a marked slope change around ML=3.5 that is reasonably the effect of the mixing of well calibrated ML (mostly larger than such threshold) with very badly calibrated Md (computed from the formula by Console et al., 1989), mostly lower than that threshold. Moreover for the revalued Mw dataset the behavior of the b-value as a function of Mmin (top right) is definitely more stable as a function of cut-off magnitude Mmin than for the original ML (bottom right).
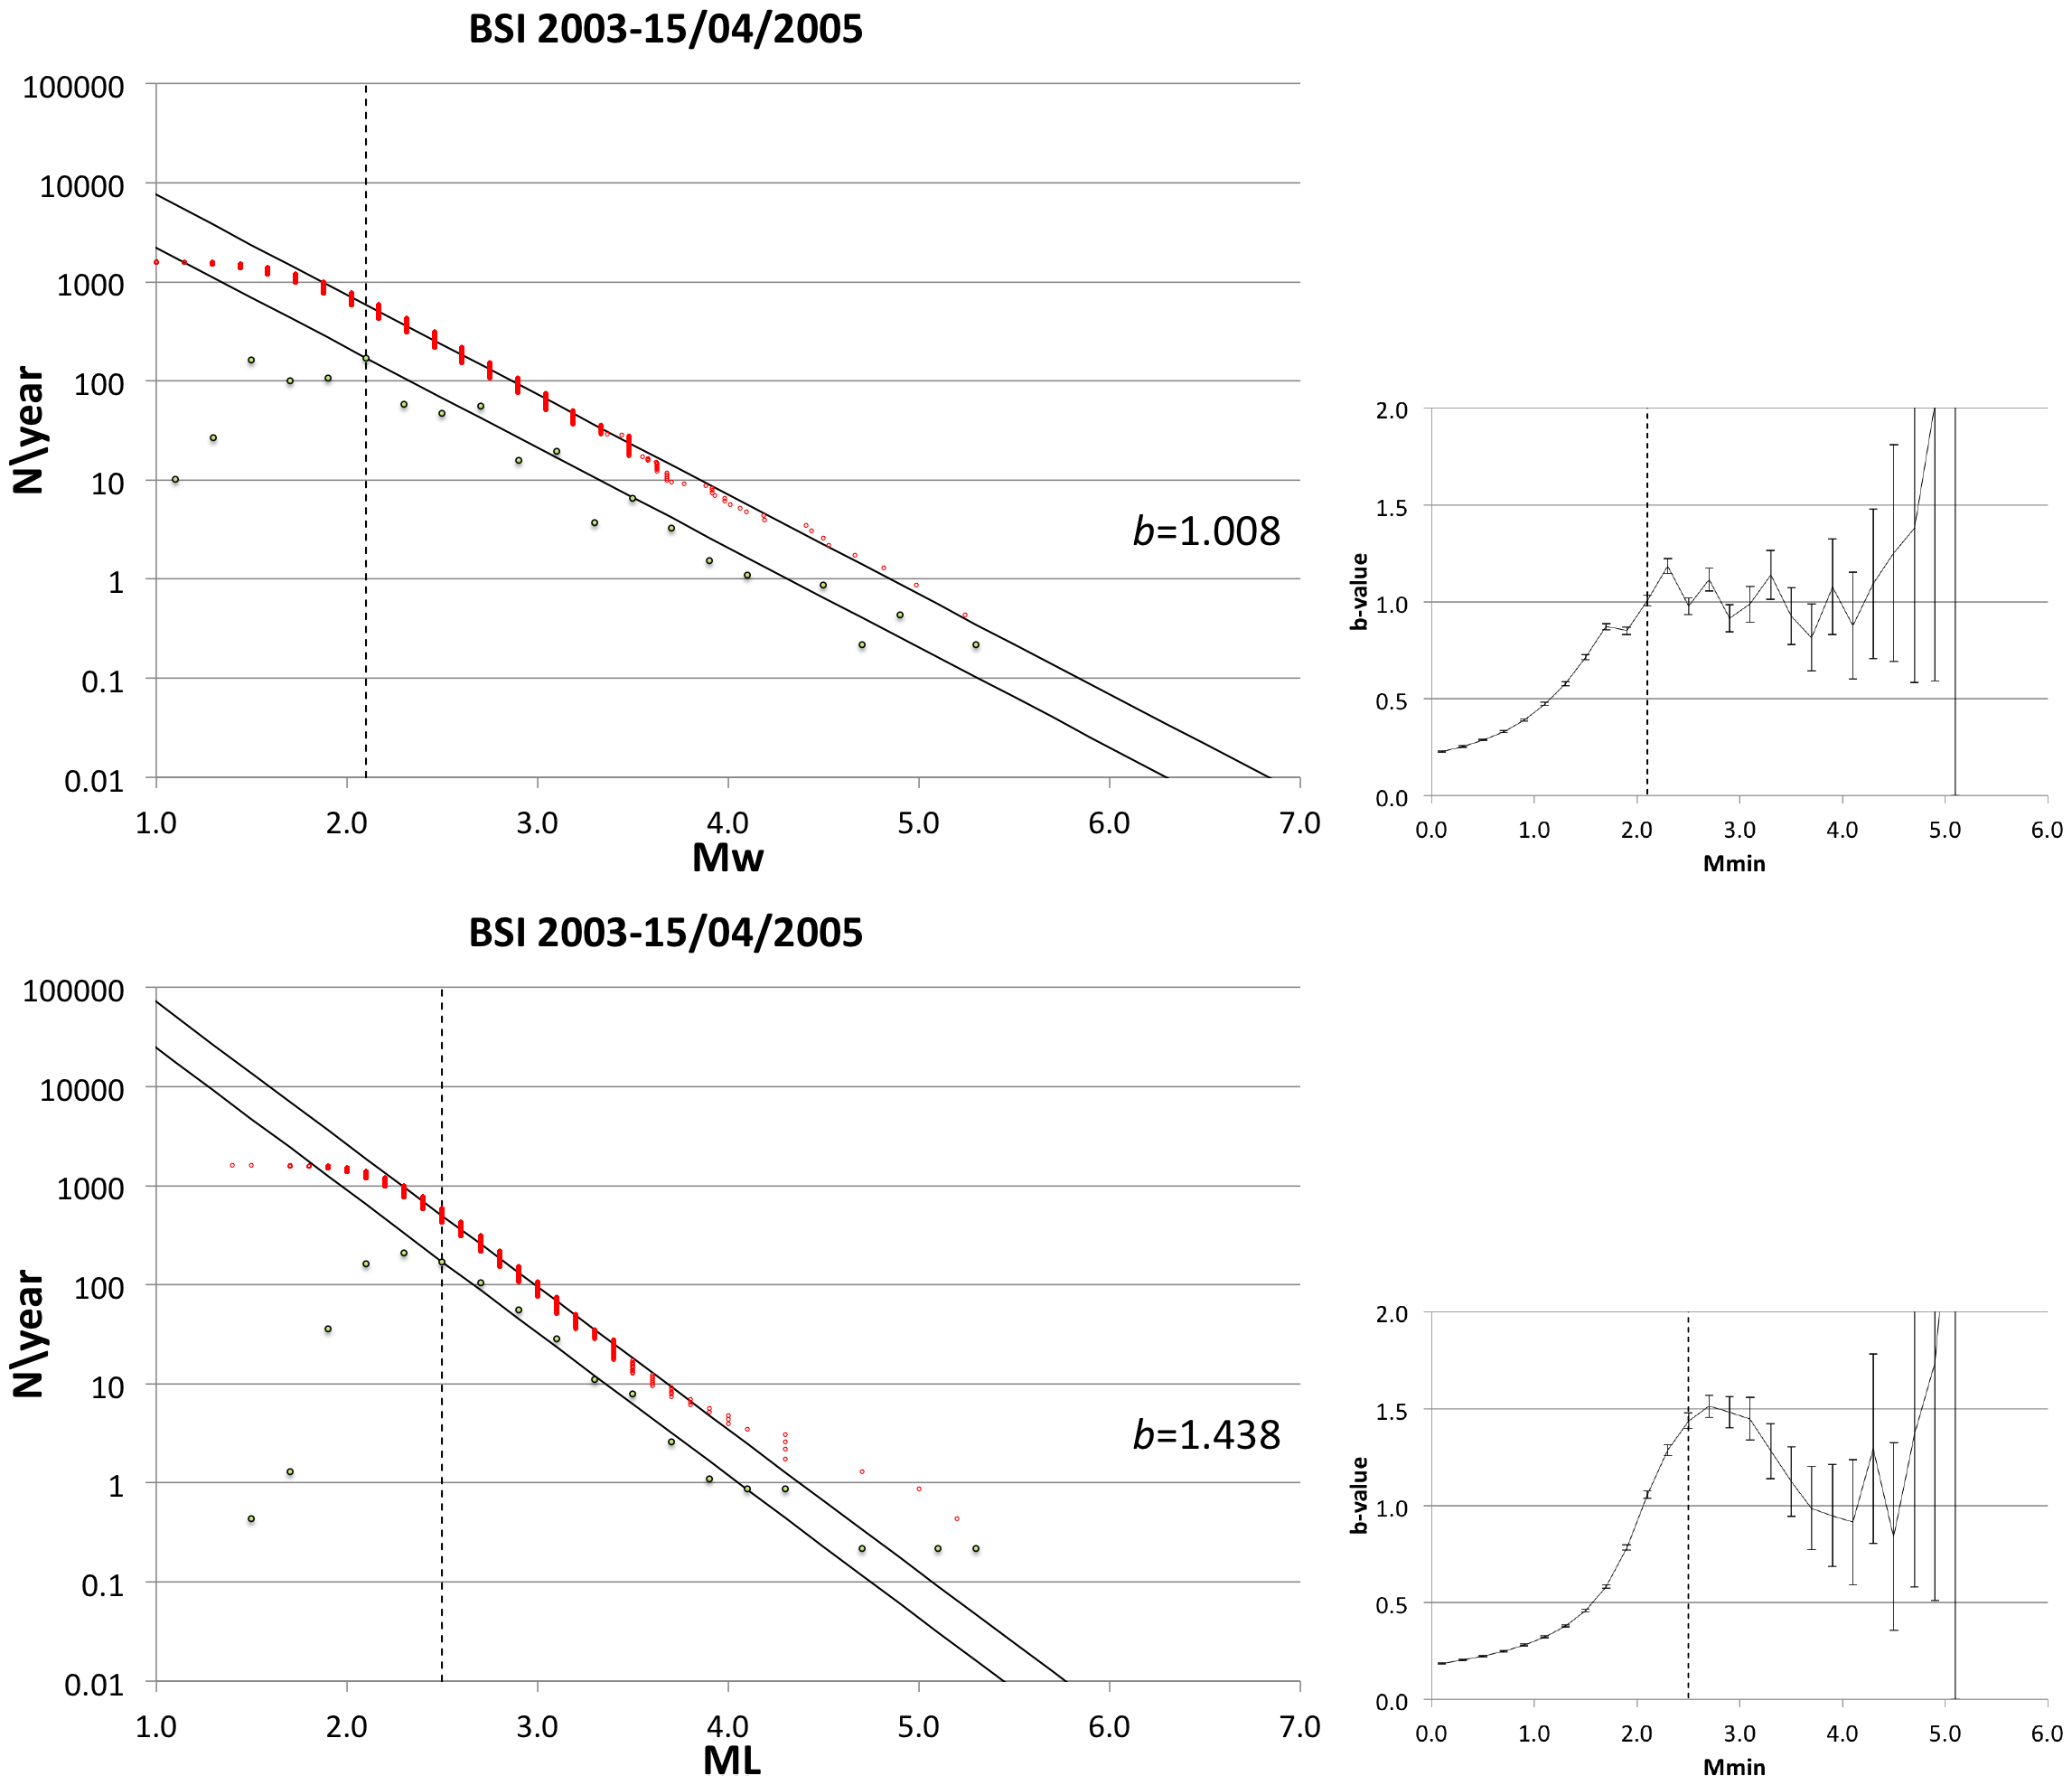
▲ Figure S17. Frequency-magnitude plots for the BSI dataset from 2003 to 15/04/2005. Symbols as in Fig. S14. Top panels refer to Mw revalued according to the calibration equations deduced in this work and bottom panels to the original ML dataset.
For the ISIDE dataset we compare in Fig. S18 the revalued Mw computed as weighted average of Mw proxies computed from both ML and Md (top) with that computed from ML only when such magnitude is available (bottom). We can see that the former approach makes the b-value more stable with respect to Mmin and hence it has to be preferred with respect the latter. For an Mmin=1.8 the b-value is slightly smaller than 1.0 and the G&R plot is reasonably linear excepting for the interval 3.5<Mw<4.5, where the slope is slightly lower than average, and the interval 4.0<Mw<4.5, where it is slightly higher than average.
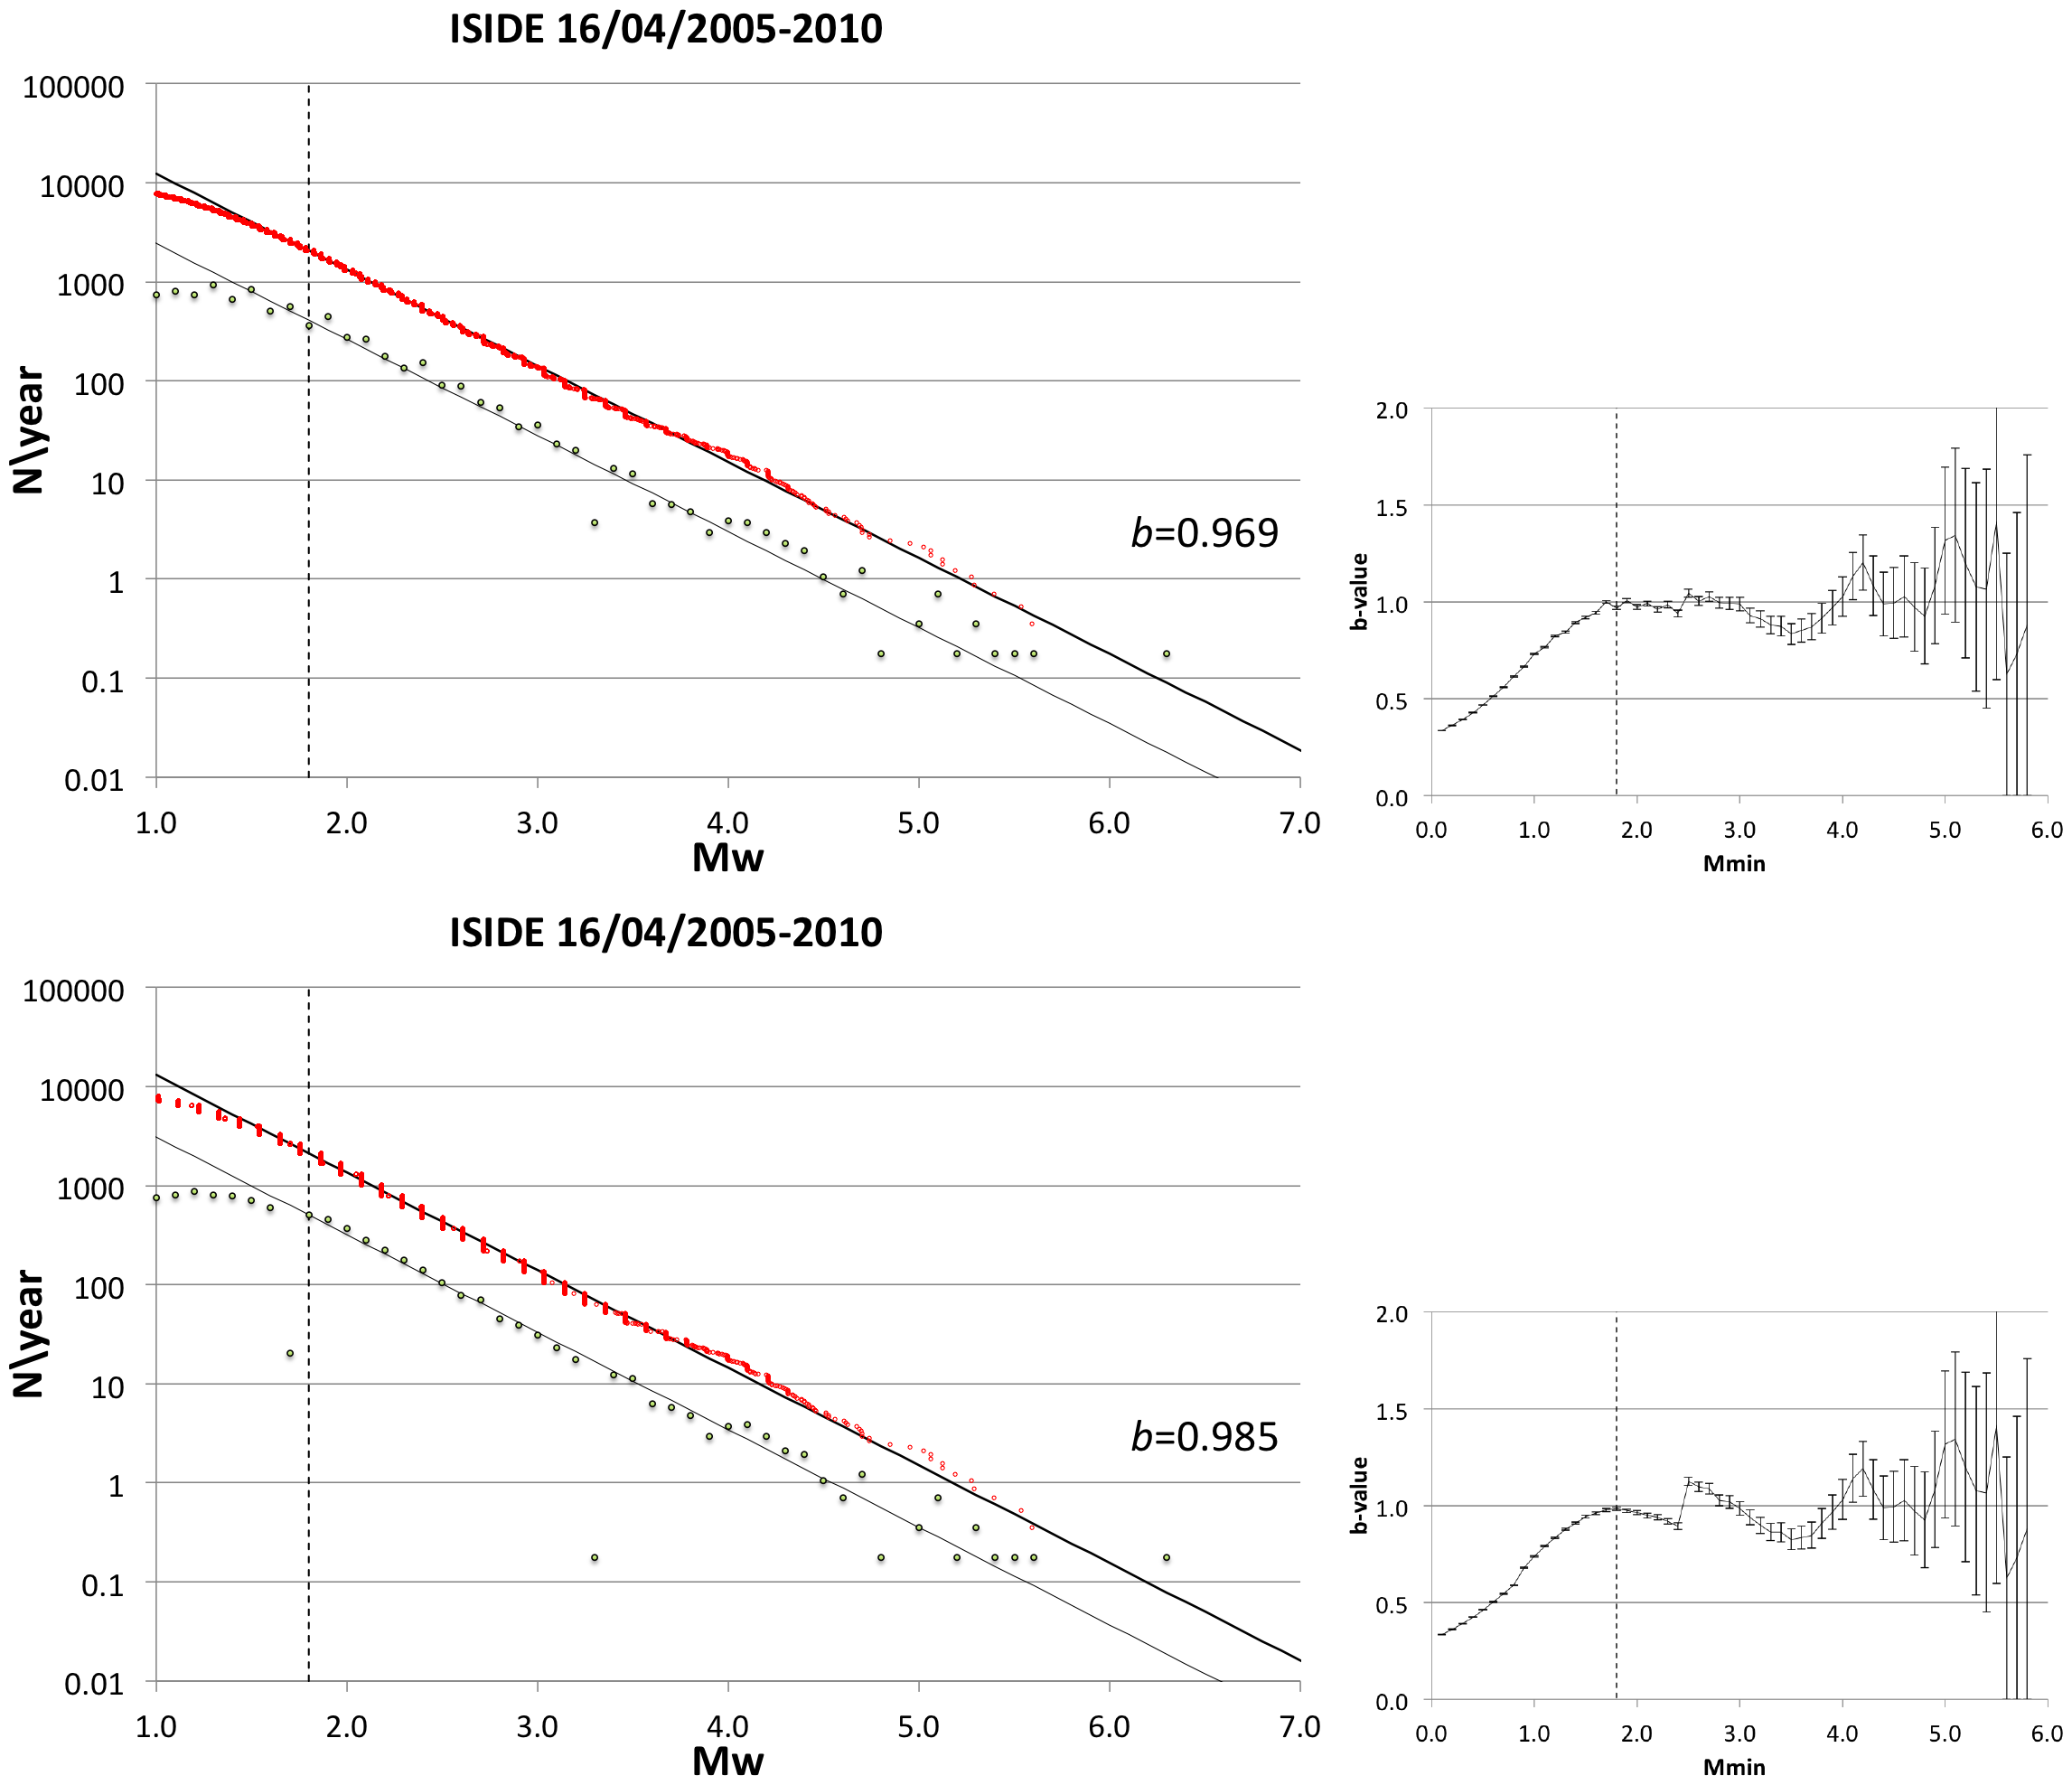
▲ Figure S18. Frequency-magnitude plots for the ISIDE dataset from 16/04/2005 to 2010. Symbols as in Fig. S14. Mw revalued as the weighted average of Mw proxies computed from ML and Md (top panels) or from ML only when available (bottom panels).
This non-linearity, which might be related to the use of the Hutton and Boore (1987) distance correction function, also characterizes the G&R plot of the original ML dataset (Fig. S19 top) where all the rates for M>4.0 are larger than predicted. This underestimation of the G&R straight line is even more evident in the dataset obtained by substituting the available direct Mw estimates into the original ML dataset (Fig. S19 bottom). In both cases the b-value is definitely larger than 1.0 for most Mmin thresholds.
We can note that, in contrast with the CSI, the CSTI and to a lower extent with the BSI dataset, the revalued ISIDE dataset does not evidence a decrease of the rates below the G&R line for magnitudes larger than 4.3-4.5 but rather a slight increase of them for Mw>4.0. As the ISIDE dataset includes the particularly productive sequence (Lolli et al., 2011) occurred after the L'Aquila 6 April 2009 mainshock (Mw=6.3), we also analyzed the data before and after such strong event separately.
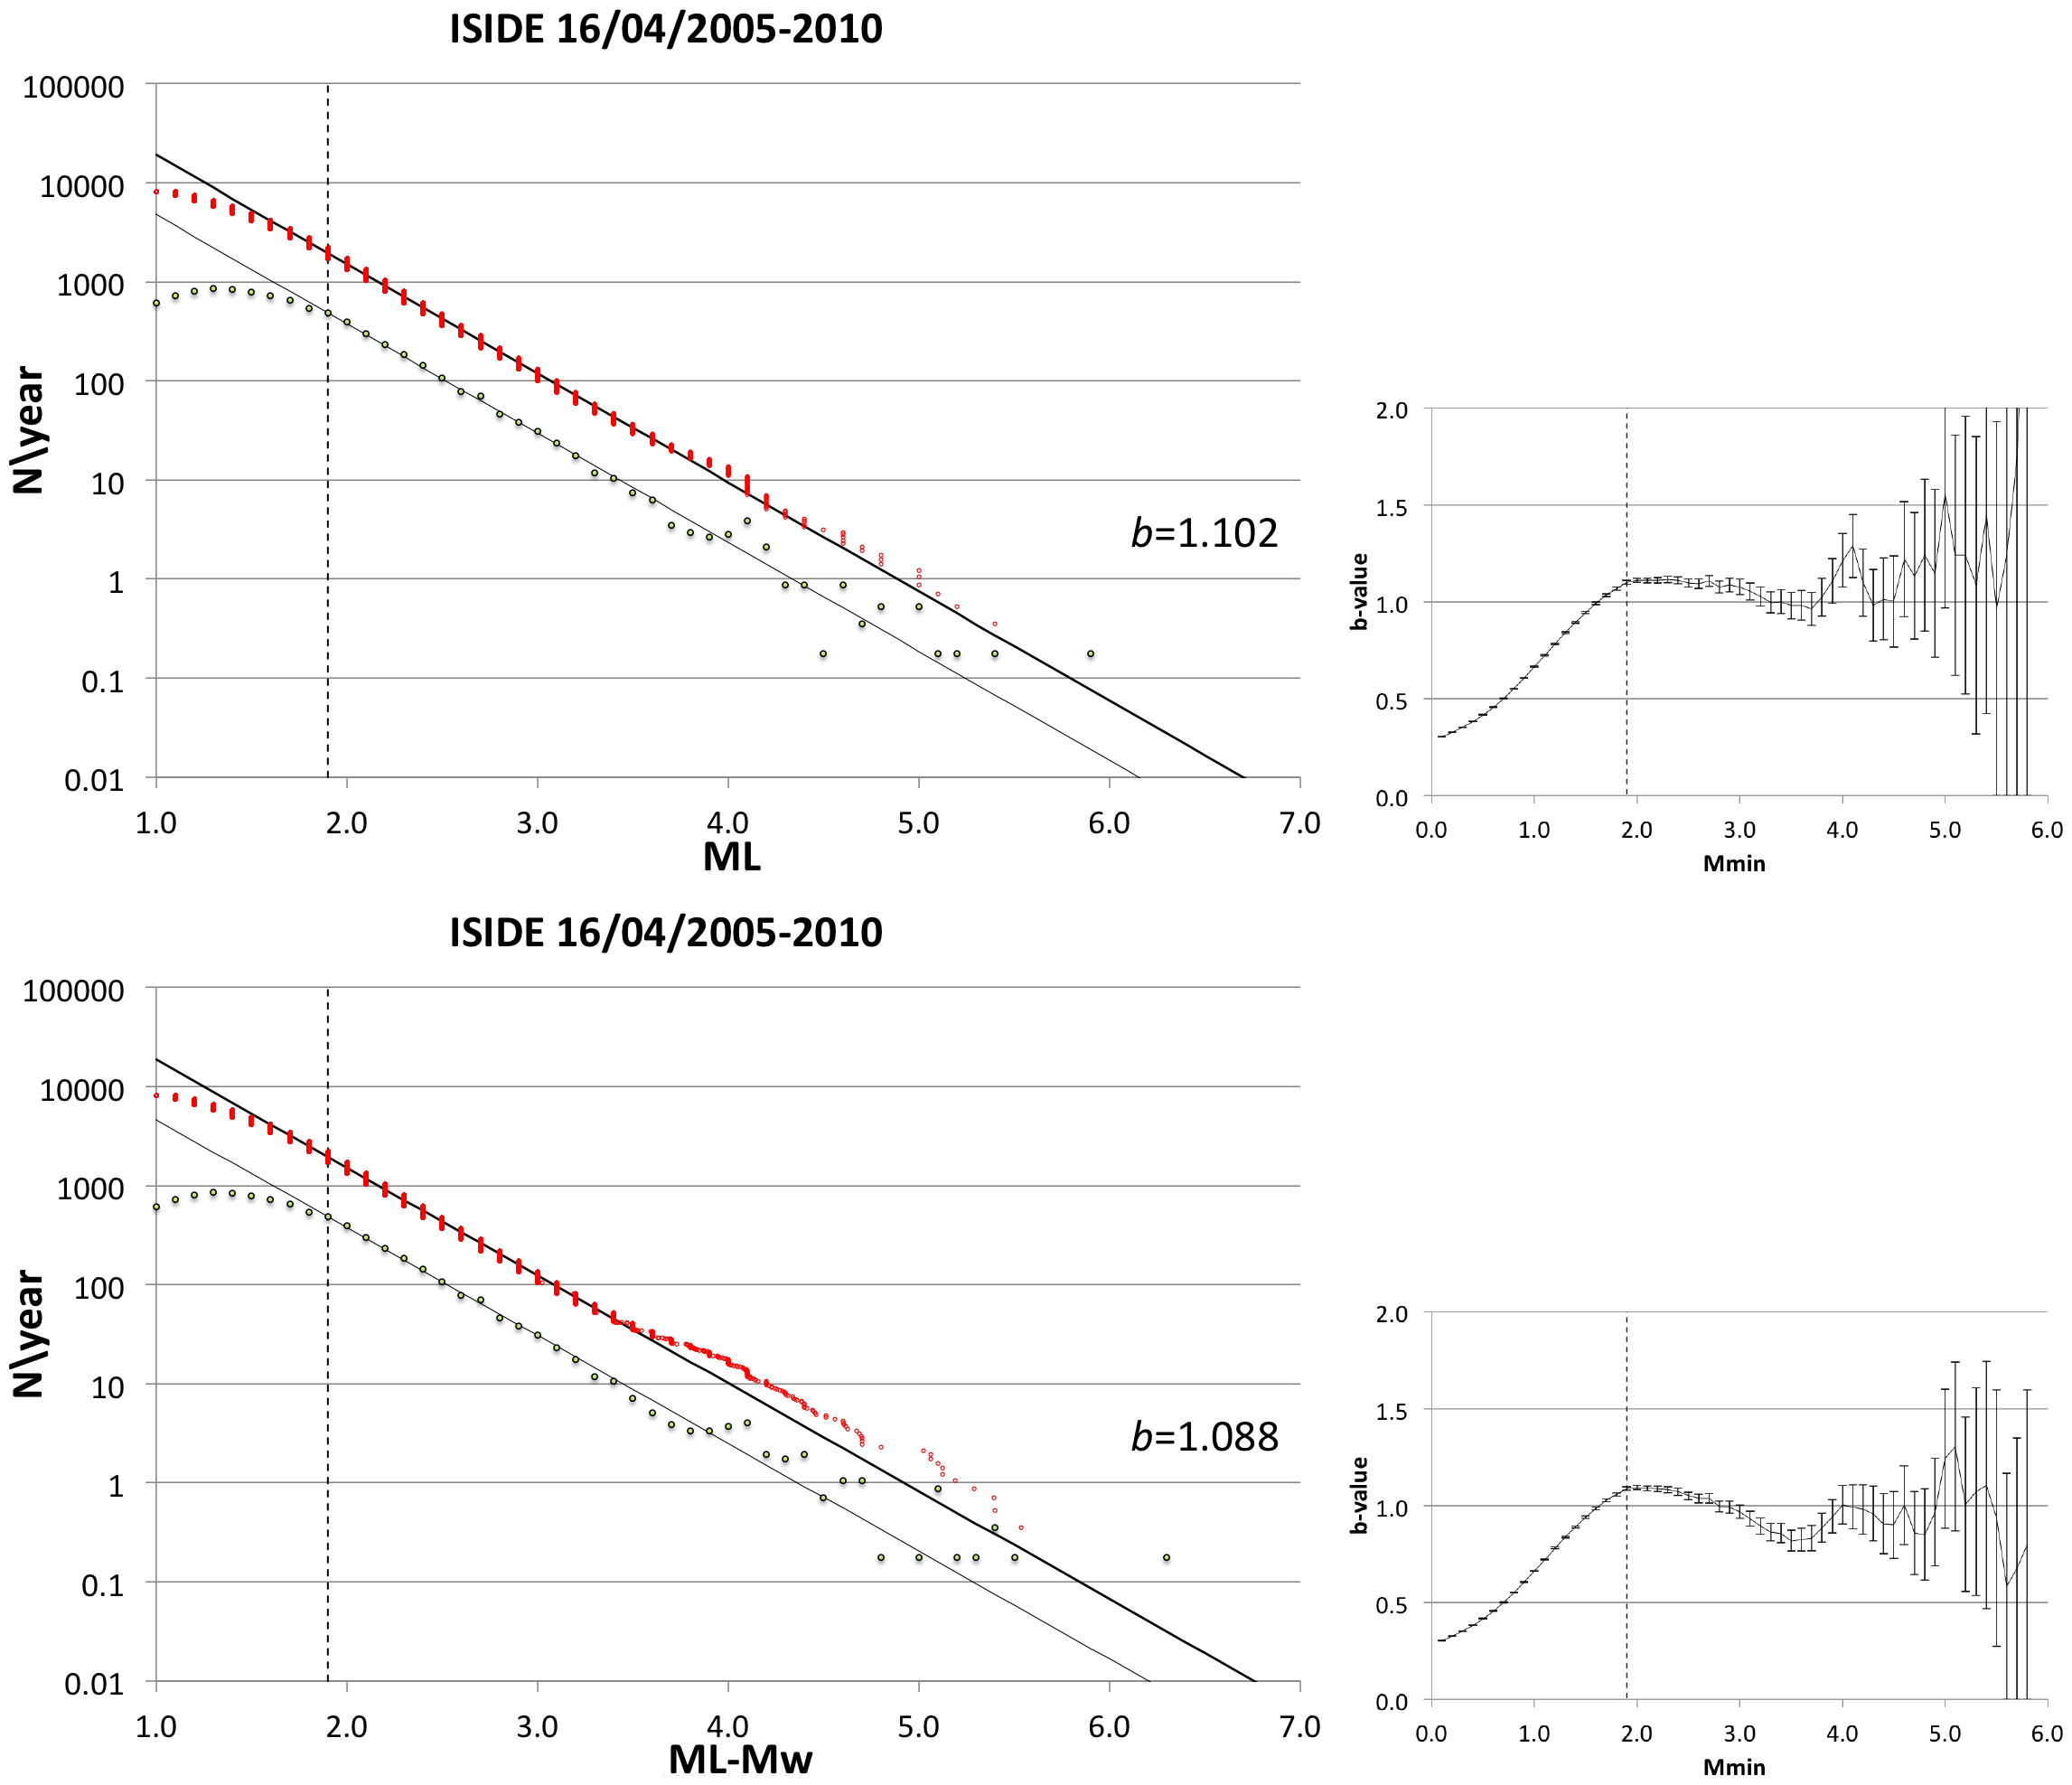
▲ Figure S19. Frequency-magnitude plots for the ISIDE dataset from 16/04/2005 to 2010. Symbols as in Fig. S14. Original ML (top panels) or ML integrated with true Mw estimates (bottom panels).
The comparison between the former and the latter time intervals (Fig. S20), indicates that probably something changed in the Italian seismicity or in the characteristic of the INGV seismic detection system after the L'Aquila earthquake. We can note in fact that for the data recorded before (Fig. S20 top), the rates decrease below the G&R line for M>4.3 as for previous datasets whereas they remain above such line for the data after the L'Aquila earthquake (Fig. S20 bottom). We could argue that during the L'Aquila sequence and for some months after it, the threshold magnitude for detecting, locating and sizing earthquakes in Italy was somehow larger than before thus producing some inconsistency between the rates of large and small earthquakes.
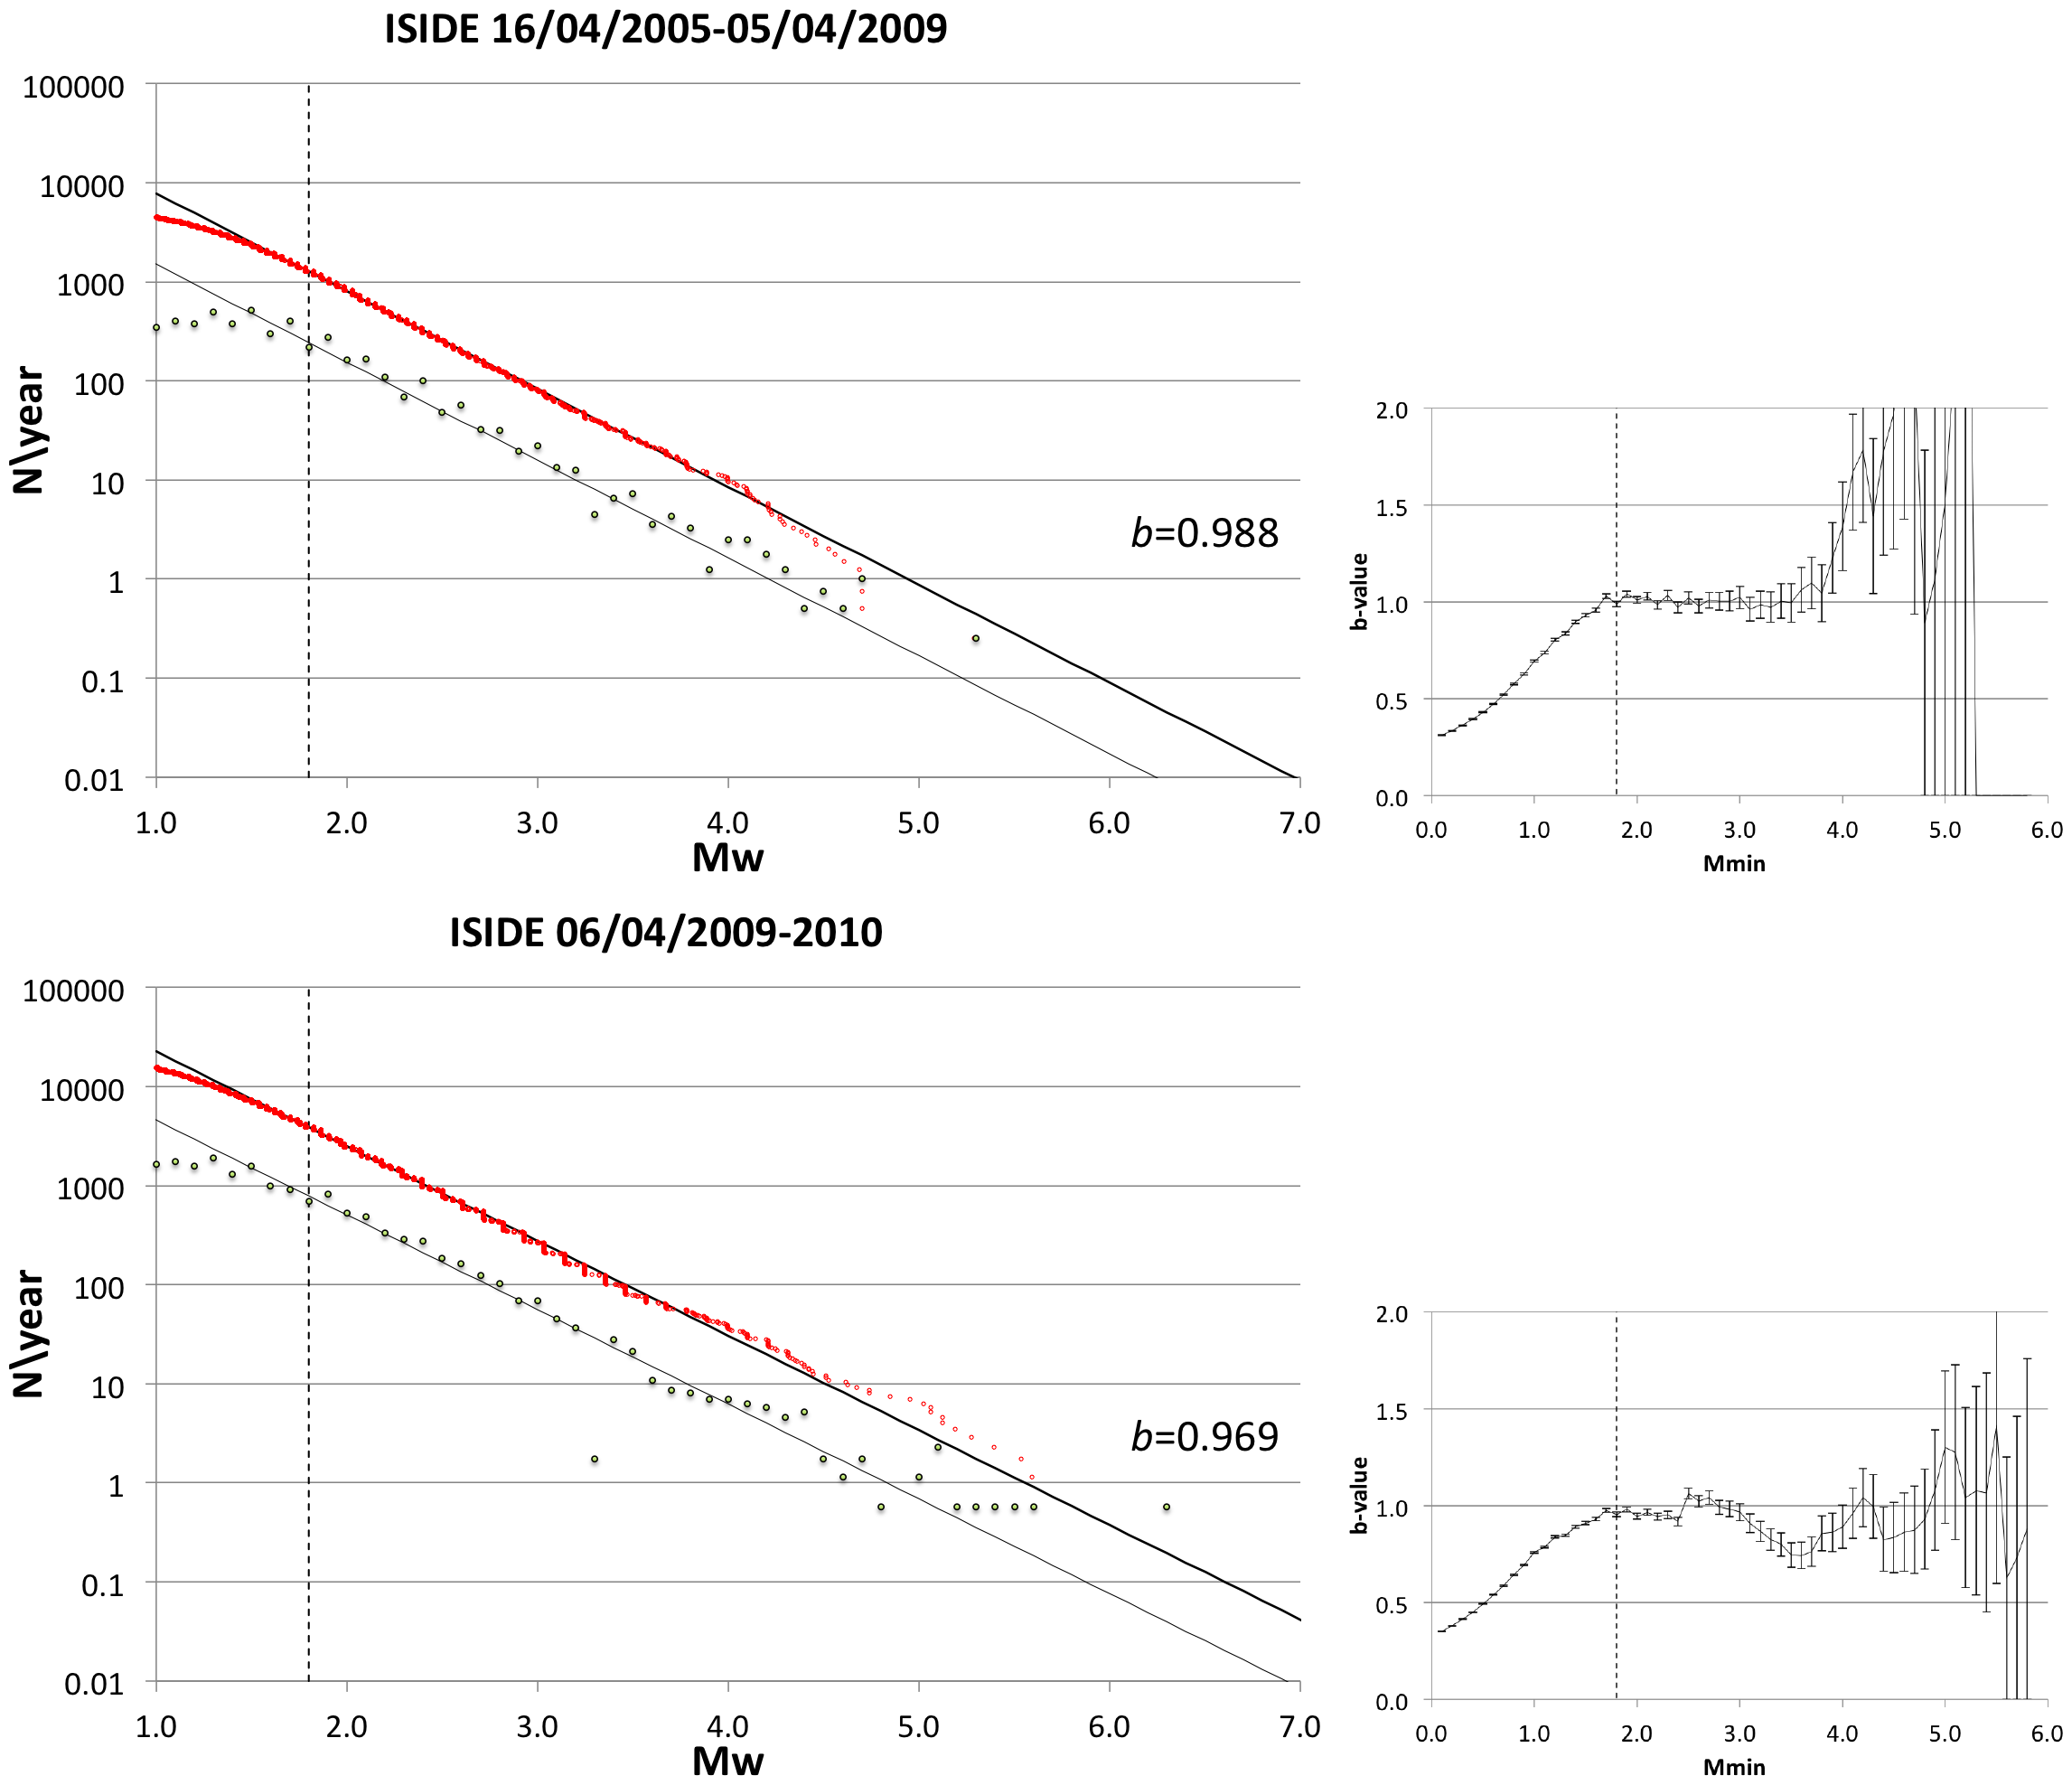
▲ Figure S20. Frequency-magnitude plots for the ISIDE dataset before (top panels) and after (bottom) the L'Aquila 6 April 2009 main shock. Symbols as in Fig. S14.
[ Back ]