This electronic appendix provides additional supporting information and further explanation to the input data, methodology and results presented in the main paper. A brief explanation of each one of the figures that constitute this supplement has been extracted from the paper and reproduced in this electronic supplement.
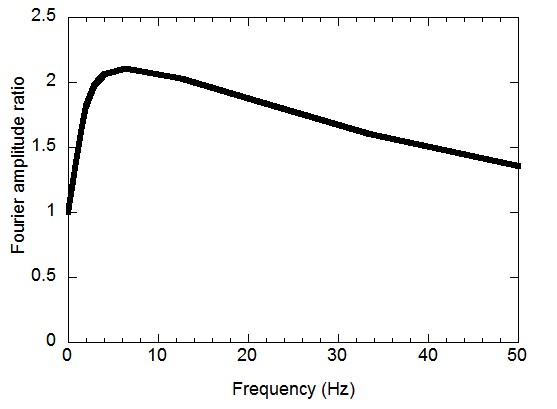
The generated site class A motions are converted to NEHRP B/C boundary motions using the transfer function from Frankel et al,. (1996) shown in Figure E1 to establish a comparison with USGS B/C boundary ground motion parameters
Figure E1 Transfer function to convert motion from Site Class A to Site Class B (B/C boundary) Frankel et al. (1996)
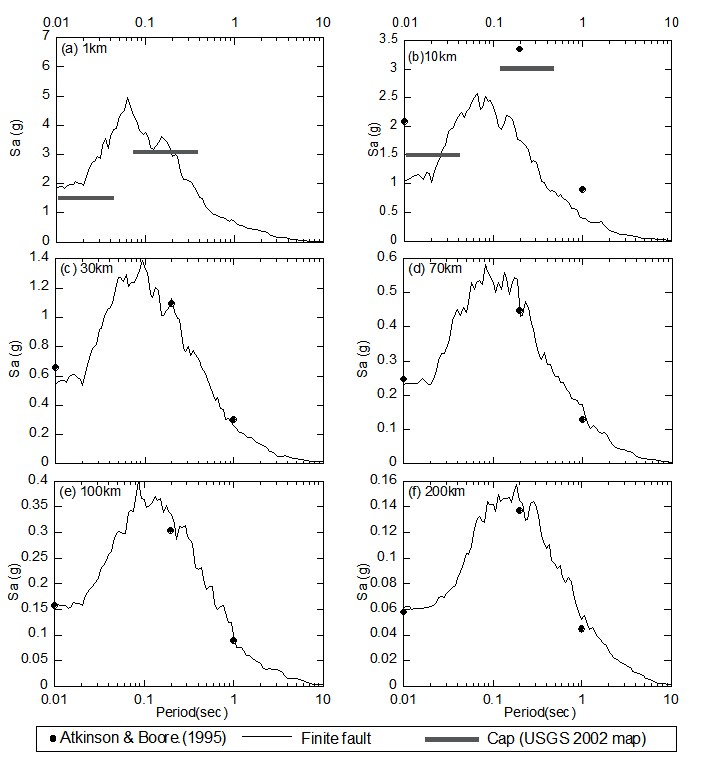
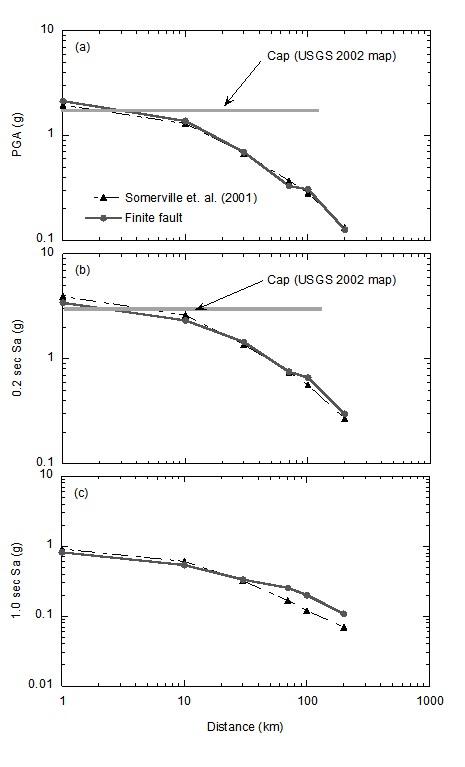
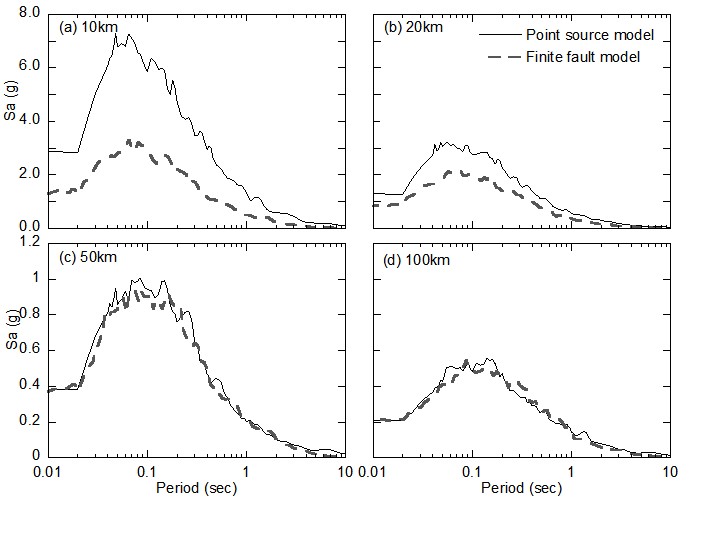
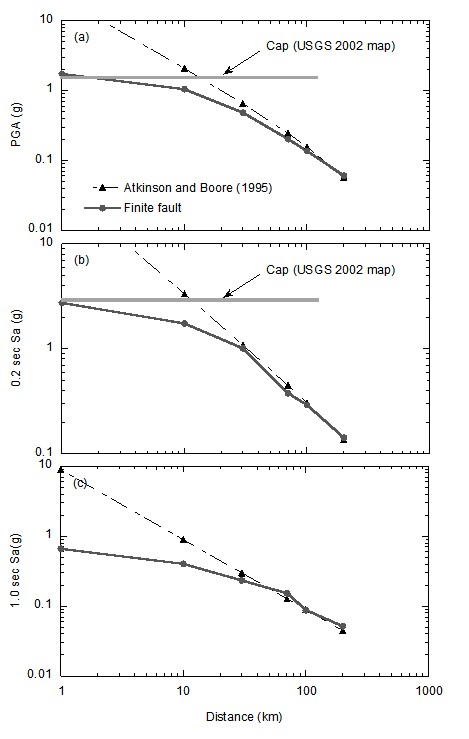
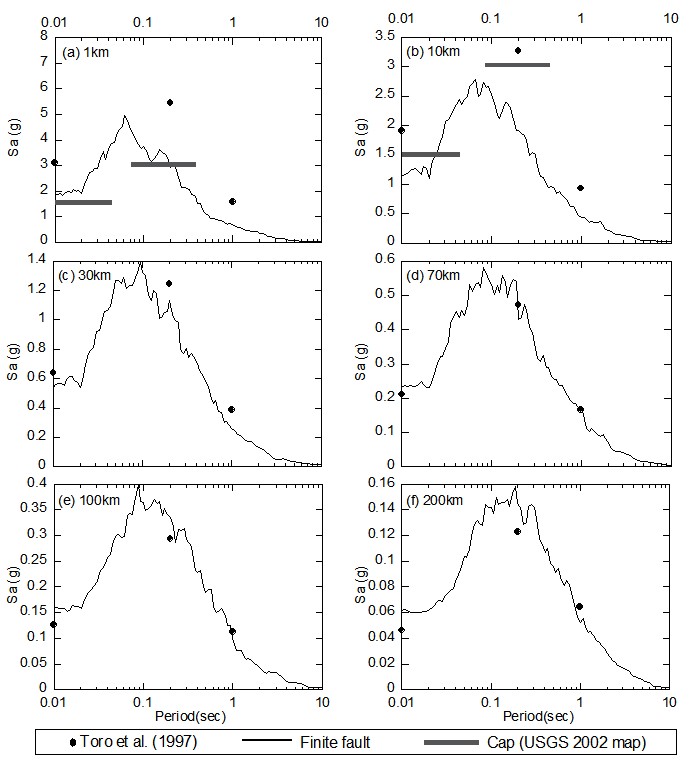
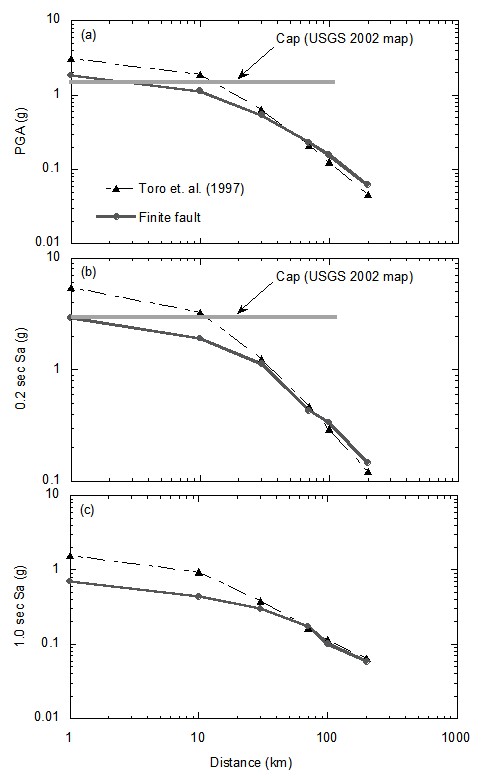
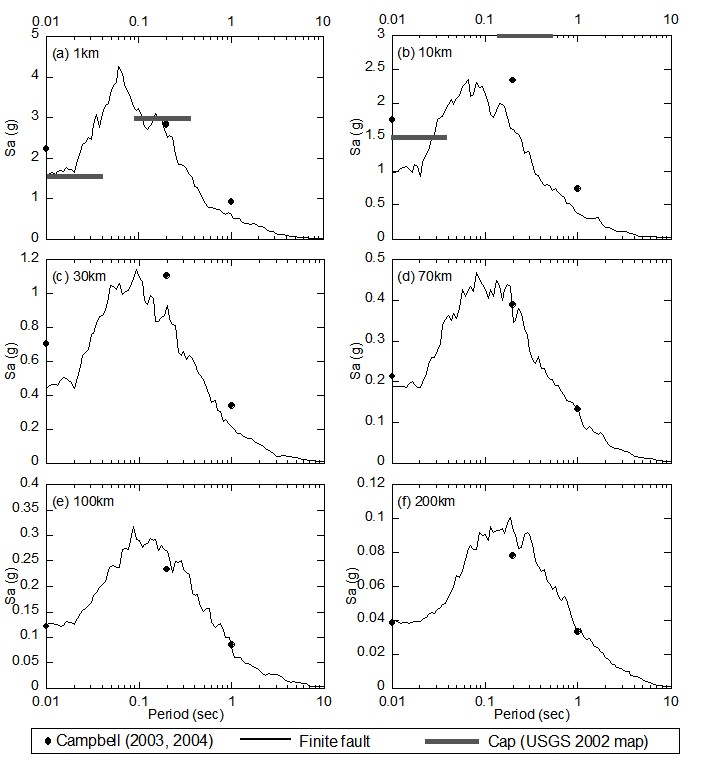
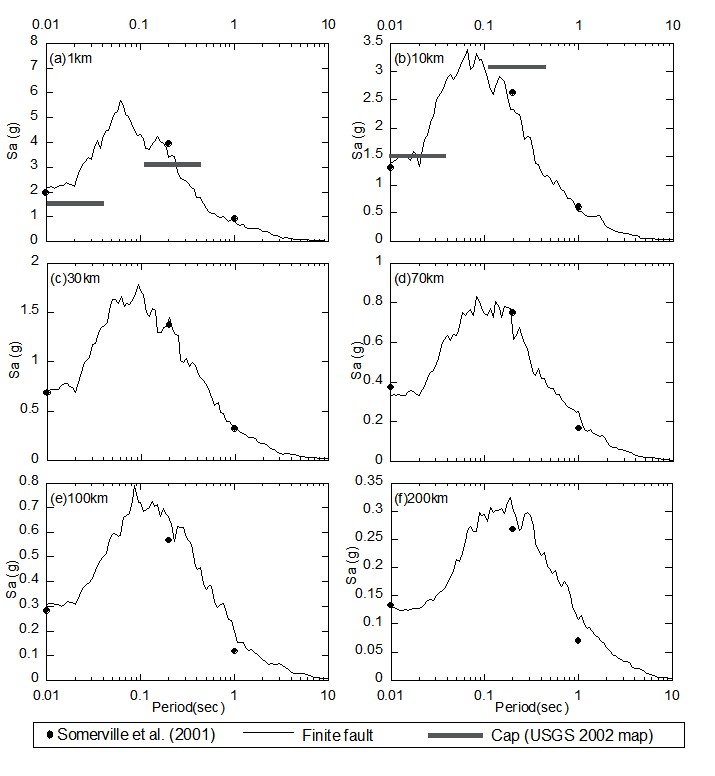
A similar comparison to the one shown in Figures 2 and 3 of the main document are presented in Figures E2 to E9 for the other four attenuation relationships. Figure E10 compares the response spectra of generated motions for a scenario event of Mw 7.7 from the finite-fault and point-source models at selected epicentral distances. Both models use the input parameters representing the Frankel et al. (1996) attenuation relationship as listed in Table 4 and Table 5 to simulate 5 ground motion time histories for developing mean response spectra at the B/C boundary. Near the fault, the point-source model generates extremely high motions due to the release of the energy at a single point. The finite-fault model simulates the rupture over a finite area and distributes the energy release along the entire fault plane. As a result, even if the site is close to the fault, the finite-fault model generates more reasonable motions. As epicentral distance increases, motions generated by the finite-fault model gradually approach those generated from the point-source model whereby the fault extent is no longer significant. Note that in FINSIM the single-corner point-source model is used to represent each subfault. Therefore, simulated motions by FINSIM approach those of the single-corner point-source model at large epicentral distances.
Figure E2 Comparison of finite-fault model simulation and Atkinson and Boore (1995) attenuation relationship at selected epicentral distances at B/C boundary for characteristic earthquake (Mw = 7.7). Values at R = 1 km not reported by Atkinson and Boore (1995)
Figure E3 Comparison of finite-fault model to represent Atkinson and Boore (1995) attenuation relationship for characteristic earthquake (Mw = 7.7), NEHRP B/C.
Figure E4 Comparison of finite-fault model simulation and Toro et al. (1997) attenuation relationship at selected epicentral distances at NEHRP B/C for characteristic earthquake (Mw = 7.7).
Figure E5 Comparison of finite-fault model to represent Toro et al. (1997) attenuation relationship for characteristic earthquake (Mw = 7.7), NEHRP B/C.
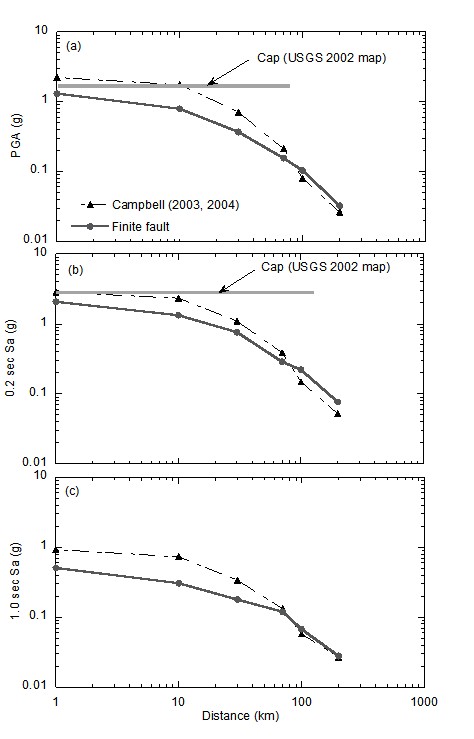
Figure E6 Comparison of finite-fault model simulation and Campbell (2003, 2004) attenuation relationship at selected epicentral distances at NEHRP B/C for characteristic earthquake (Mw = 7.7).
Figure E7 Comparison of finite-fault model to represent Campbell (2003, 2004) attenuation relationship for characteristic earthquake (Mw = 7.7), NEHRP B/C.
Figure E8 Comparison of finite-fault model simulation and Somerville et al. (2001) attenuation relationship at selected epicentral distances at NEHRP B/C for characteristic earthquake (Mw = 7.7).
Figure E9 Comparison of finite-fault model to represent Somerville et al. (2001) attenuation relationship for characteristic earthquake (Mw = 7.7), NEHRP B/C.
Figure E10 Comparison of response spectra of generated motions from finite-fault and point-source models at selected epicentral distances, M=7.7 event, NEHRP B/C.
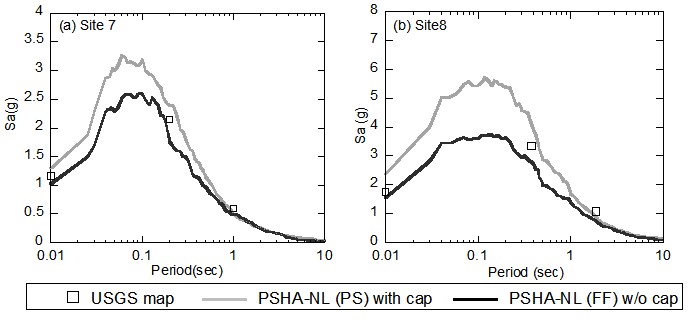
Figure E11 shows that the proposed method results in spectral accelerations more consistent with the 2002 maps for Sites 7 and 8 close to the assumed NMSZ faults which experience strong shaking.
Figure E11 Comparison of 2% probability of exceedance in 50 years simulated UHRS at NEHRP B/C in this study (PSHZ-NL [FF], and PSHZ-NL [PS] with cap, and PGA, 1s, and 0.2s Sa taken from 2002 USGS hazard maps at site 7 and Site 8.
Modified seismic hazard maps of Mississippi Embayment with soil column depth effects
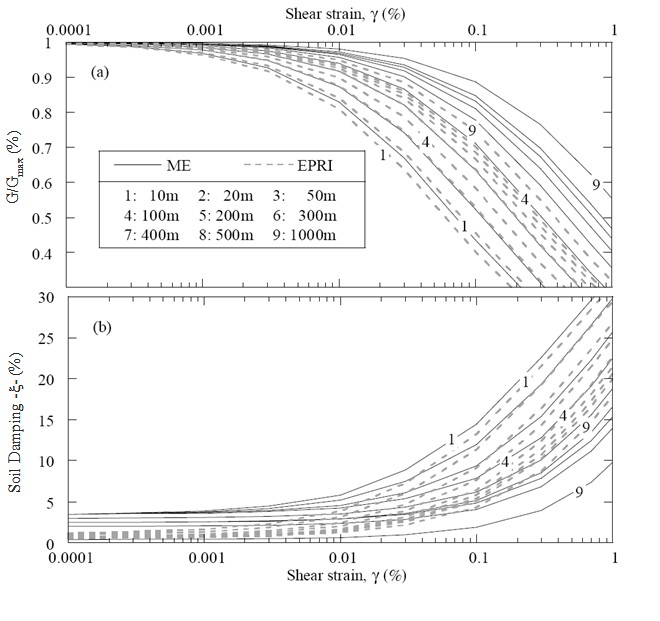
Figure E12 Mississippi Embayment properties (solid lines and termed ME) with the modified hyperbolic curves to fit EPRI curves (dashed lines and termed EPRI after Park [2003]).
Evaluation of PSHA –NL (PS and FF) depth-dependent site coefficients at Site 6
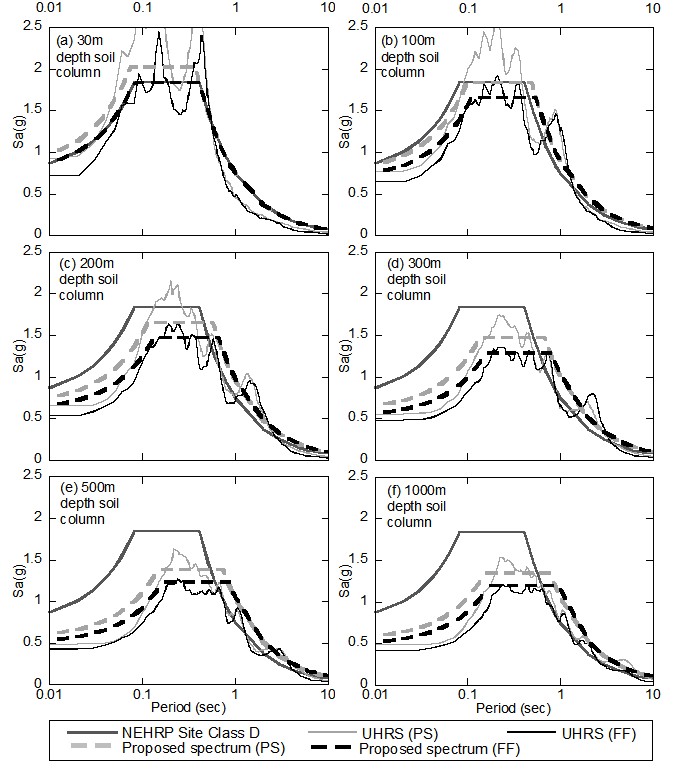
Figure E13 shows 2% in 50 years UHRS at site 6 (Ss= 0.66 g, S1=0.2 g) upland profile. The newly obtained UHRS by PSHA-NL [FF] for soil profile depths ranging from 30 to 1000 m are compared with those by PSHA-NL [PS]. Note that PSHA-NL [PS] results shown in Figure E13 use only one shear-wave velocity profile (mean) with single soil property (ME) but PSHA-NL [FF] adopts 30 randomized soil profiles with weighted soil properties (75% of ME and 25% of EPRI). Each of the graphs in Figure E13 includes the following curves:
The 30m UHRS from the PSHA-NL [FF] results in spectral accelerations that are more compatible with NEHRP design response spectrum than PSHA-NL [PS]. The spectra are slightly higher than those for NEHRP site D primarily due to the presence of hard rock close at the base of the soil column. This issue, influence of a thin veneer of soil over a hard rock on ground motion, is garnering increased attention but is beyond the scope of this paper.
The UHRS from both models continuously decrease with increasing deposit thickness at short periods. There are some important differences between UHRS from FF and PS models where the FF model shows lower spectral accelerations at short periods but similar hazard at long periods compared to that from the PS model. The proposed spectra for the deeper soil deposits have lower intensities for short periods and wider plateau compared with the spectra proposed by Park and Hashash (2005b). The differences among the UHRS plots demonstrate the need to modify soil-profile-thickness-dependent site coefficients using the simulations from PSHA-NL [FF].
NEHRP-style spectra are widely used and accepted in the engineering profession. NEHRP-style spectra are proposed to facilitate adaptation of the findings of this study into existing codes and engineering design. A fitting procedure that minimizes the error between the UHRS spectral values and a spectrum calculated using the NEHRP expressions is employed to compute Fa and Fv.
Figure E13 2% in 50 year UHRS and the proposed NEHRP type design spectrum of the different depths of soil columns resulting from propagating generated motions by PSHA-NL[PS] [Park and Hashash (2005b)] and PSHA-NL[FF] (this study) at site 6.