Electronic Supplement to
Model Update January 2011: Upper Mantle Heterogeneity beneath North America from Travel Time Tomography with Global and USArray Transportable Array Data
by Scott Burdick, Robert D. van der Hilst, Frank L. Vernon, Vladik Martynov, Trilby Cox, Jennifer Eakins, Gulsum Karasu, Jonathan Tylell, Luciana Astiz, and Gary L. Pavlis
MIT P-wave tomography model for the United States, MITP_USA_2011MAR, created using traveltime residuals from the global EHB catalogue plus USArray Transportable Array from 2004 to March 2011.
The model is given as a .mat file comprised of velocity perturbations relative to ak135 at node points. To allow for better investigation of the model we present the model on the original irregular grid used for inversion and include scripts for reading and interpreting it. The .mat file contains an array with rows representing each mantle volume in the irregular grid and columns representing the following:
- Velocity perturbation within volume
- Upper latitude boundary for volume
- Upper longitude boundary
- Upper radius boundary
- Lower latitude boundary
- Lower longitude boundary
- Lower radius boundary
- Central latitude
- Central longitude
- Central radius
This update also includes a MATLAB library for plotting cross sections and map sections from the new model. Scripts were tested in MATLAB v7.11.0. Example outputs are shown below.
Download: MITP_USA_2011MAR+scripts.tar. [Unix Tape Archive file; 39.5 MB]
The Tar file contains:
- MITP_USA_2011MAR.mat - mat file containing MIT model
- mkslice_MITP11.m - MATLAB function to load the model on the irregular grid and interpolates onto cross-sections along the great circle arc between specified endpoints.
- mkmap_MITP11.m - MATLAB function to load the model on the irregular grid and plots onto map sections.
- samplemap.pdf (figure S1), sampleslice.pdf (figure S2) - sample outputs
- mbin - directory containing MATLAB plotting subroutines
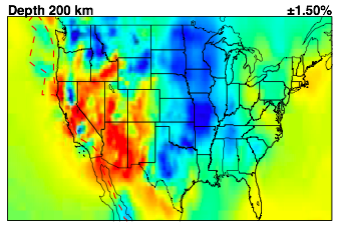
▲ Figure S1. Sample output of mkmap_MITP11.m. Map section at 200 km depth of MITP_USA_2022MAR model.
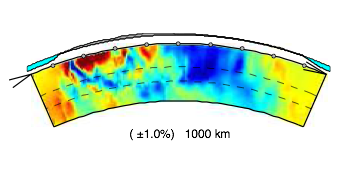
▲ Figure S2. Sample output of mkslice_MITP11.m. Slice through MITP_USA_2022MAR model at 48N.
[ Back ]