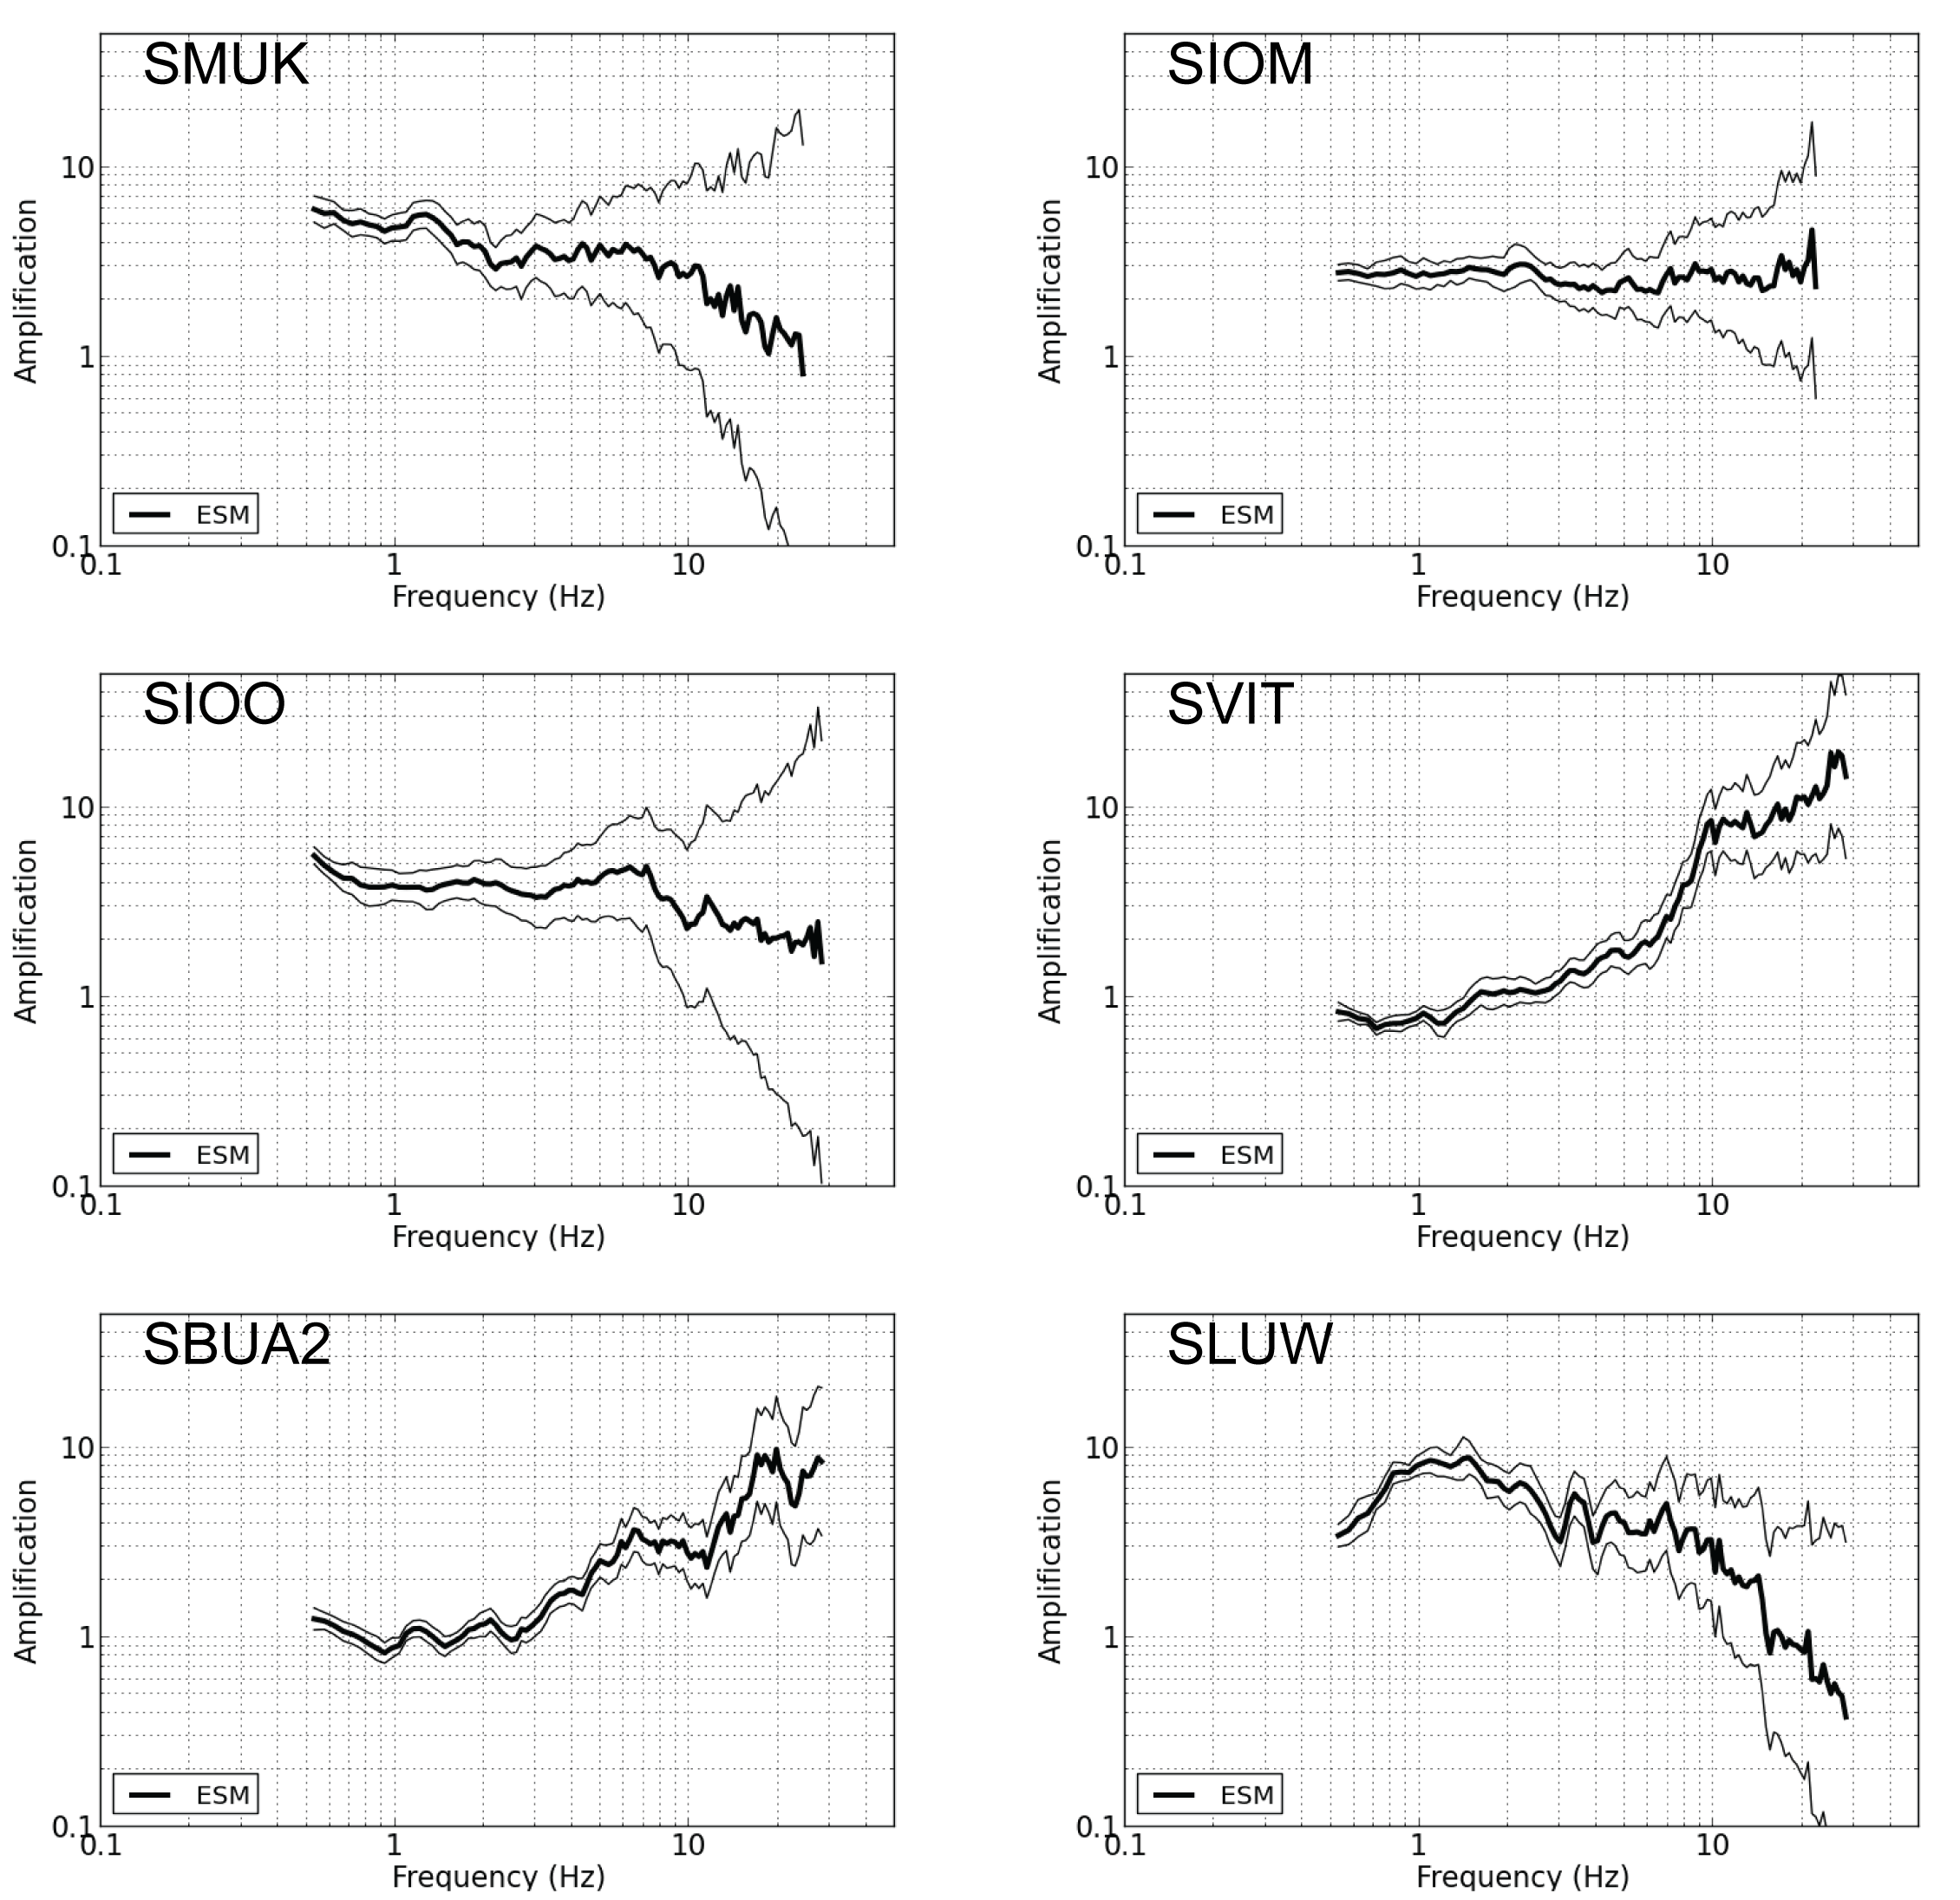
The absolute amplification at the six non-reference sites used for the SSR comparison are shown in Figure S1.
Tables S1 and S2 detail the spectral parameters used for the derivation of ESM amplification. Table S1 lists the parameters determined in this study (data since 2010), whilst Table S2 lists spectral parameters determined by Poggi et al. (2011) (data prior to 2010).
Column headings are:
Date (YYYYMMDD): the event date;
Time (HHMM): the event time;
Time [Seconds]: the event time;
Event Latitude [degrees]: the event latitude N;
Event Longitude [degrees]: the event longitude E;
Depth [km]: the event's focal depth;
Local Magnitude: local magnitude according to the Swiss Seismological Service;
Moment Magnitude *: Moment magnitude according to the method of Edwards et al. (2010);
Source - Station Azimuth [degrees]: the source-station azimuth;
Hypocentral Distance [km]: hypocentral distance;
Source Corner Frequency (fc) [Hz]: the event-common source corner frequency (Brune, 1970);
Station Name: the station name;
Channel: the channel (HH=broadband, HG=strong-motion);
Signal Moment [ms]: the far-field spectral plateau;
t* + k [s]: the whole path attenuation term;
Aj []: the average amplification from Poggi et al. (2011);
Minimum Fitting Frequency [Hz]: the minimum frequency used;
Maximum Fitting Frequency [Hz]: the maximum frequency used.
Table S1 [Plain Text Comma-separated Values; 68 KB].
Table S2 [Plain Text Comma-separated Values; 59 KB].
Brune, J. N. (1970). Tectonic Stress and Spectra of Seismic Shear Waves from Earthquakes, Journal of Geophysical Research 75, 4997-5009
Edwards, B., B. Allmann, D. Fäh and J. Clinton (2010). Automatic computation of moment magnitudes for small earthquakes and the scaling of local to moment magnitude, Geophysical Journal International 183, 407-420.
Poggi, V., B. Edwards and D. Fäh (2011). Derivation of a Reference Shear-Wave Velocity Model from Empirical Site Amplification, Bulletin of the Seismological Society of America 101, 258-274.
[ Back ]