This supplement consists of two tables in ascii format and 363 figures in png format.
Table S1. List of station information for all strong motion instruments deployed as part of the Utah Regional Seismic Network as of December 2011. The first column is the station code; the second is sensor type; the third is the digitizer type; the fourth is the number of individual, hour-long PSDs that were calculated in this study; the fifth is the station latitude in decimal degrees; the sixth is the station longtiude in decimal degrees; the seventh is the elevation in meters; the eighth is the VS30 in m/s, and the ninth is the station start date with a format of YYYYMMDD.
Table S2. The Utah Strong Motion Noise Model for 2011 (USMNM11) developed in this study. The first column is frequency in Hz; the second is period in sec; the third is the high noise bound for spectral acceleration amplitudes in units of db relative to 1 m/s2 [10log10(m2/s4/Hz)]; the fourth is the low noise bound in the same units.
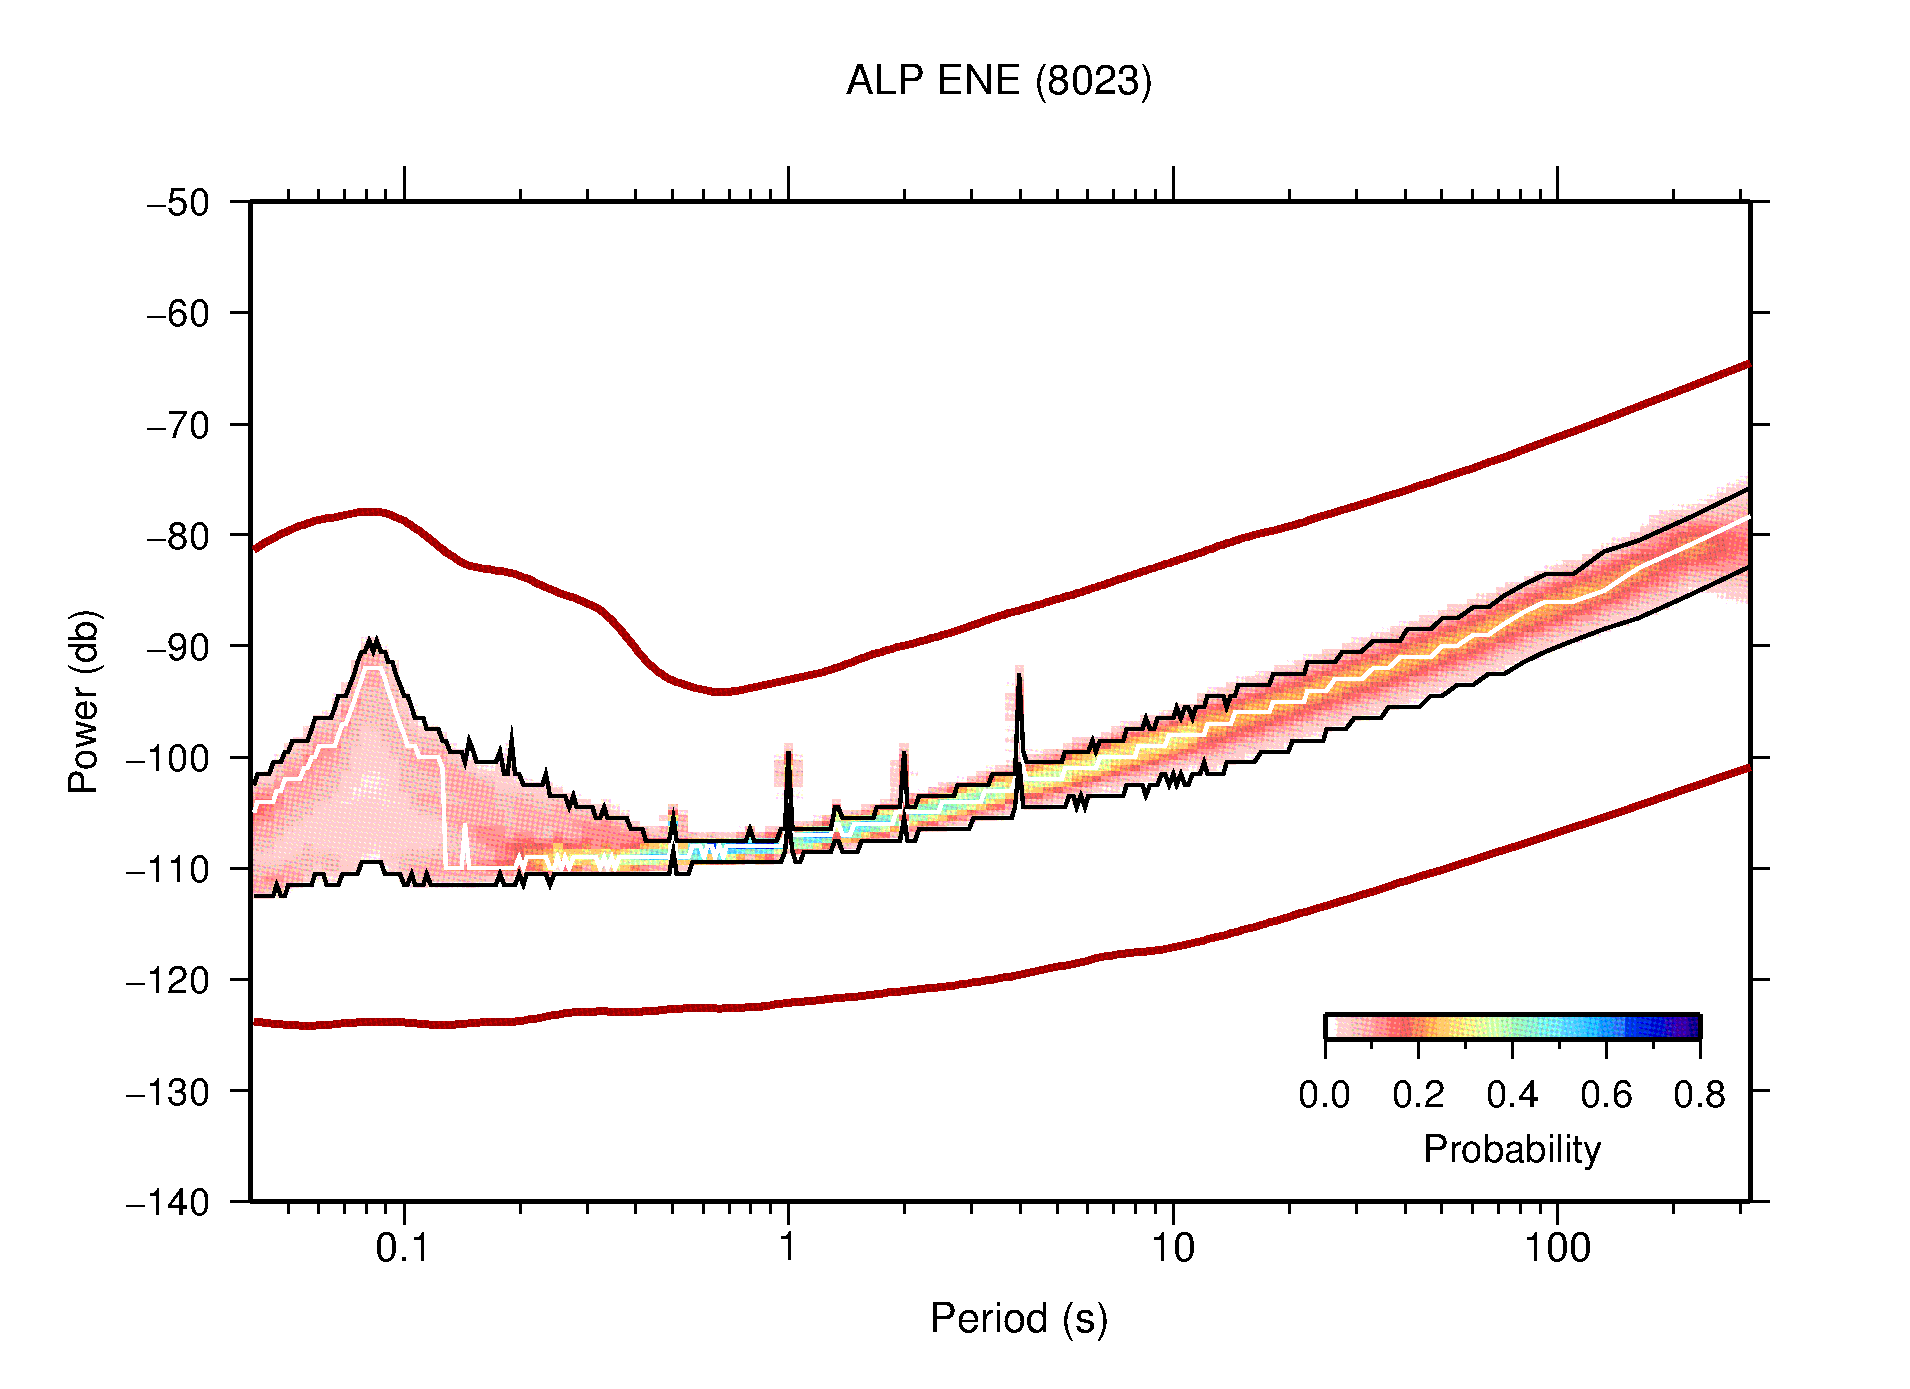
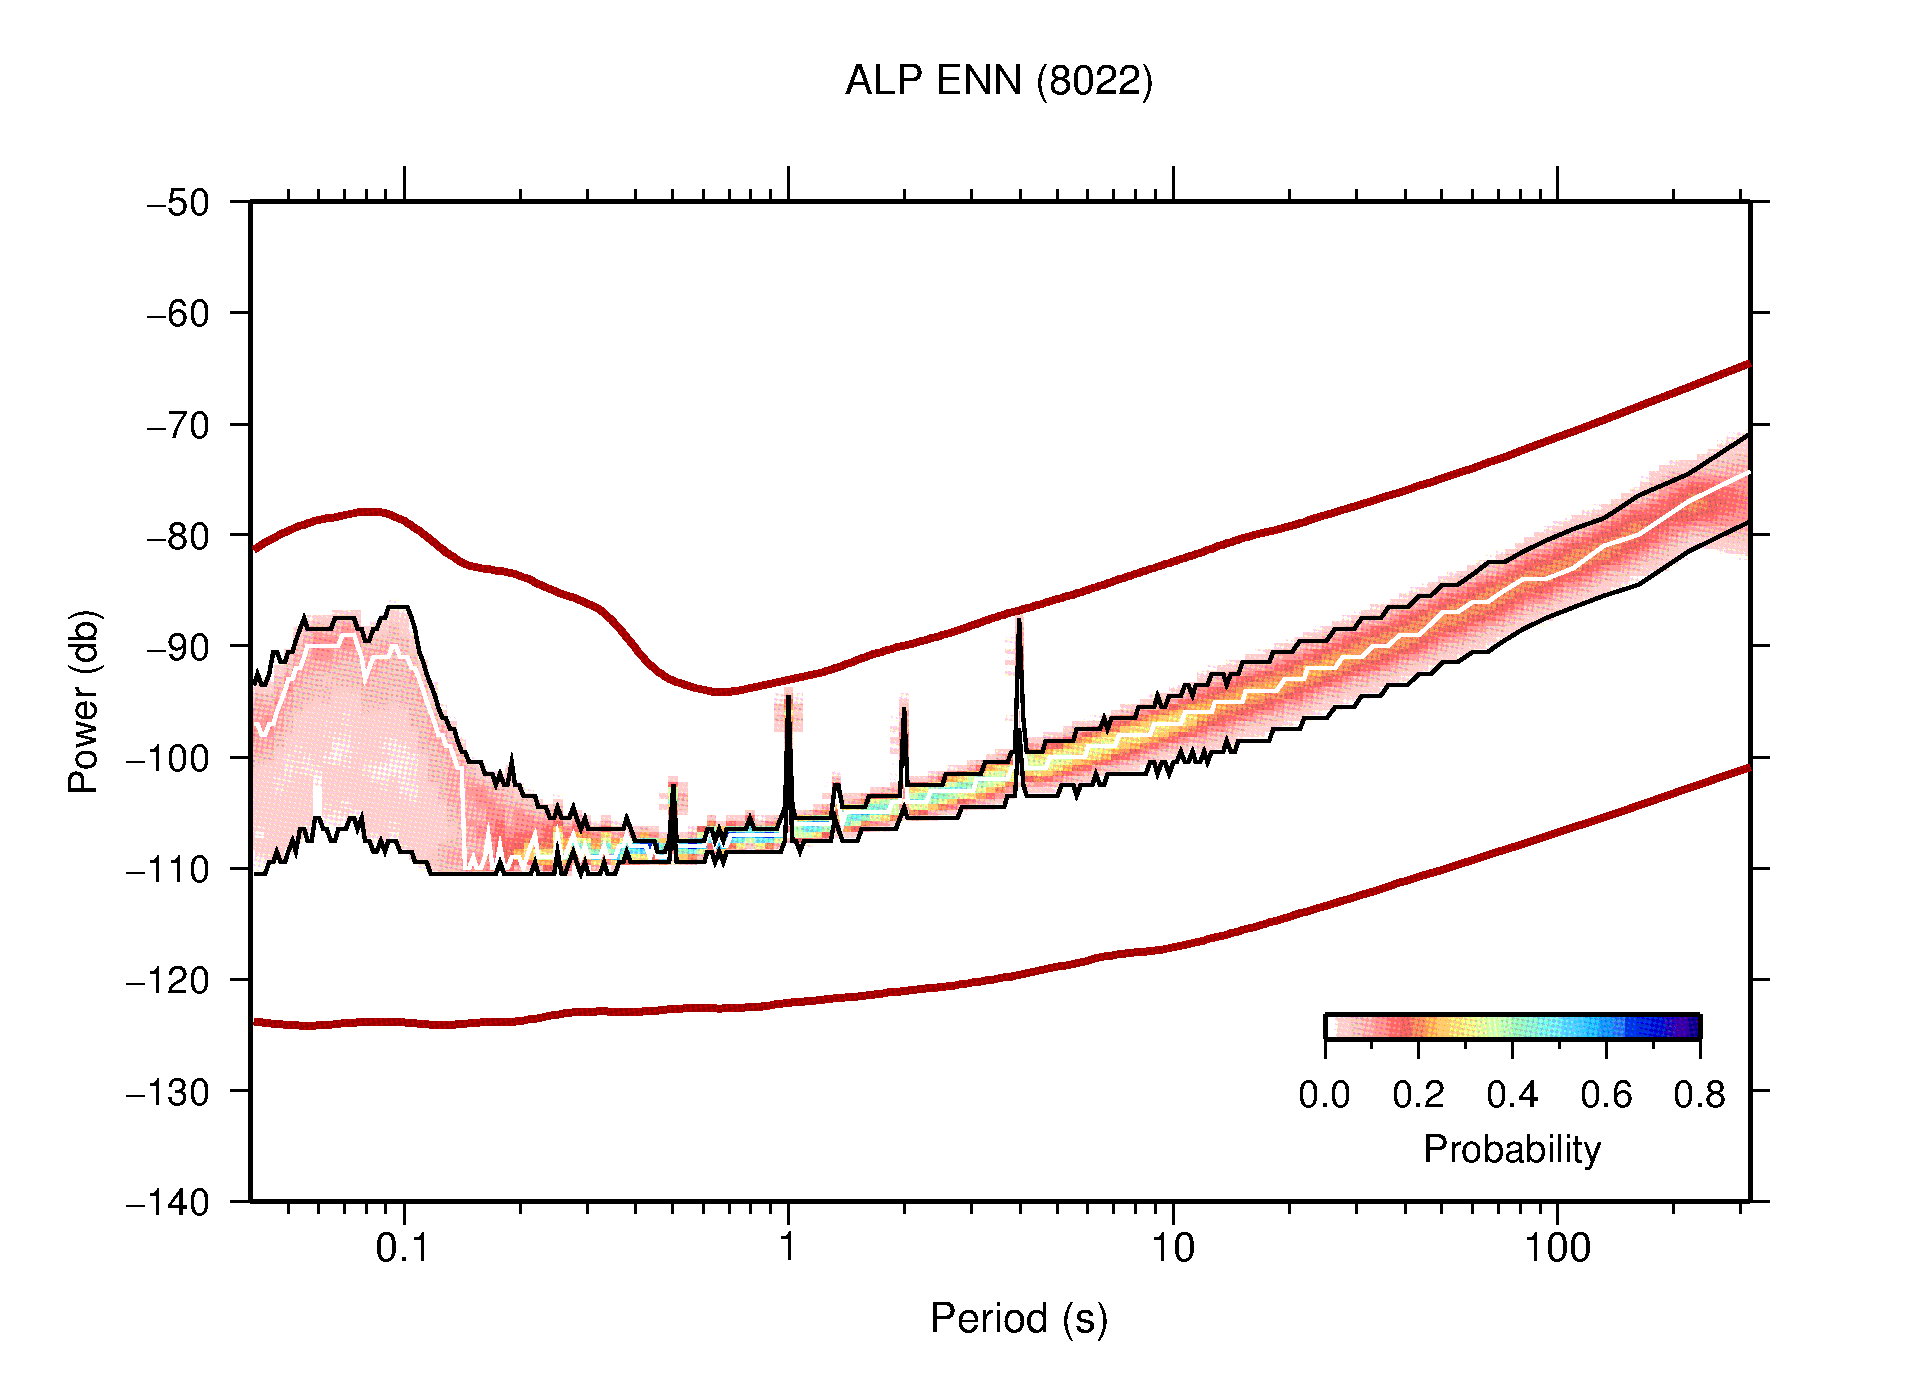
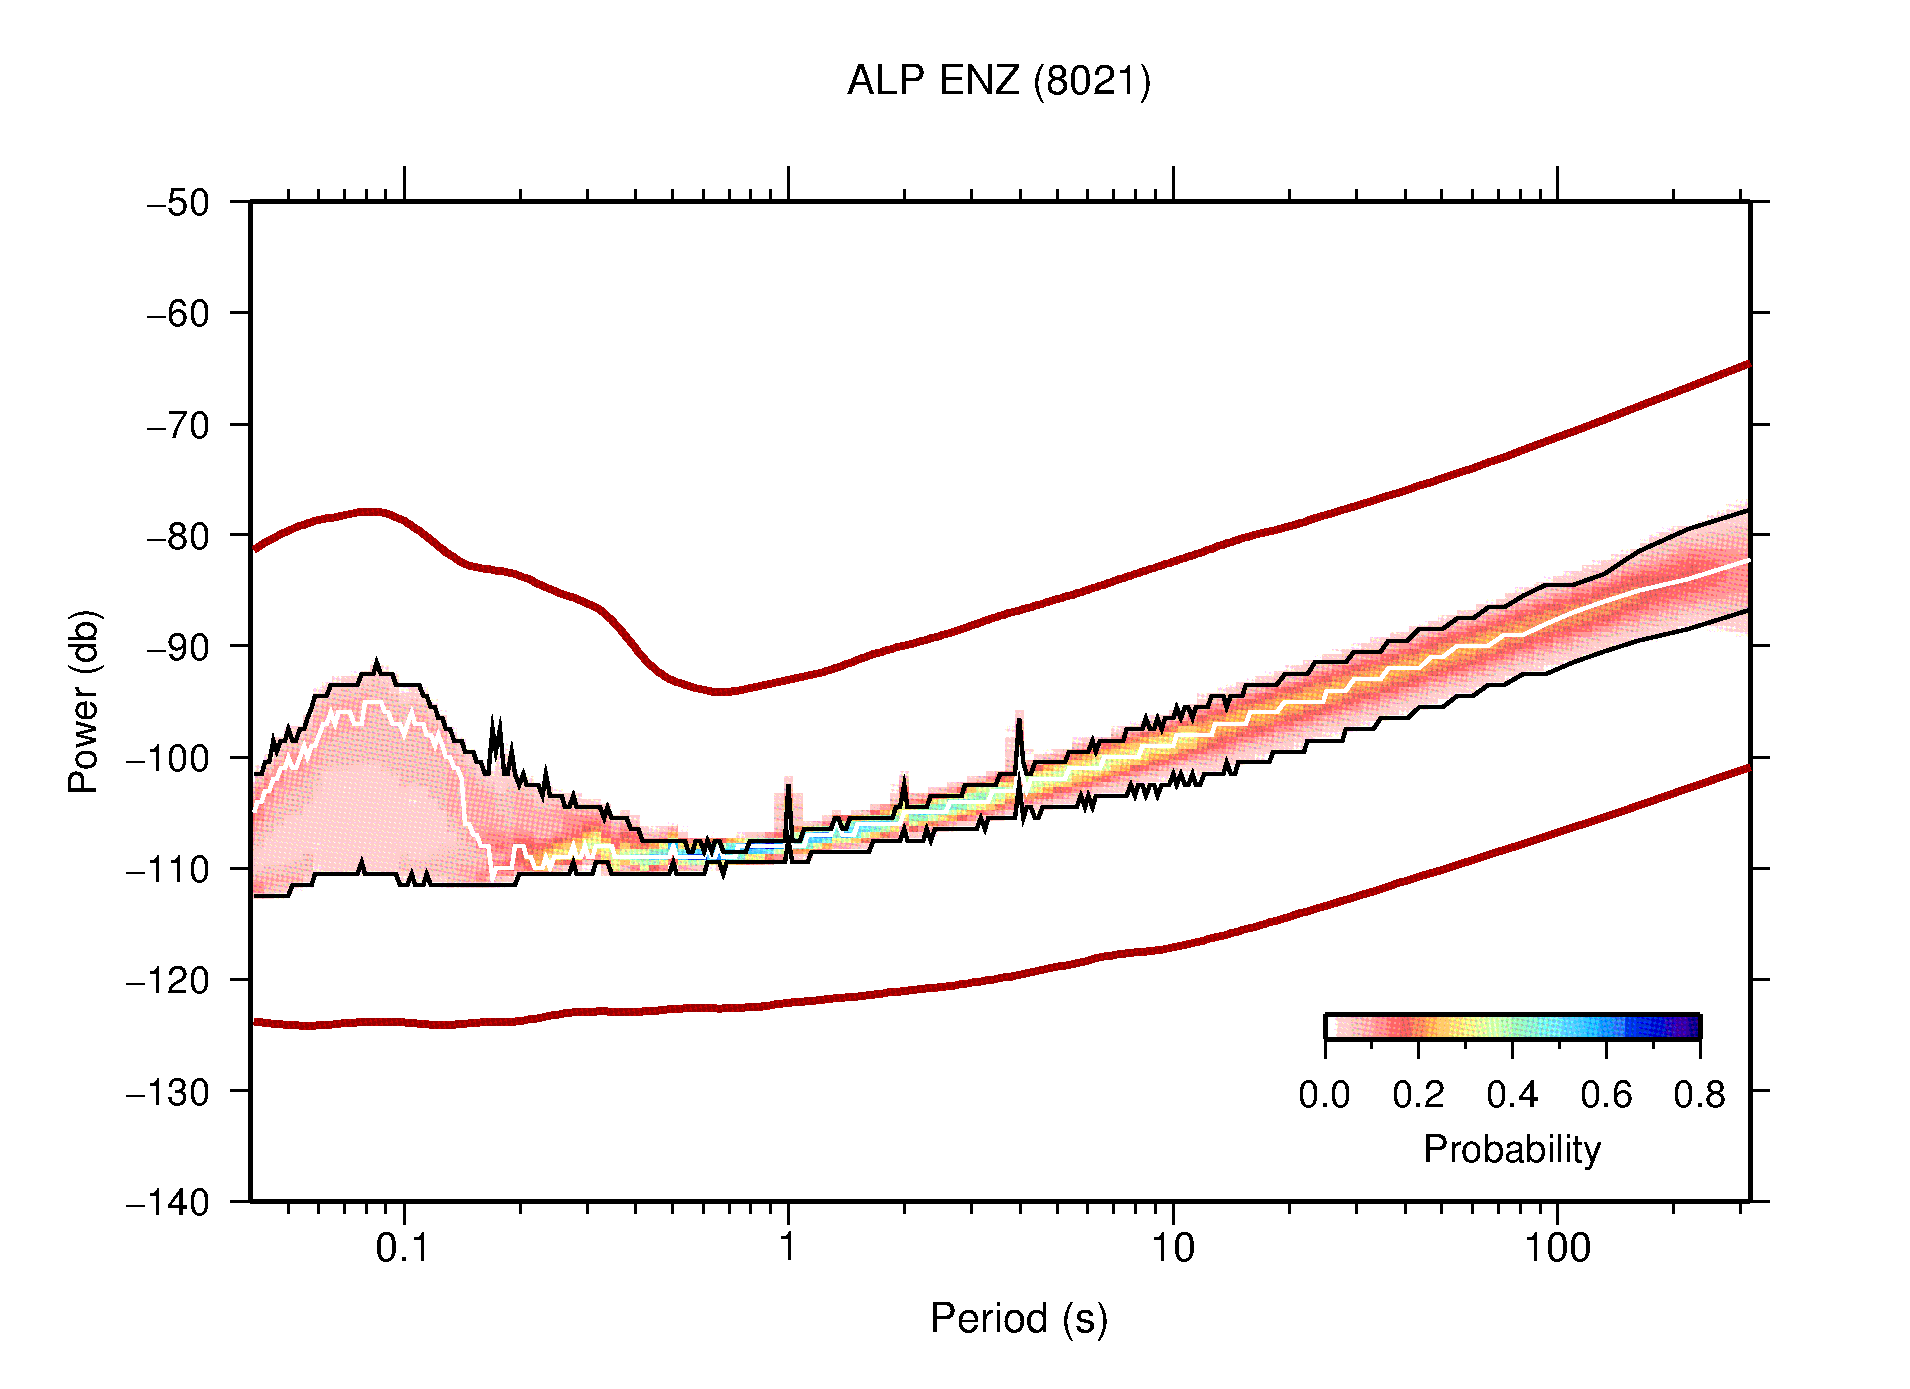
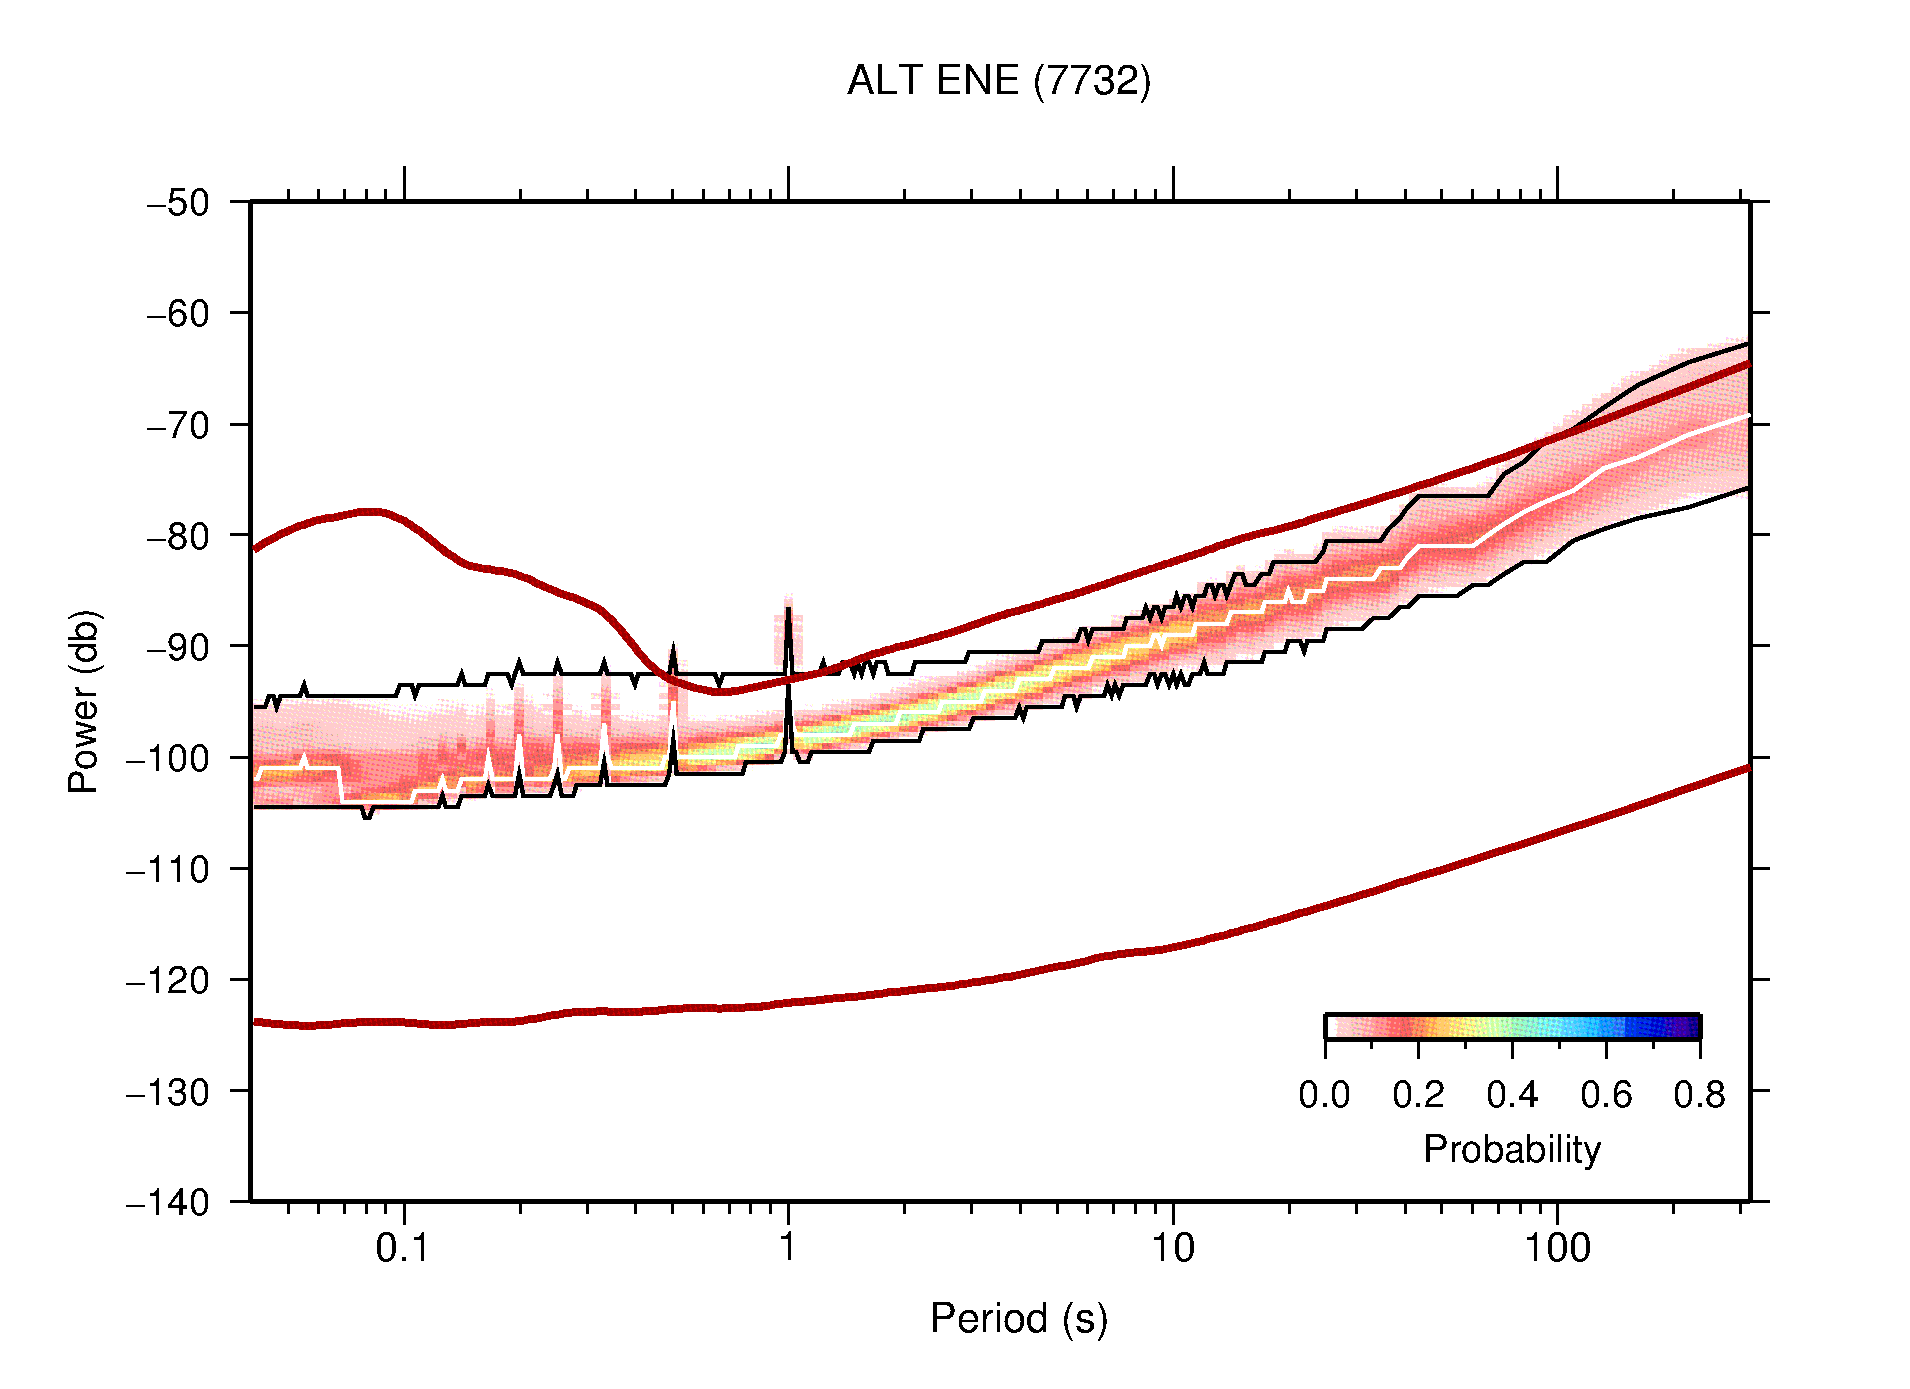
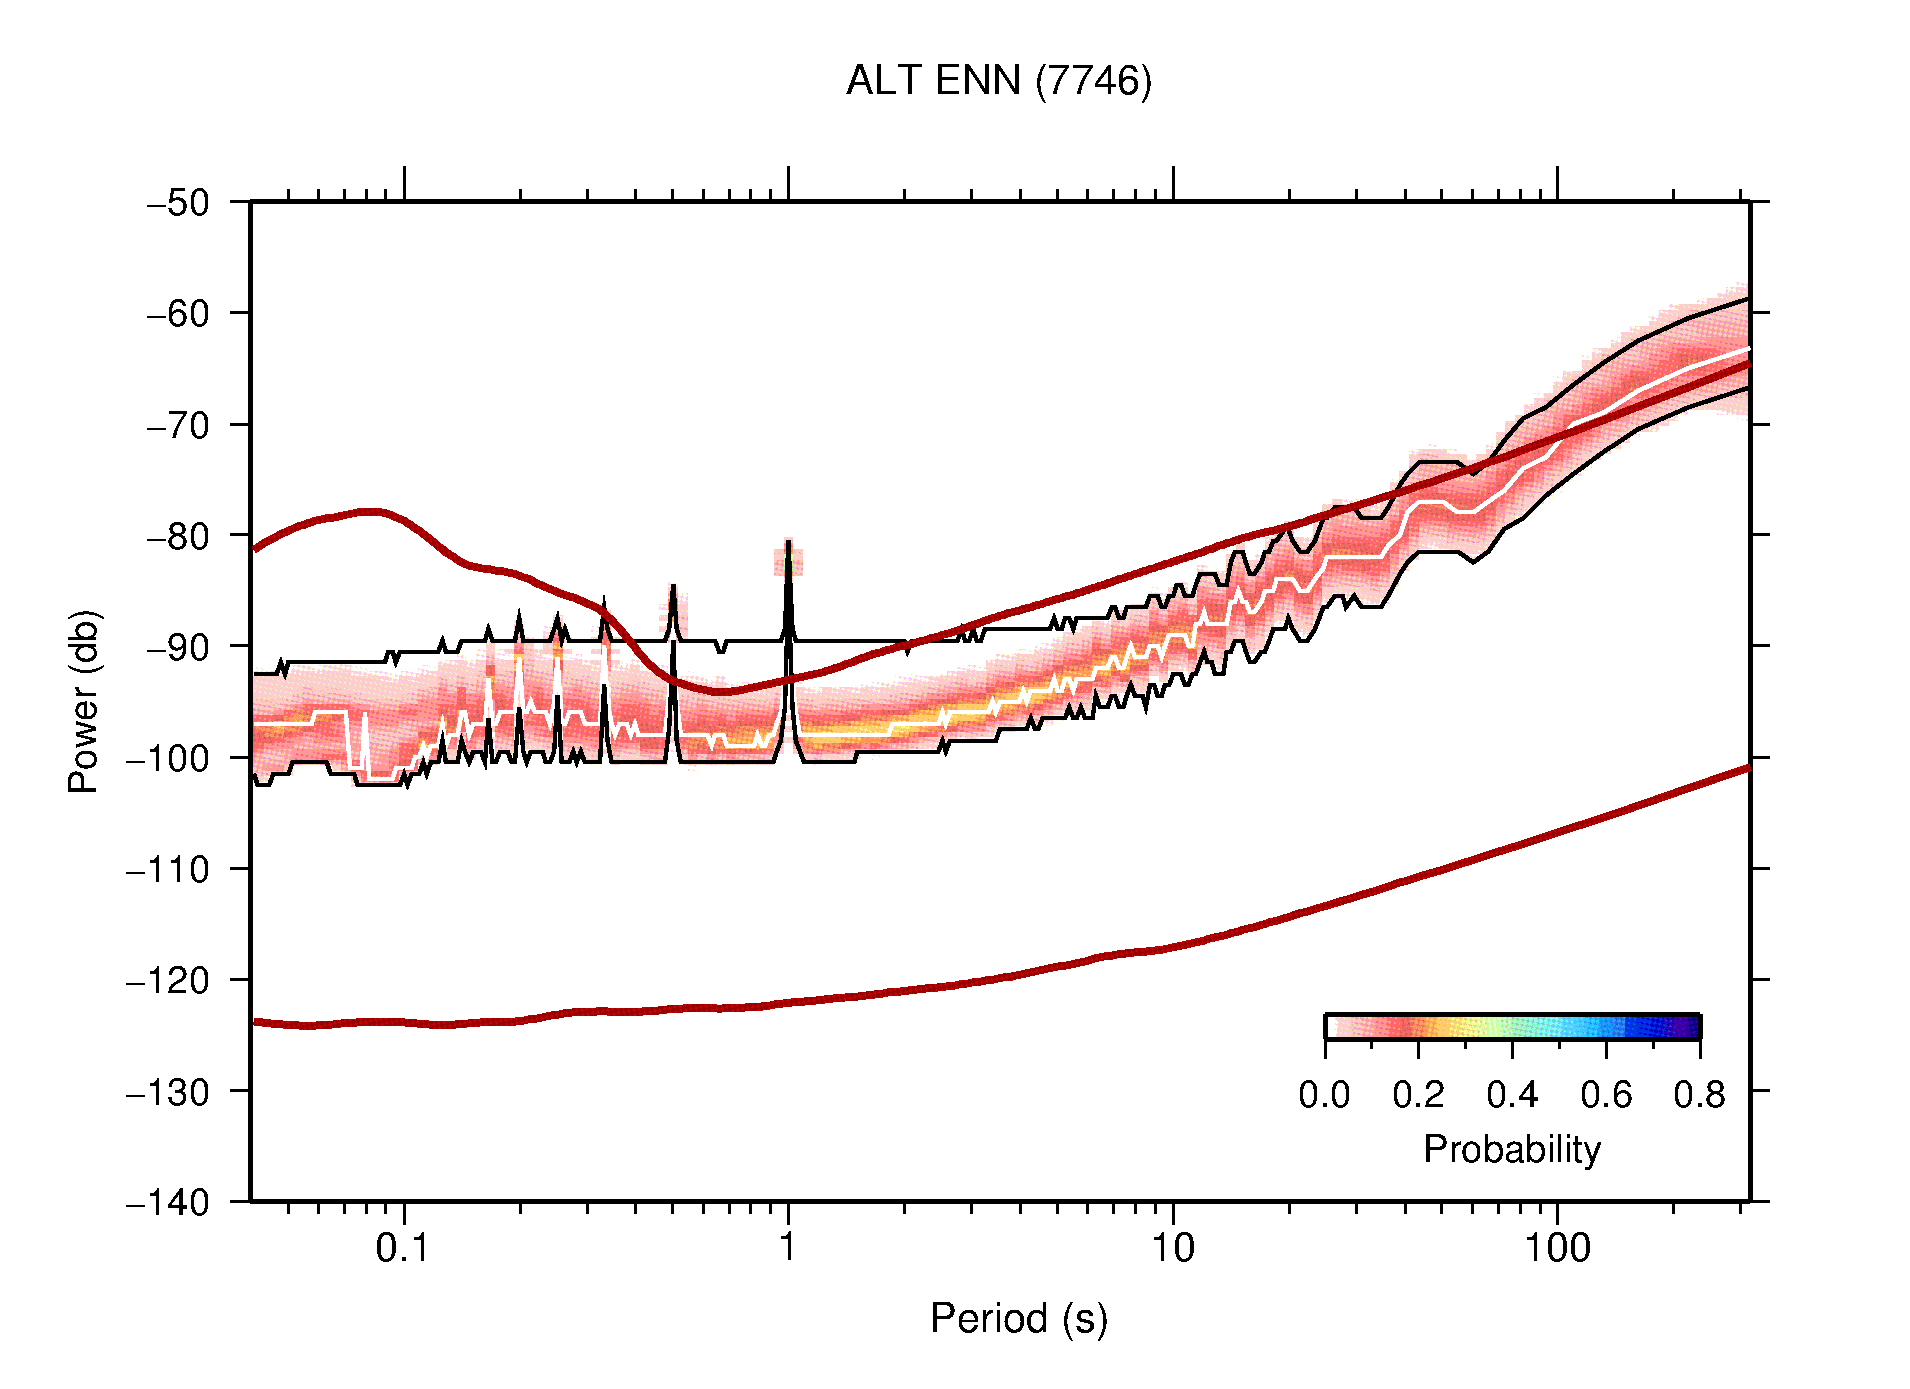
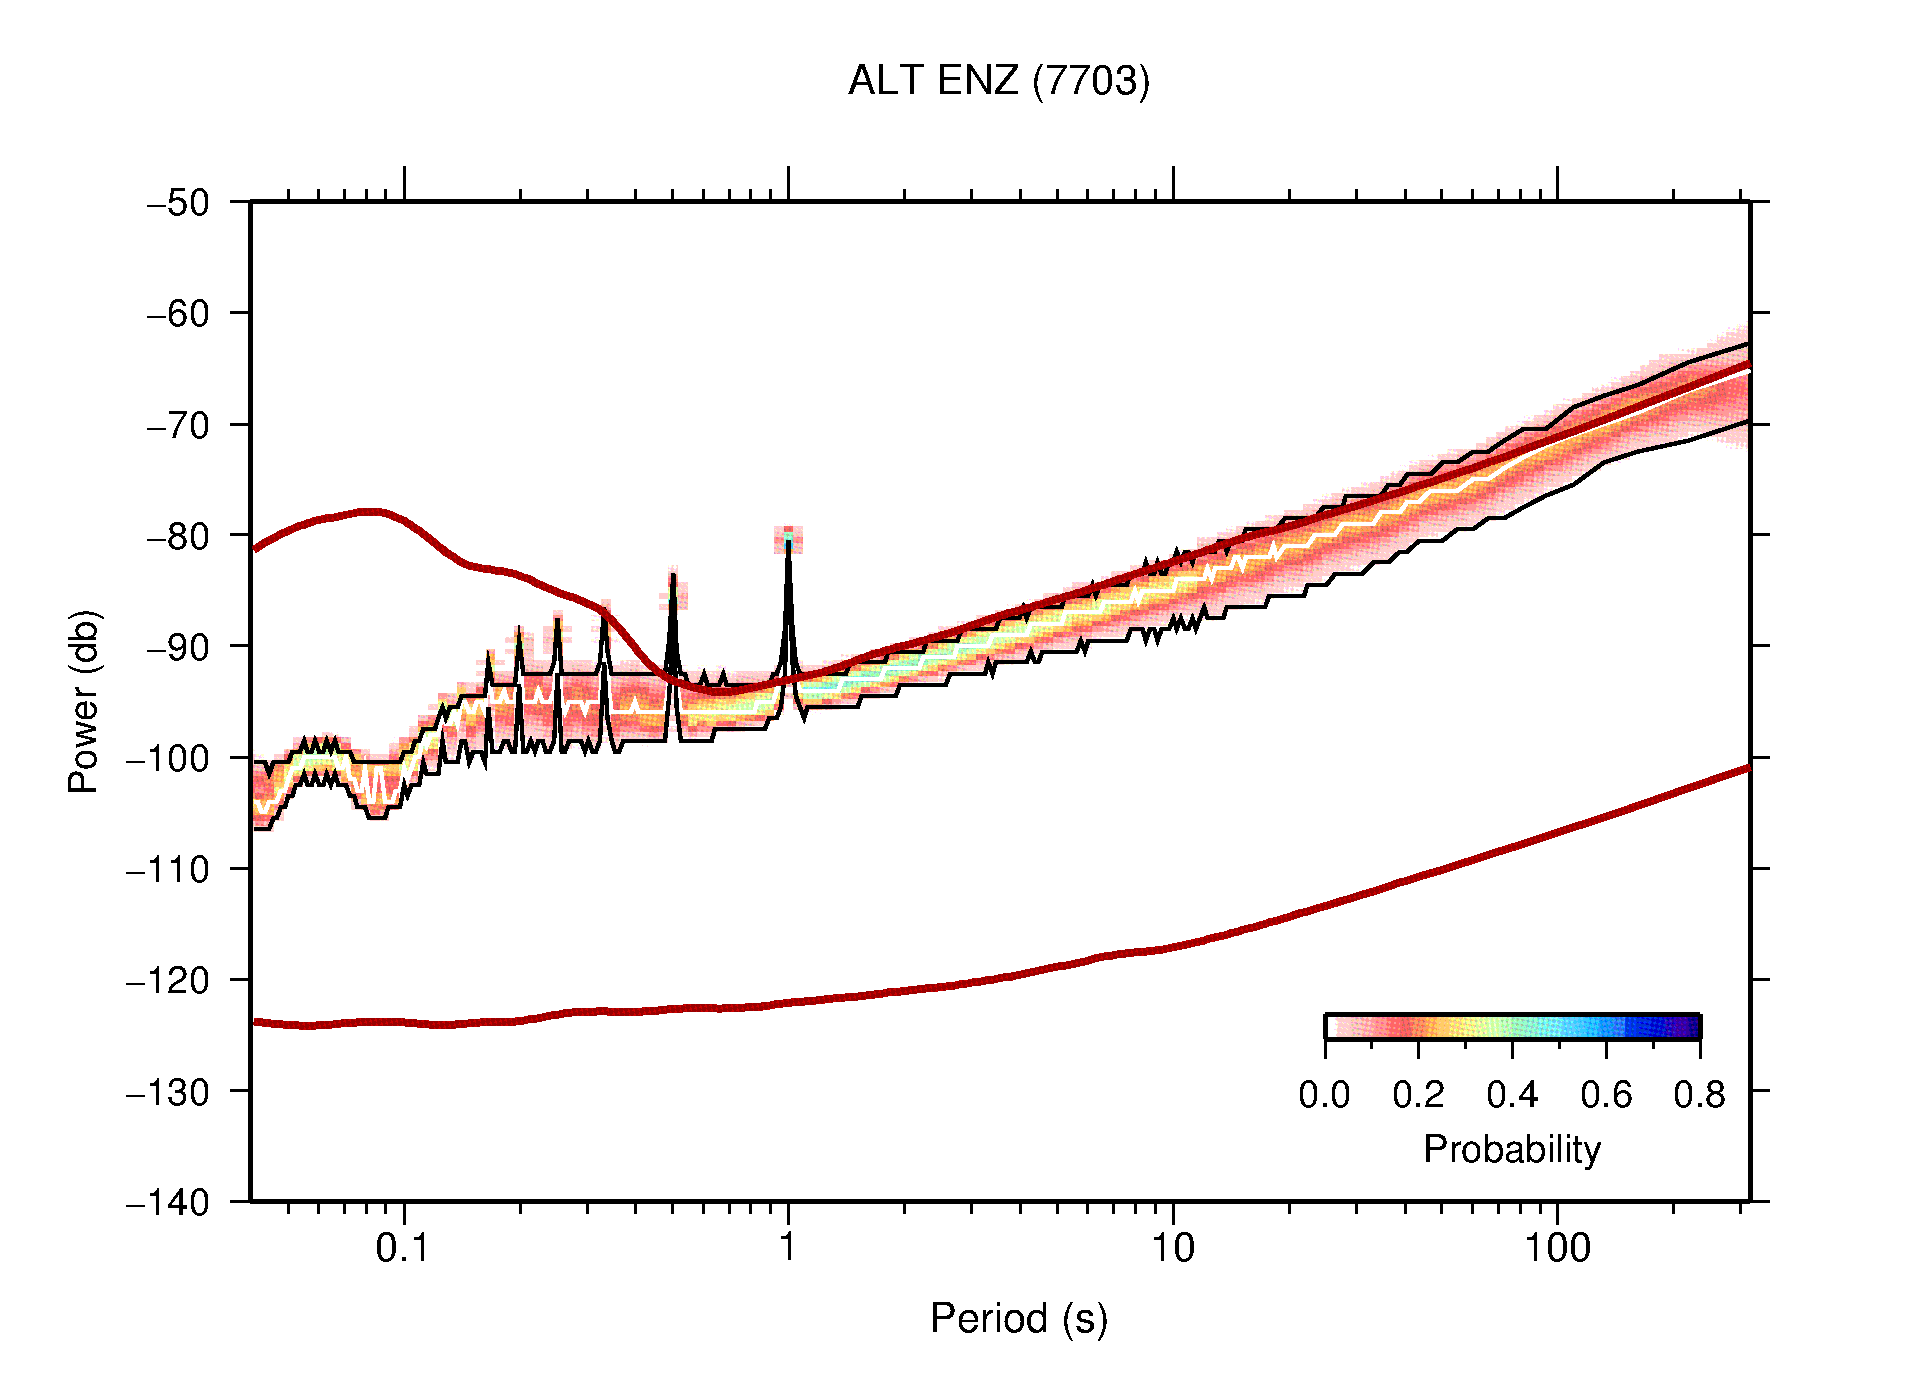
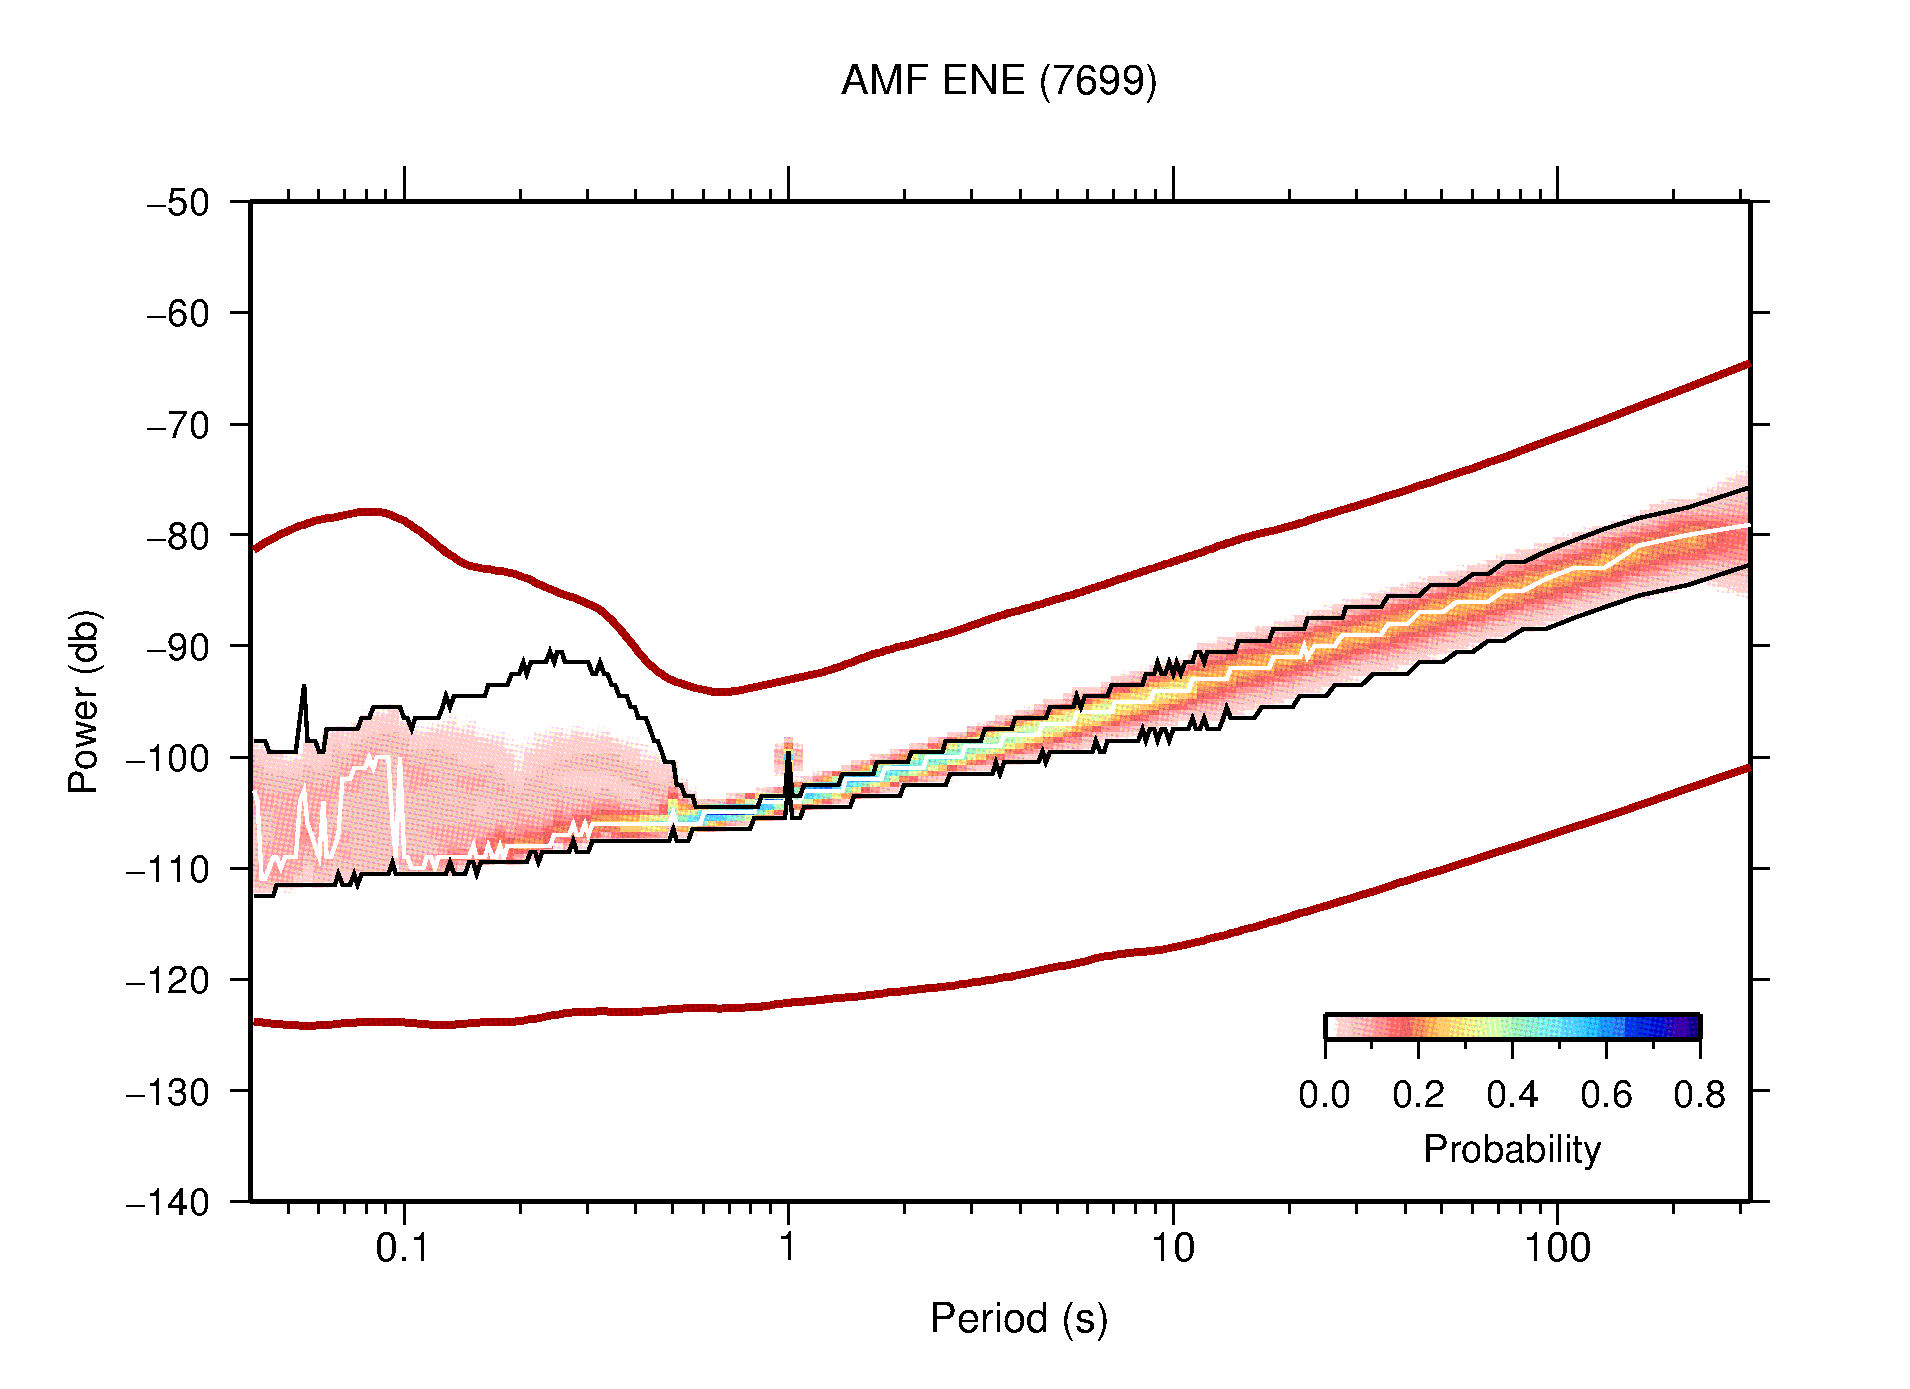
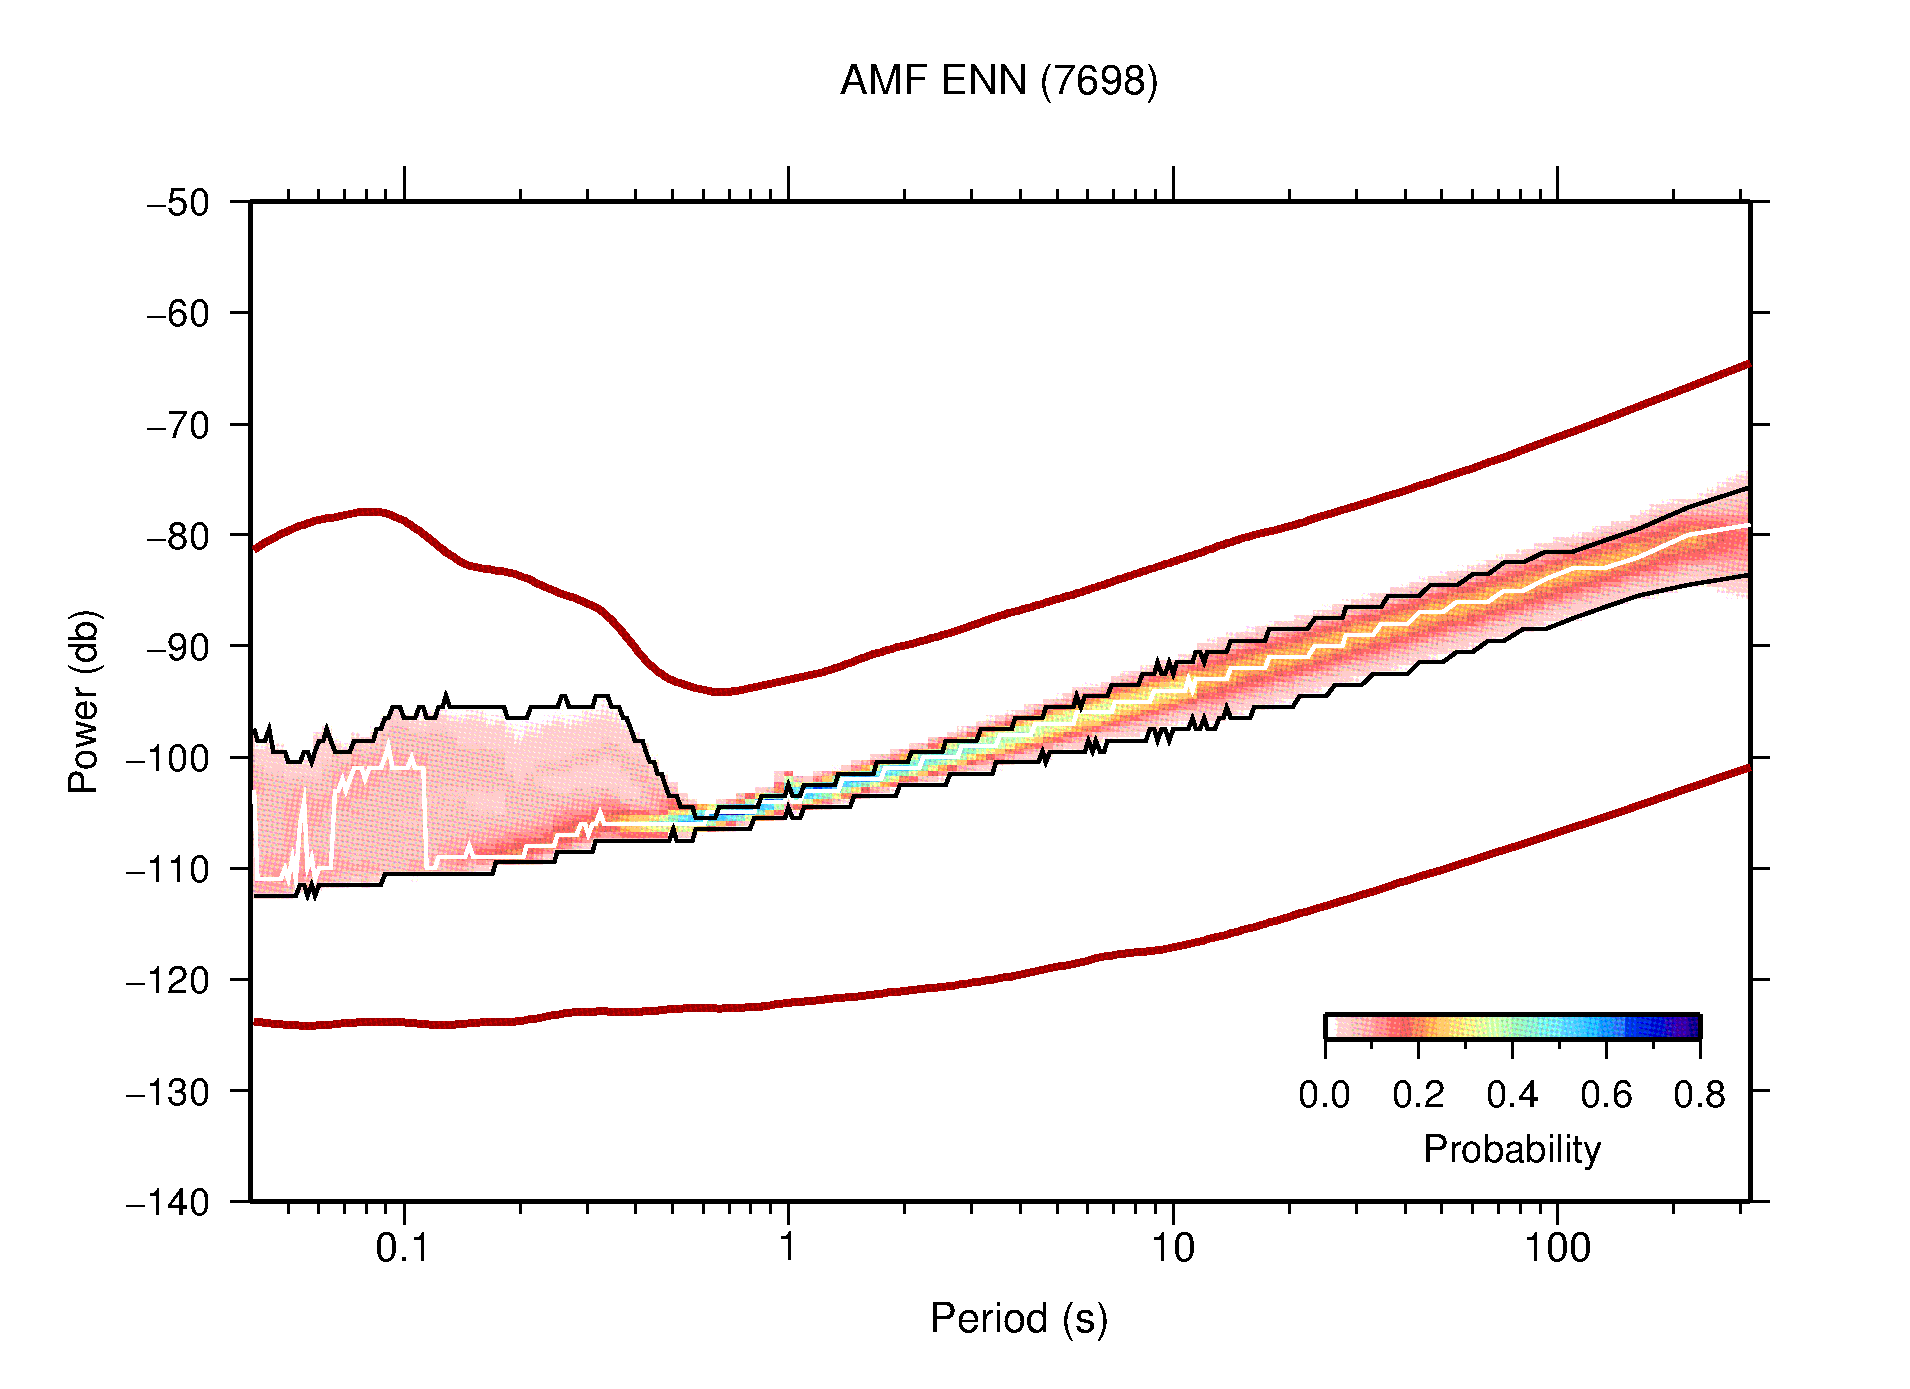
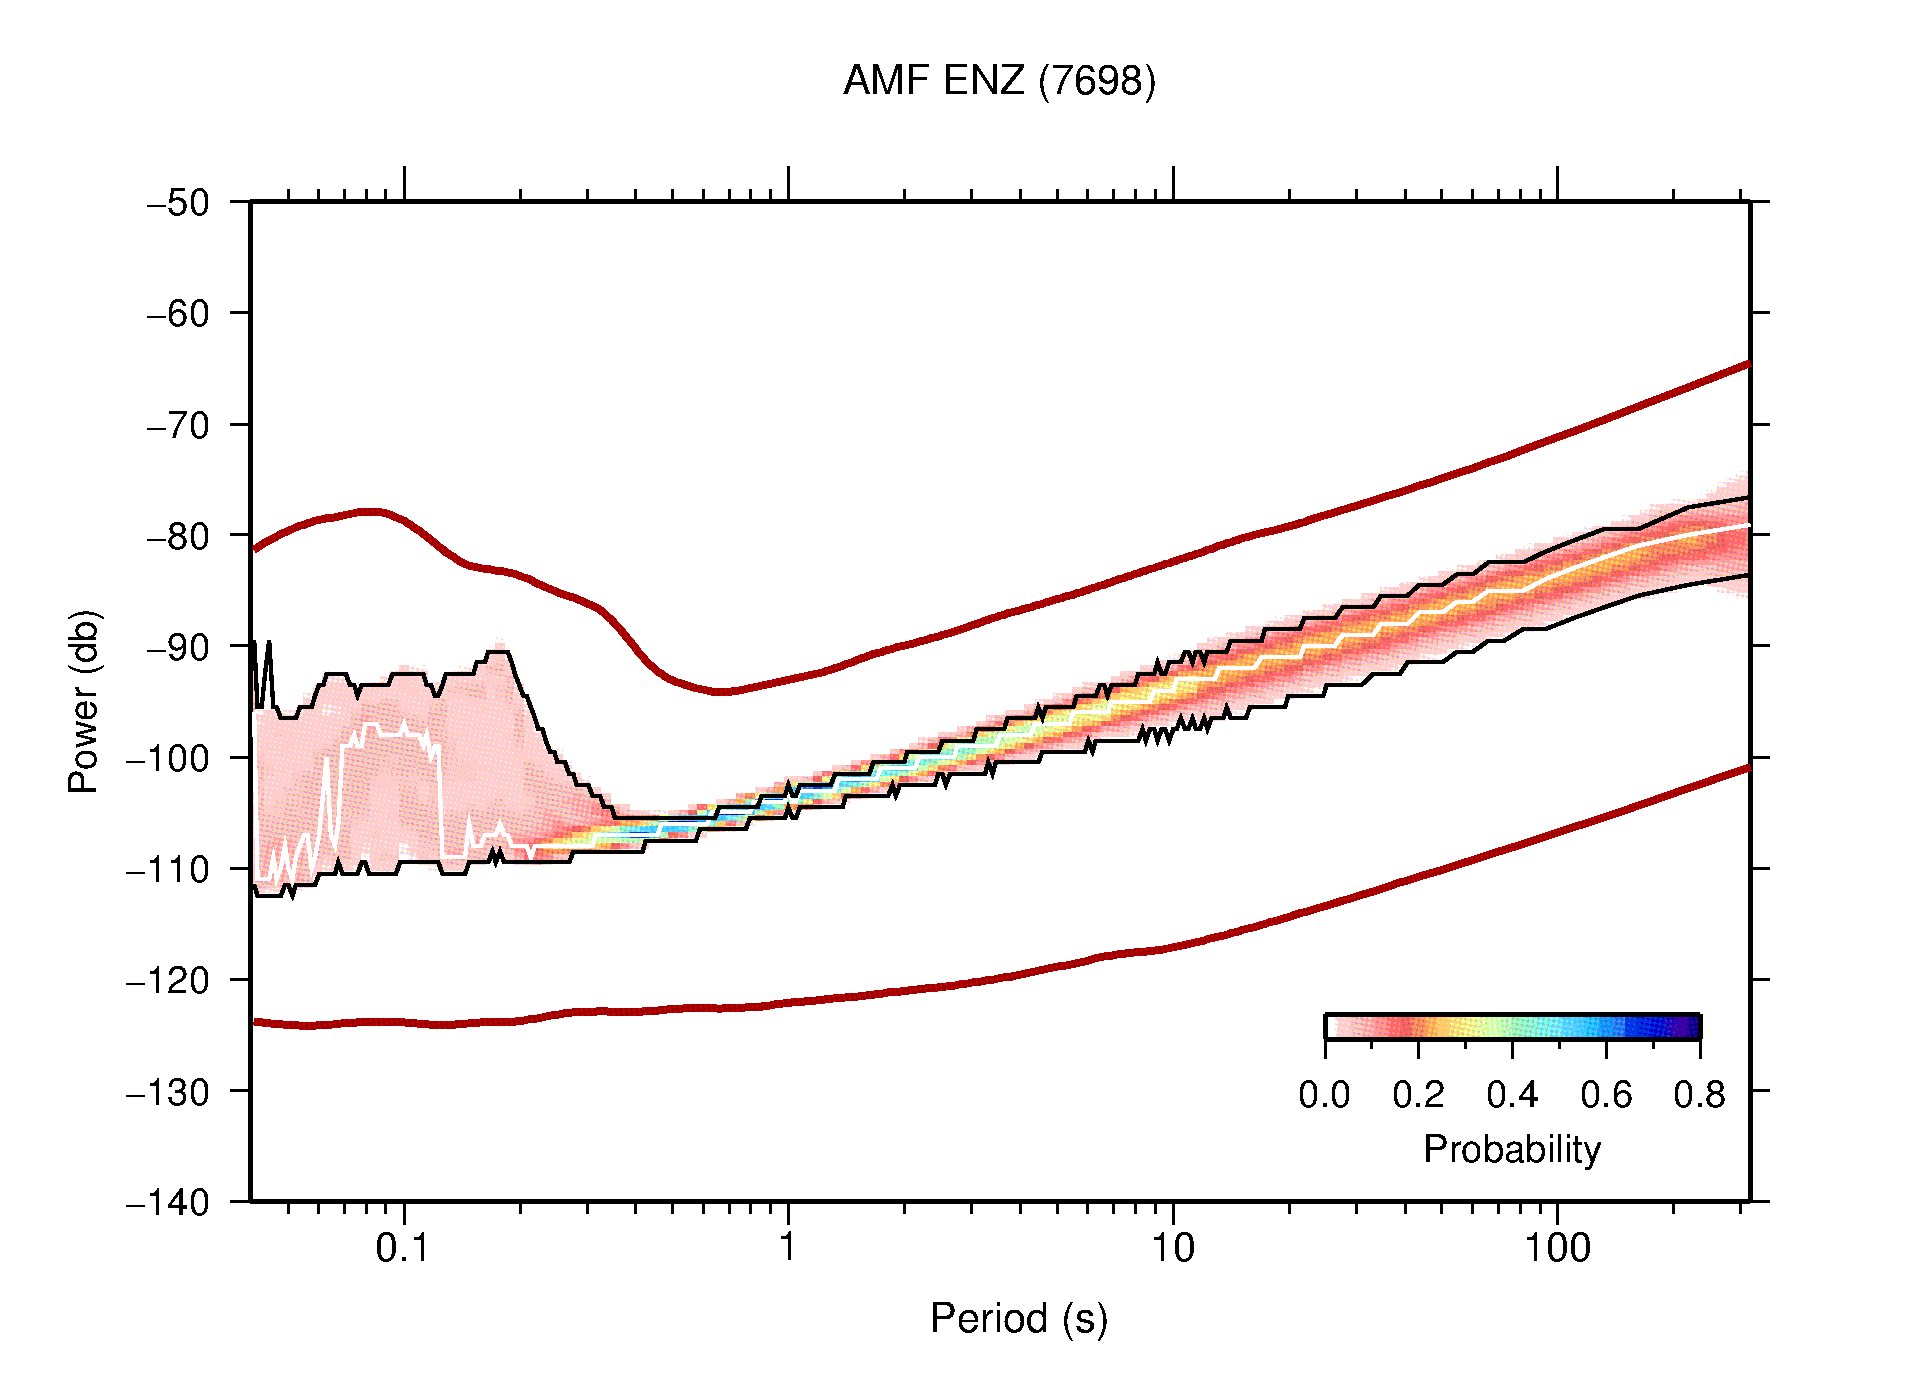
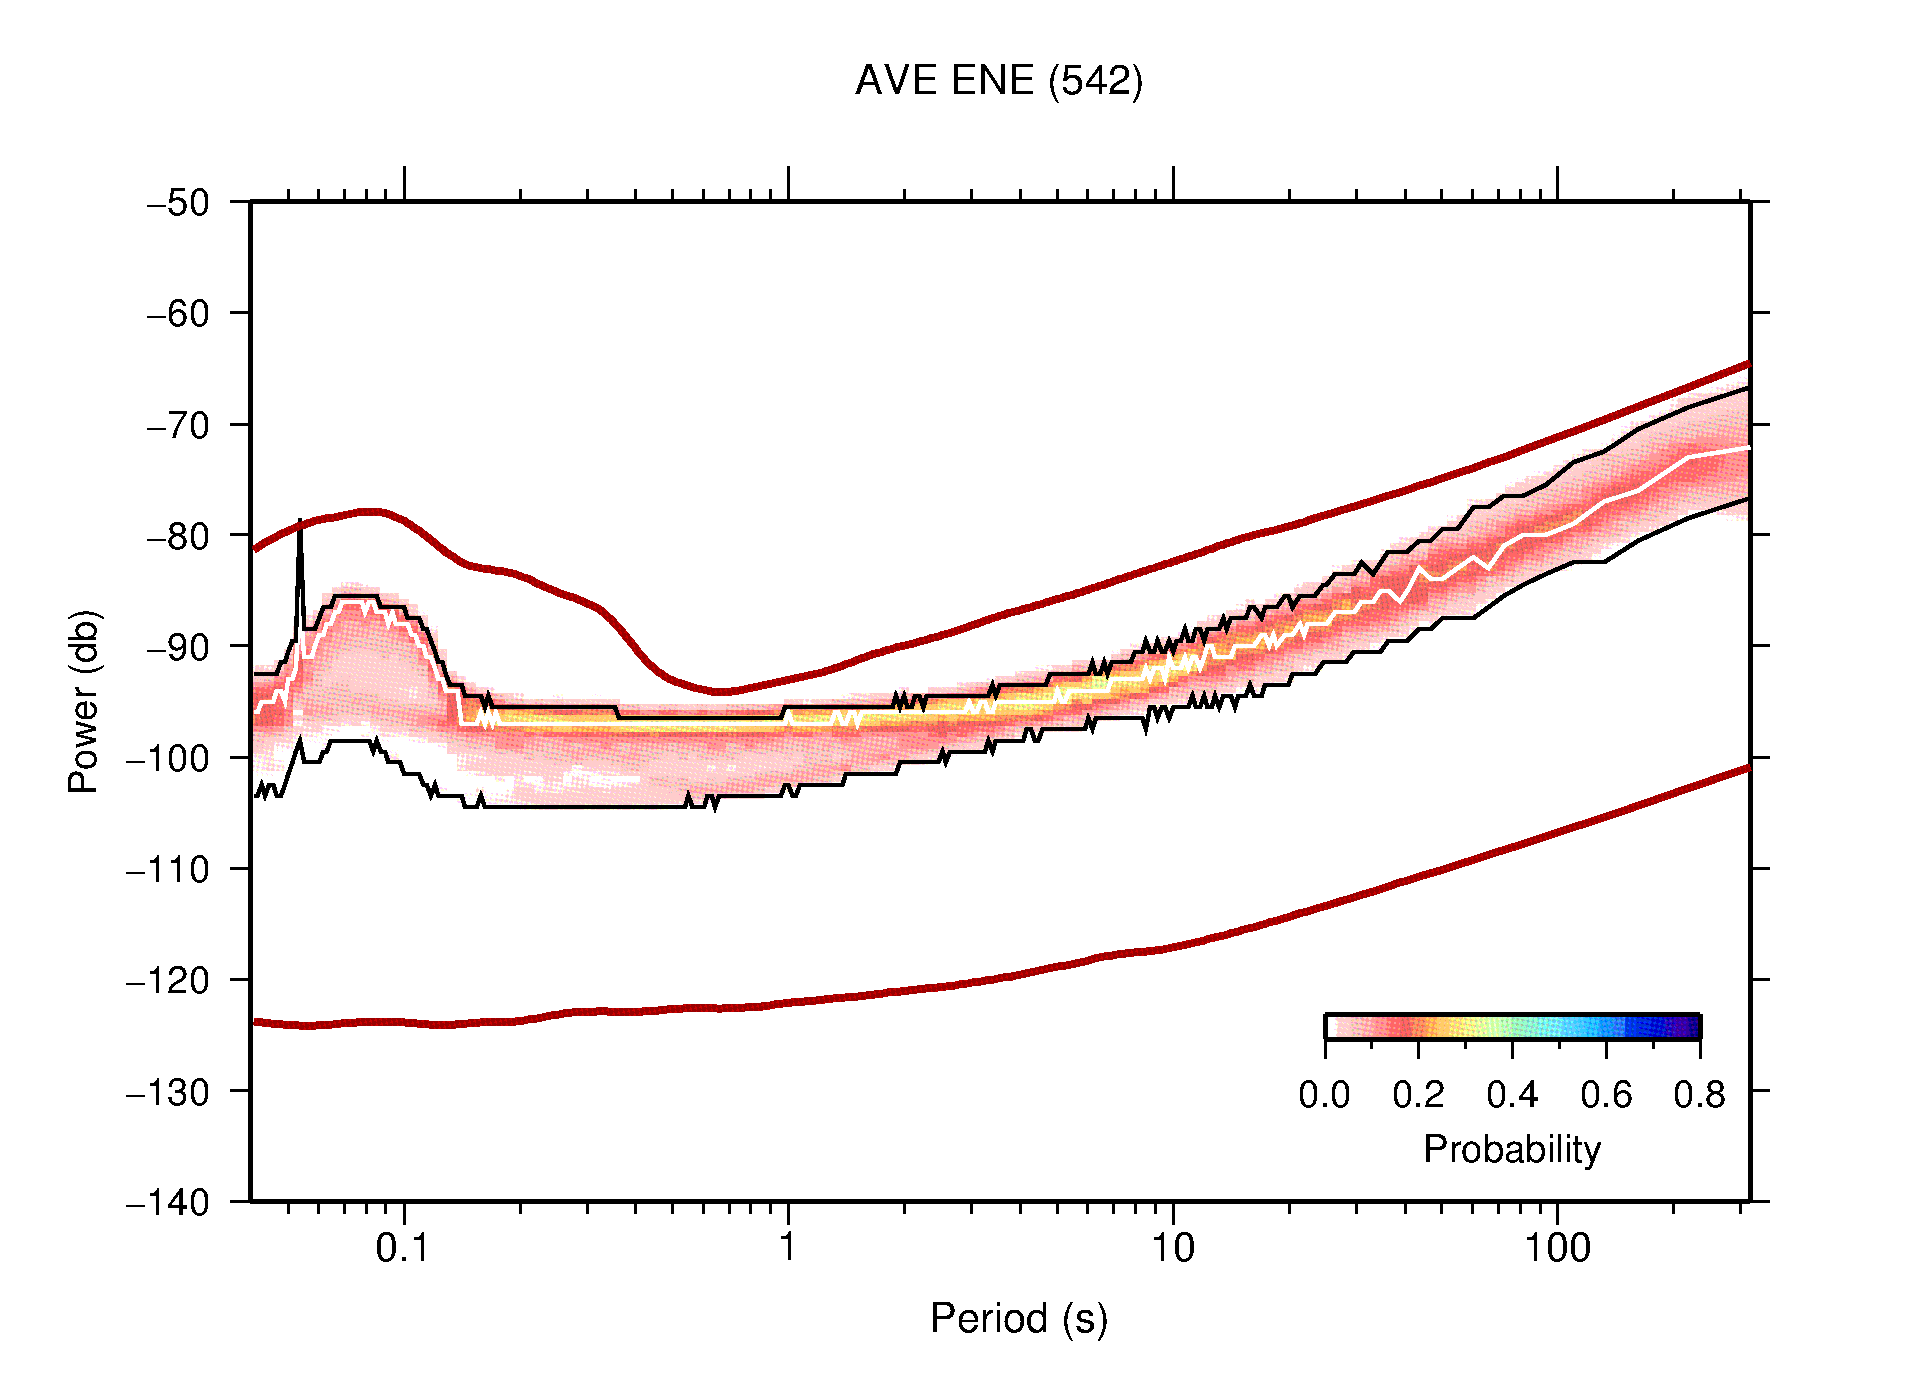
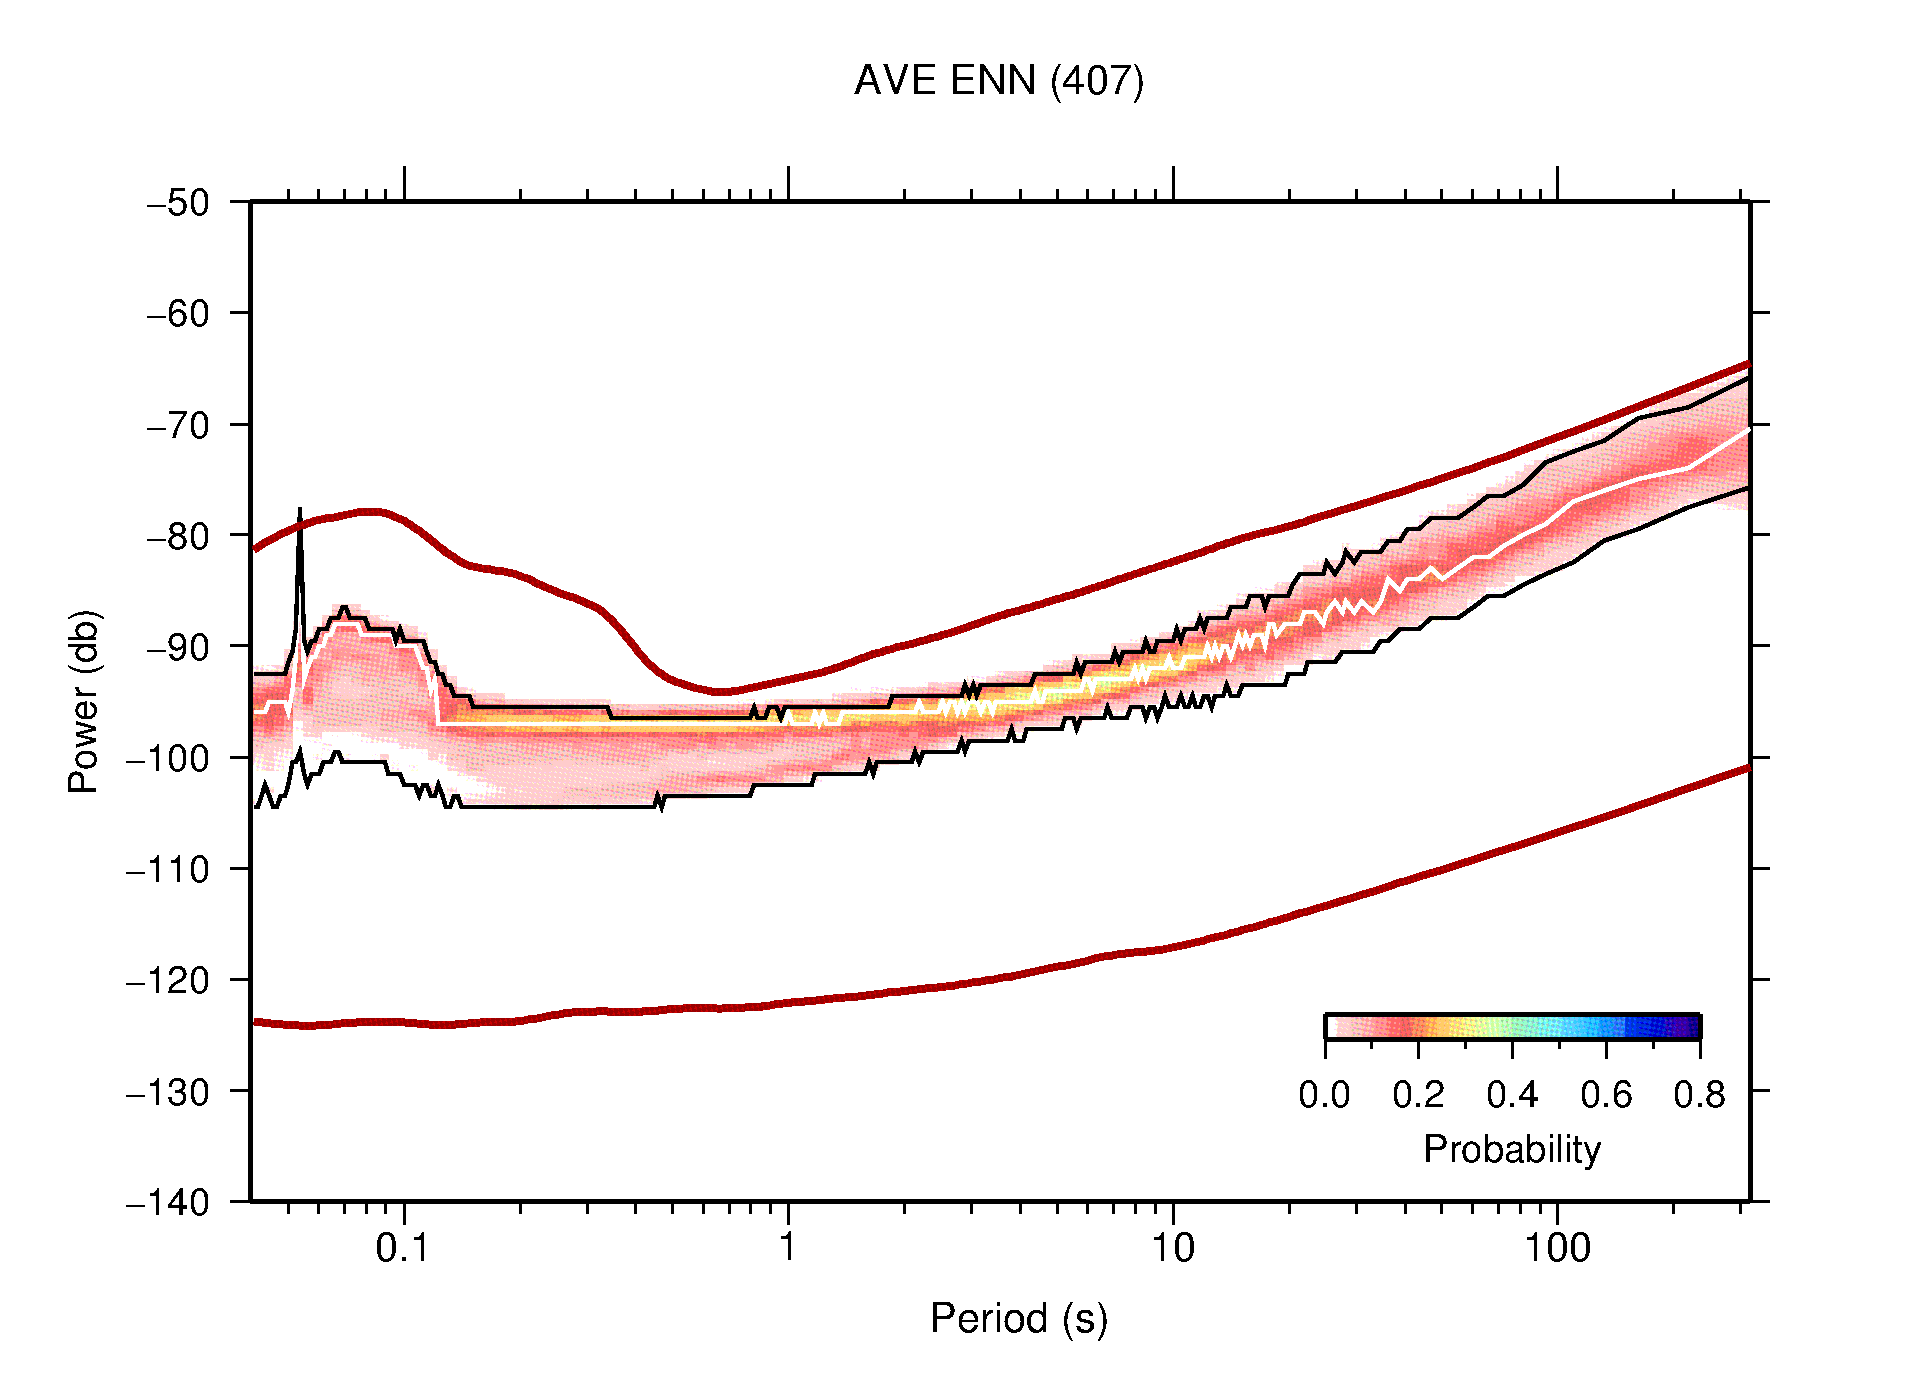
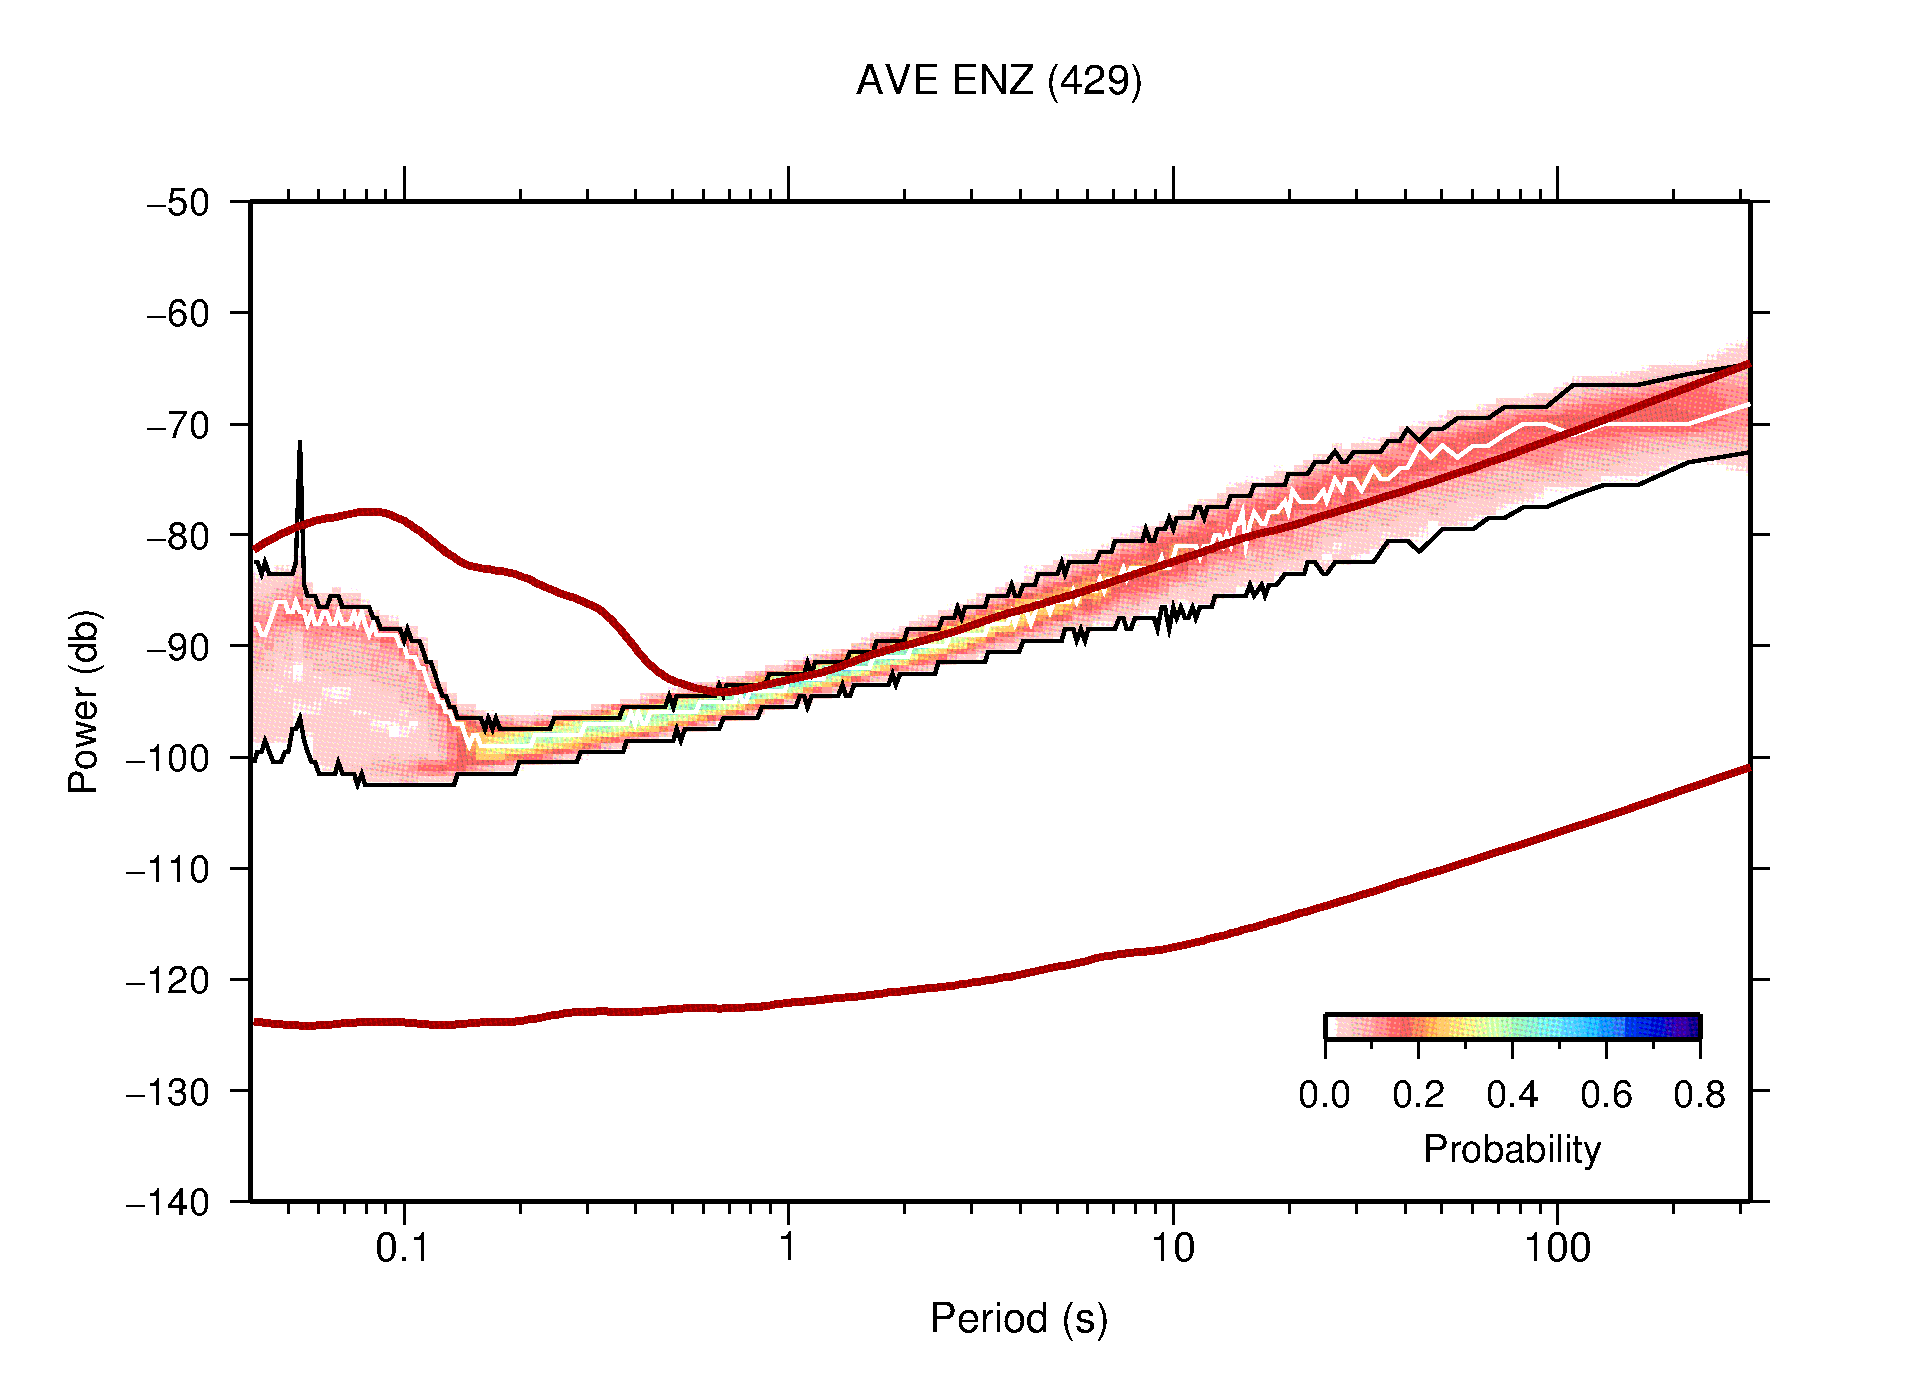
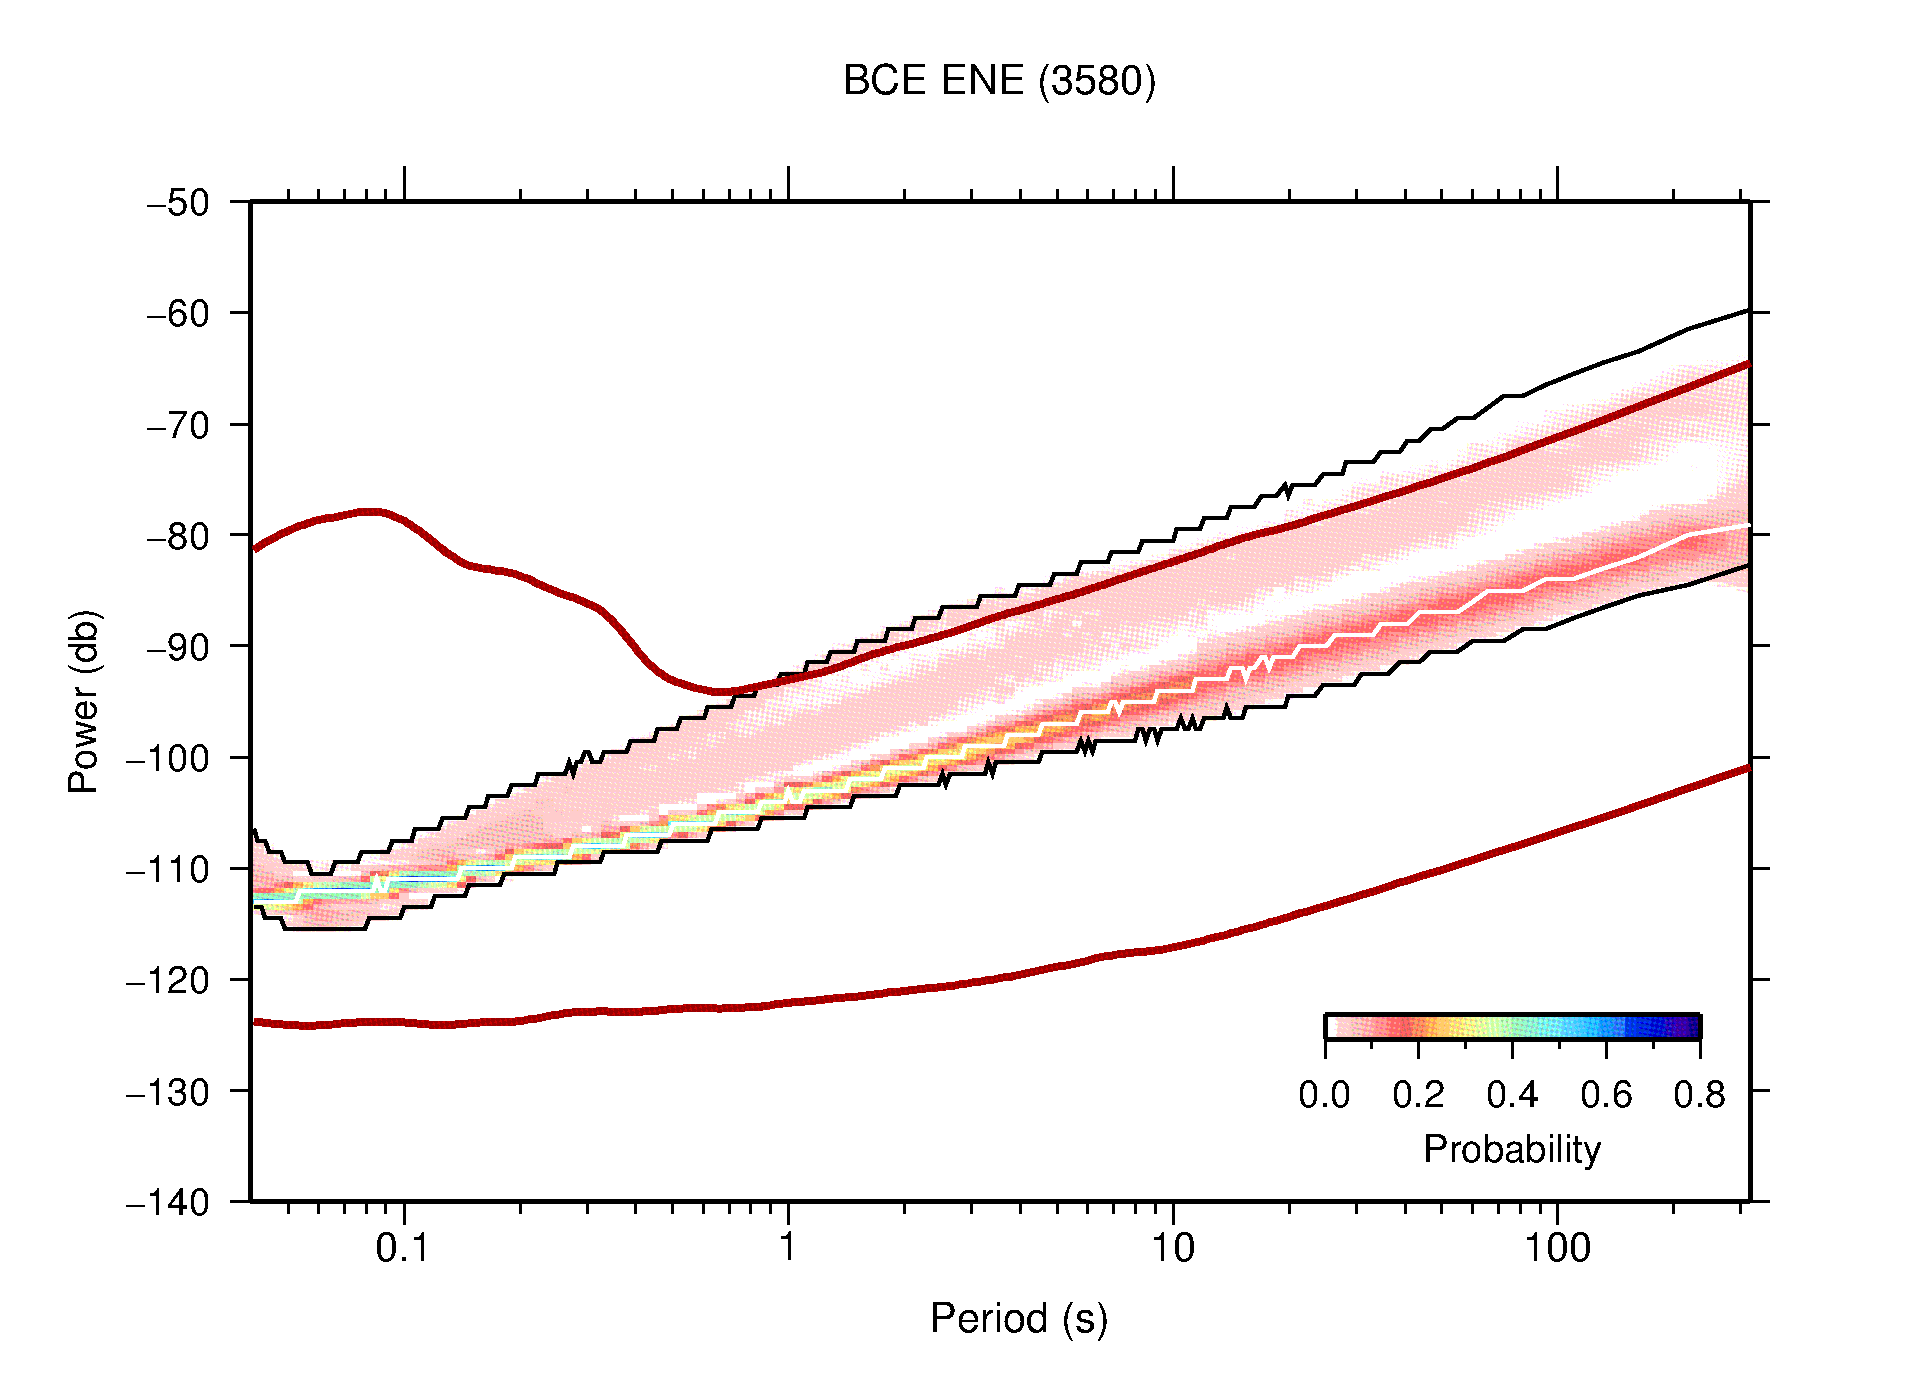
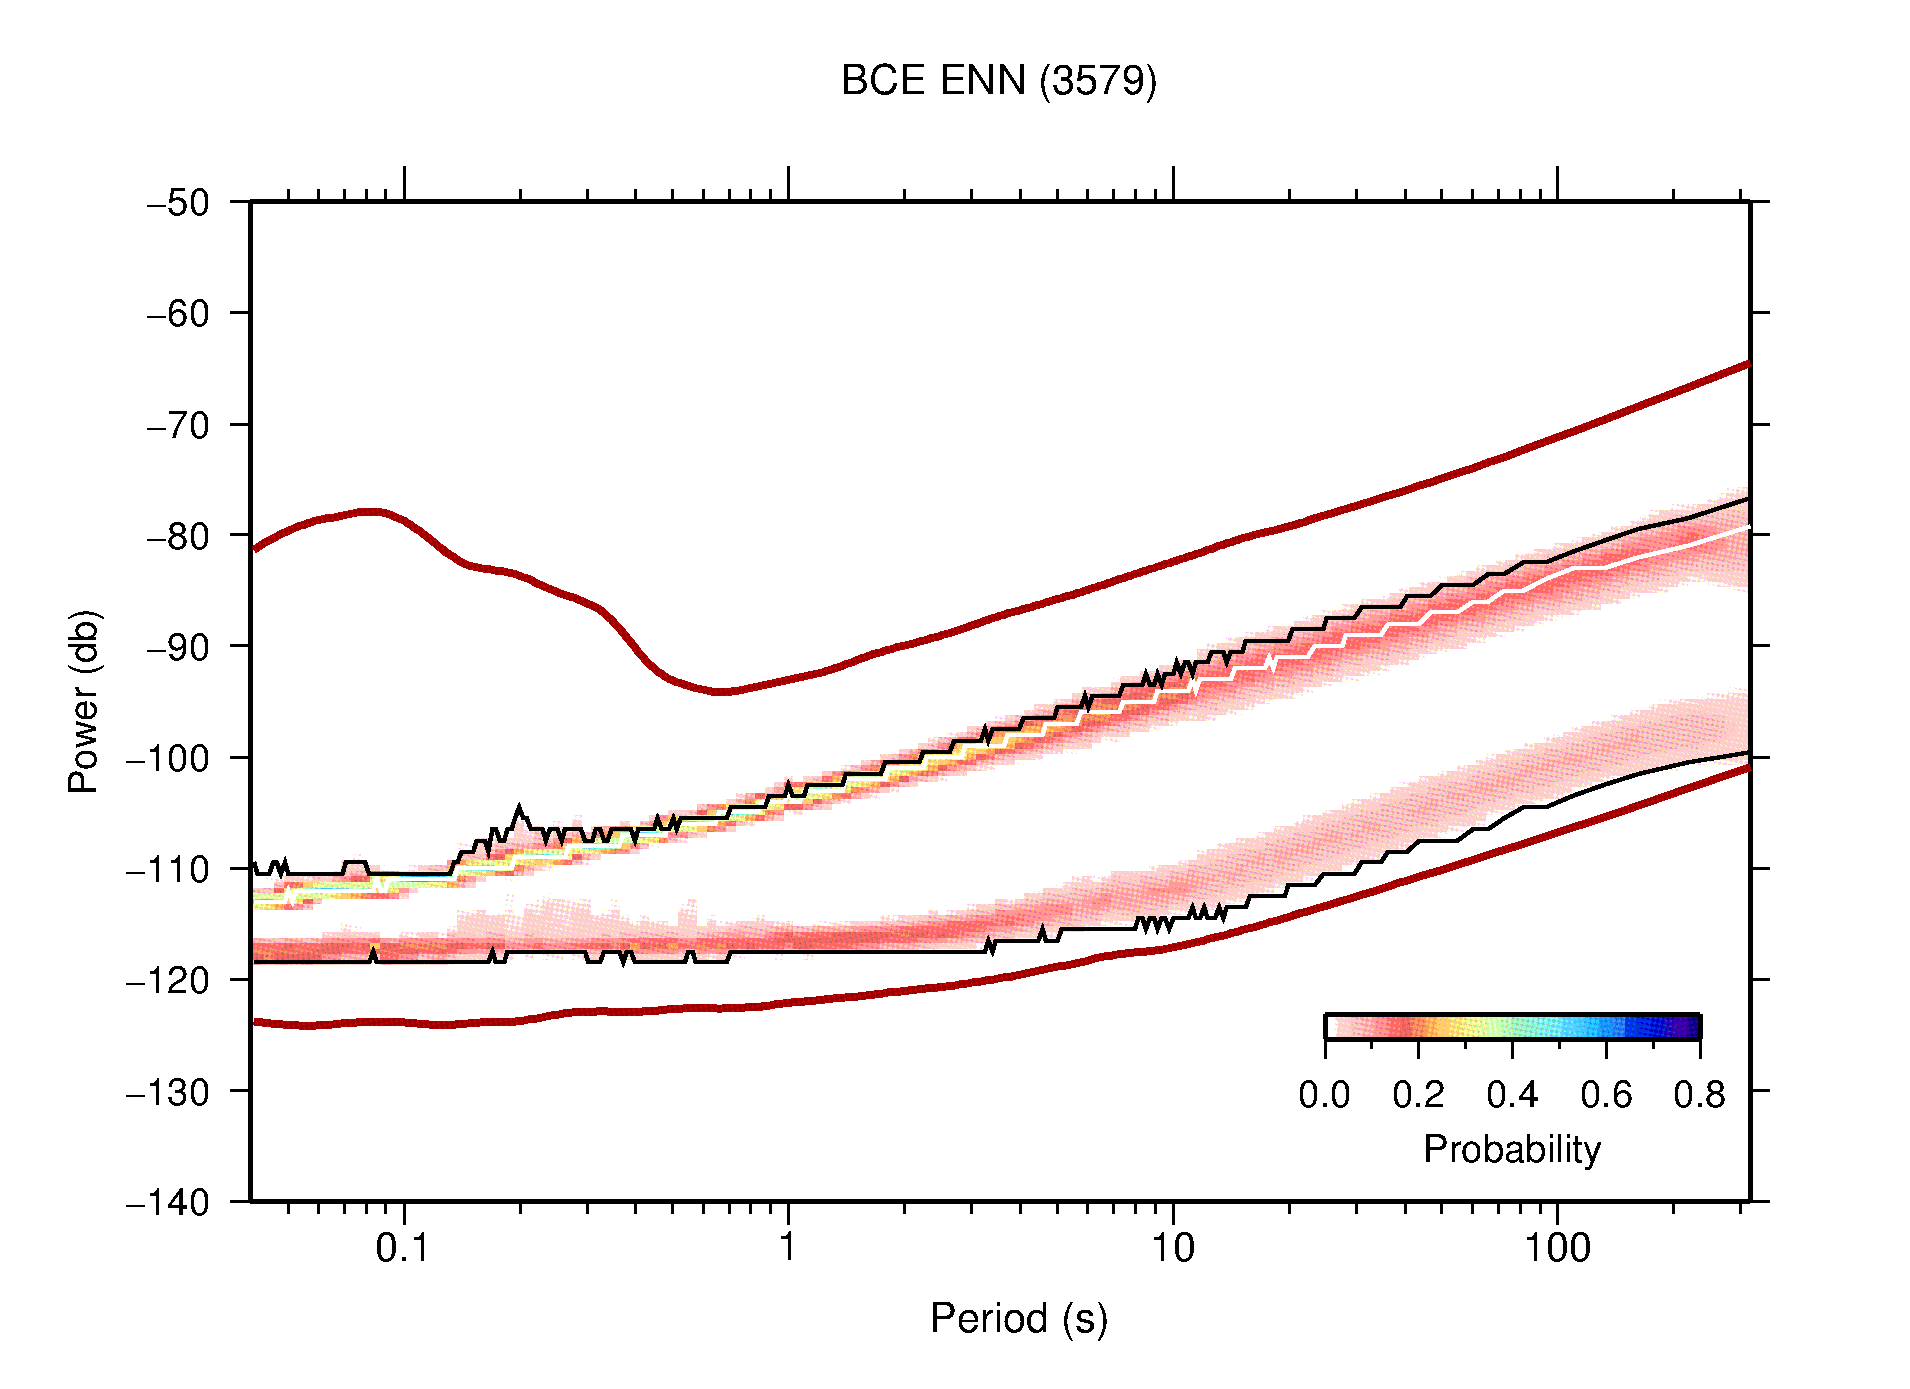
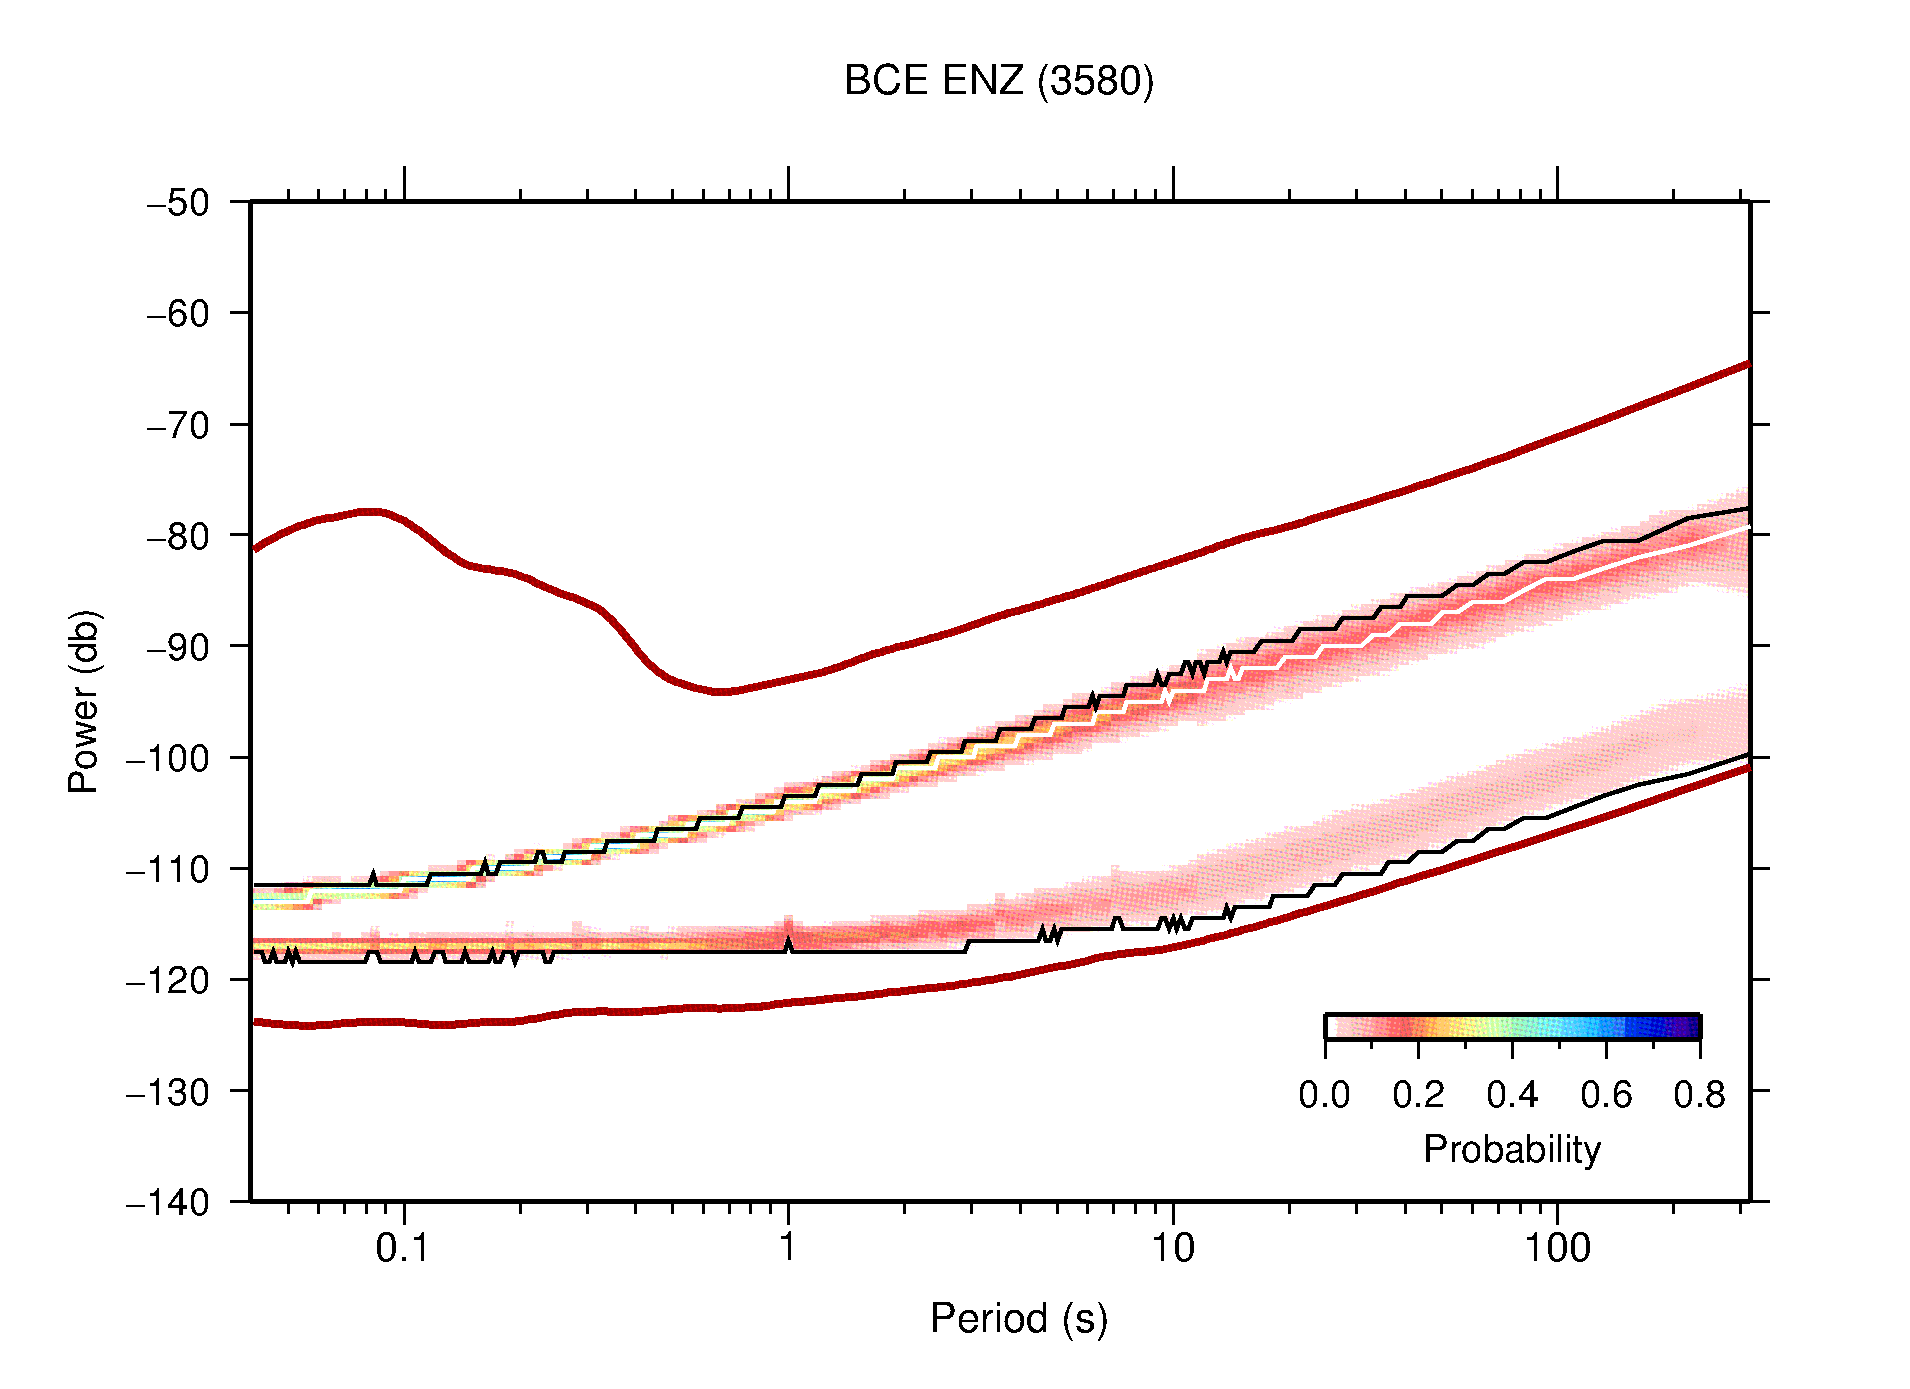
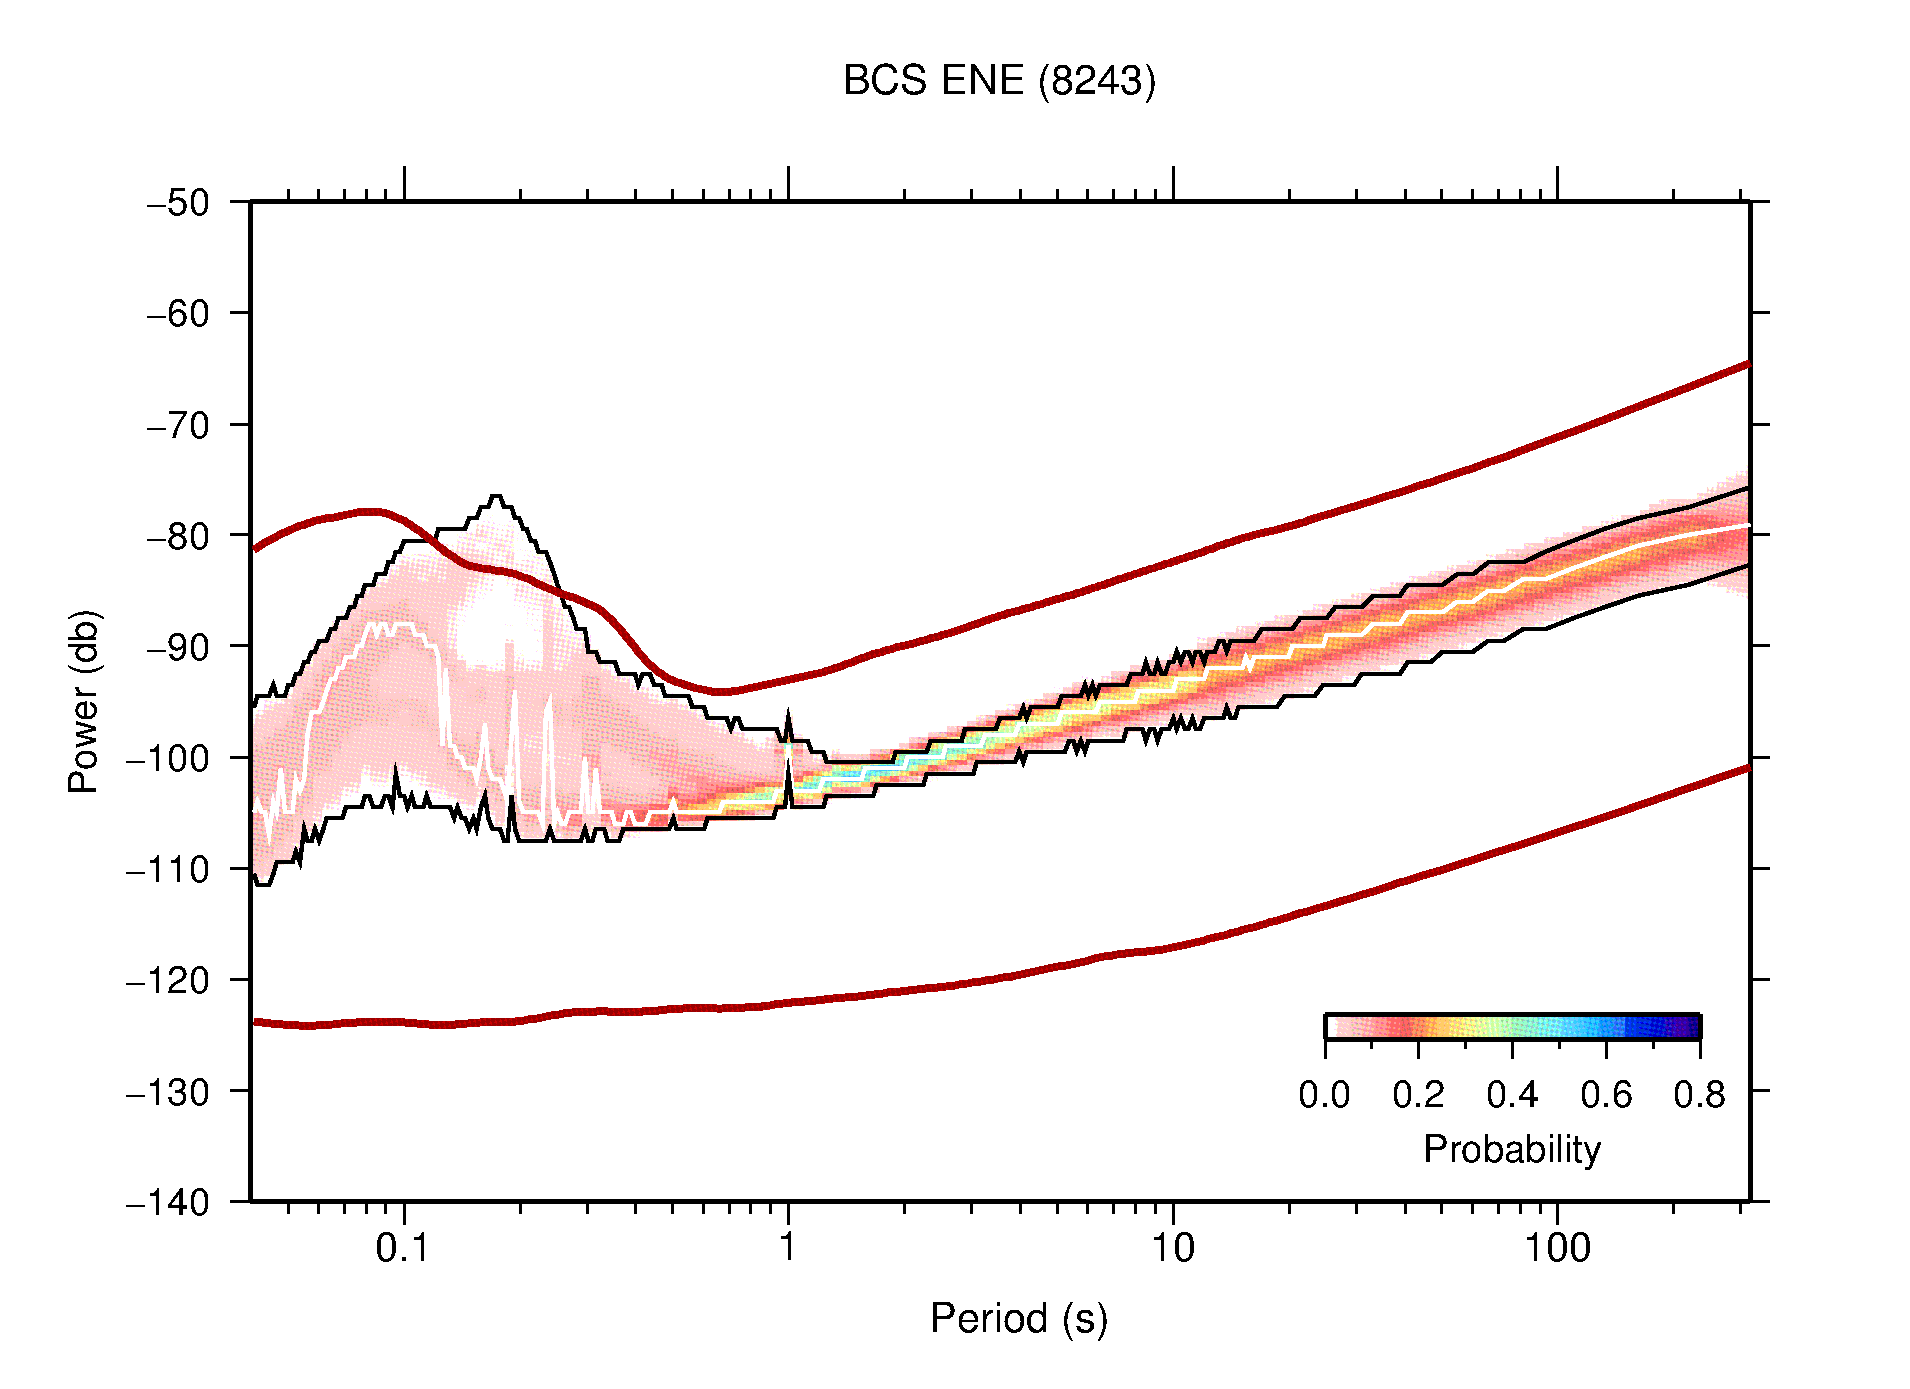
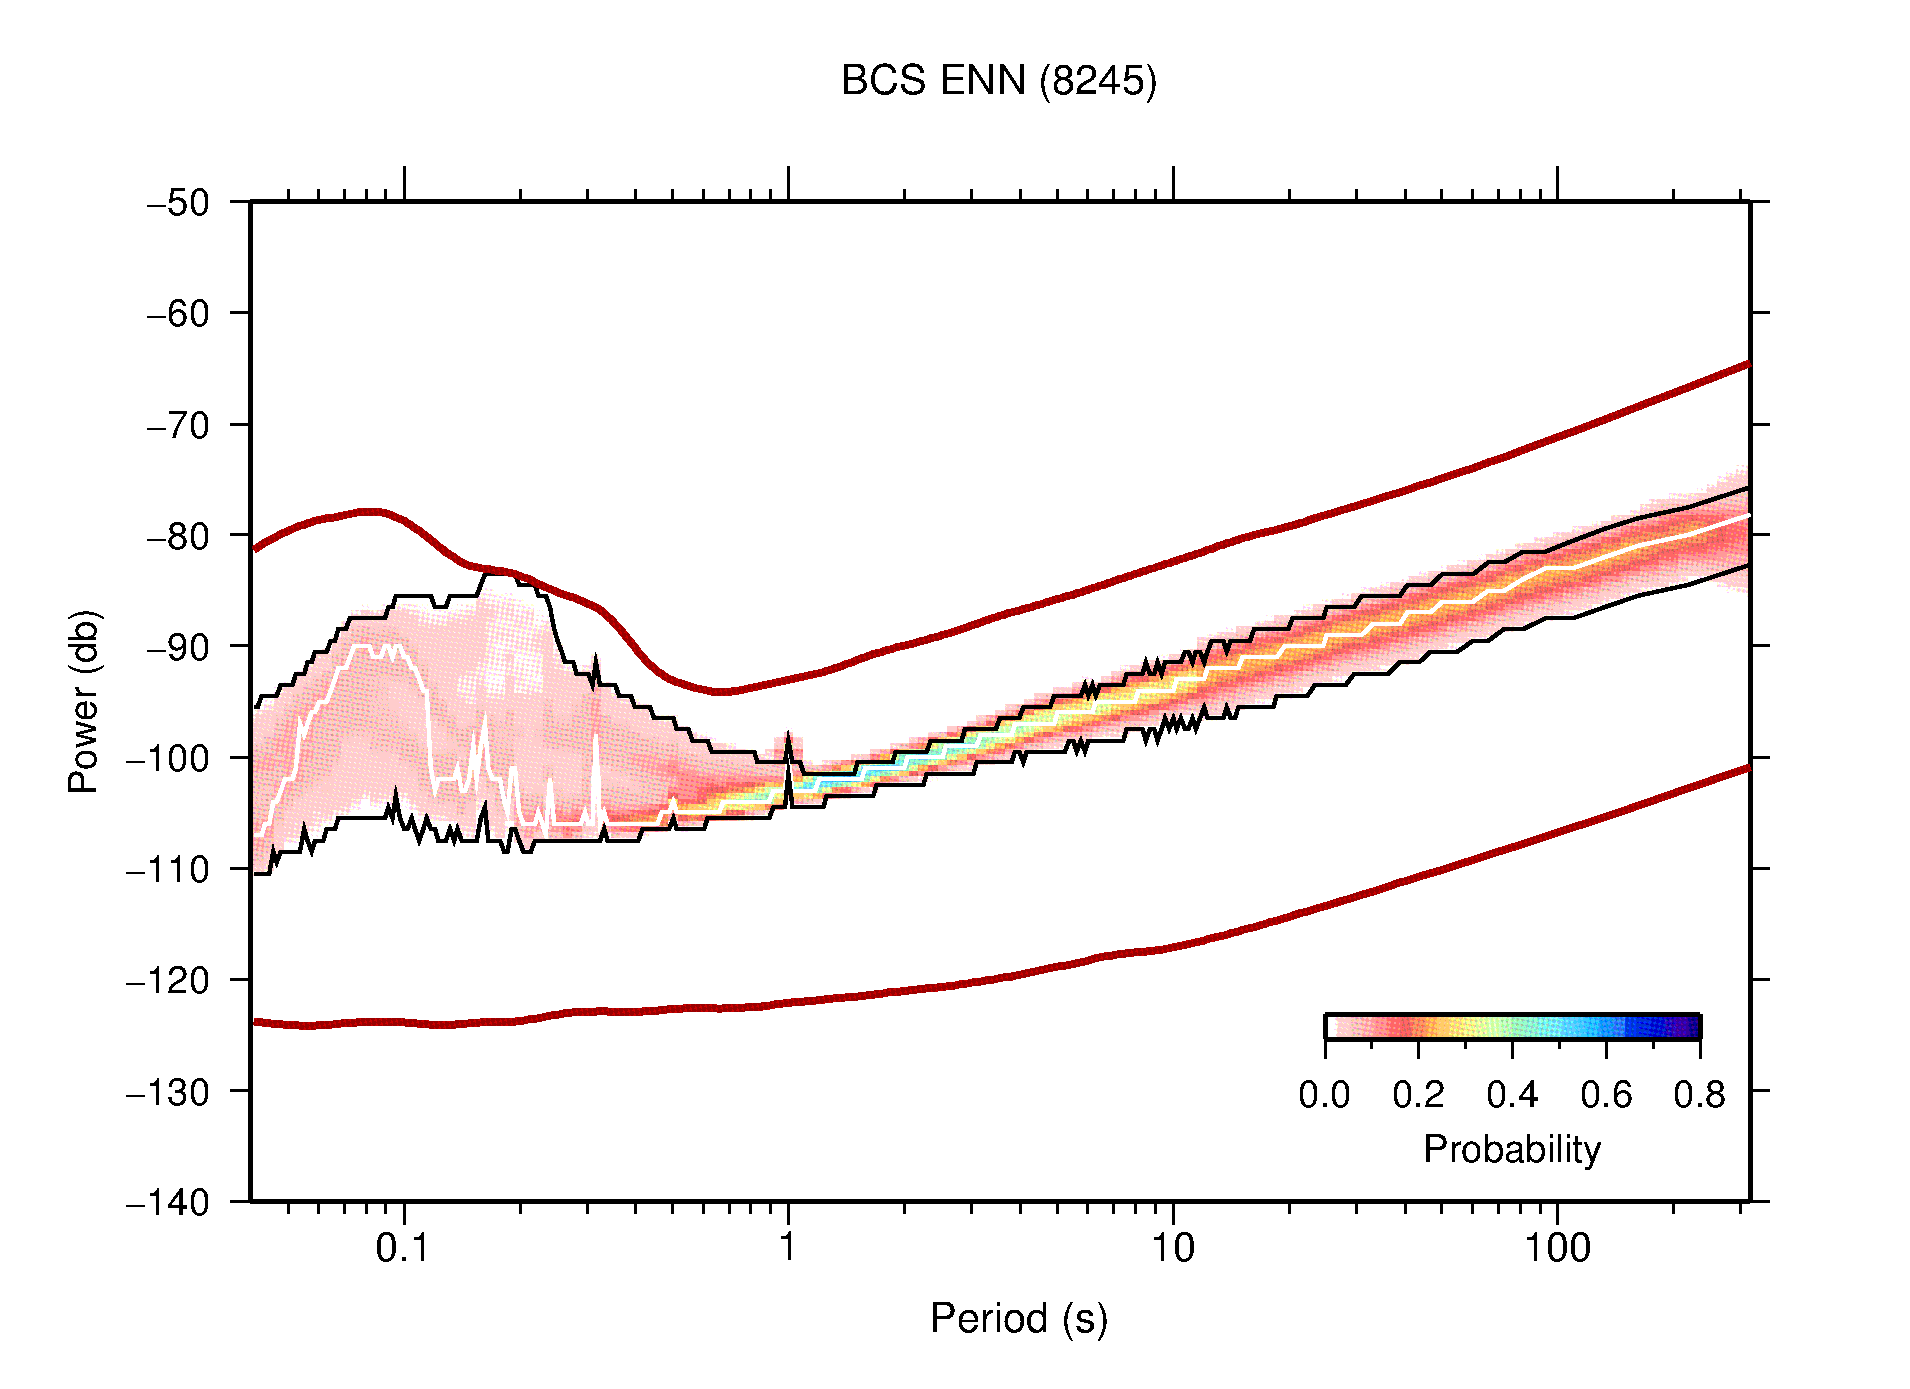
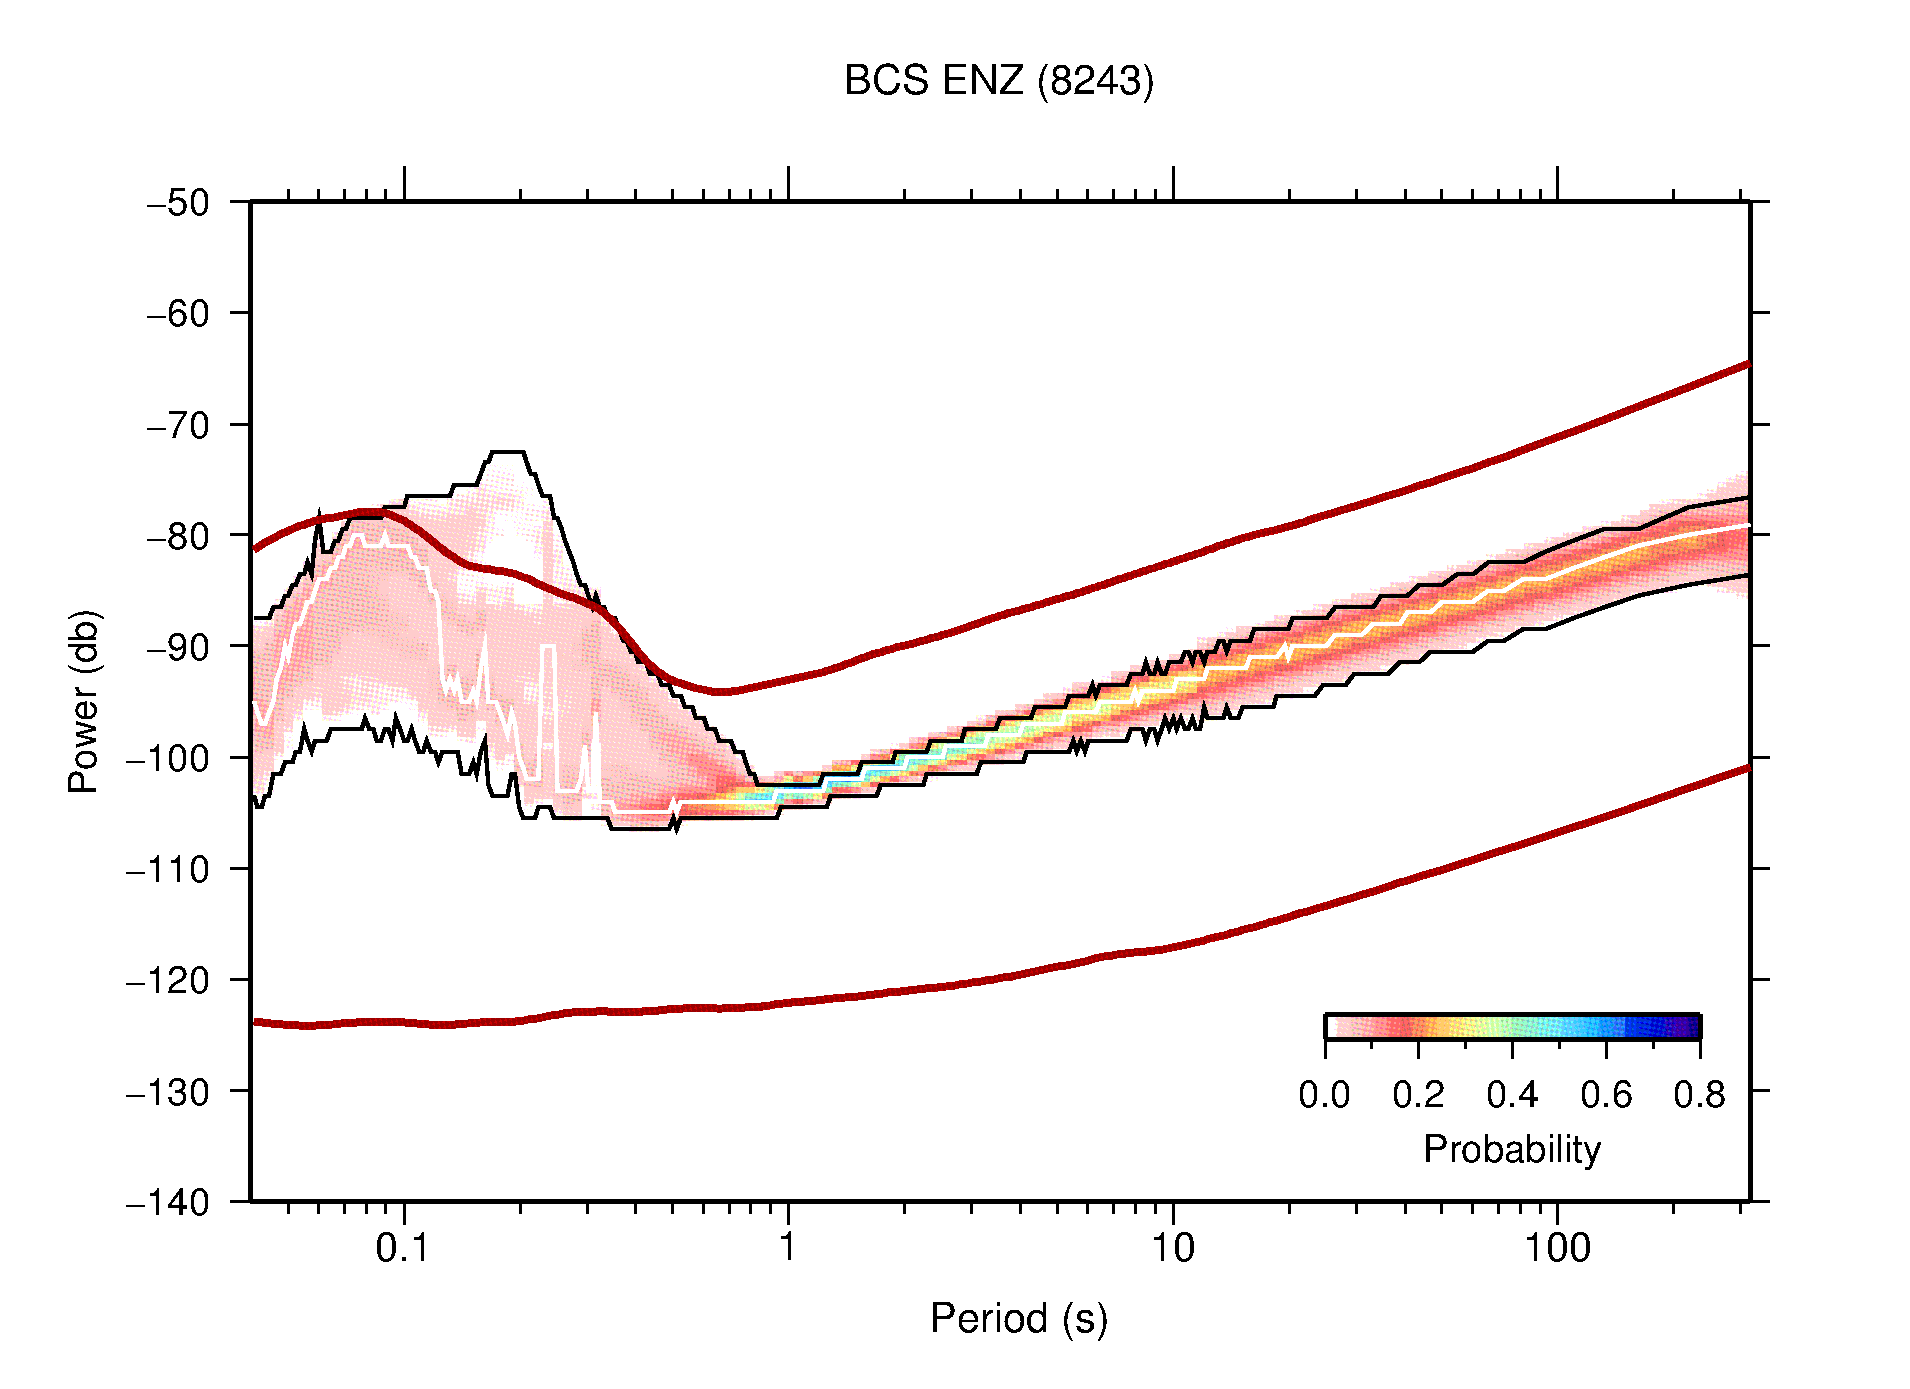
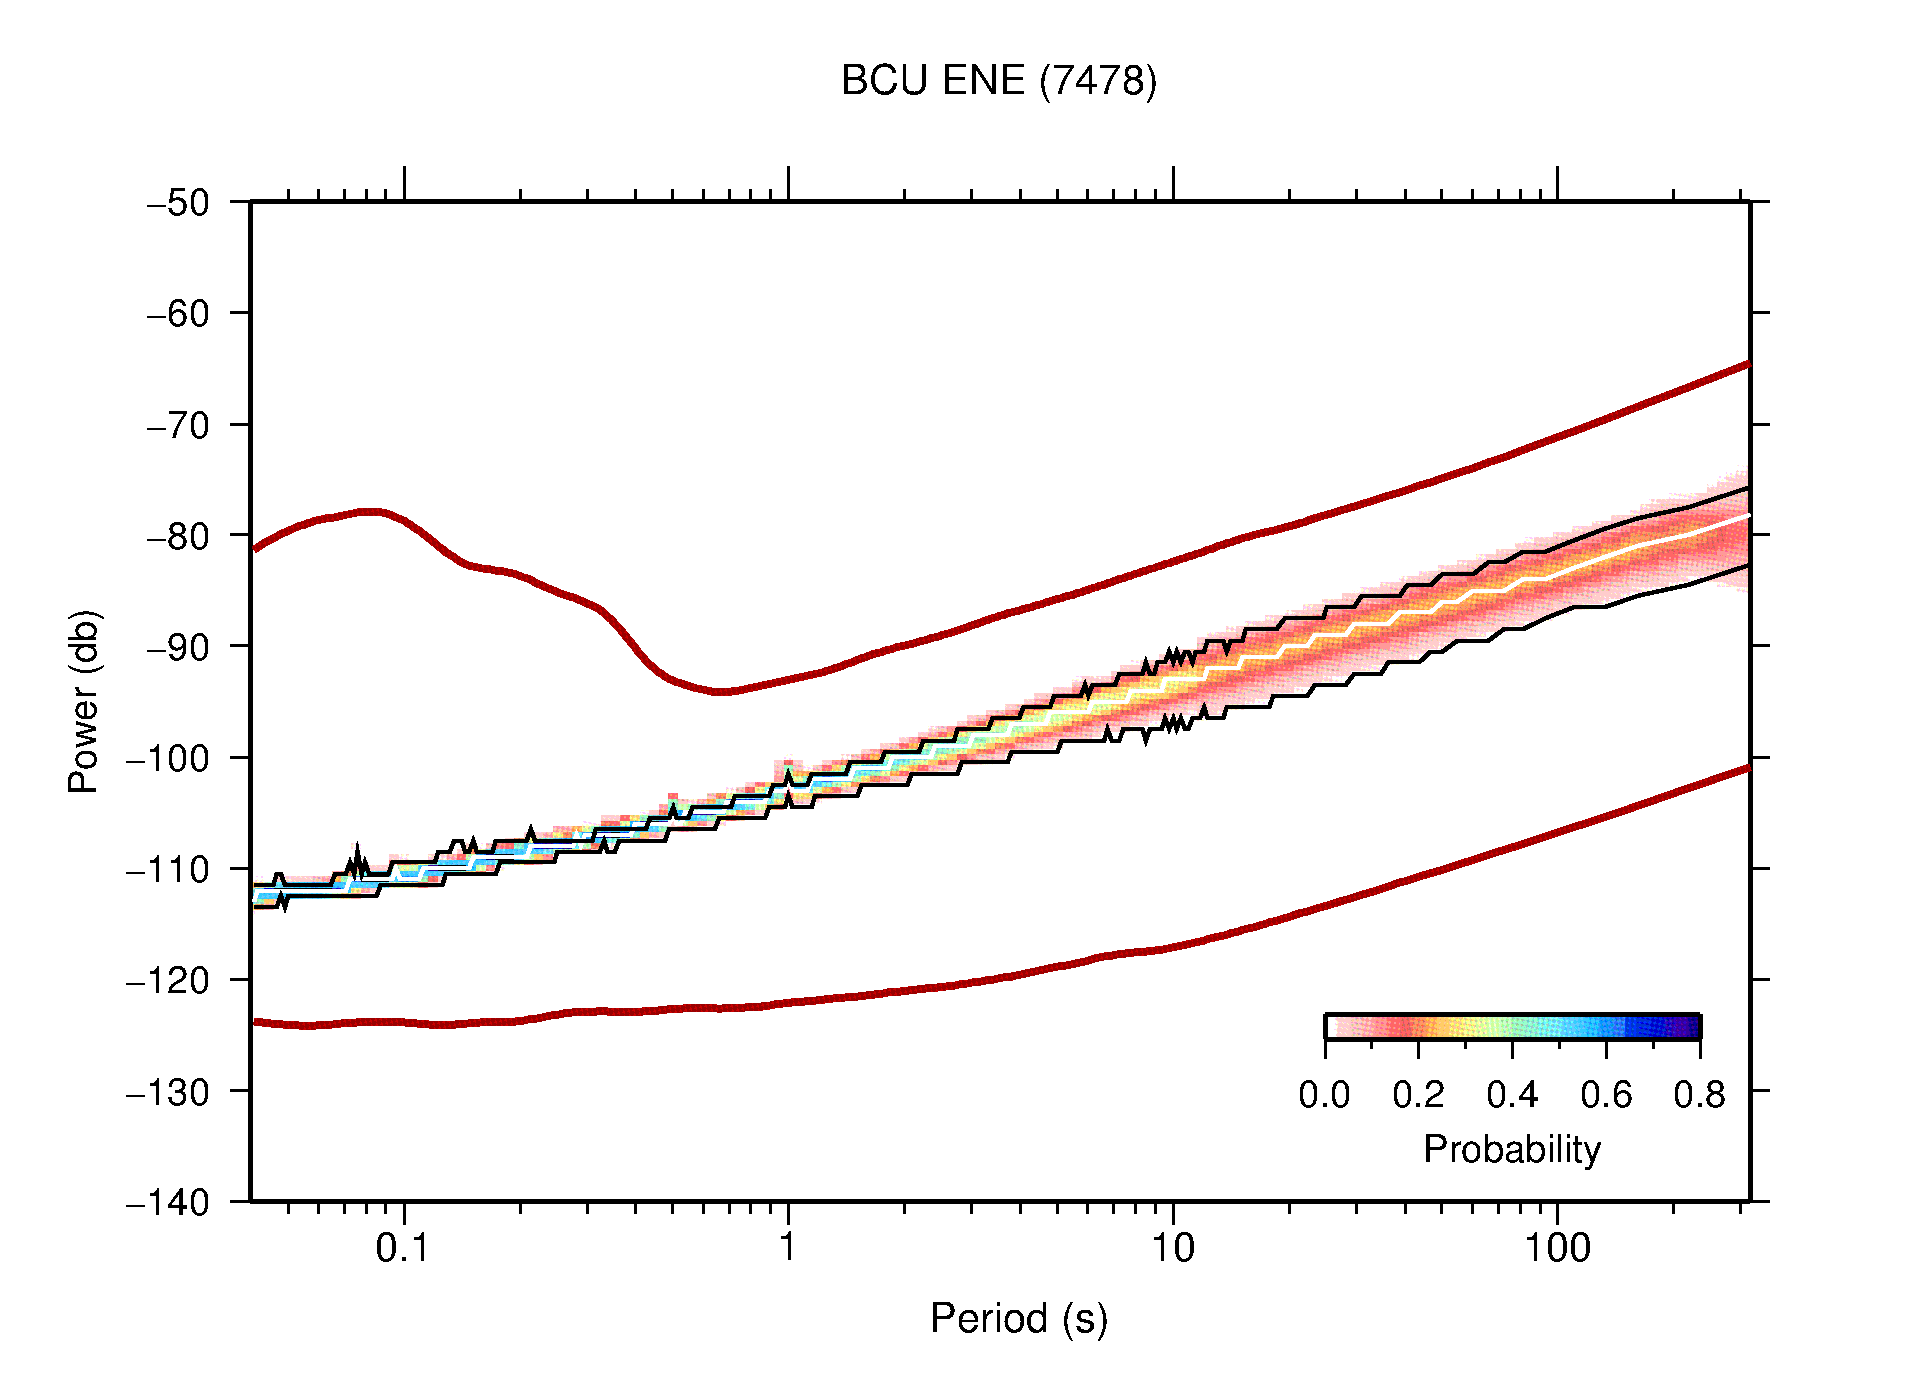
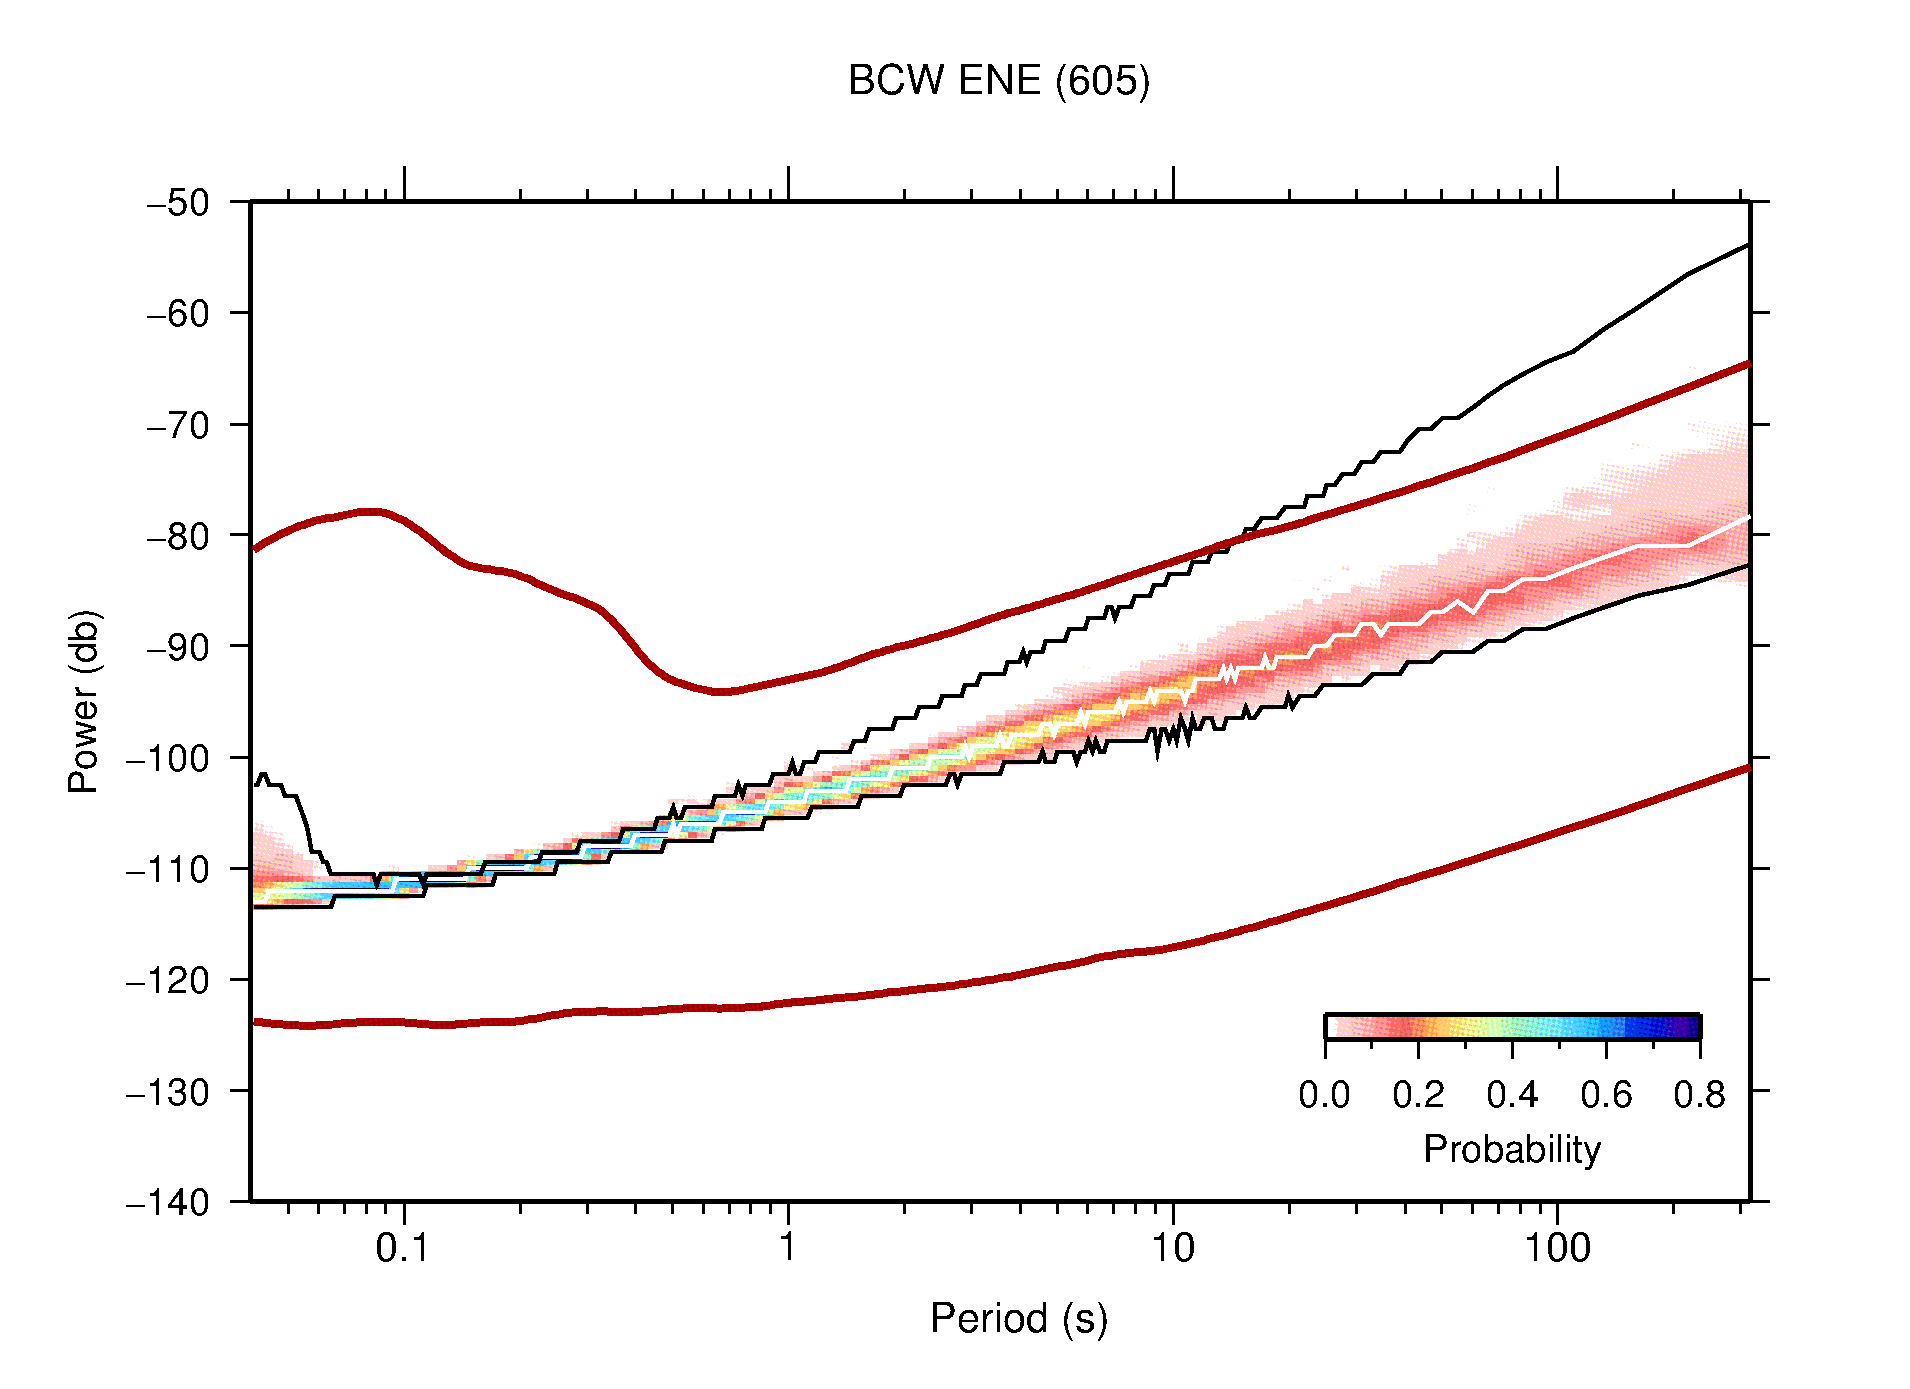
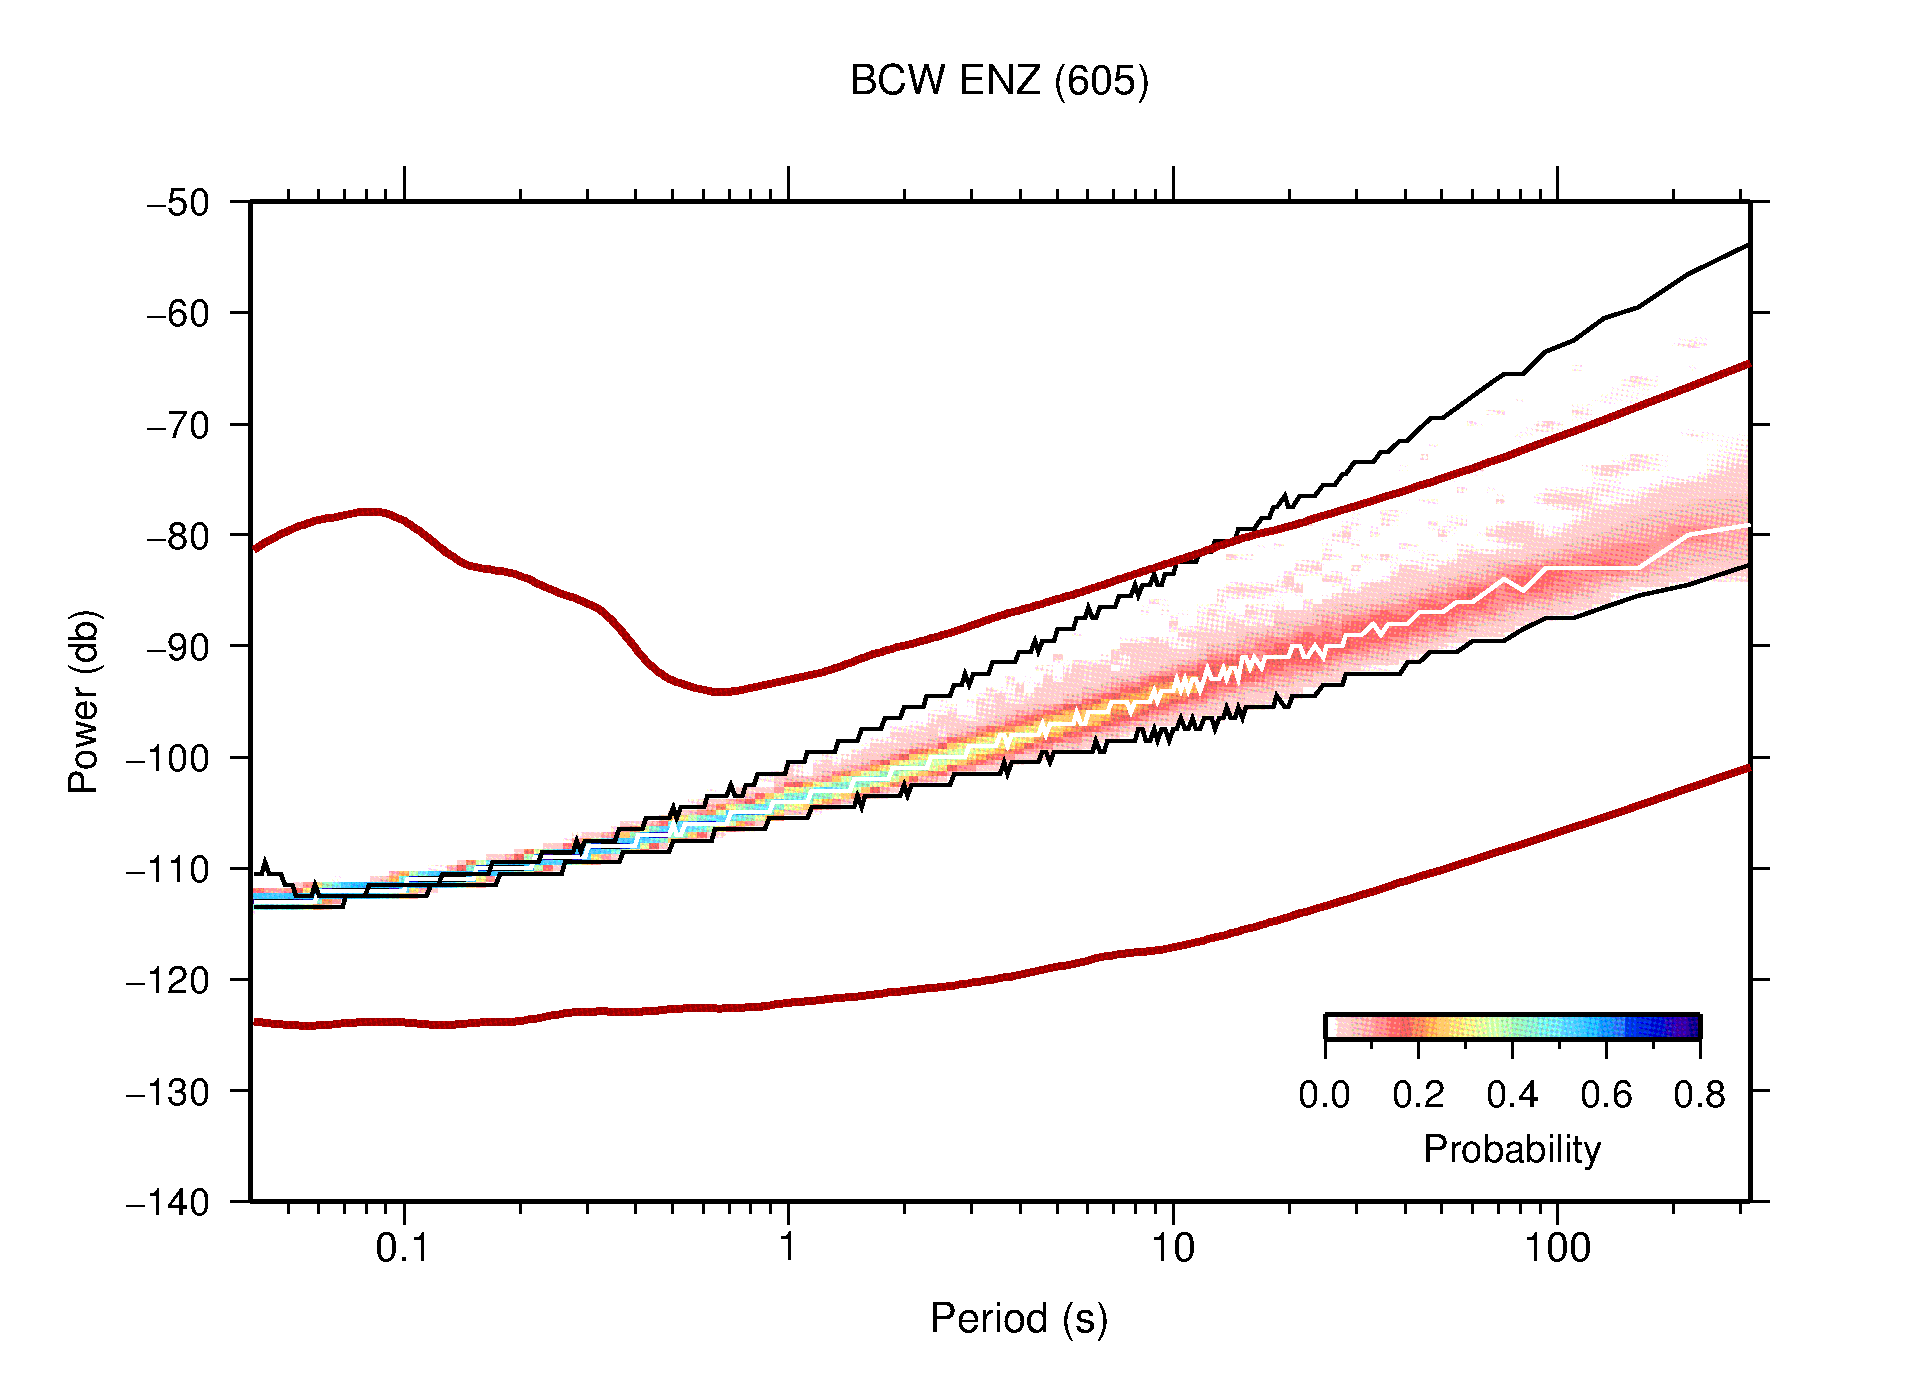
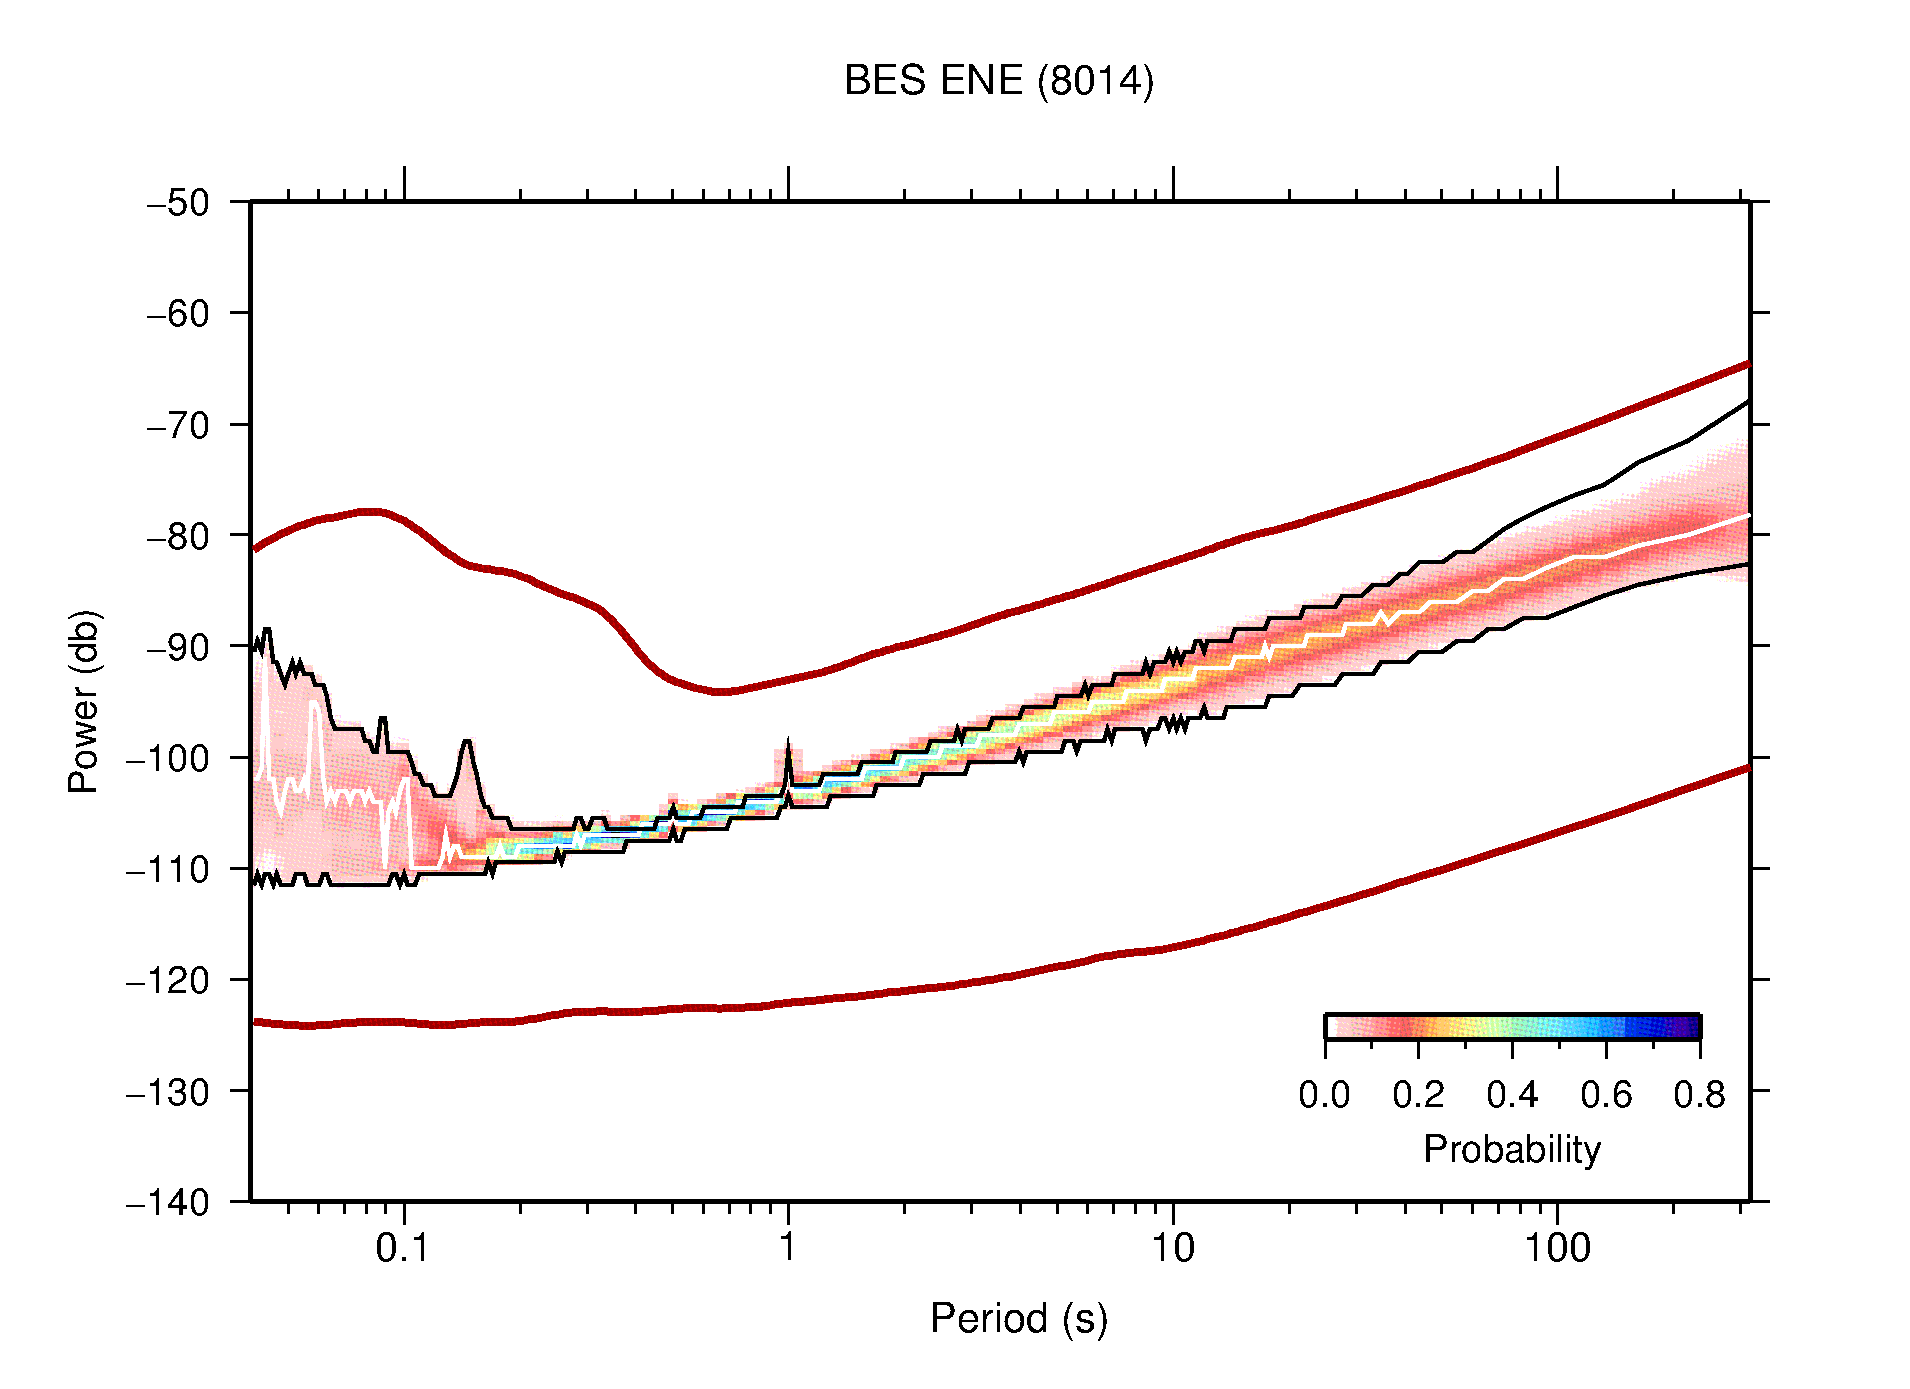
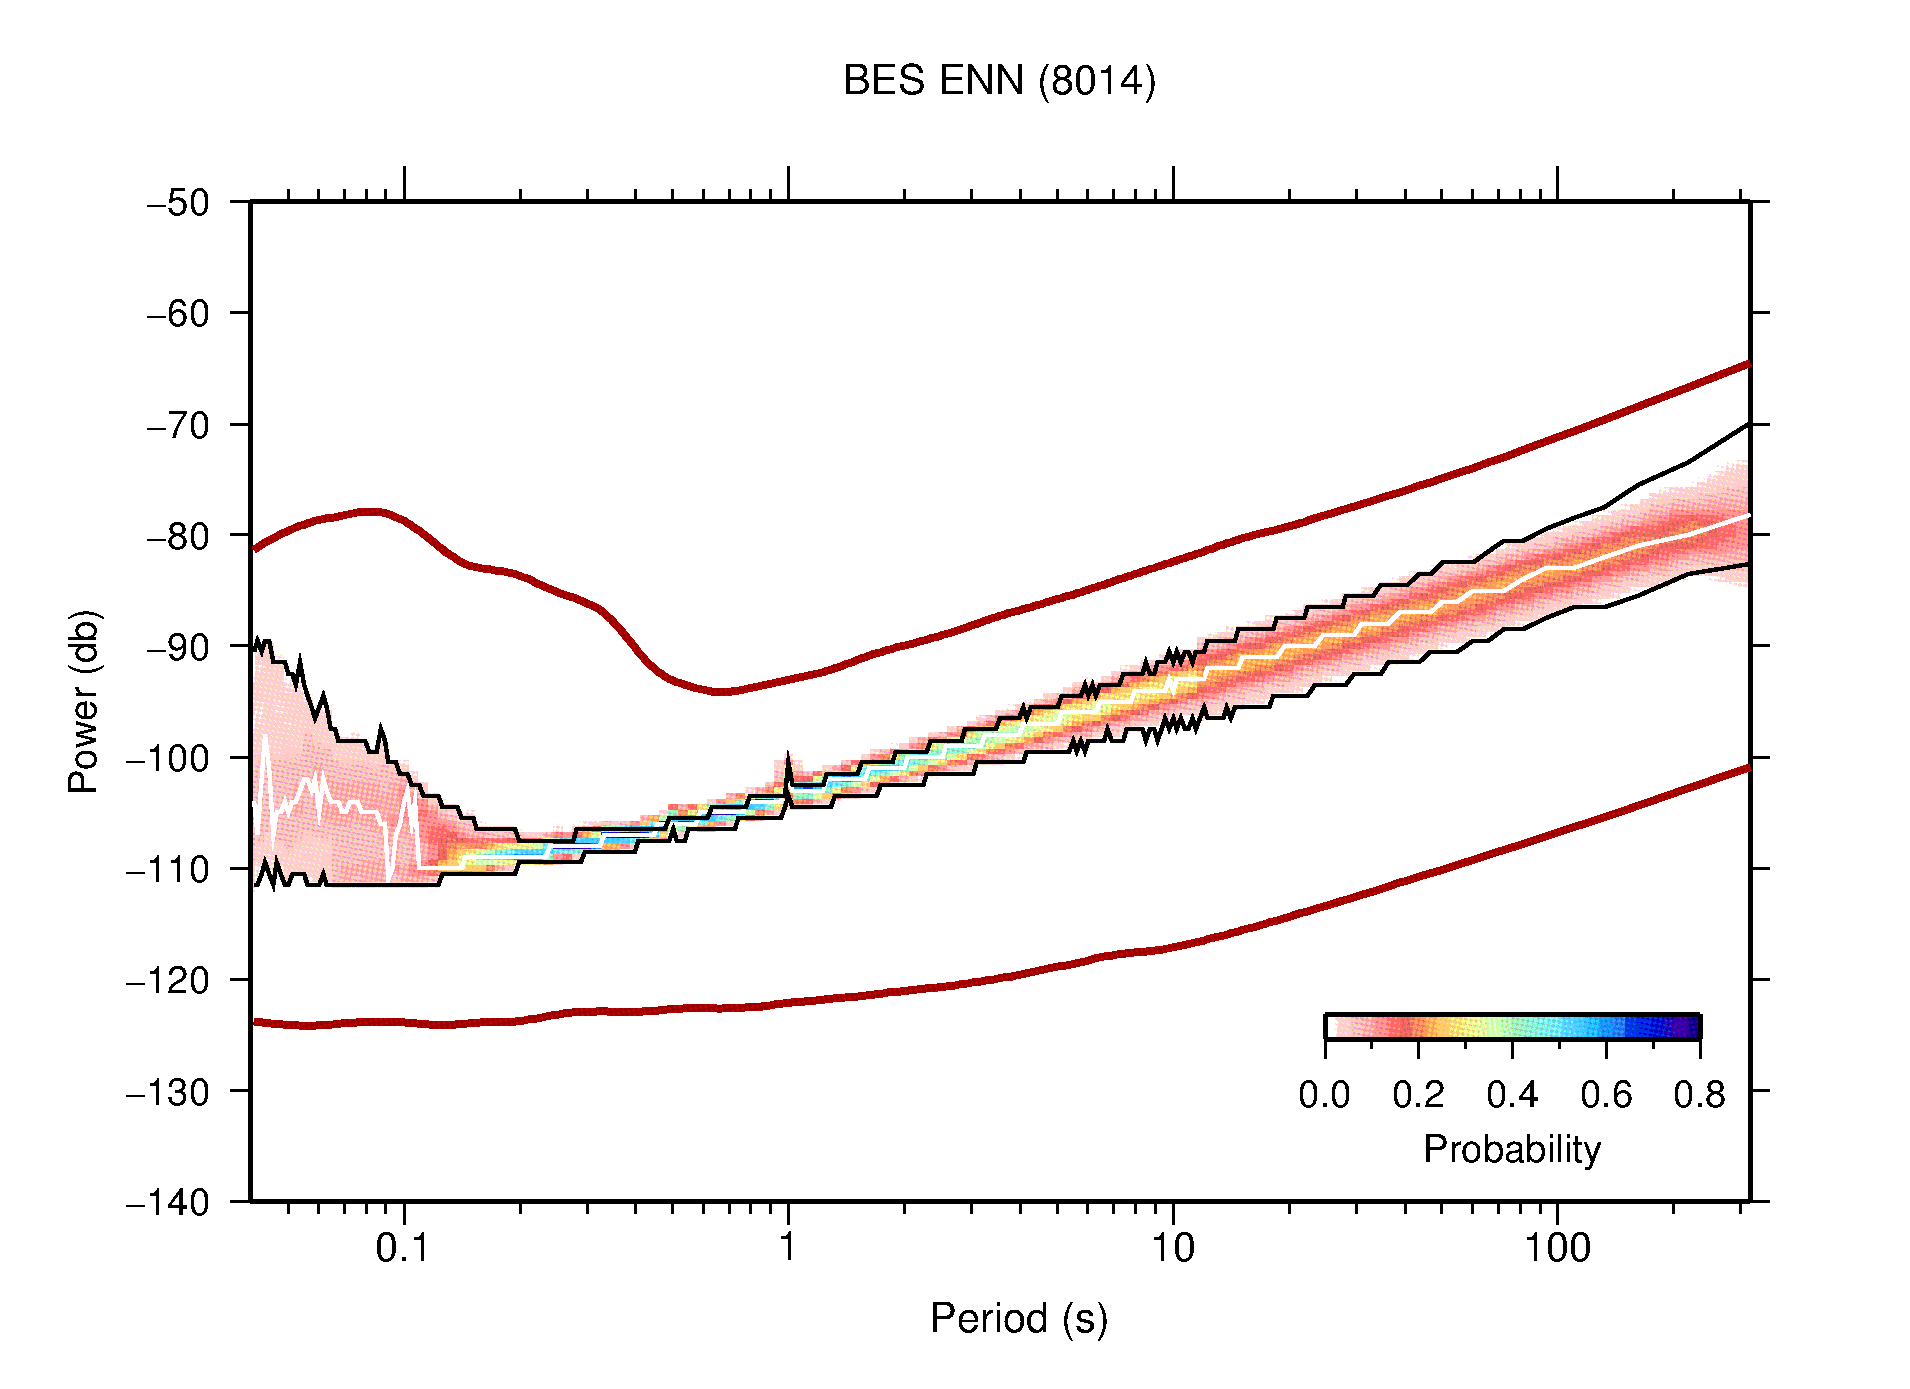
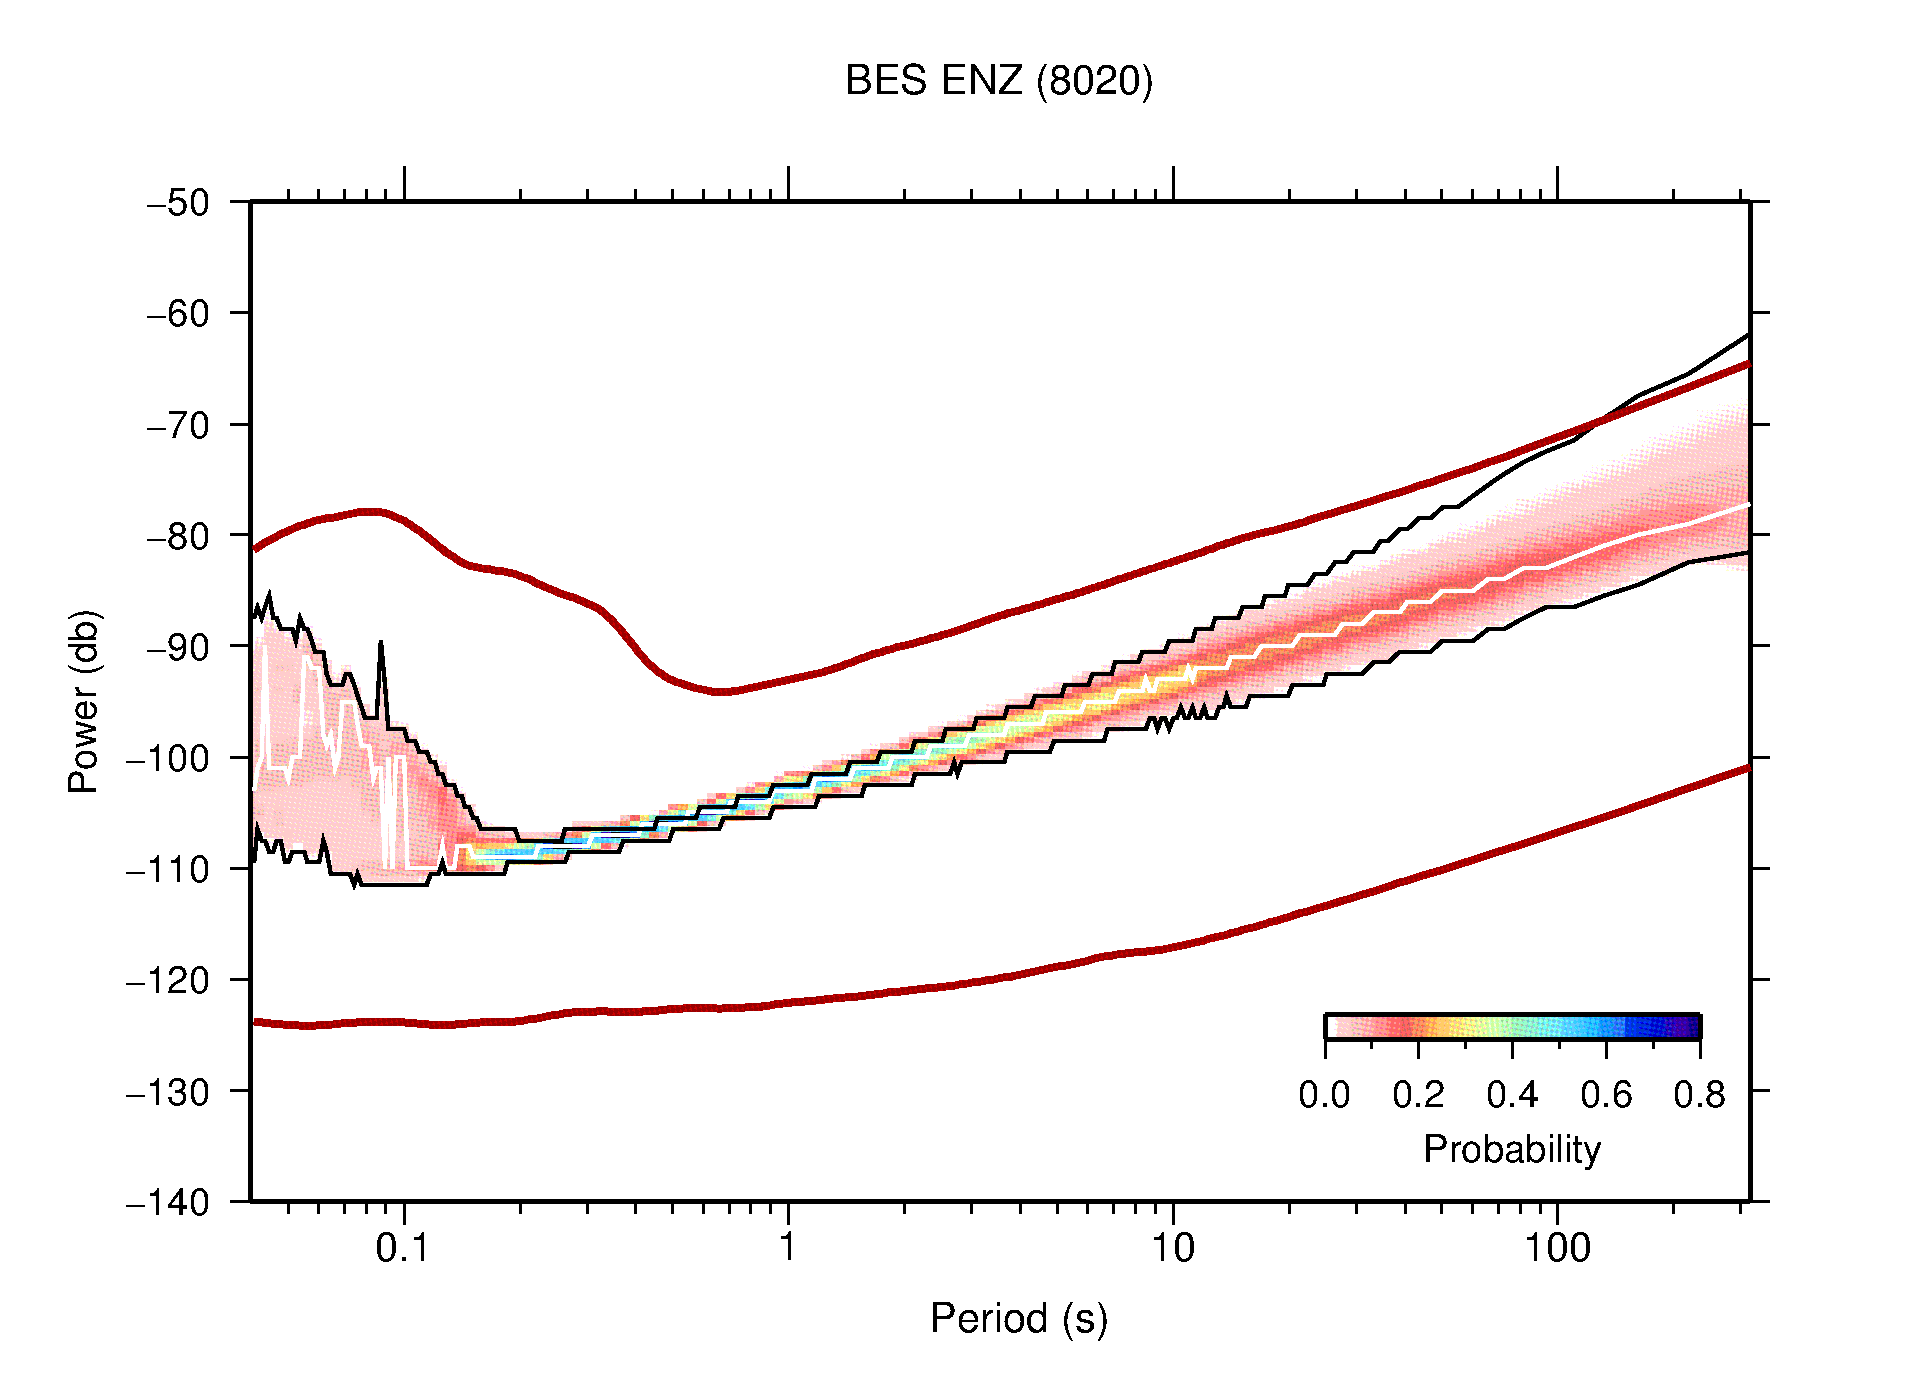
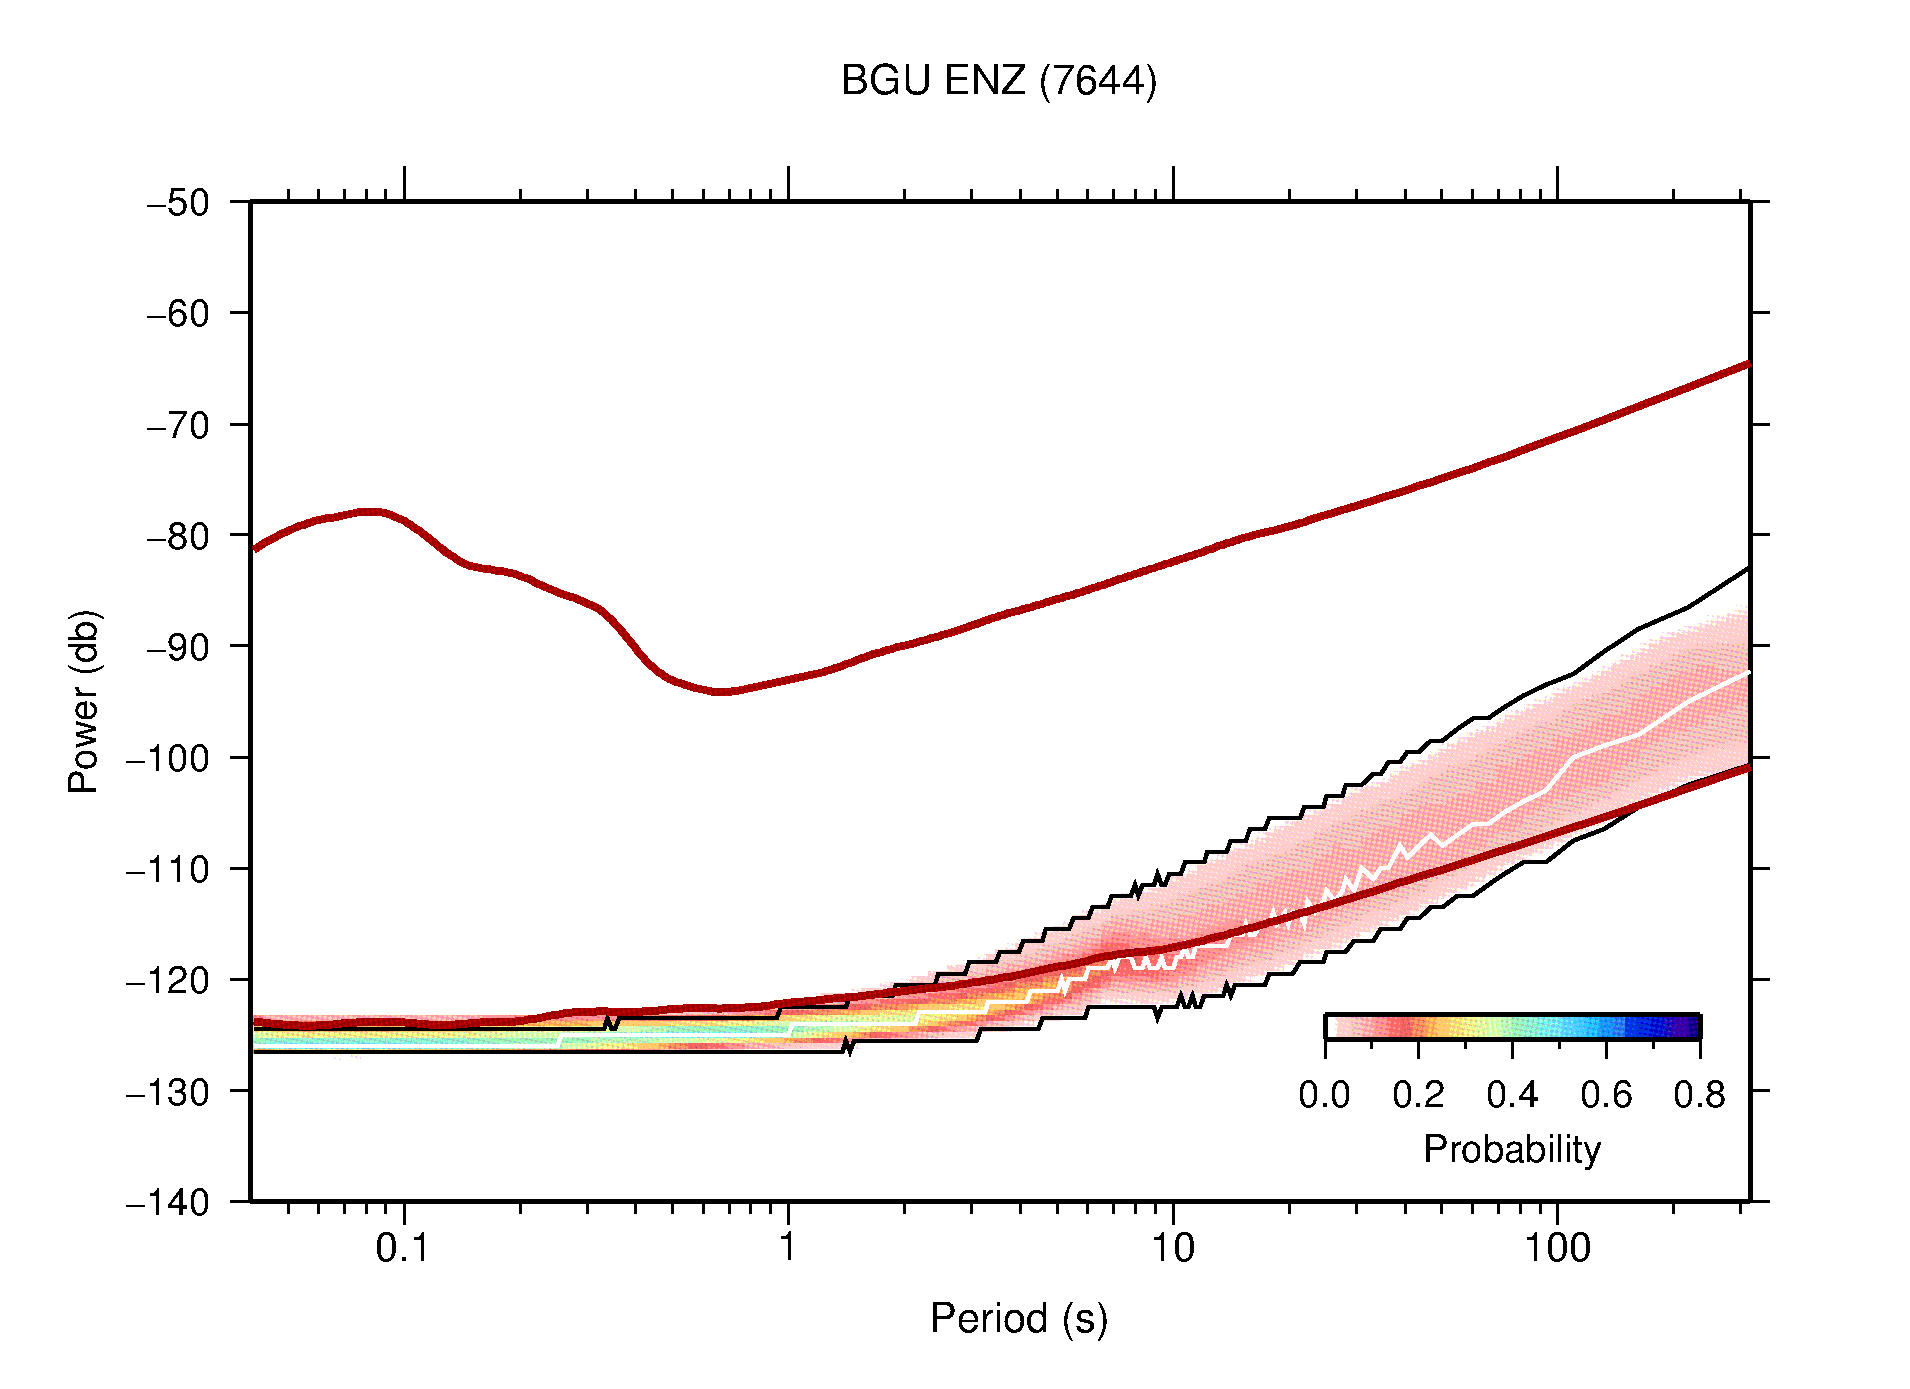
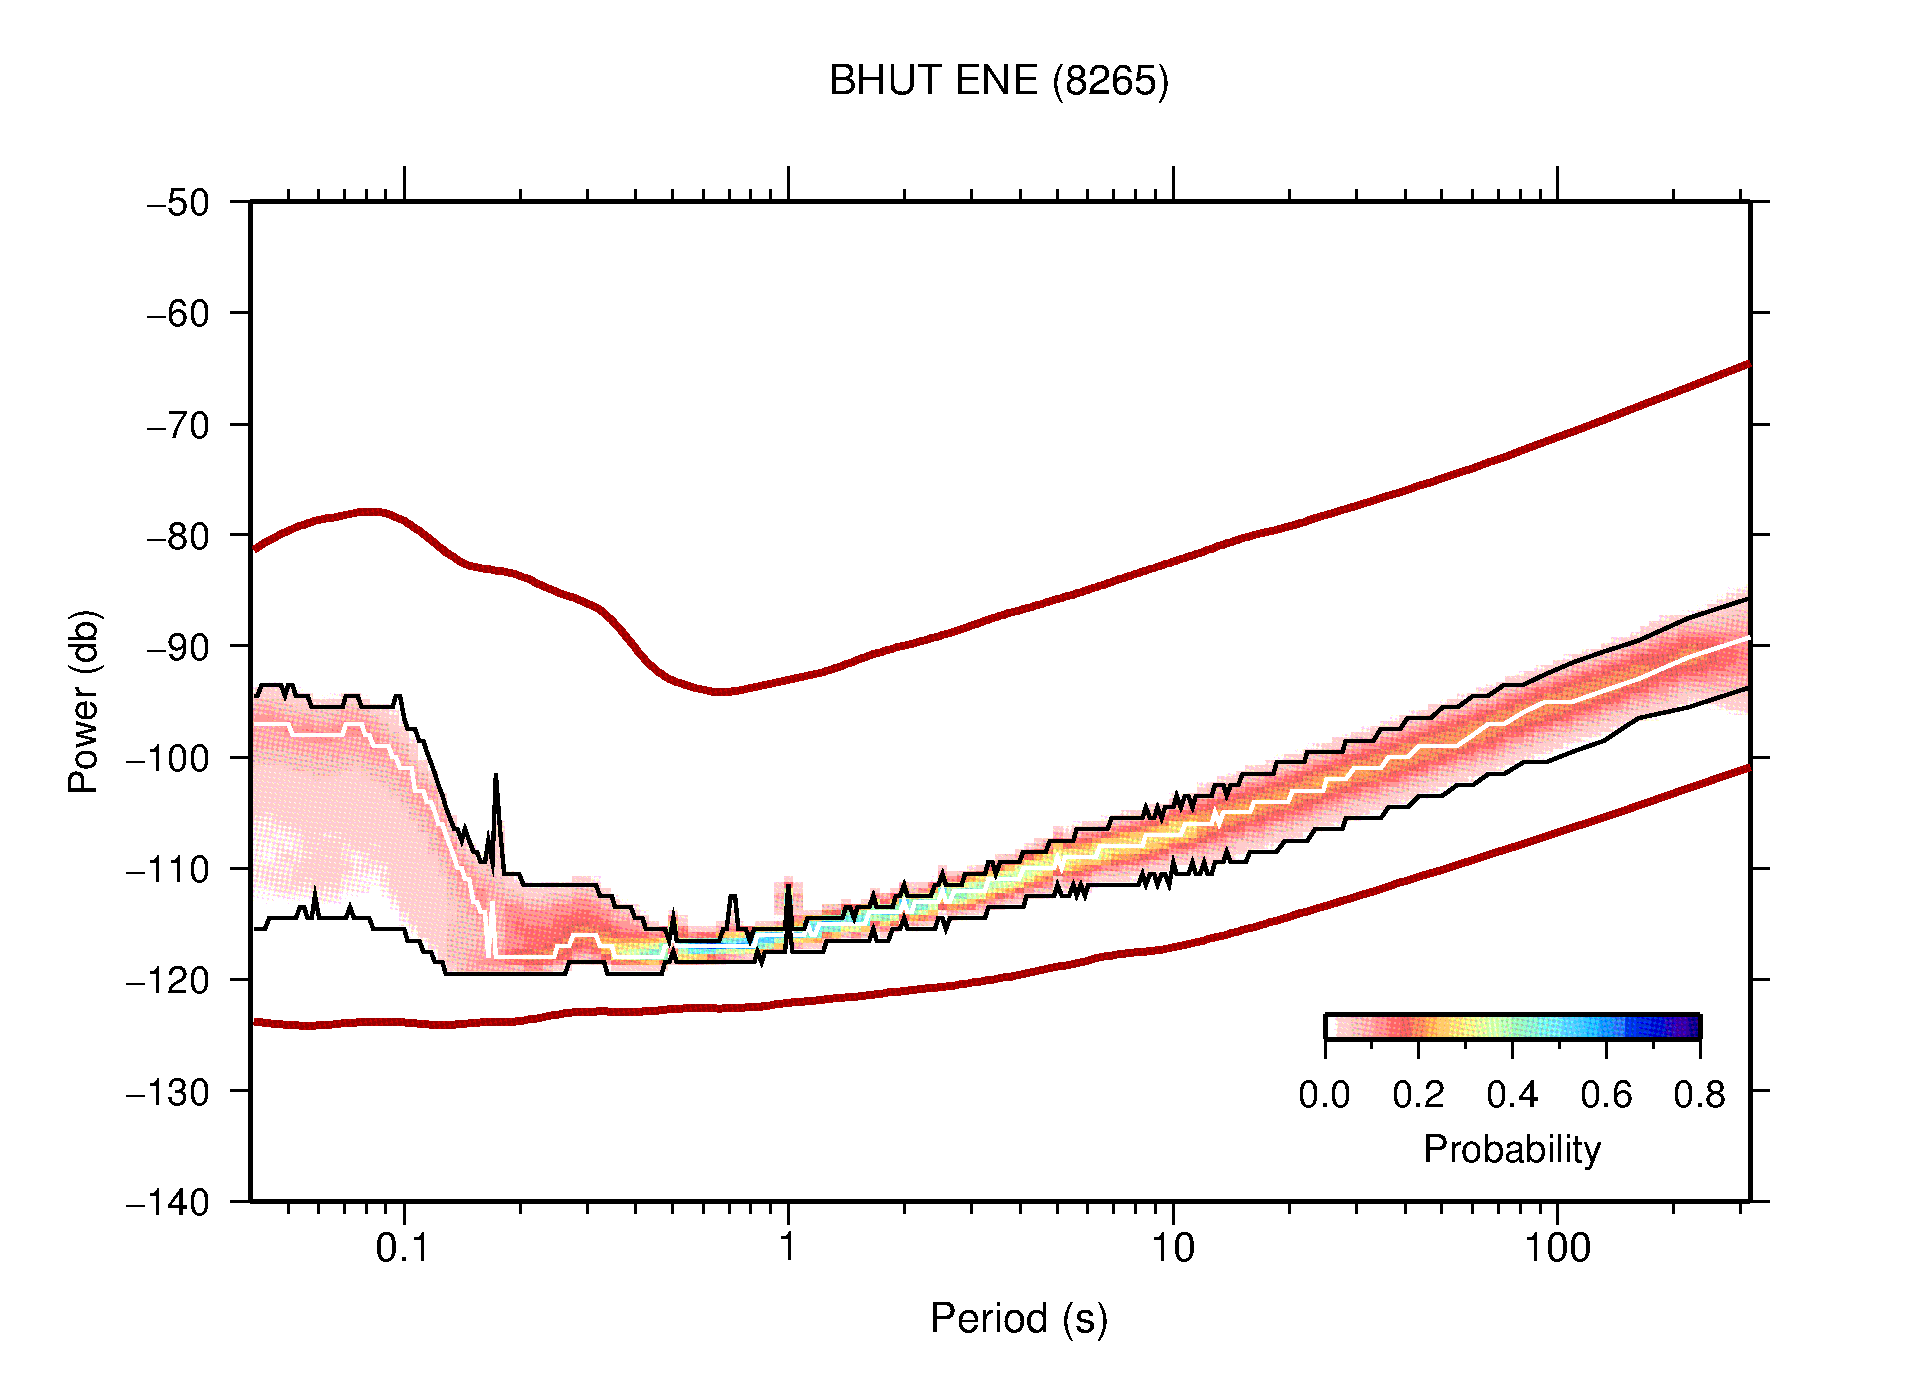
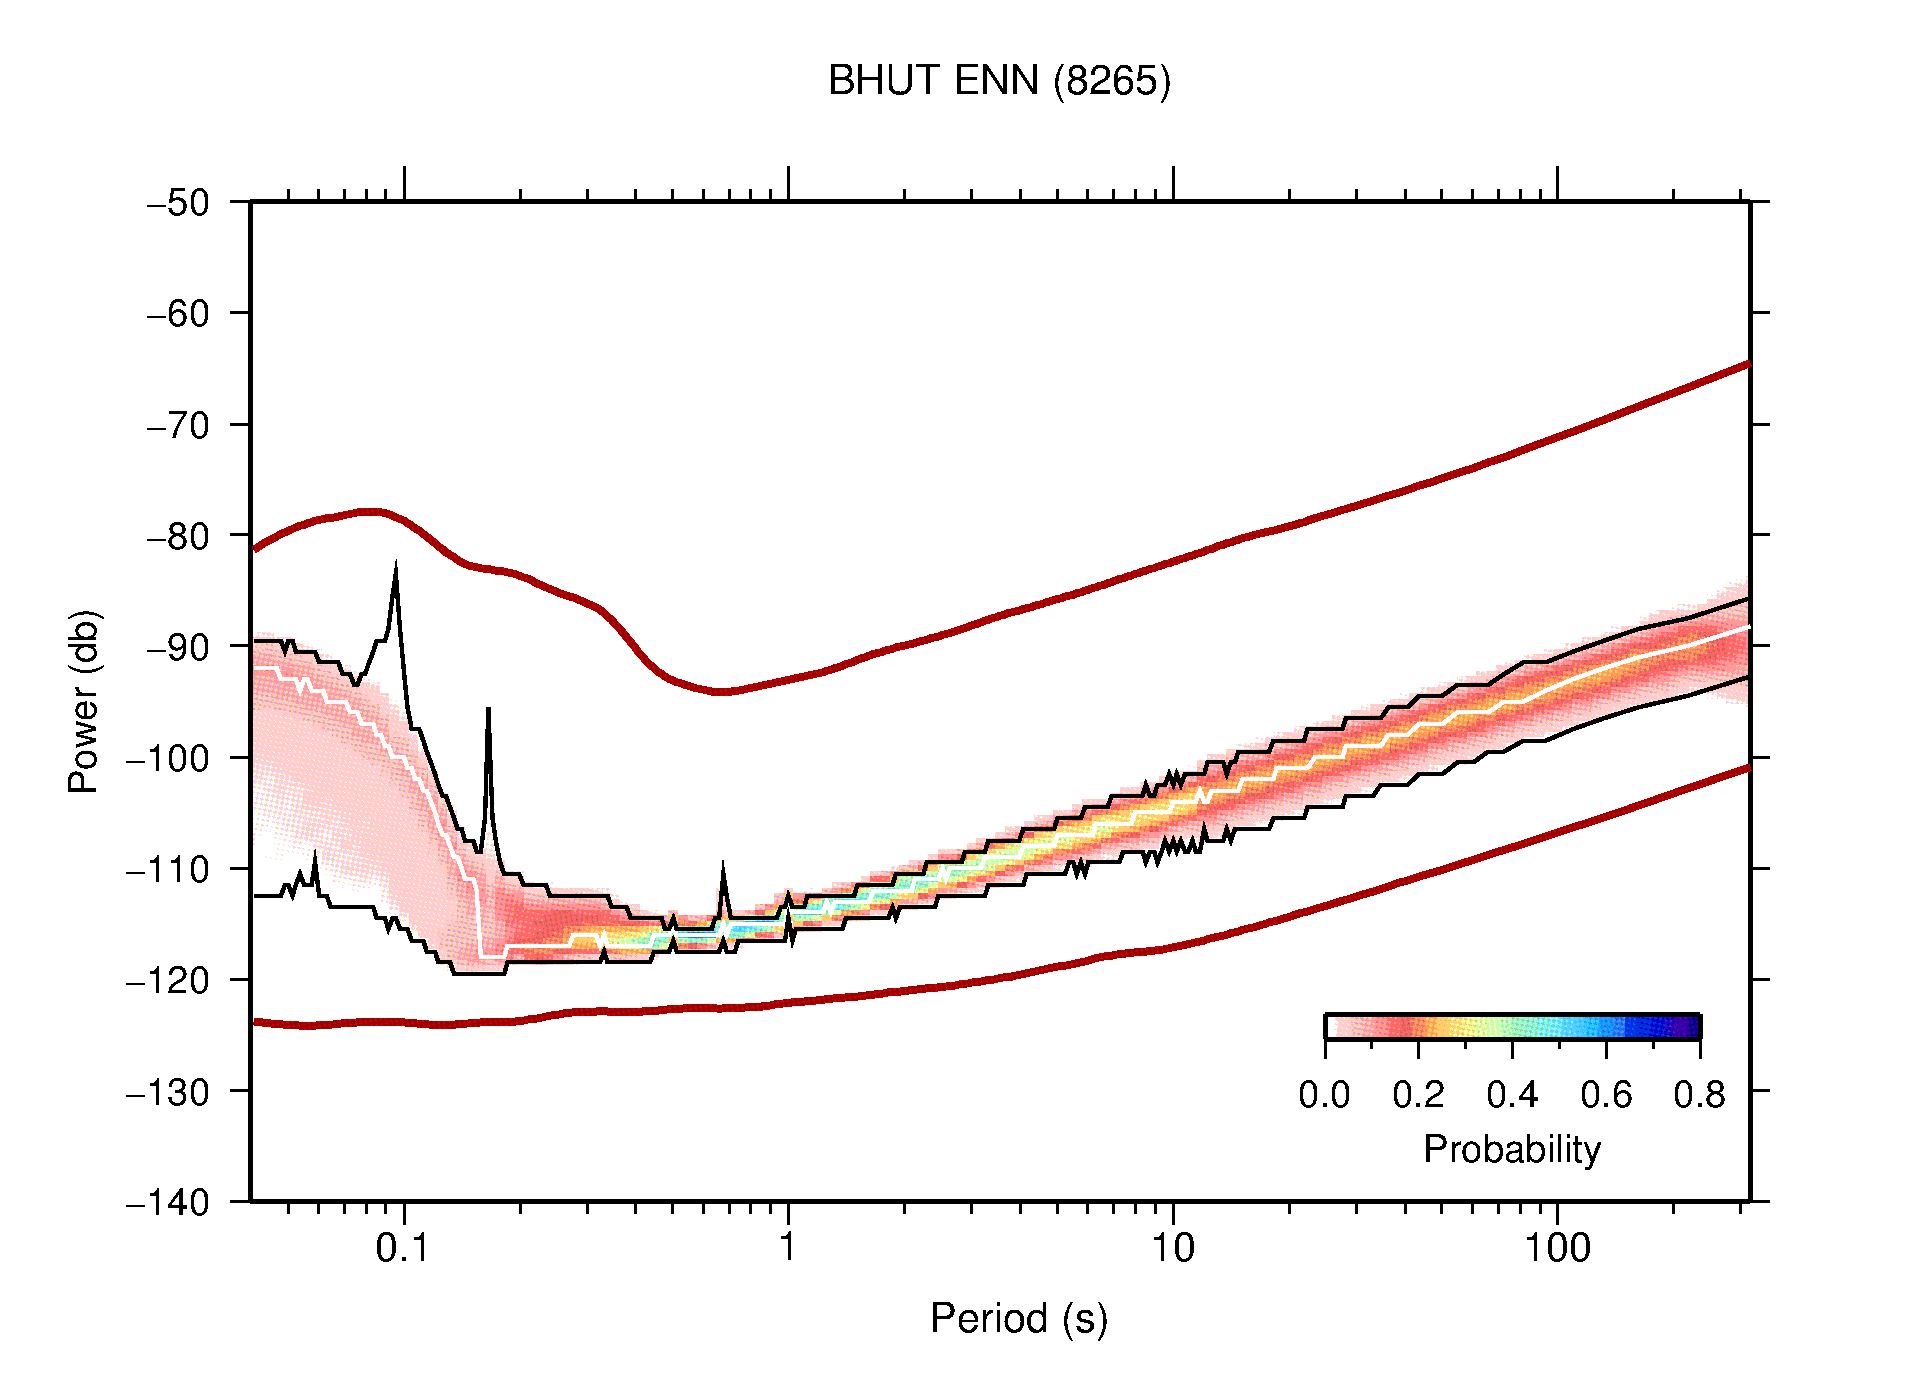
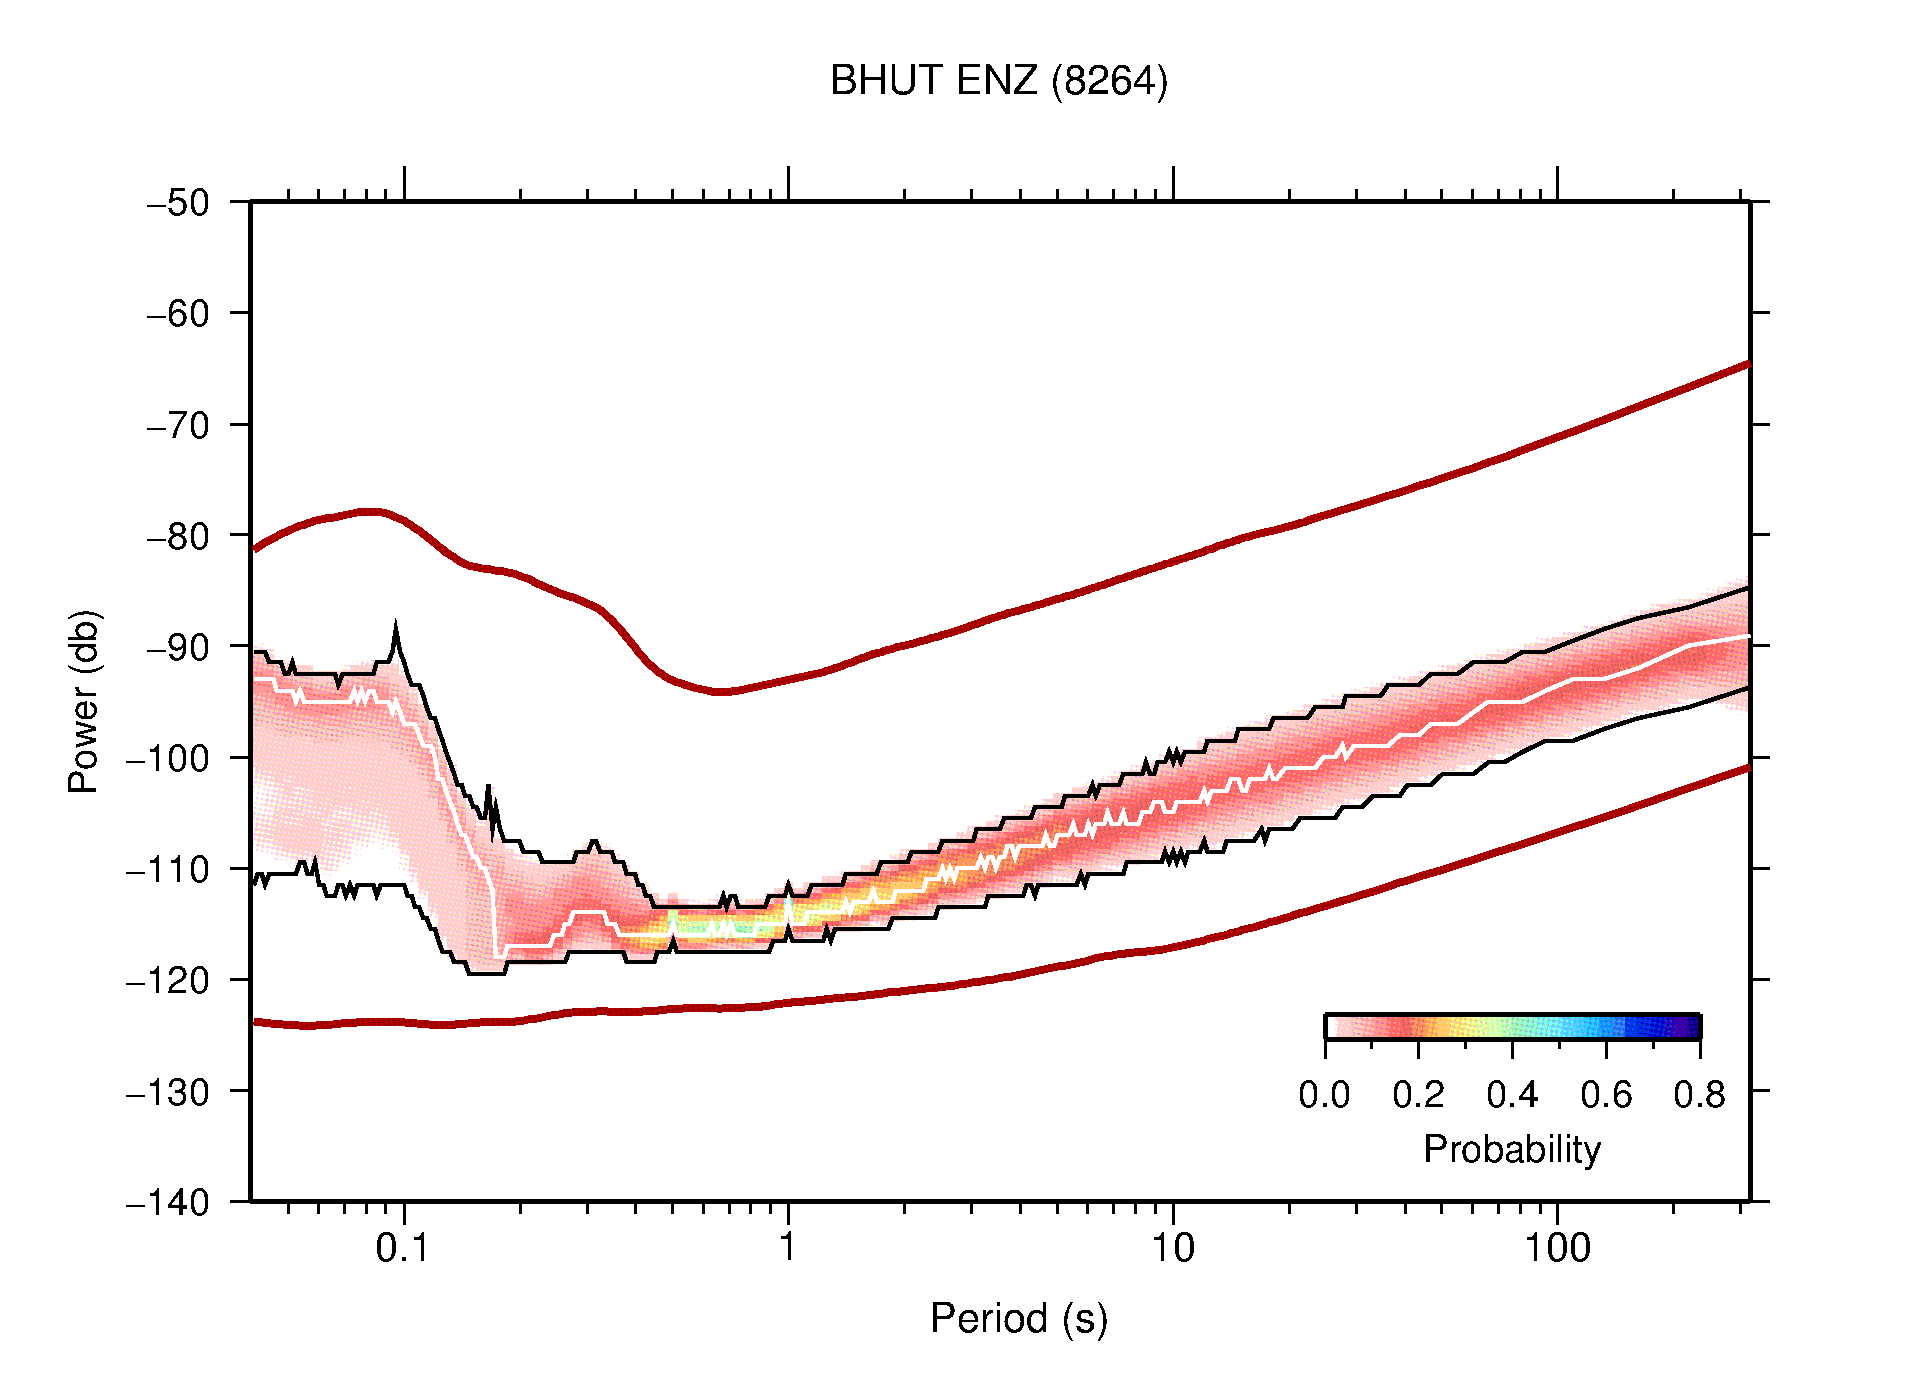
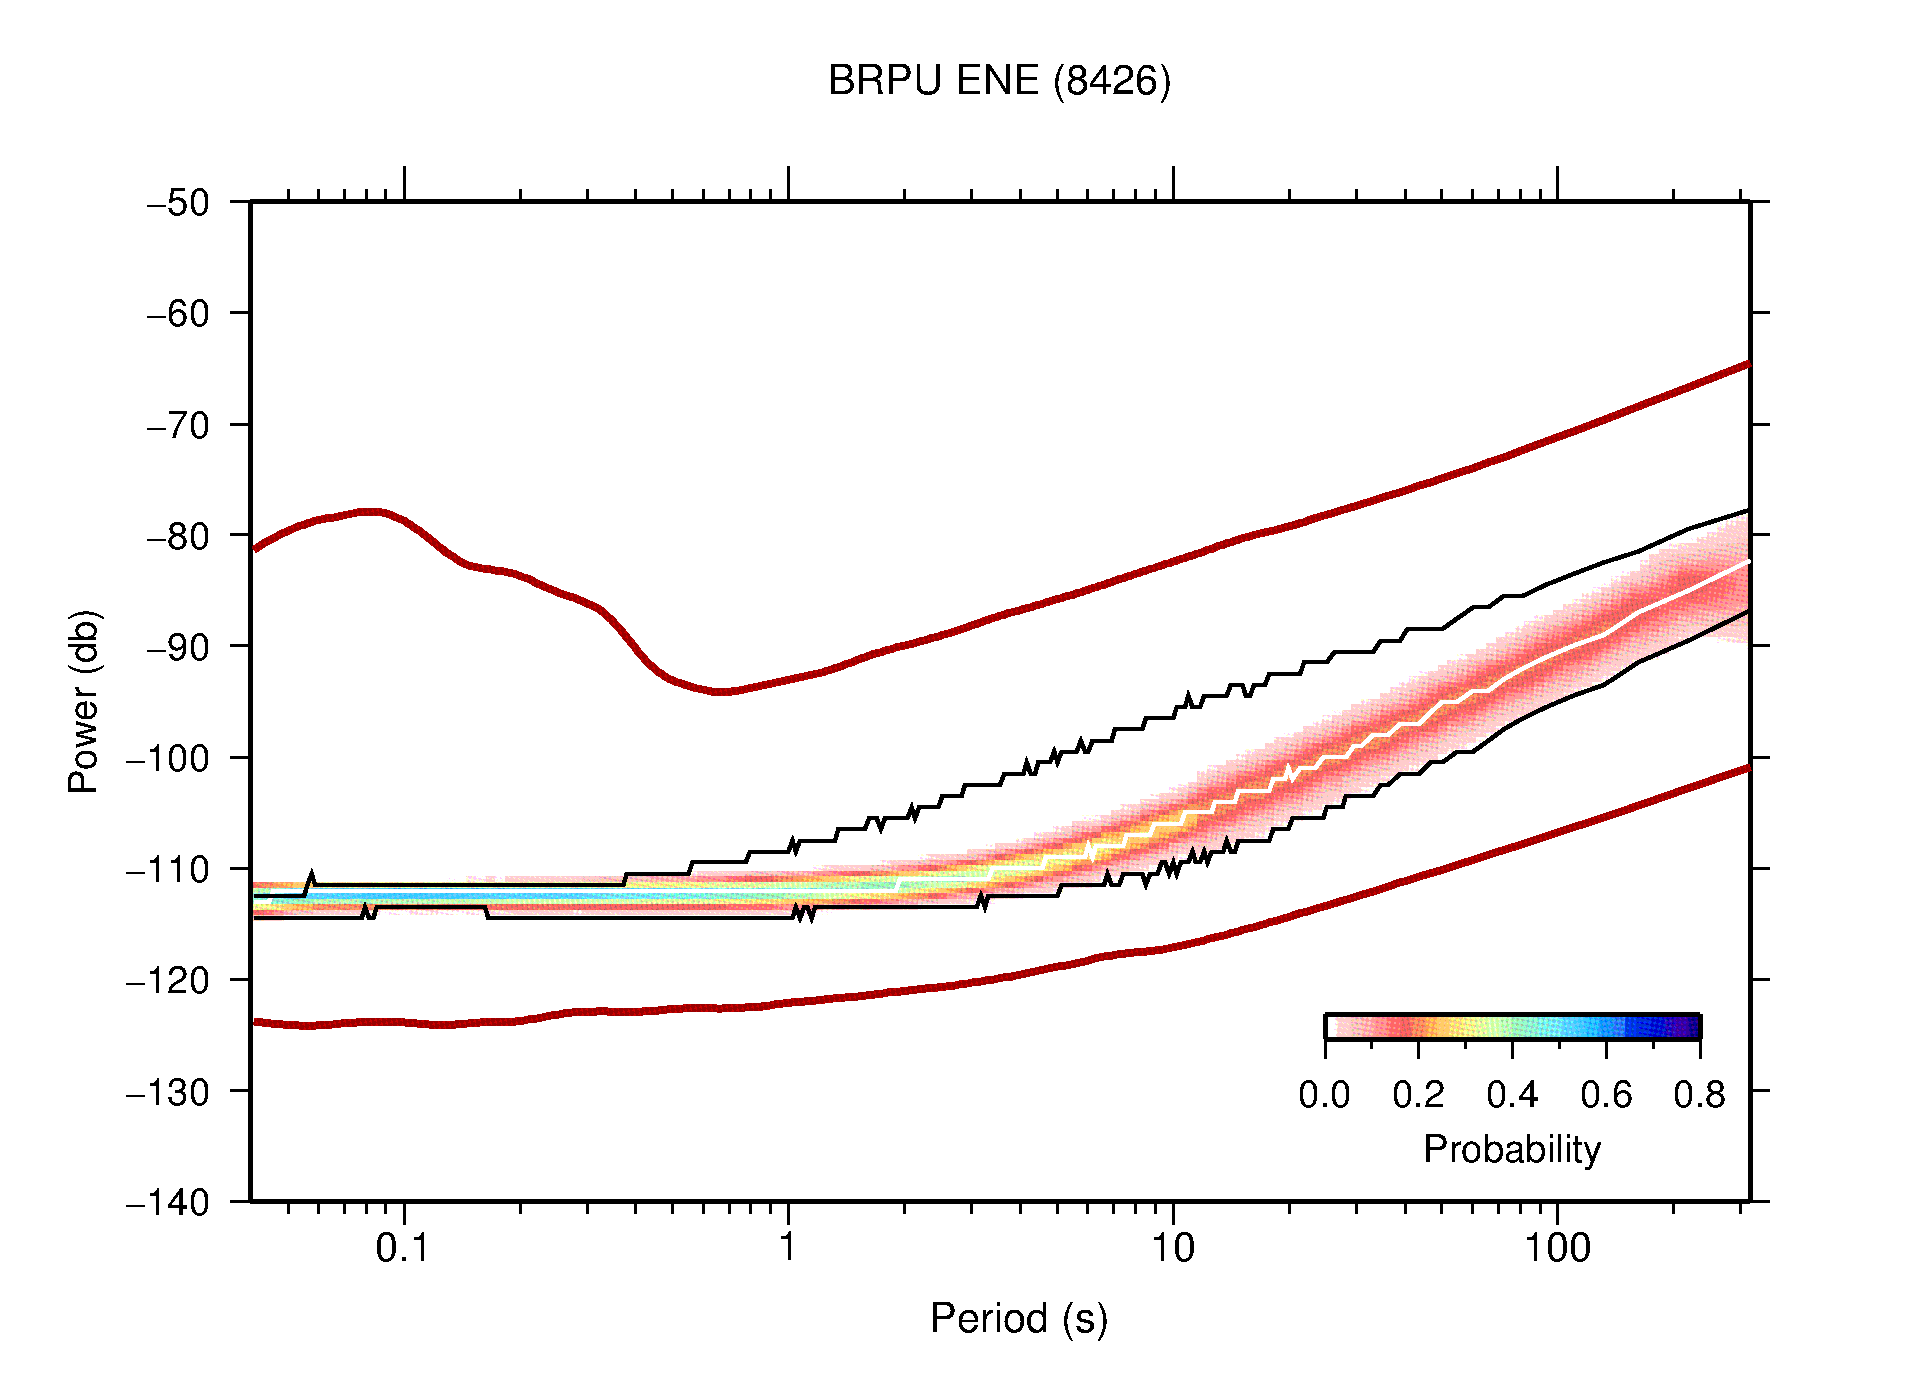
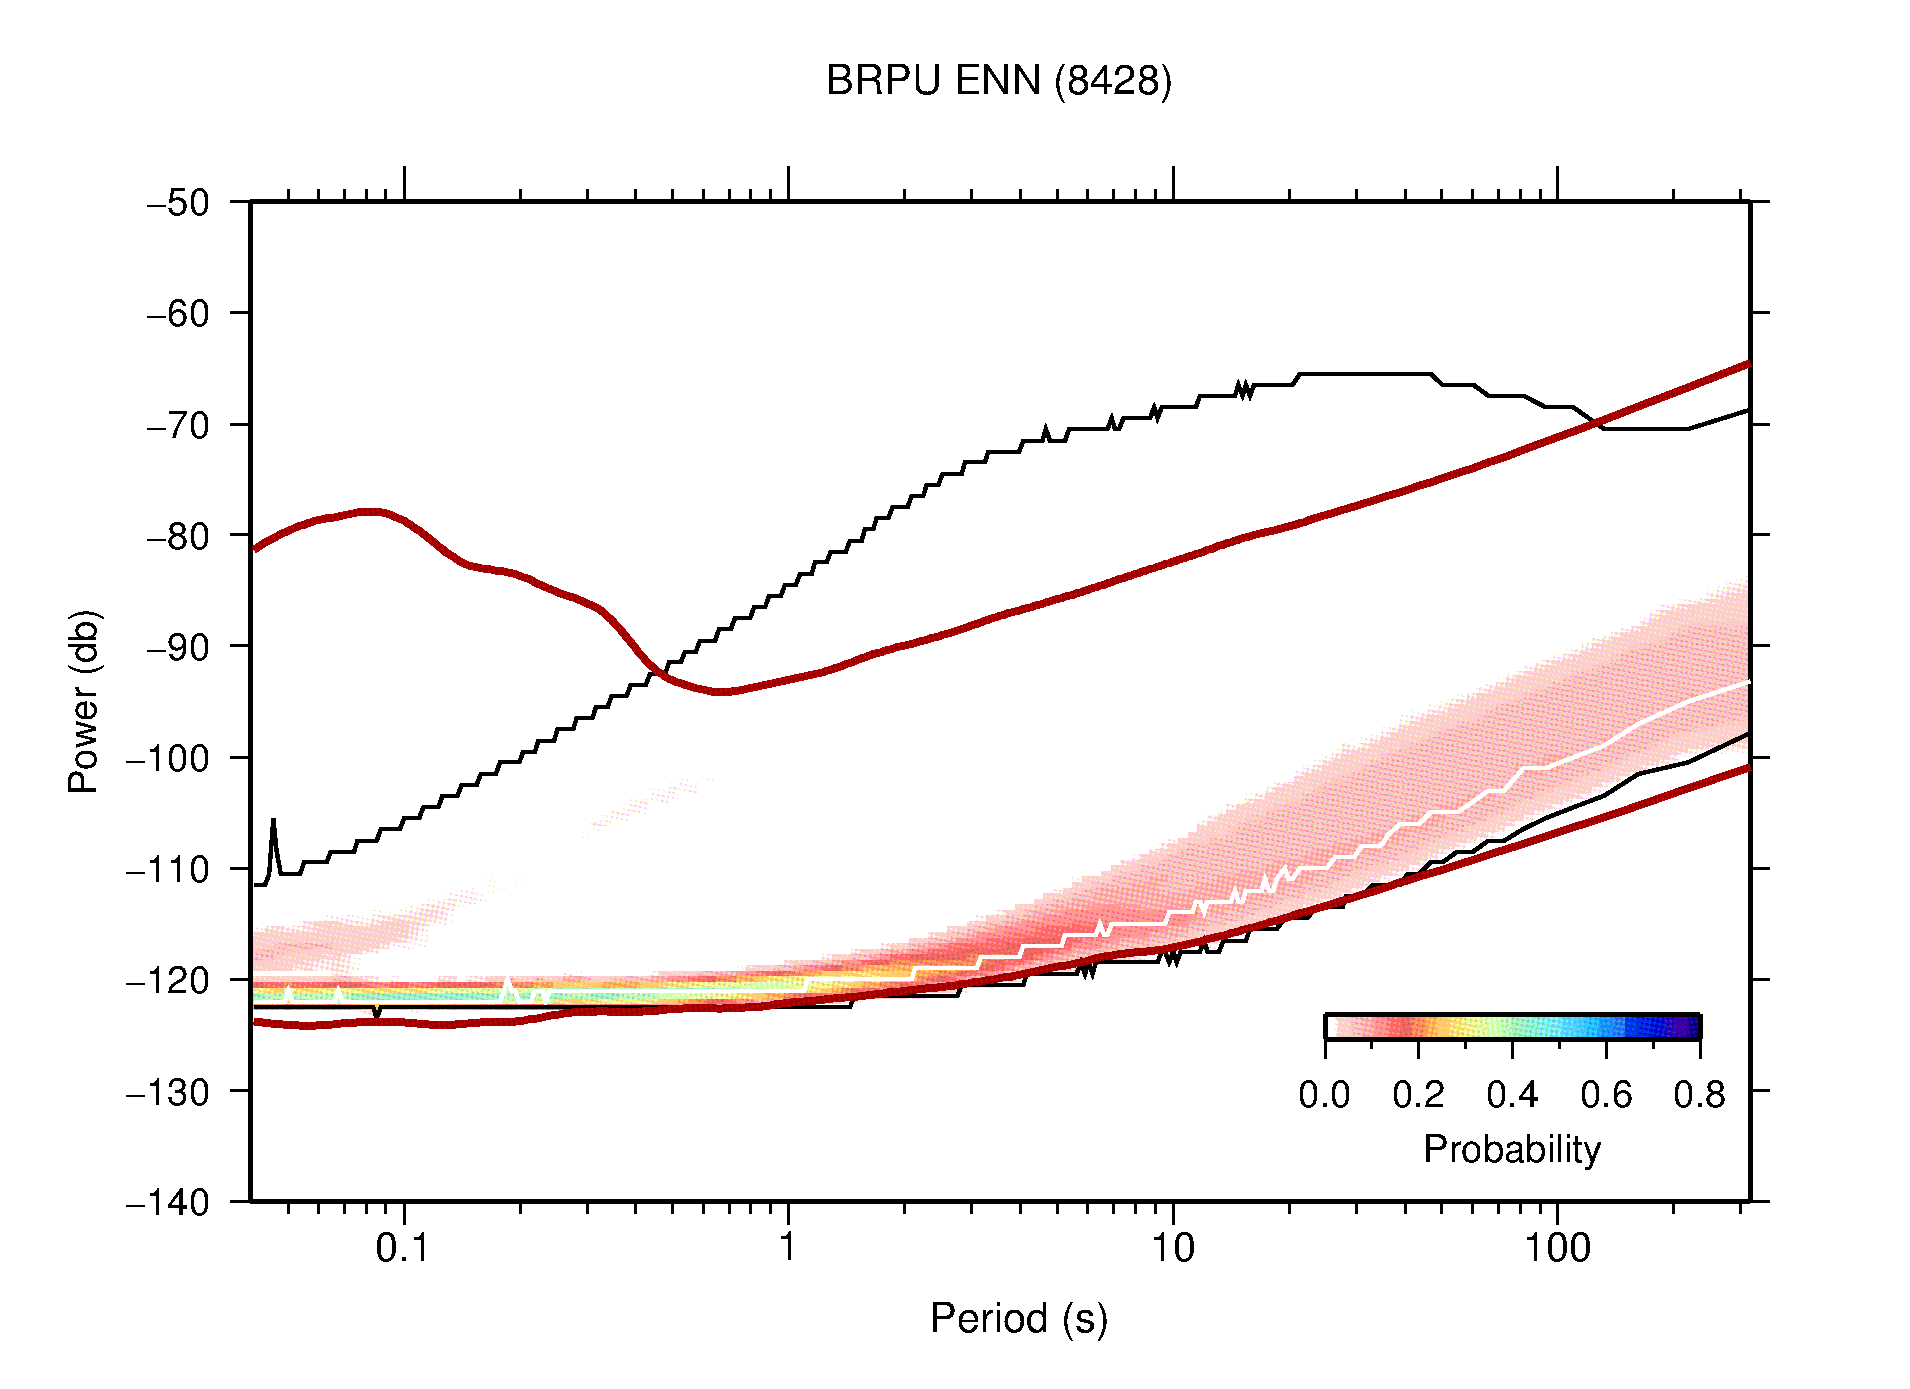
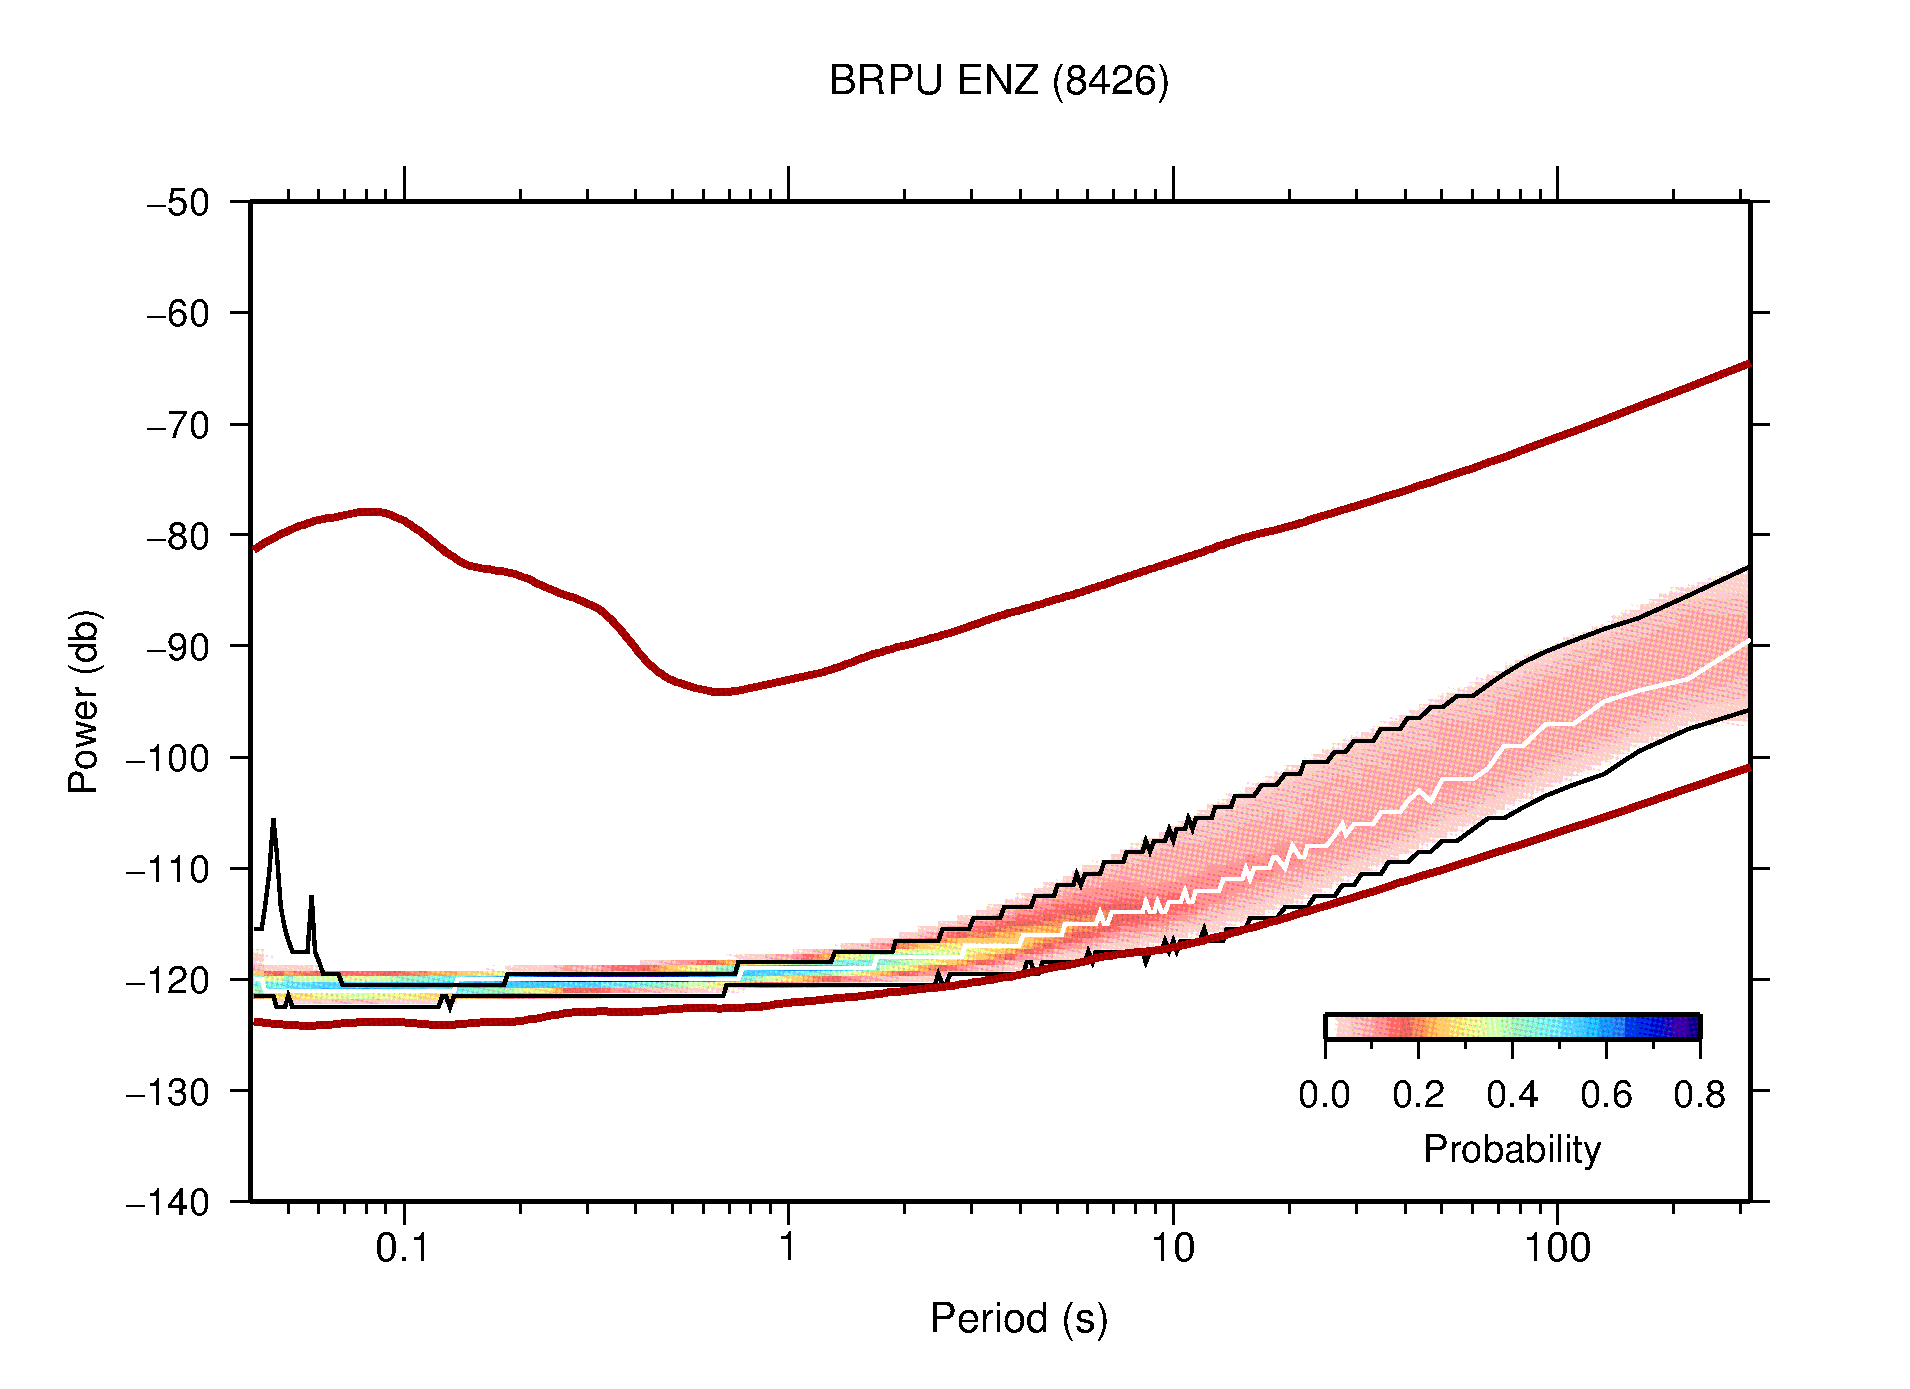
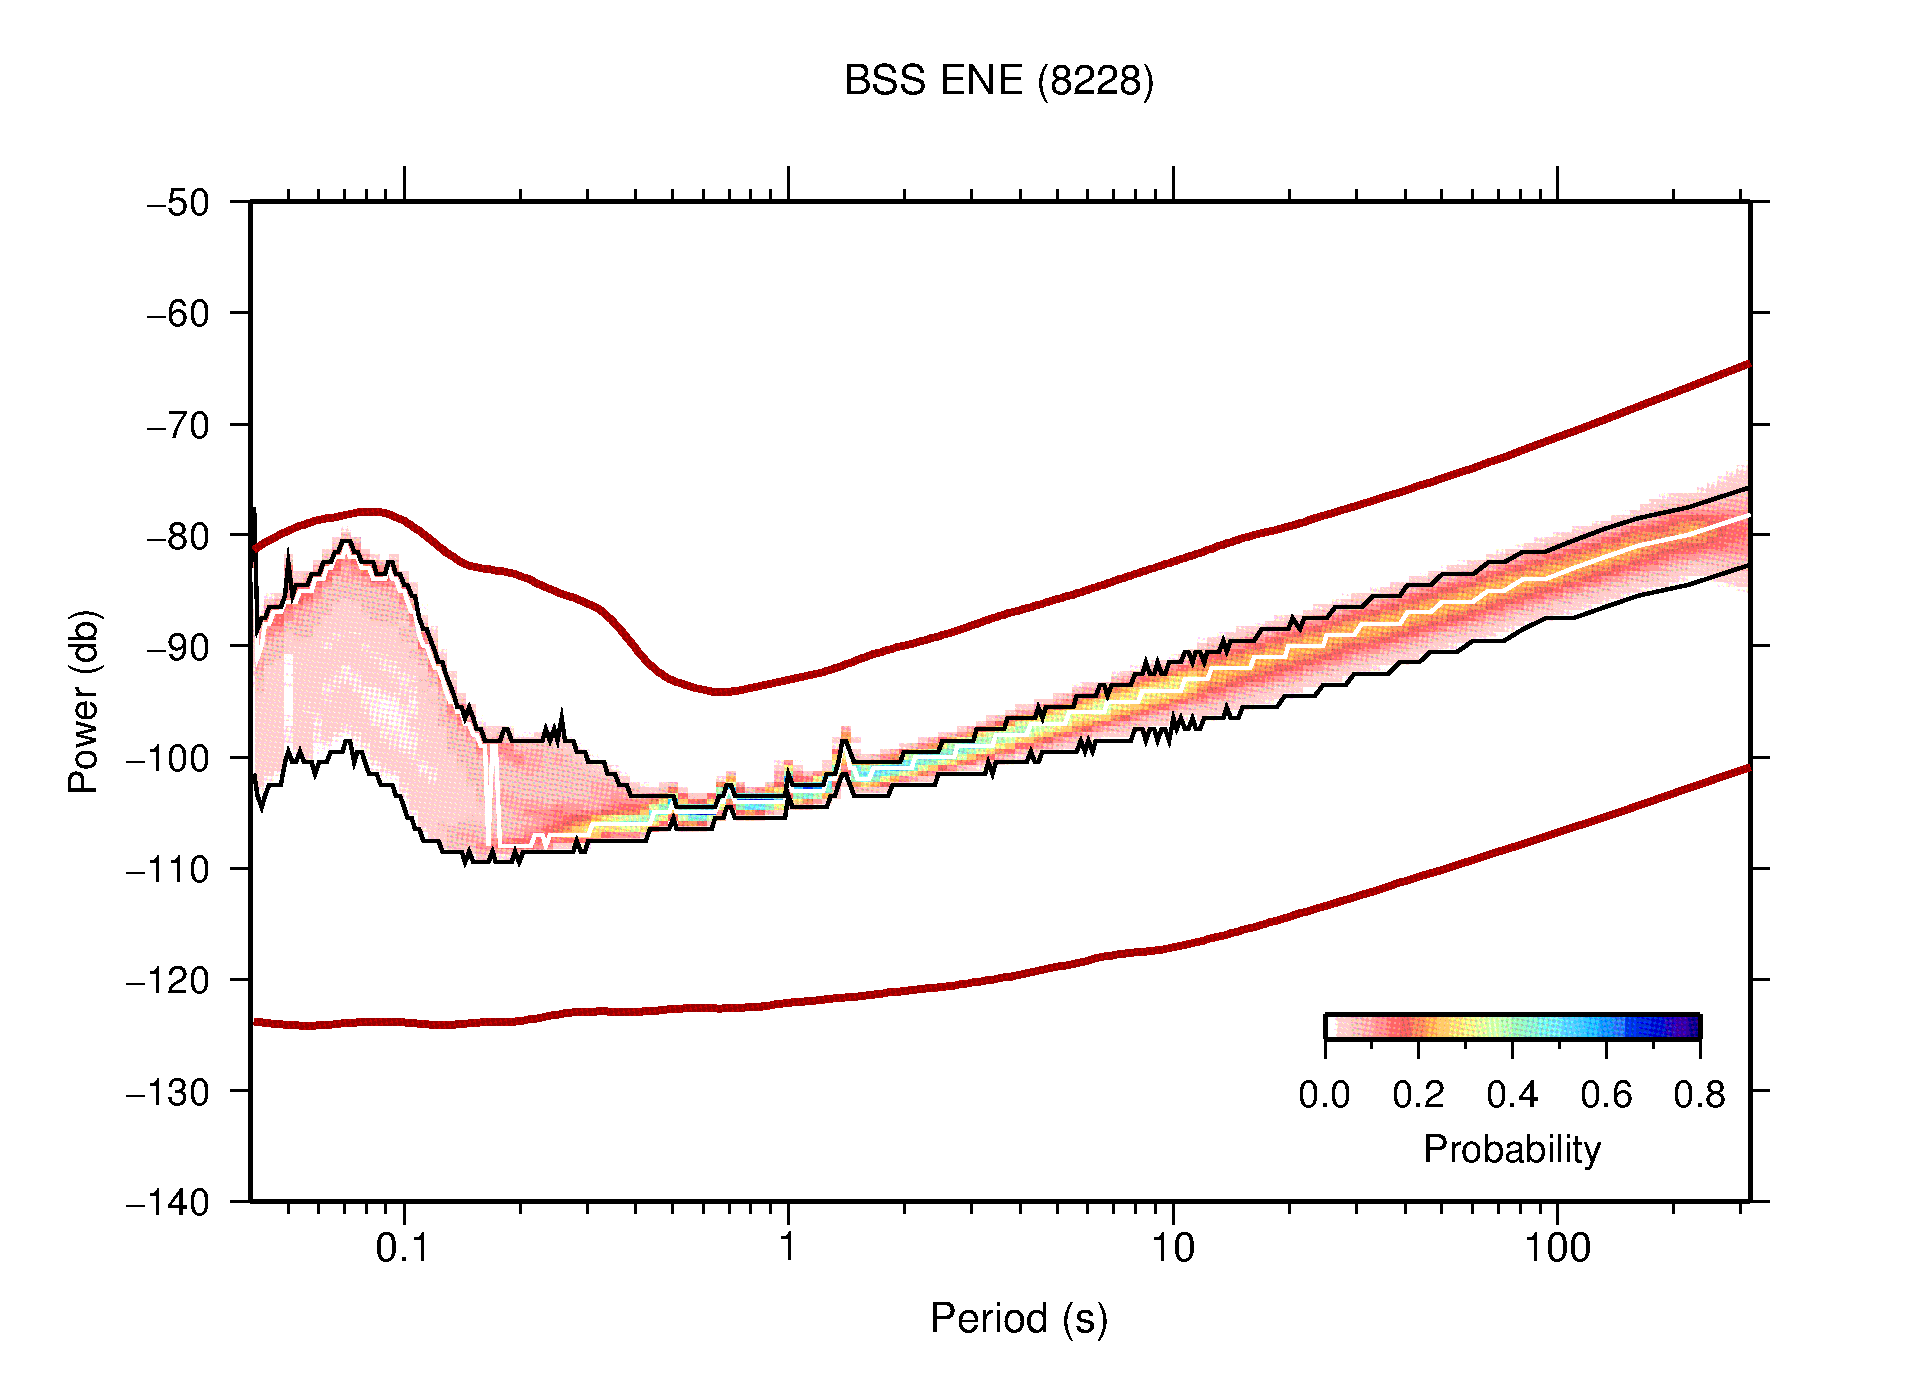
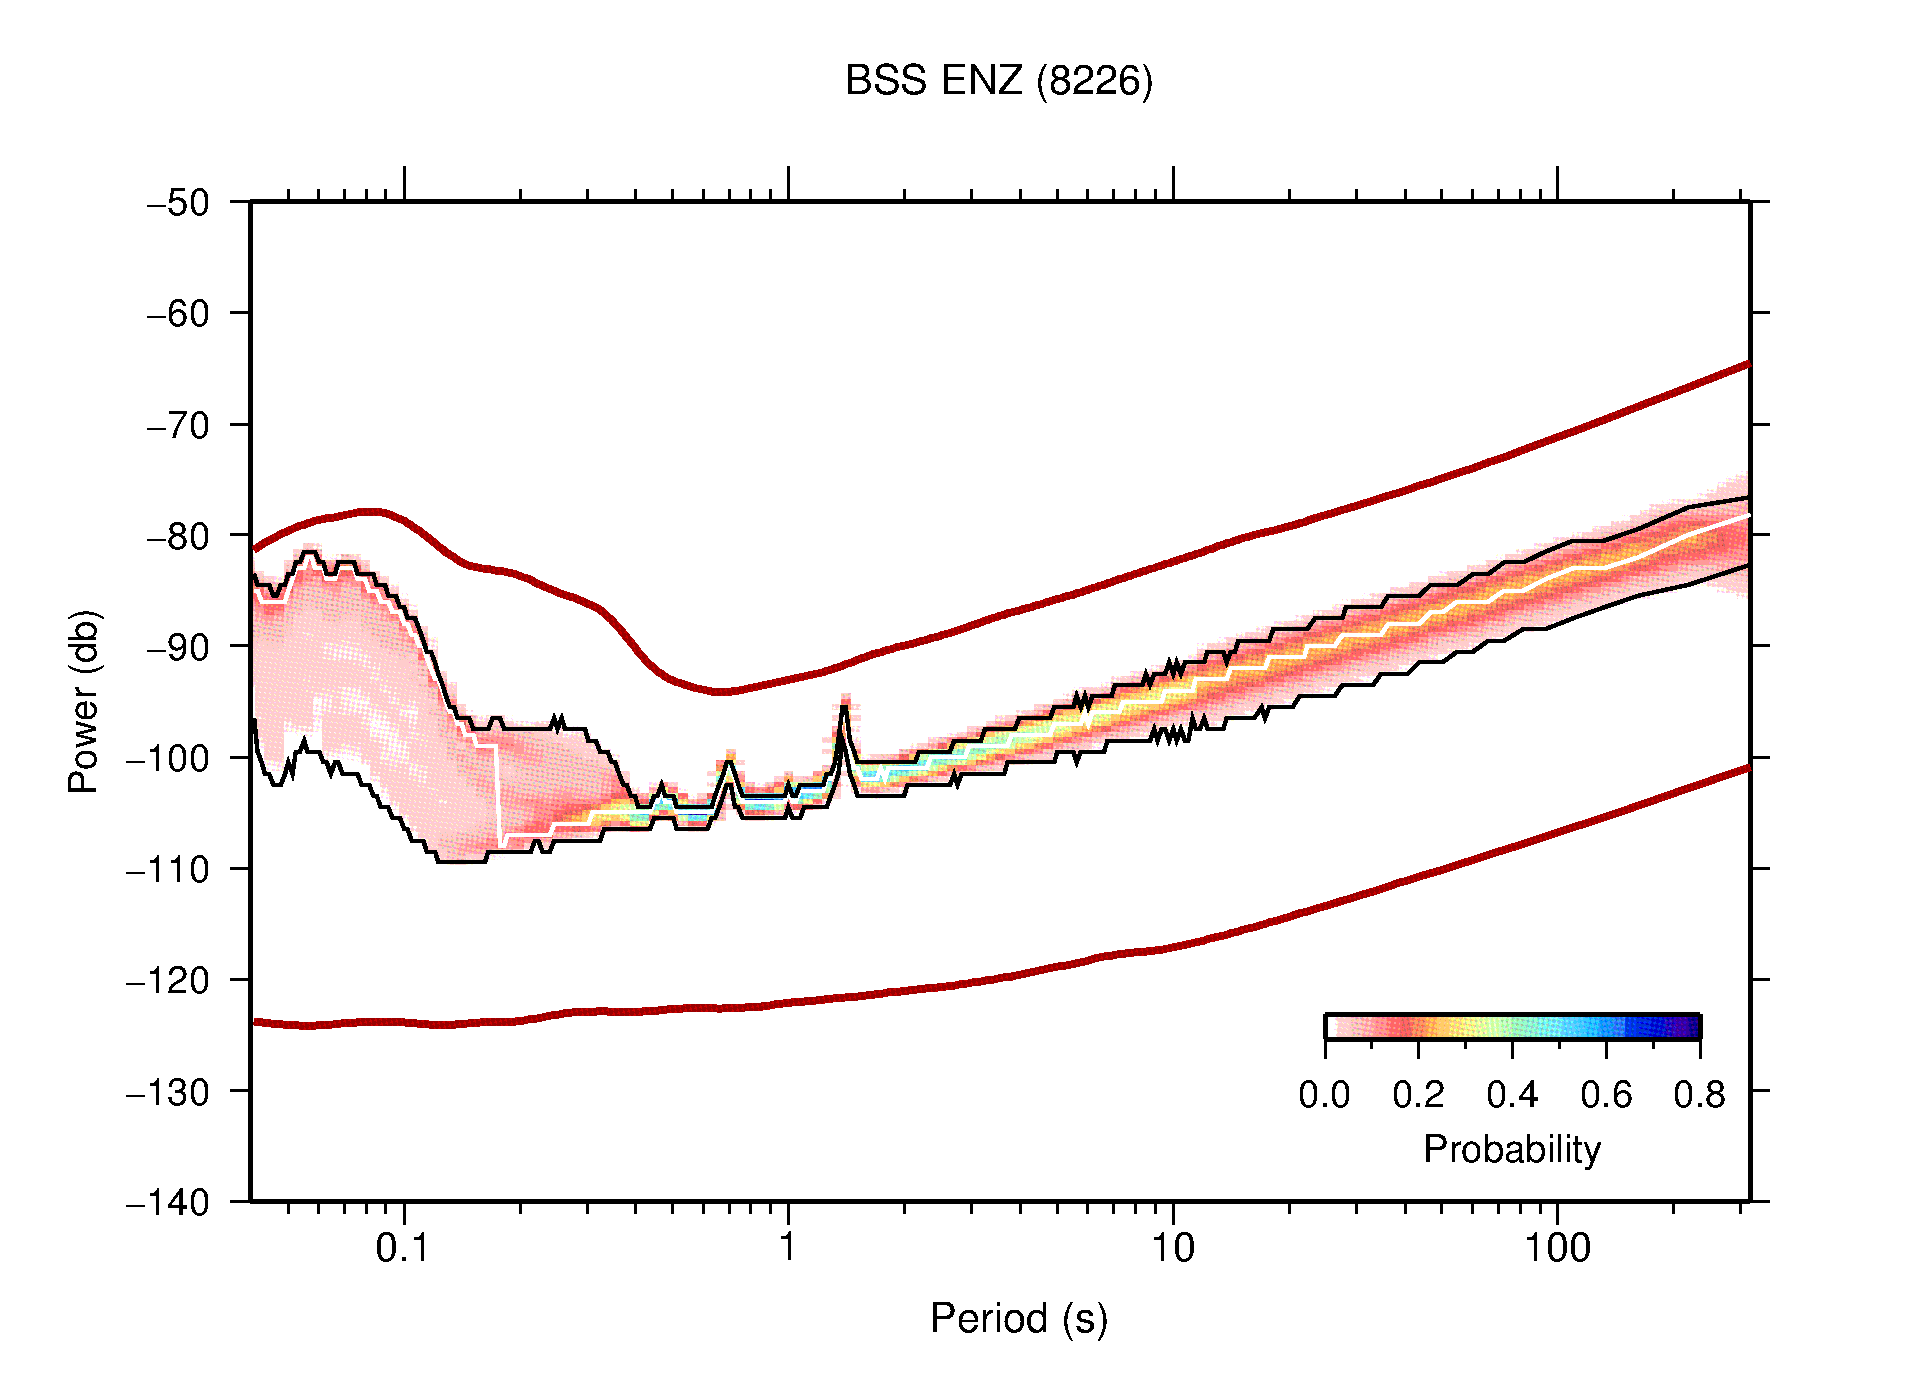
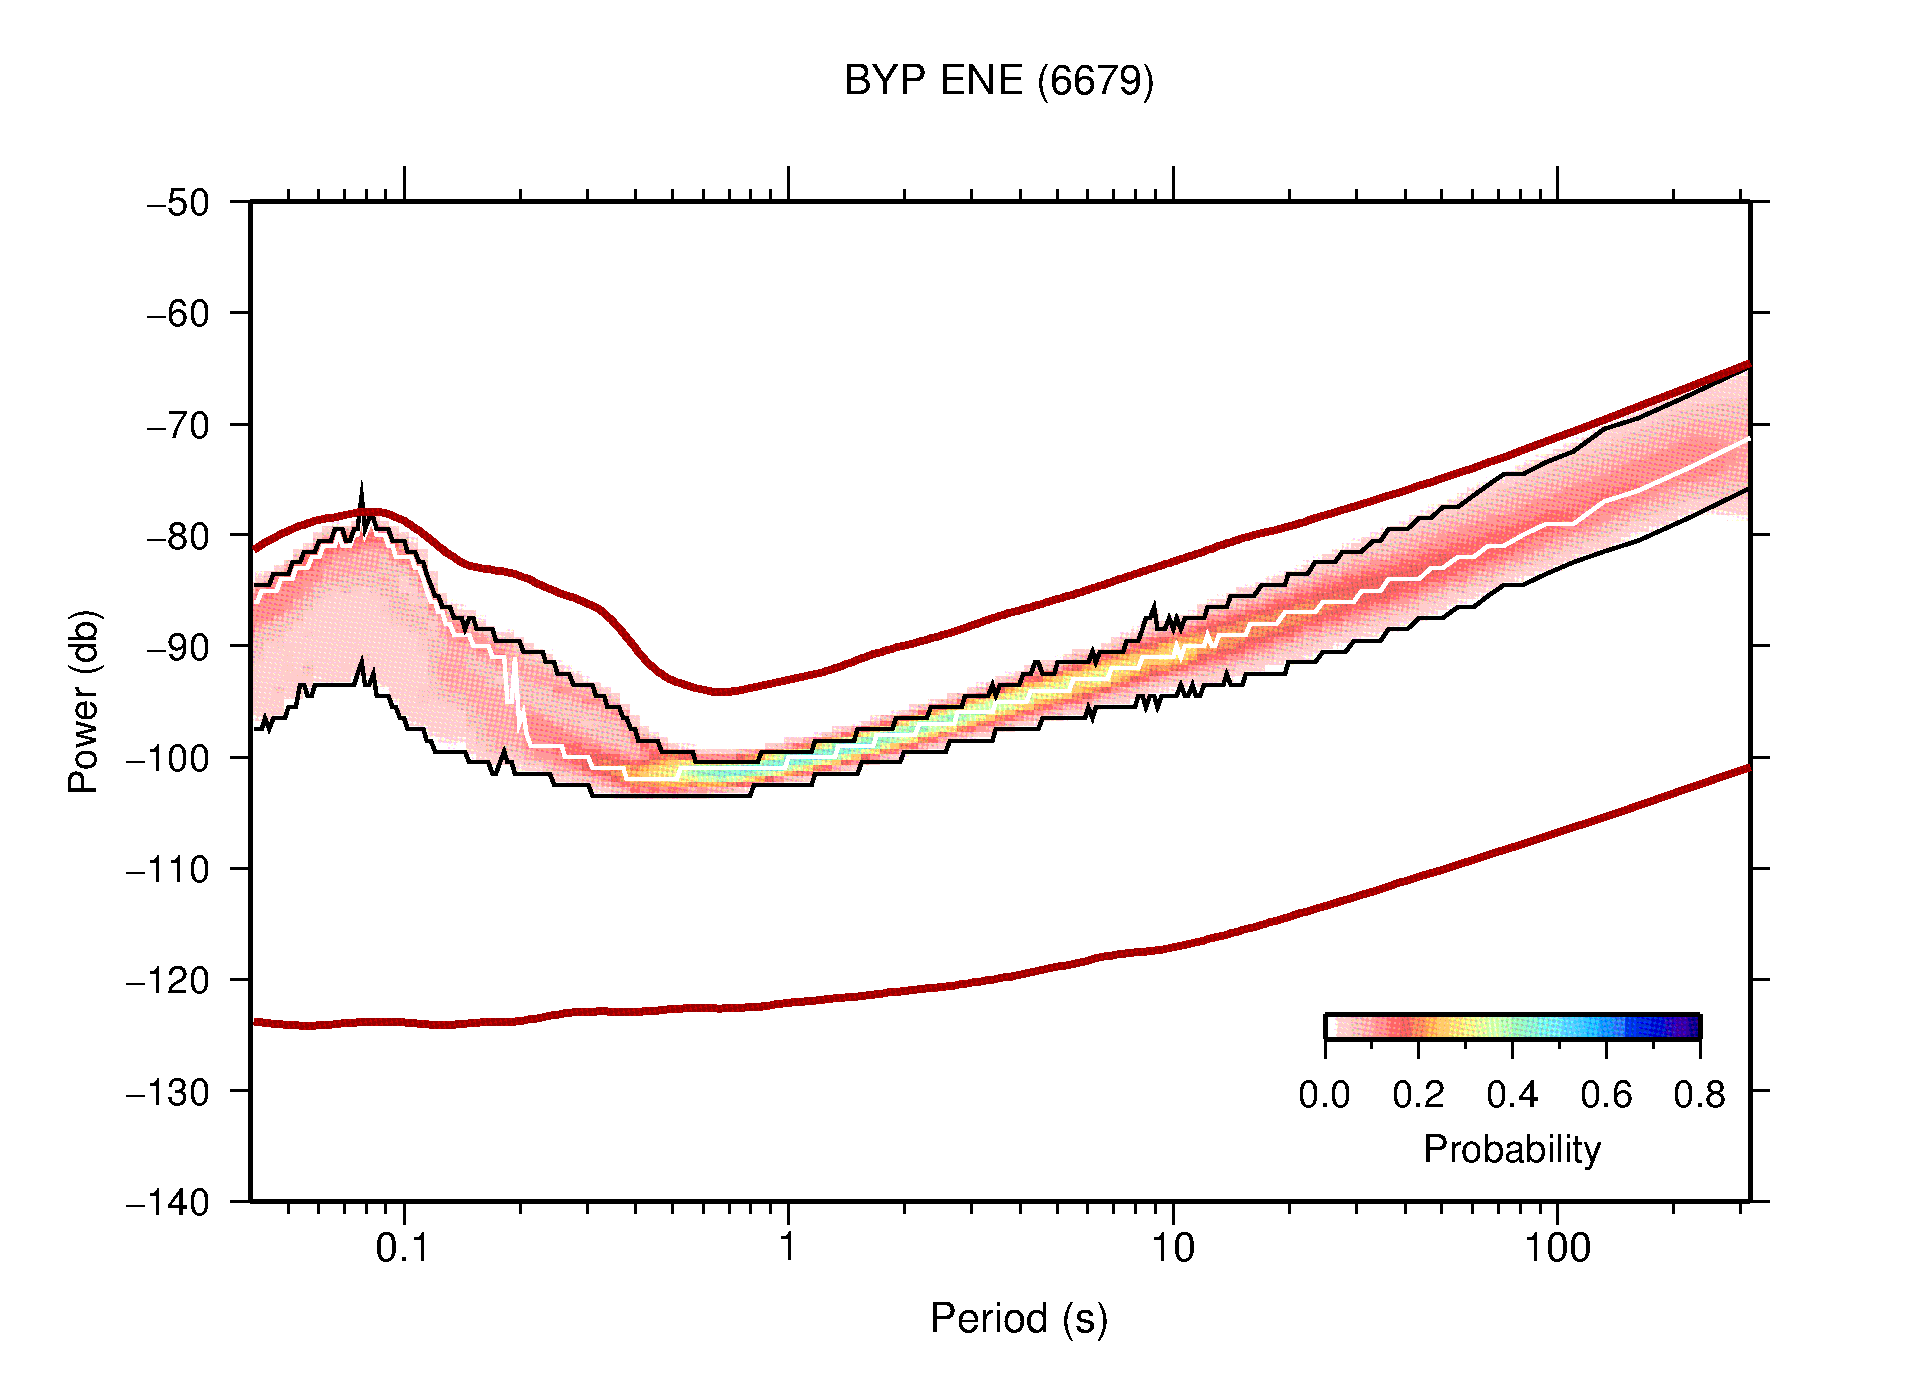
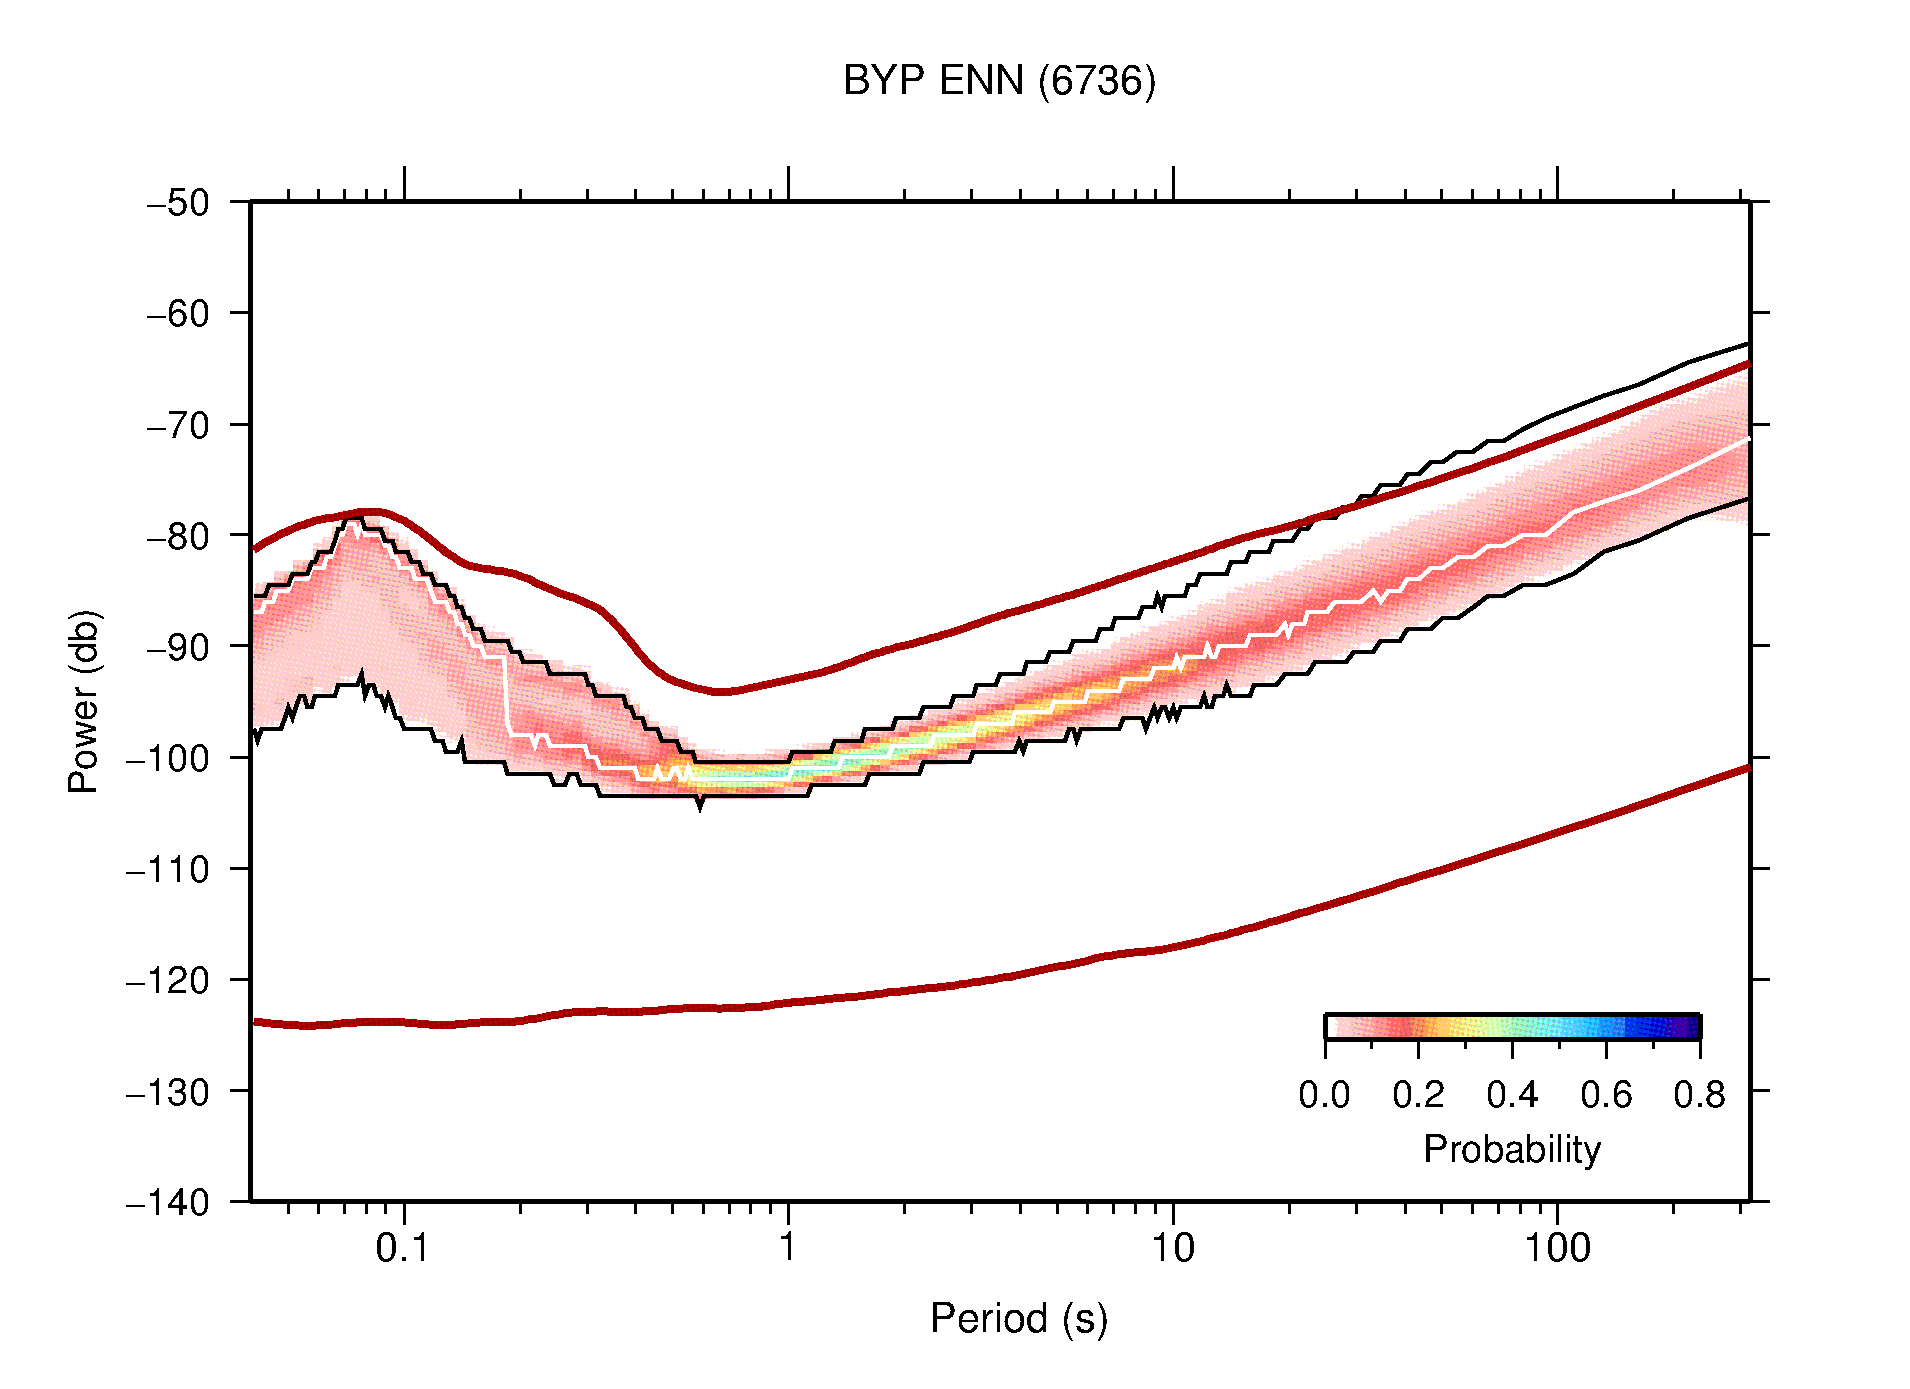
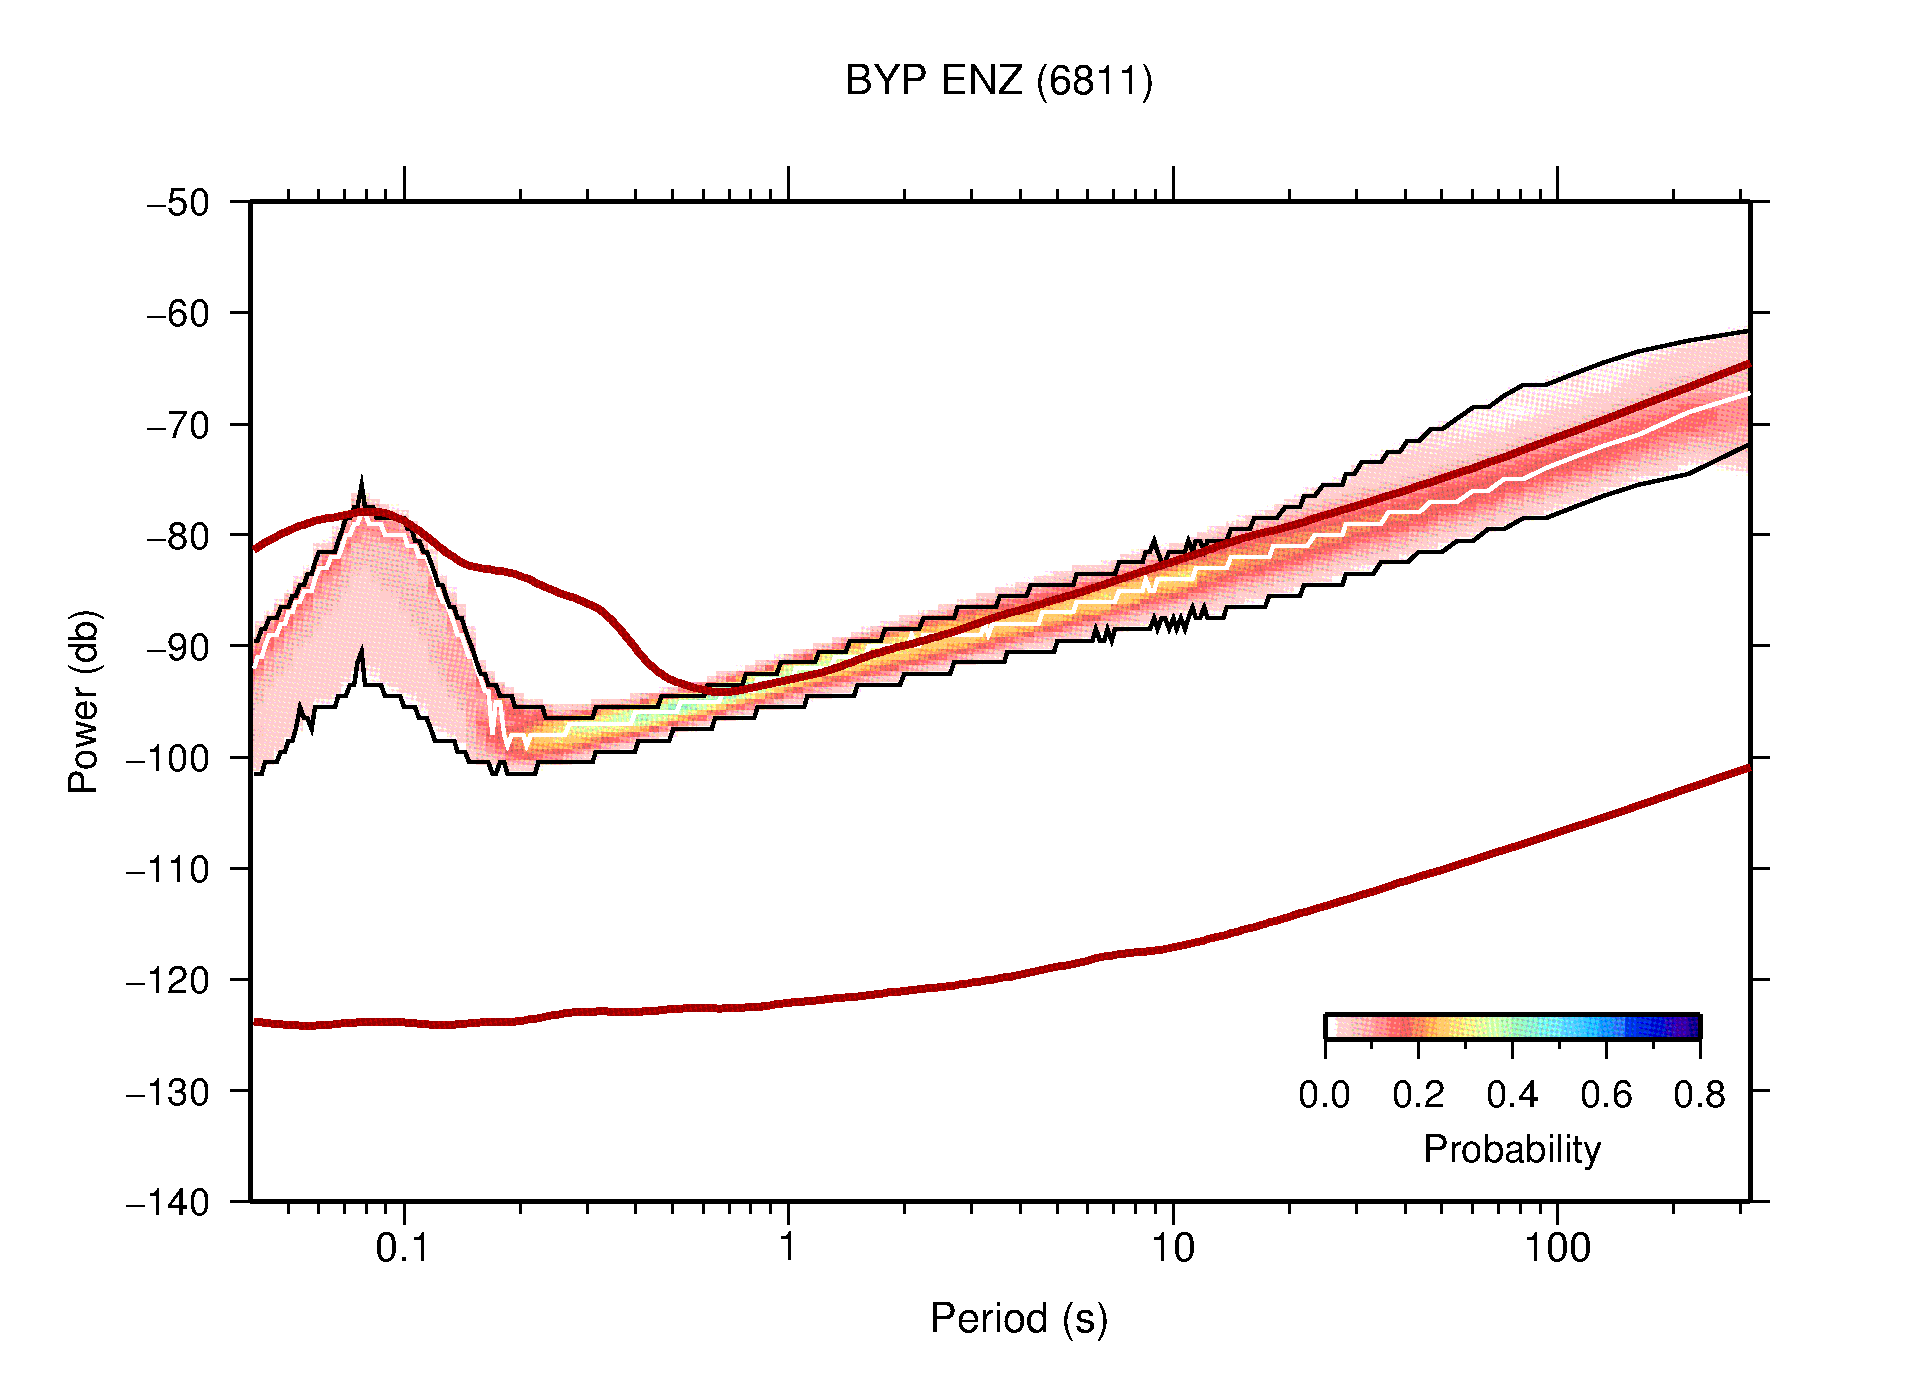
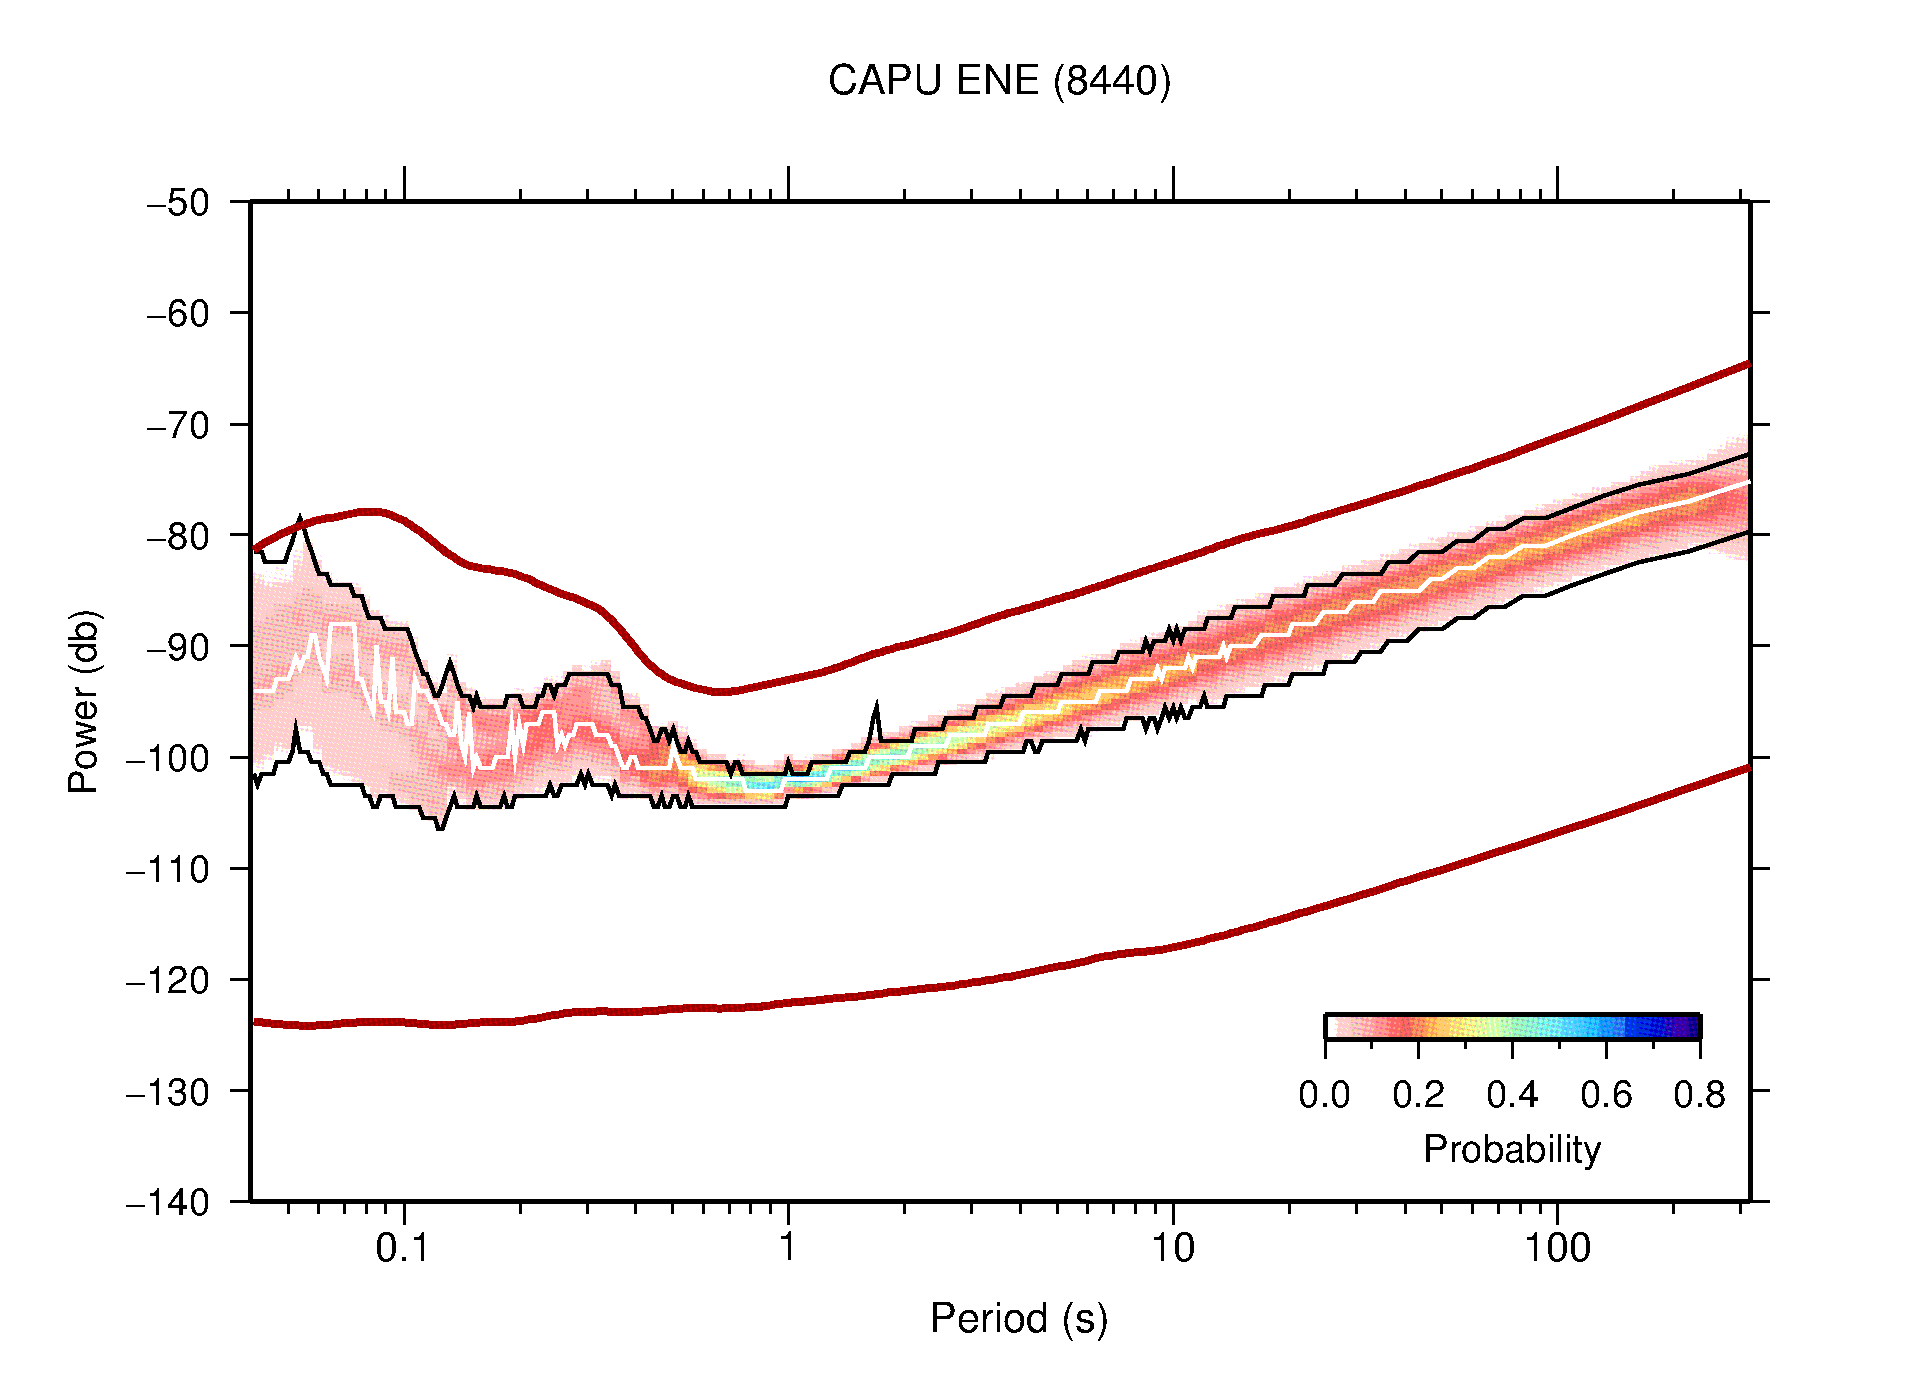
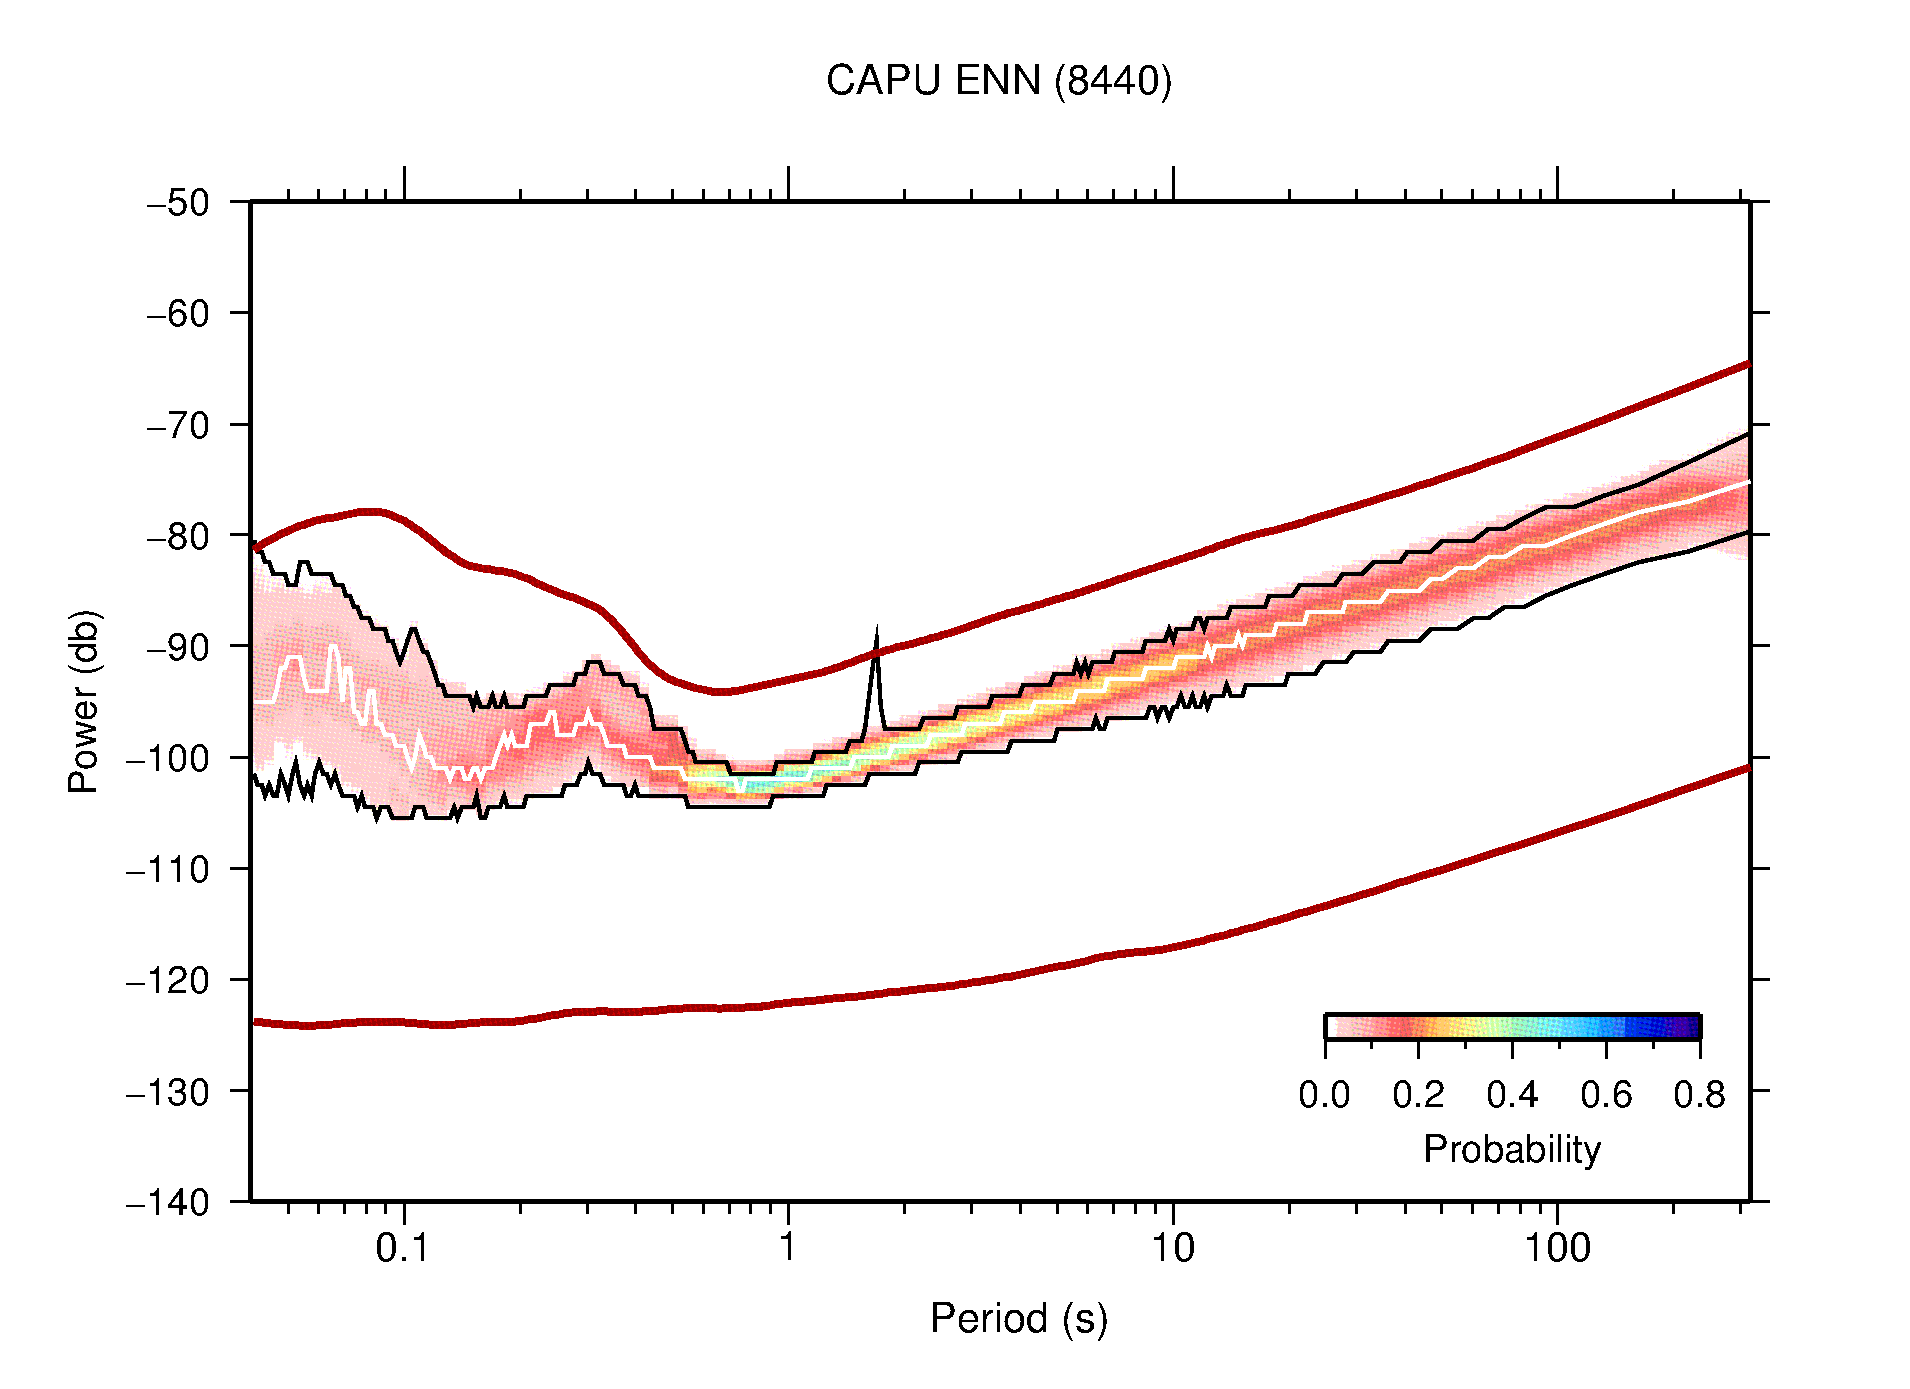
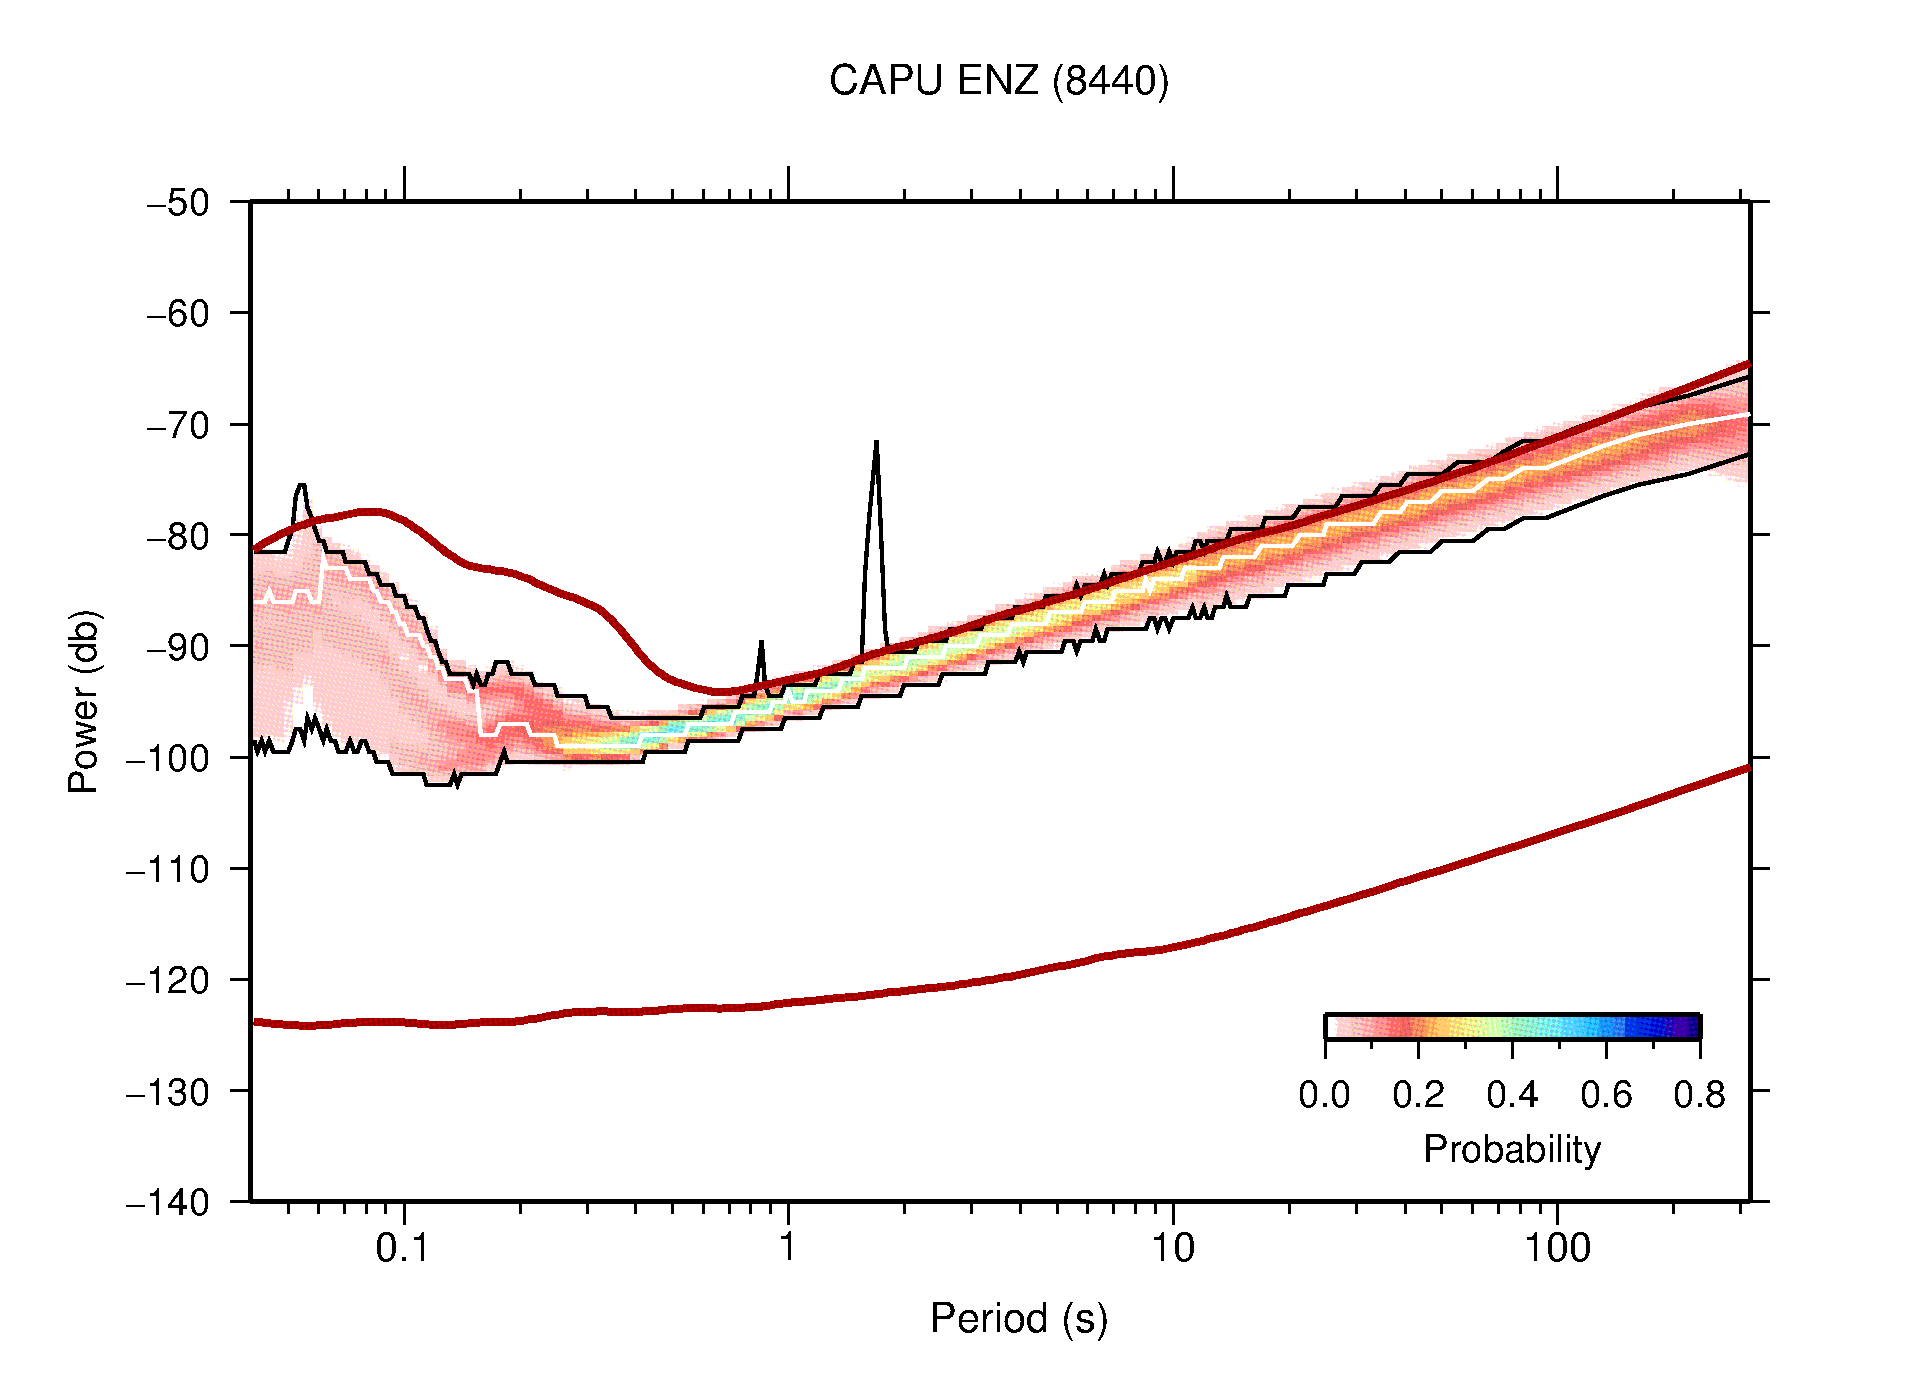
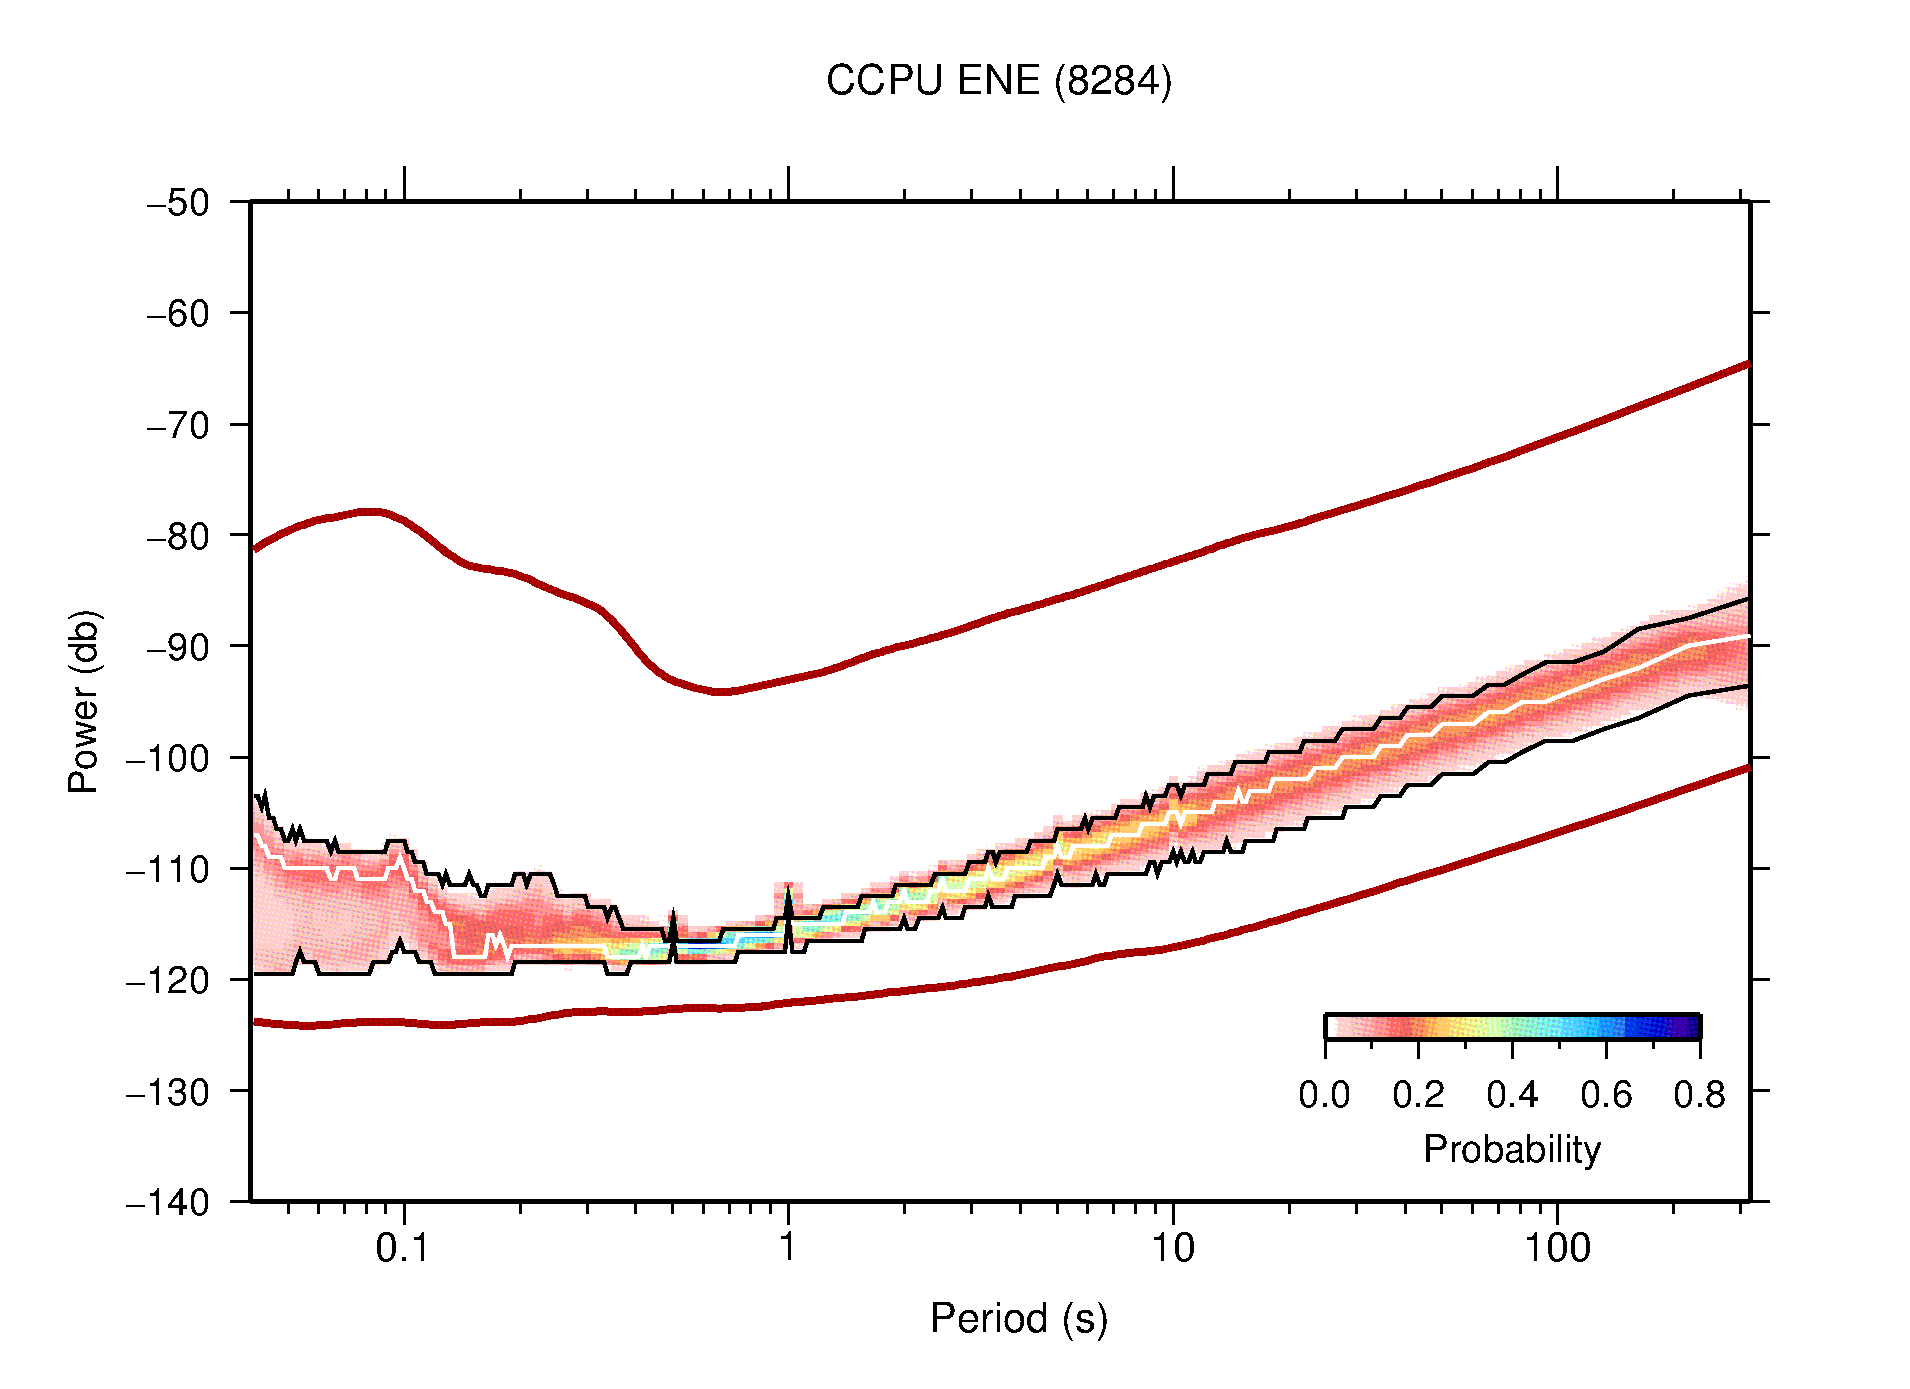
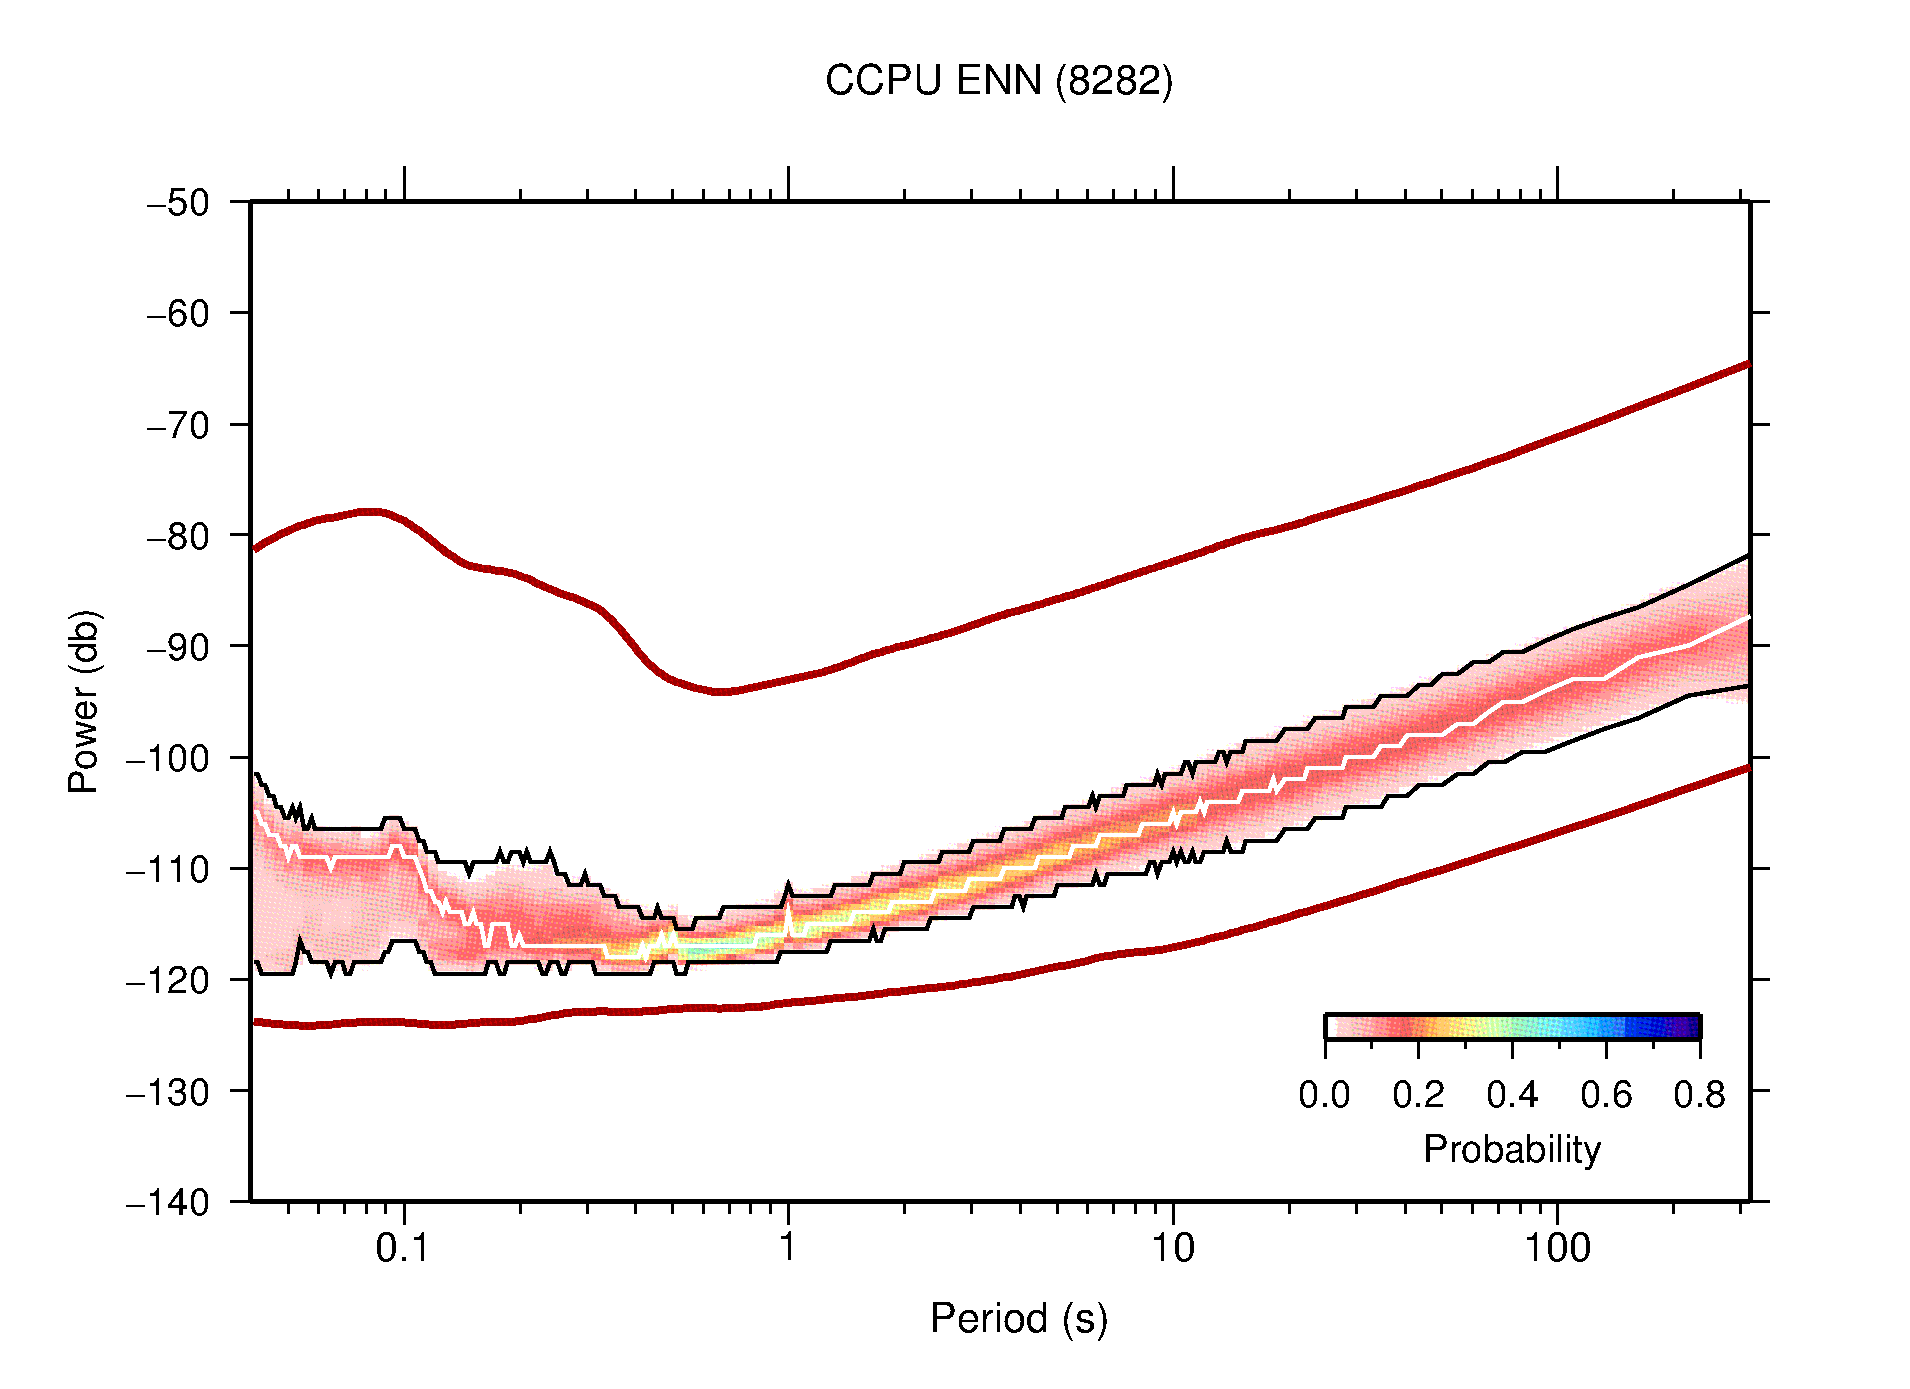
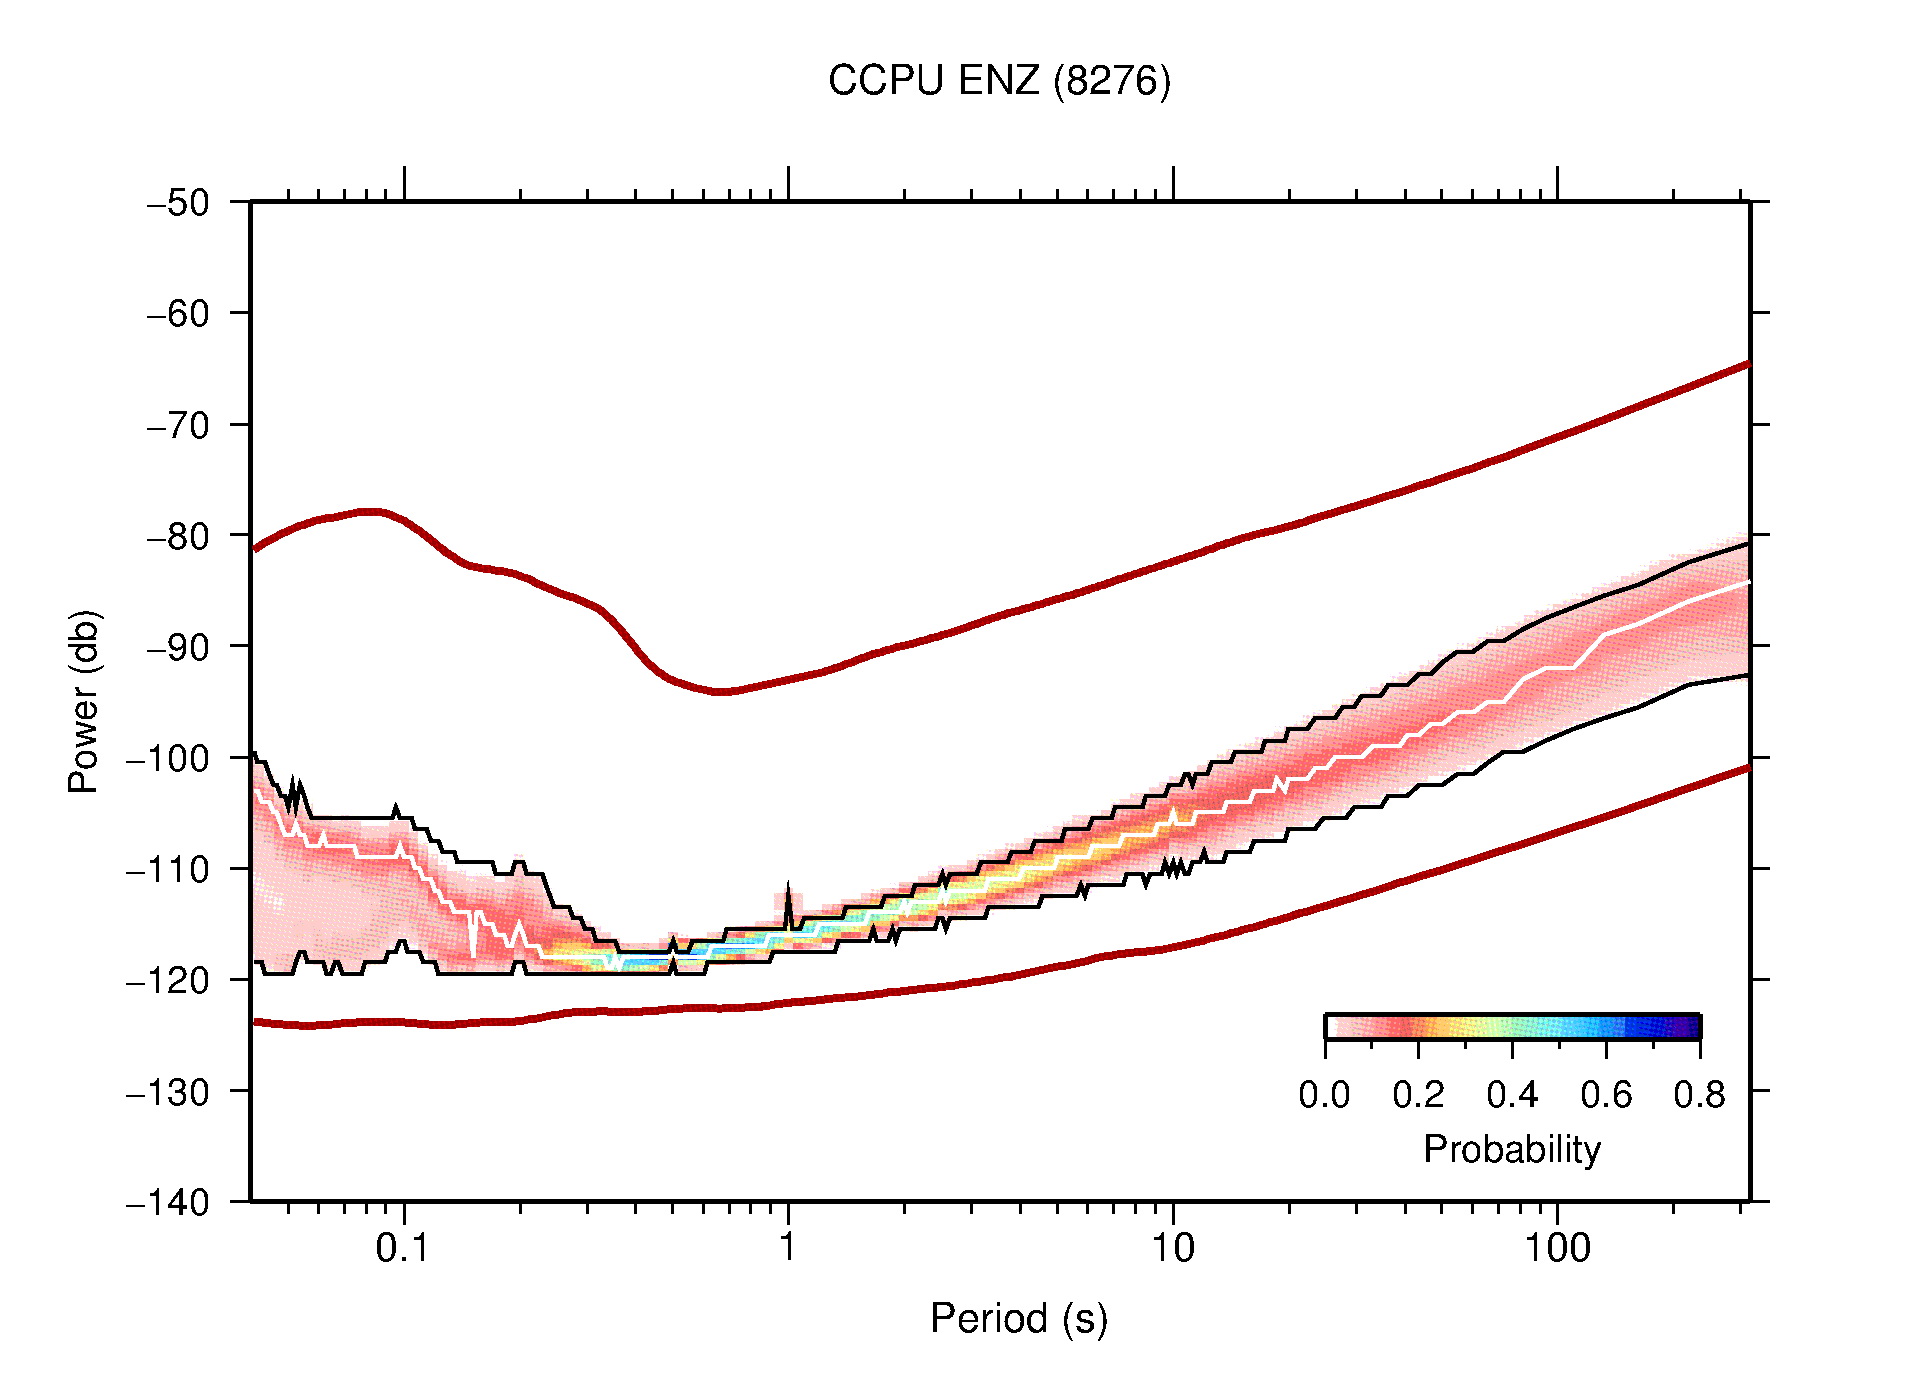
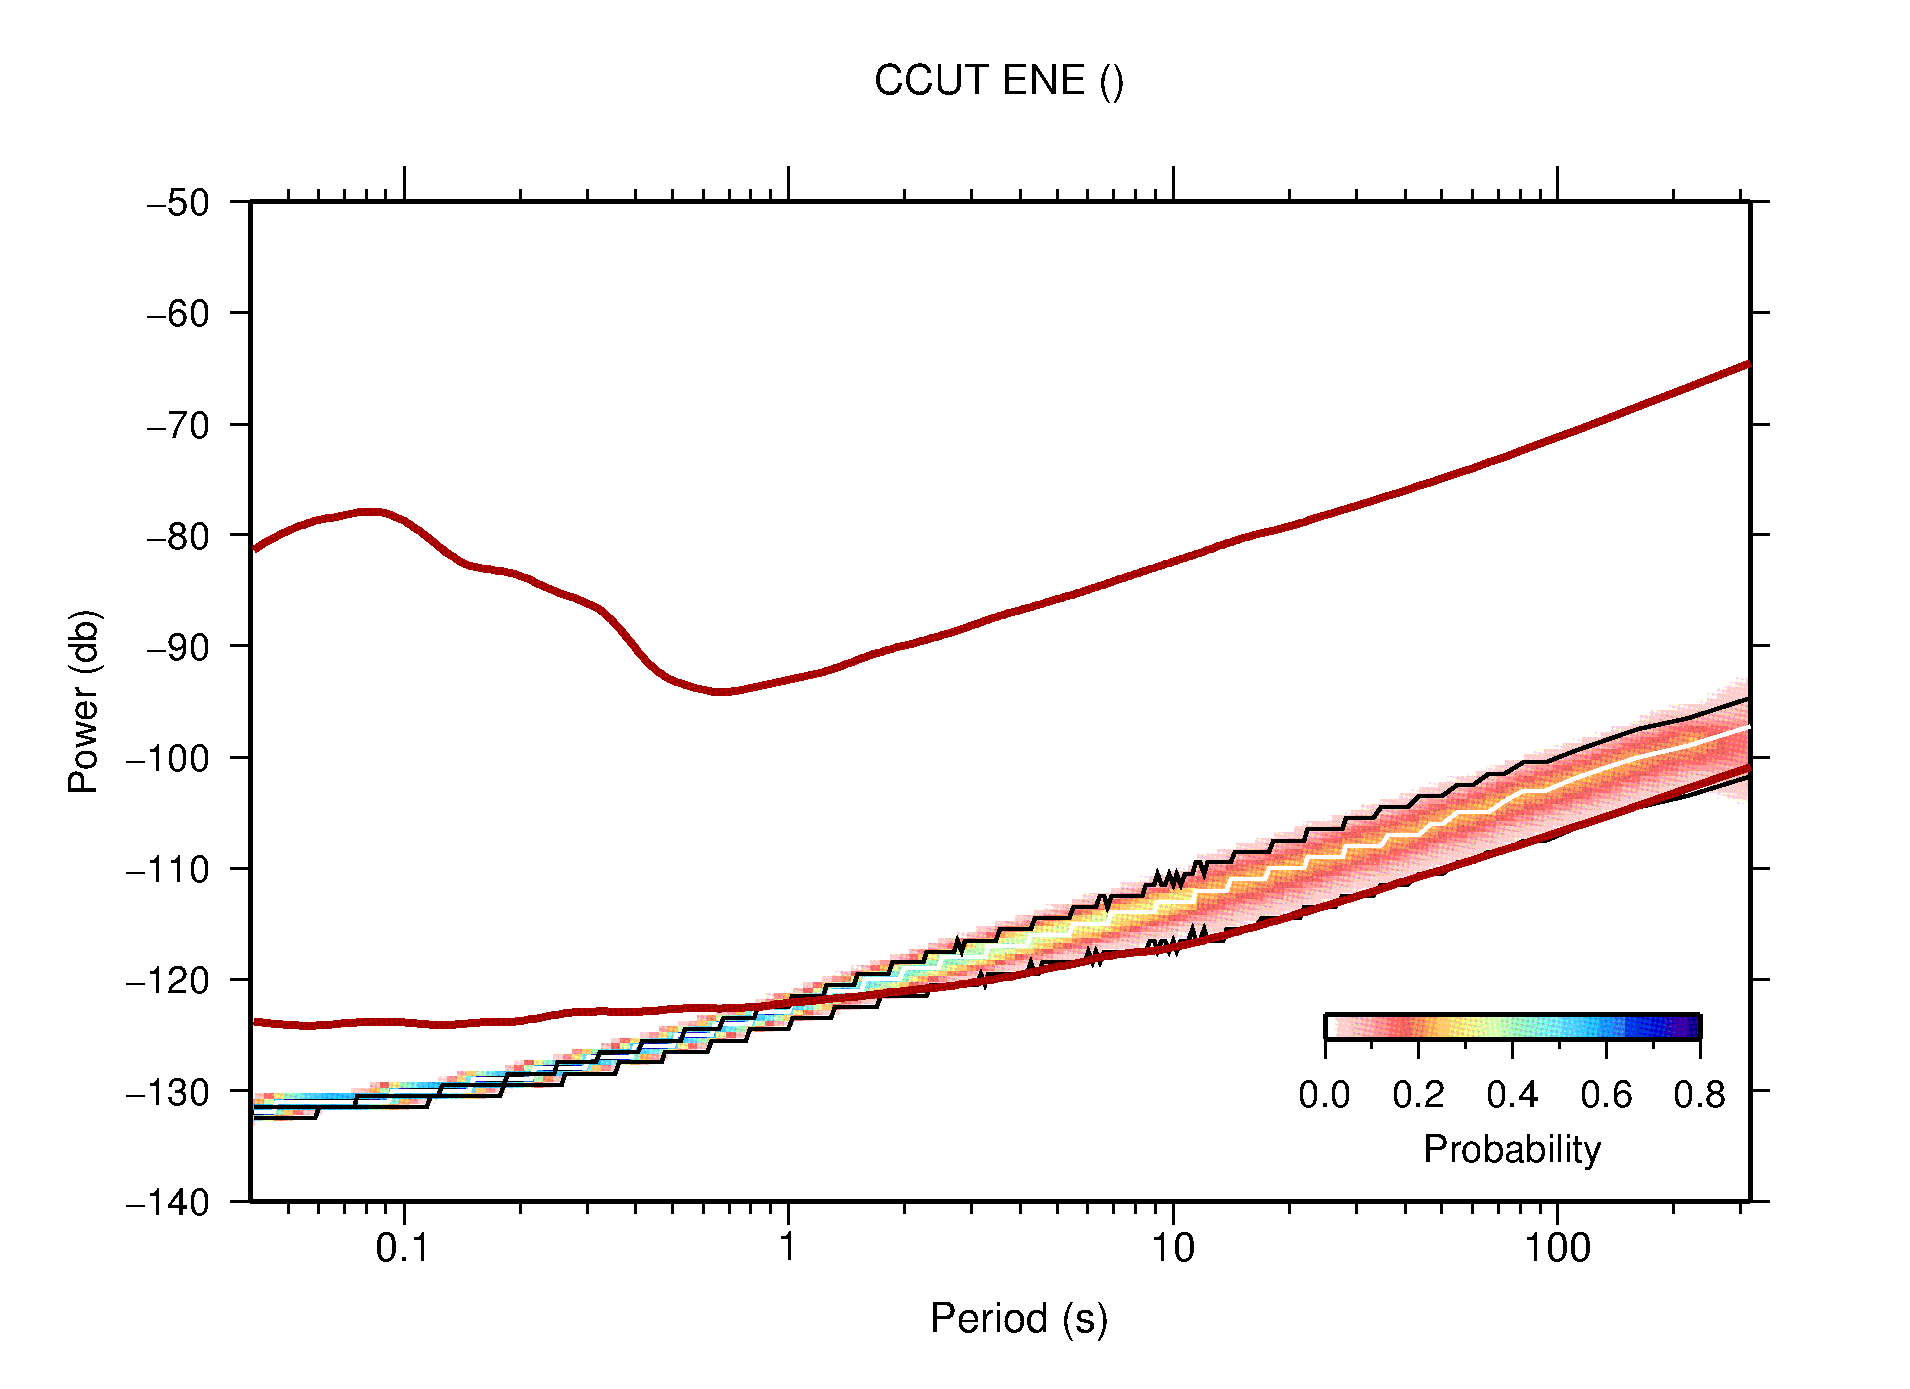
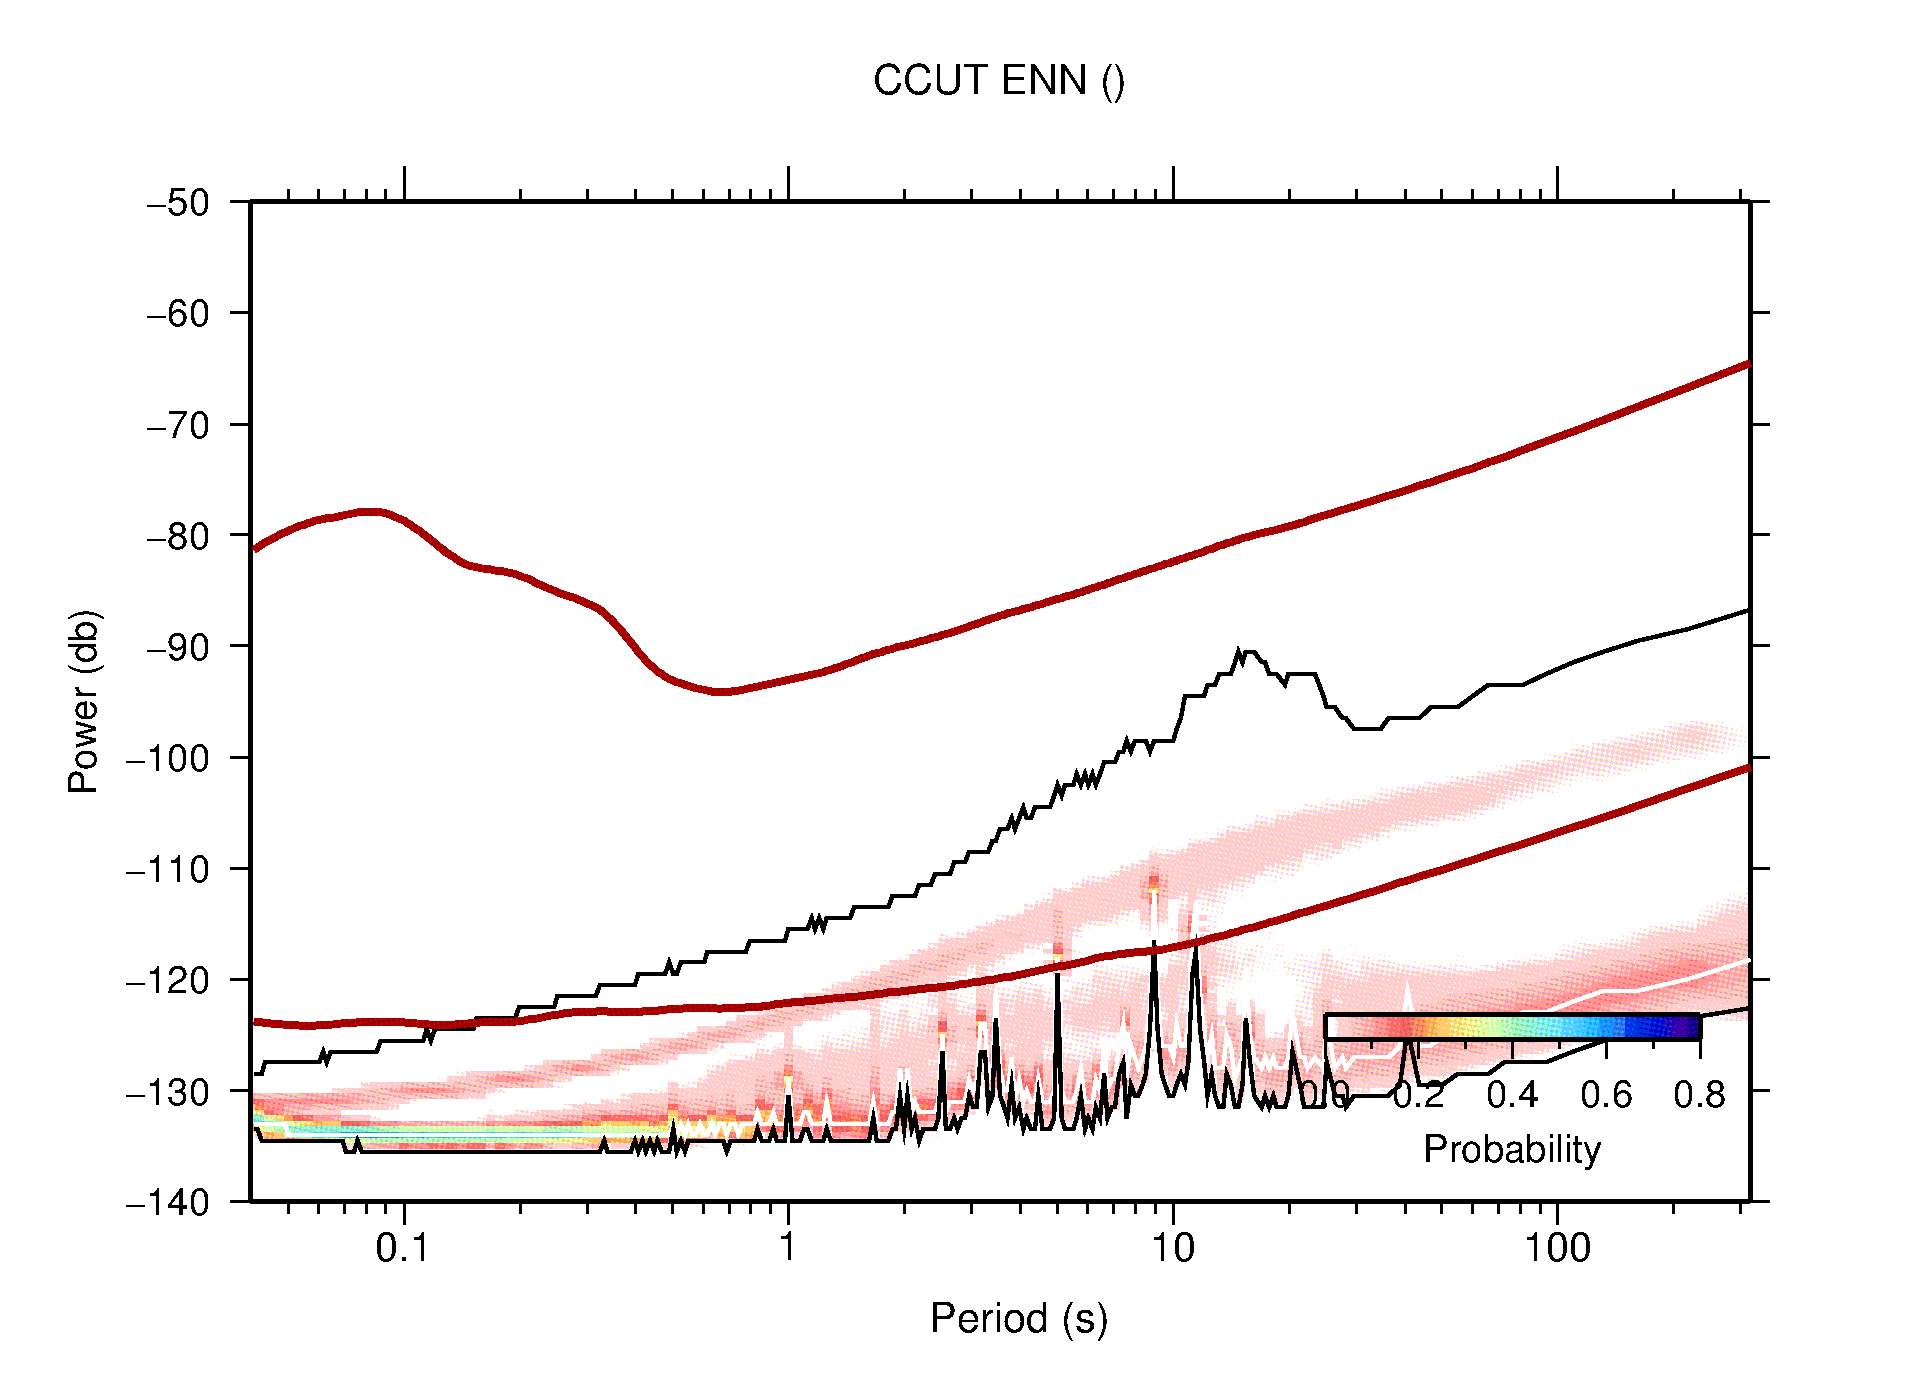
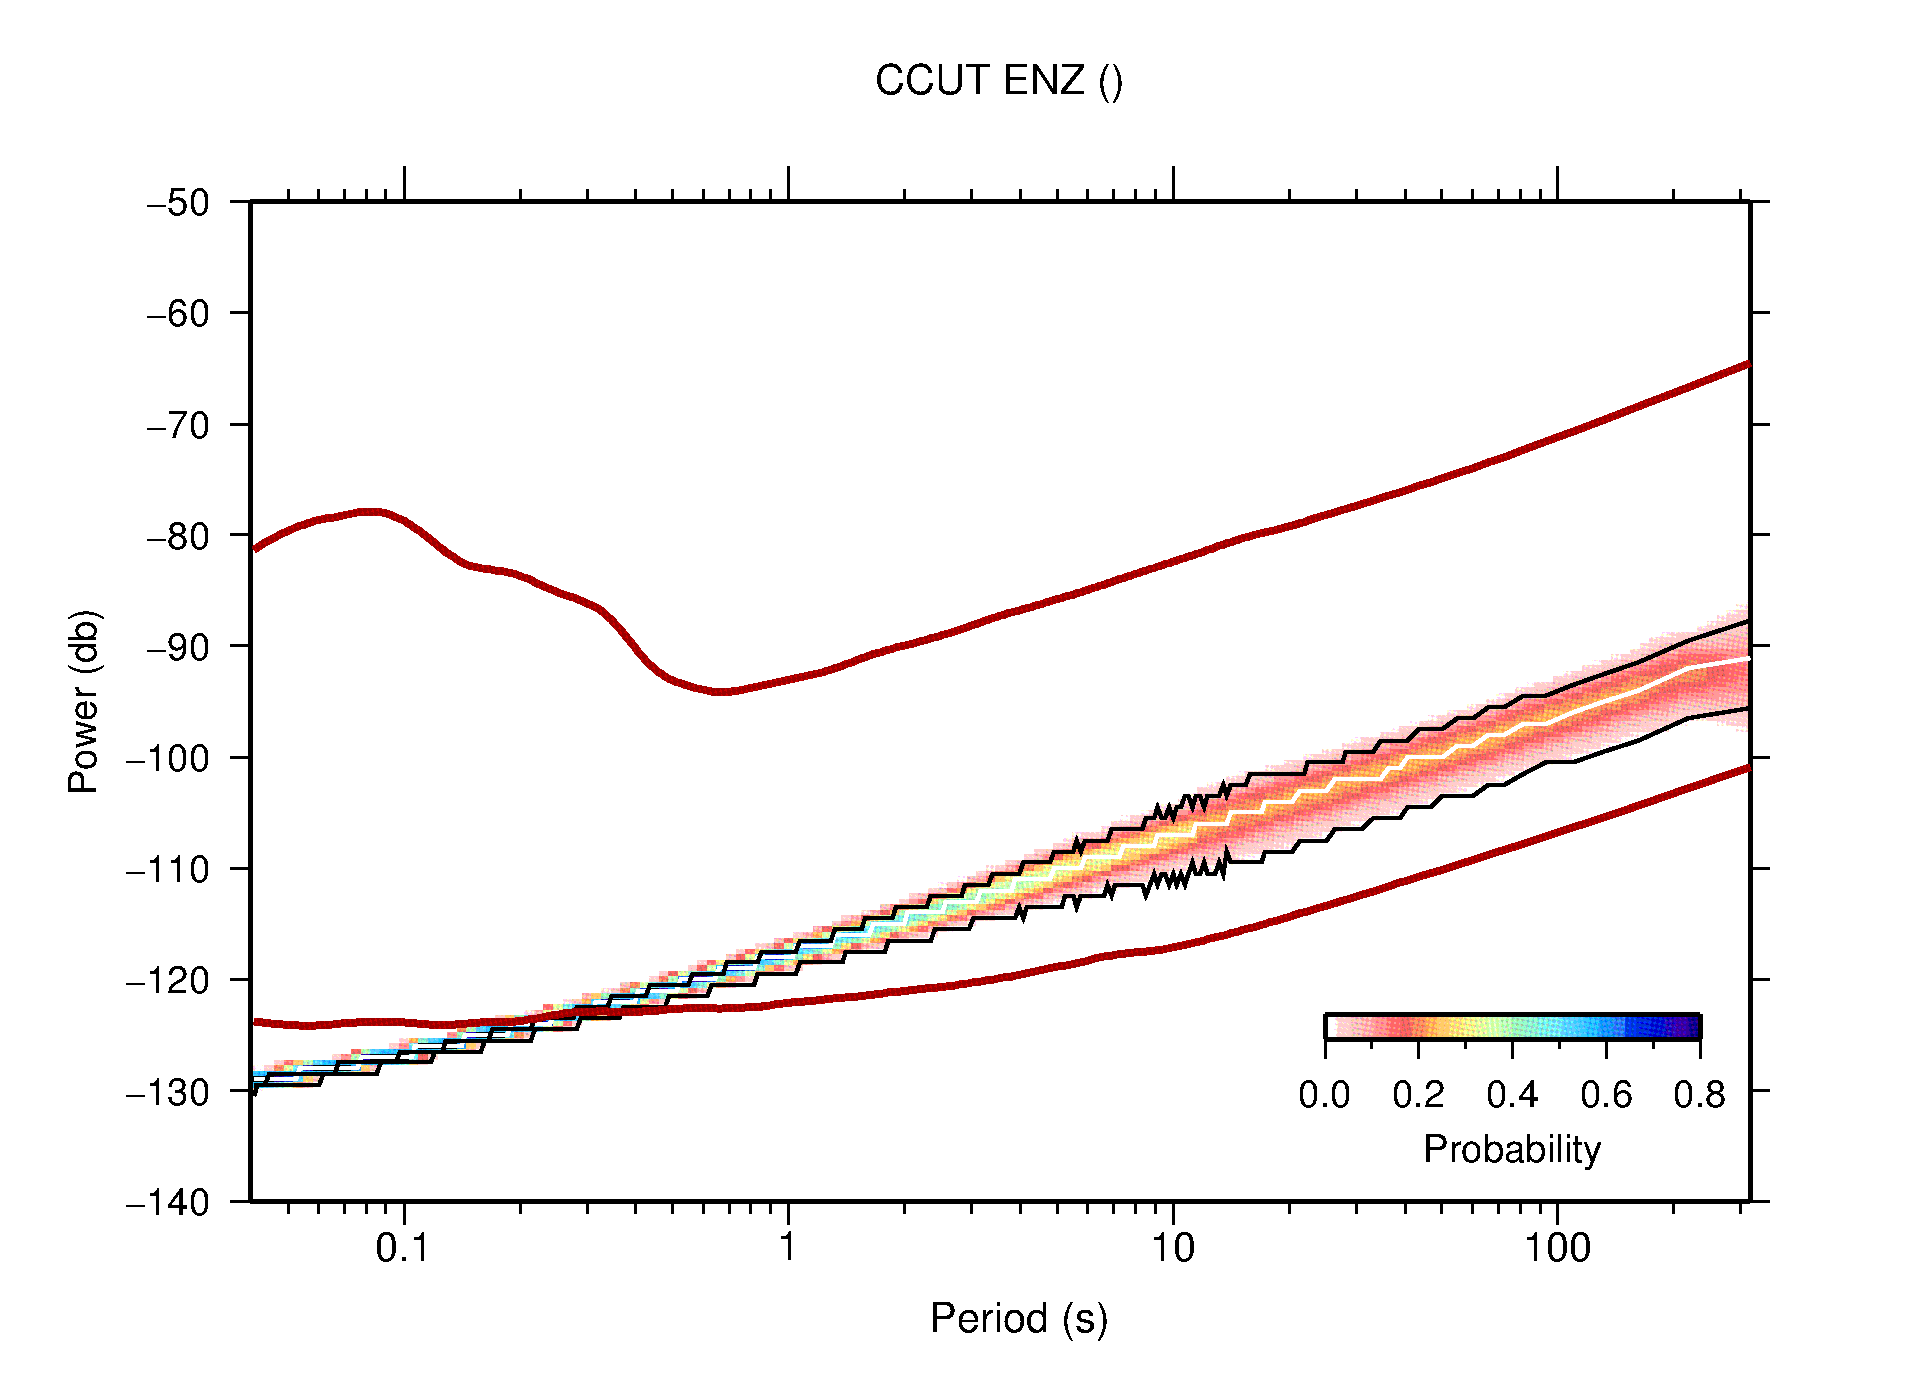
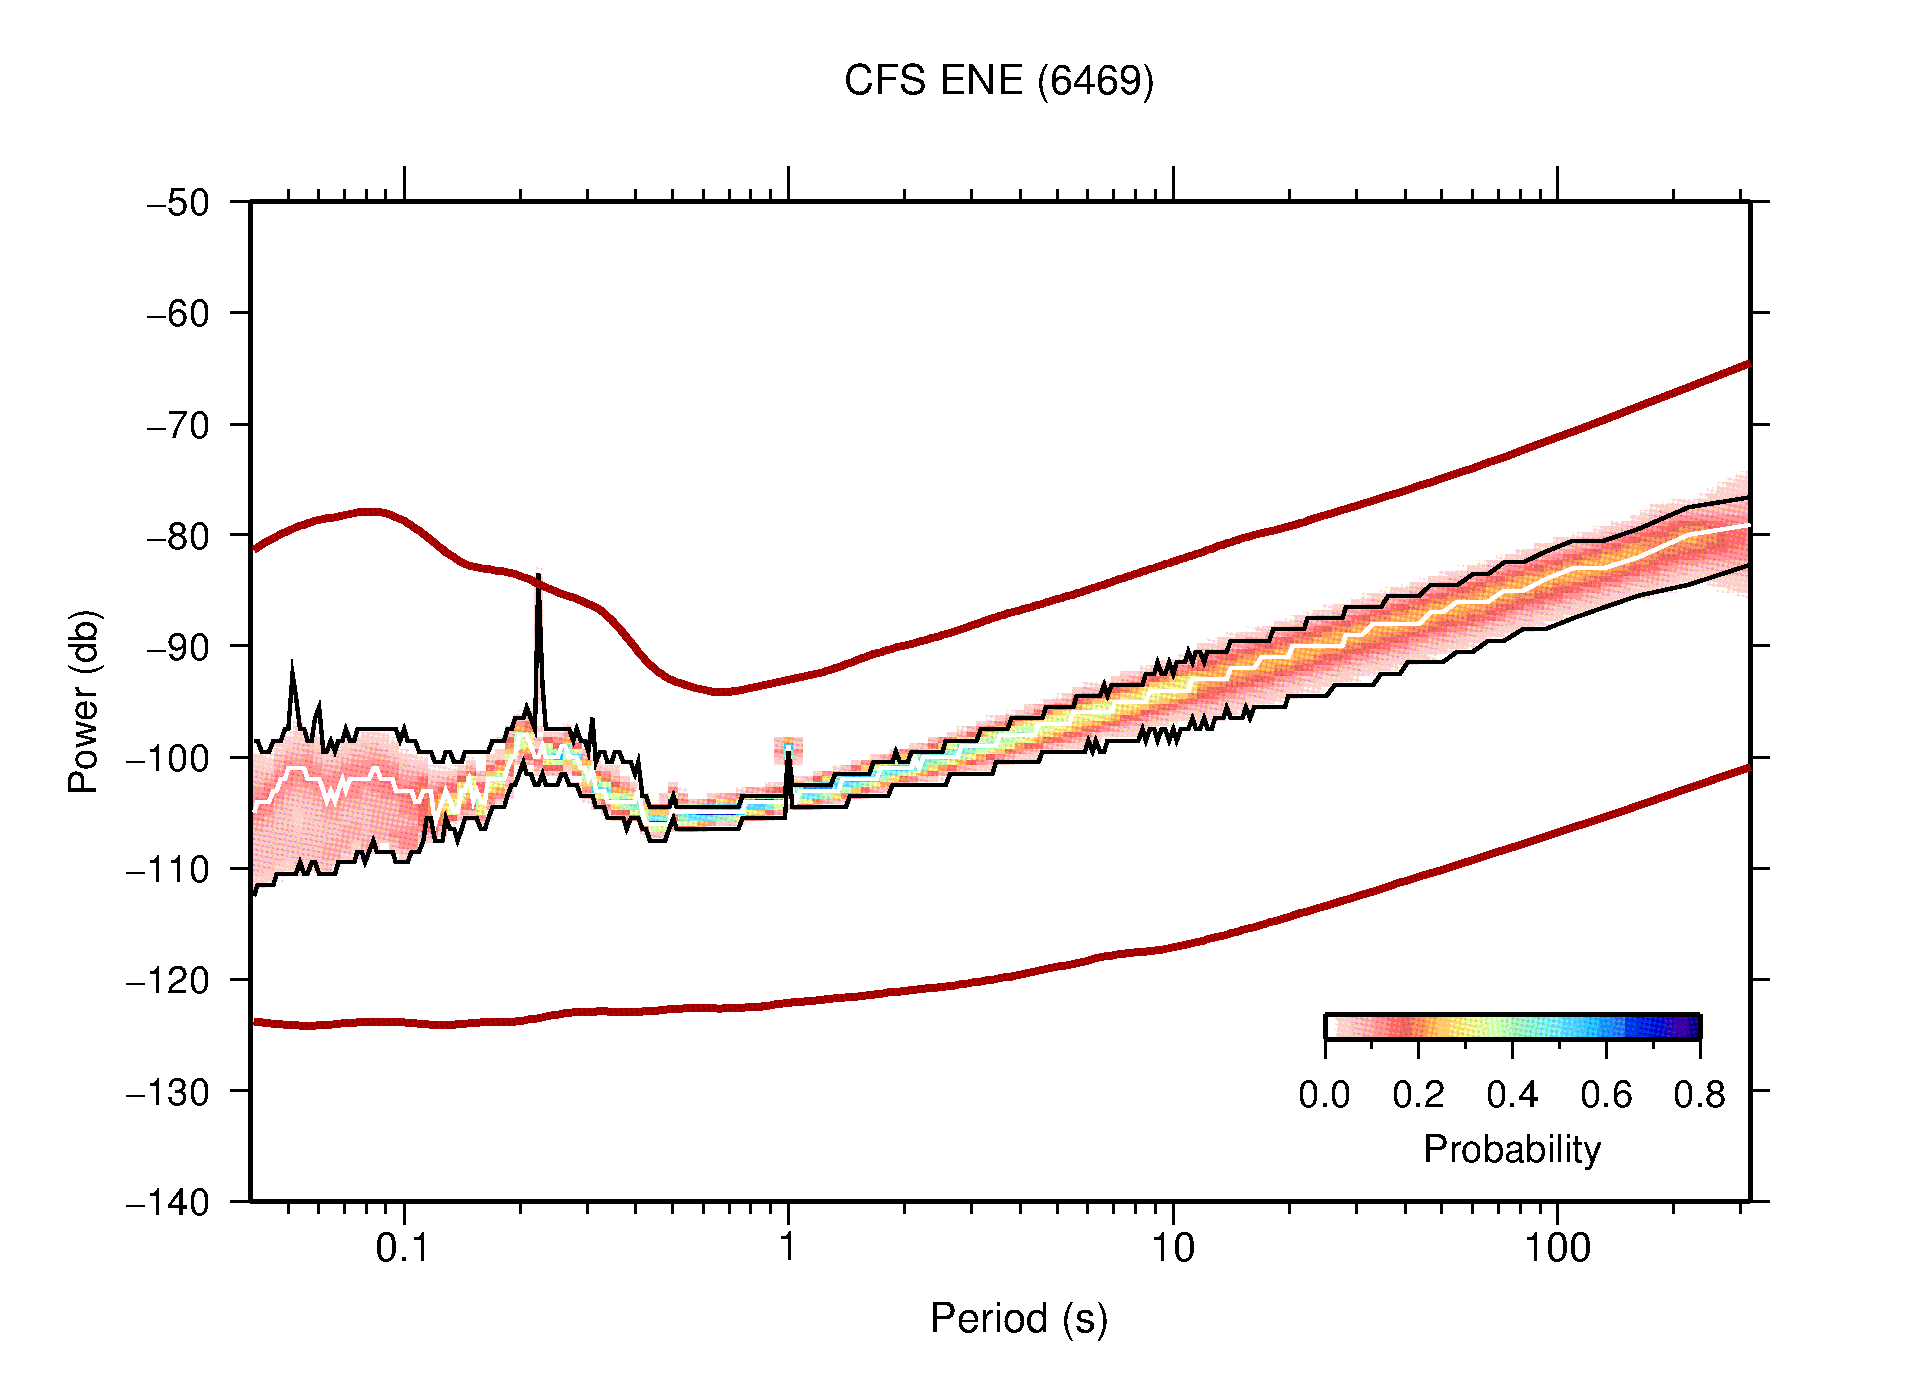
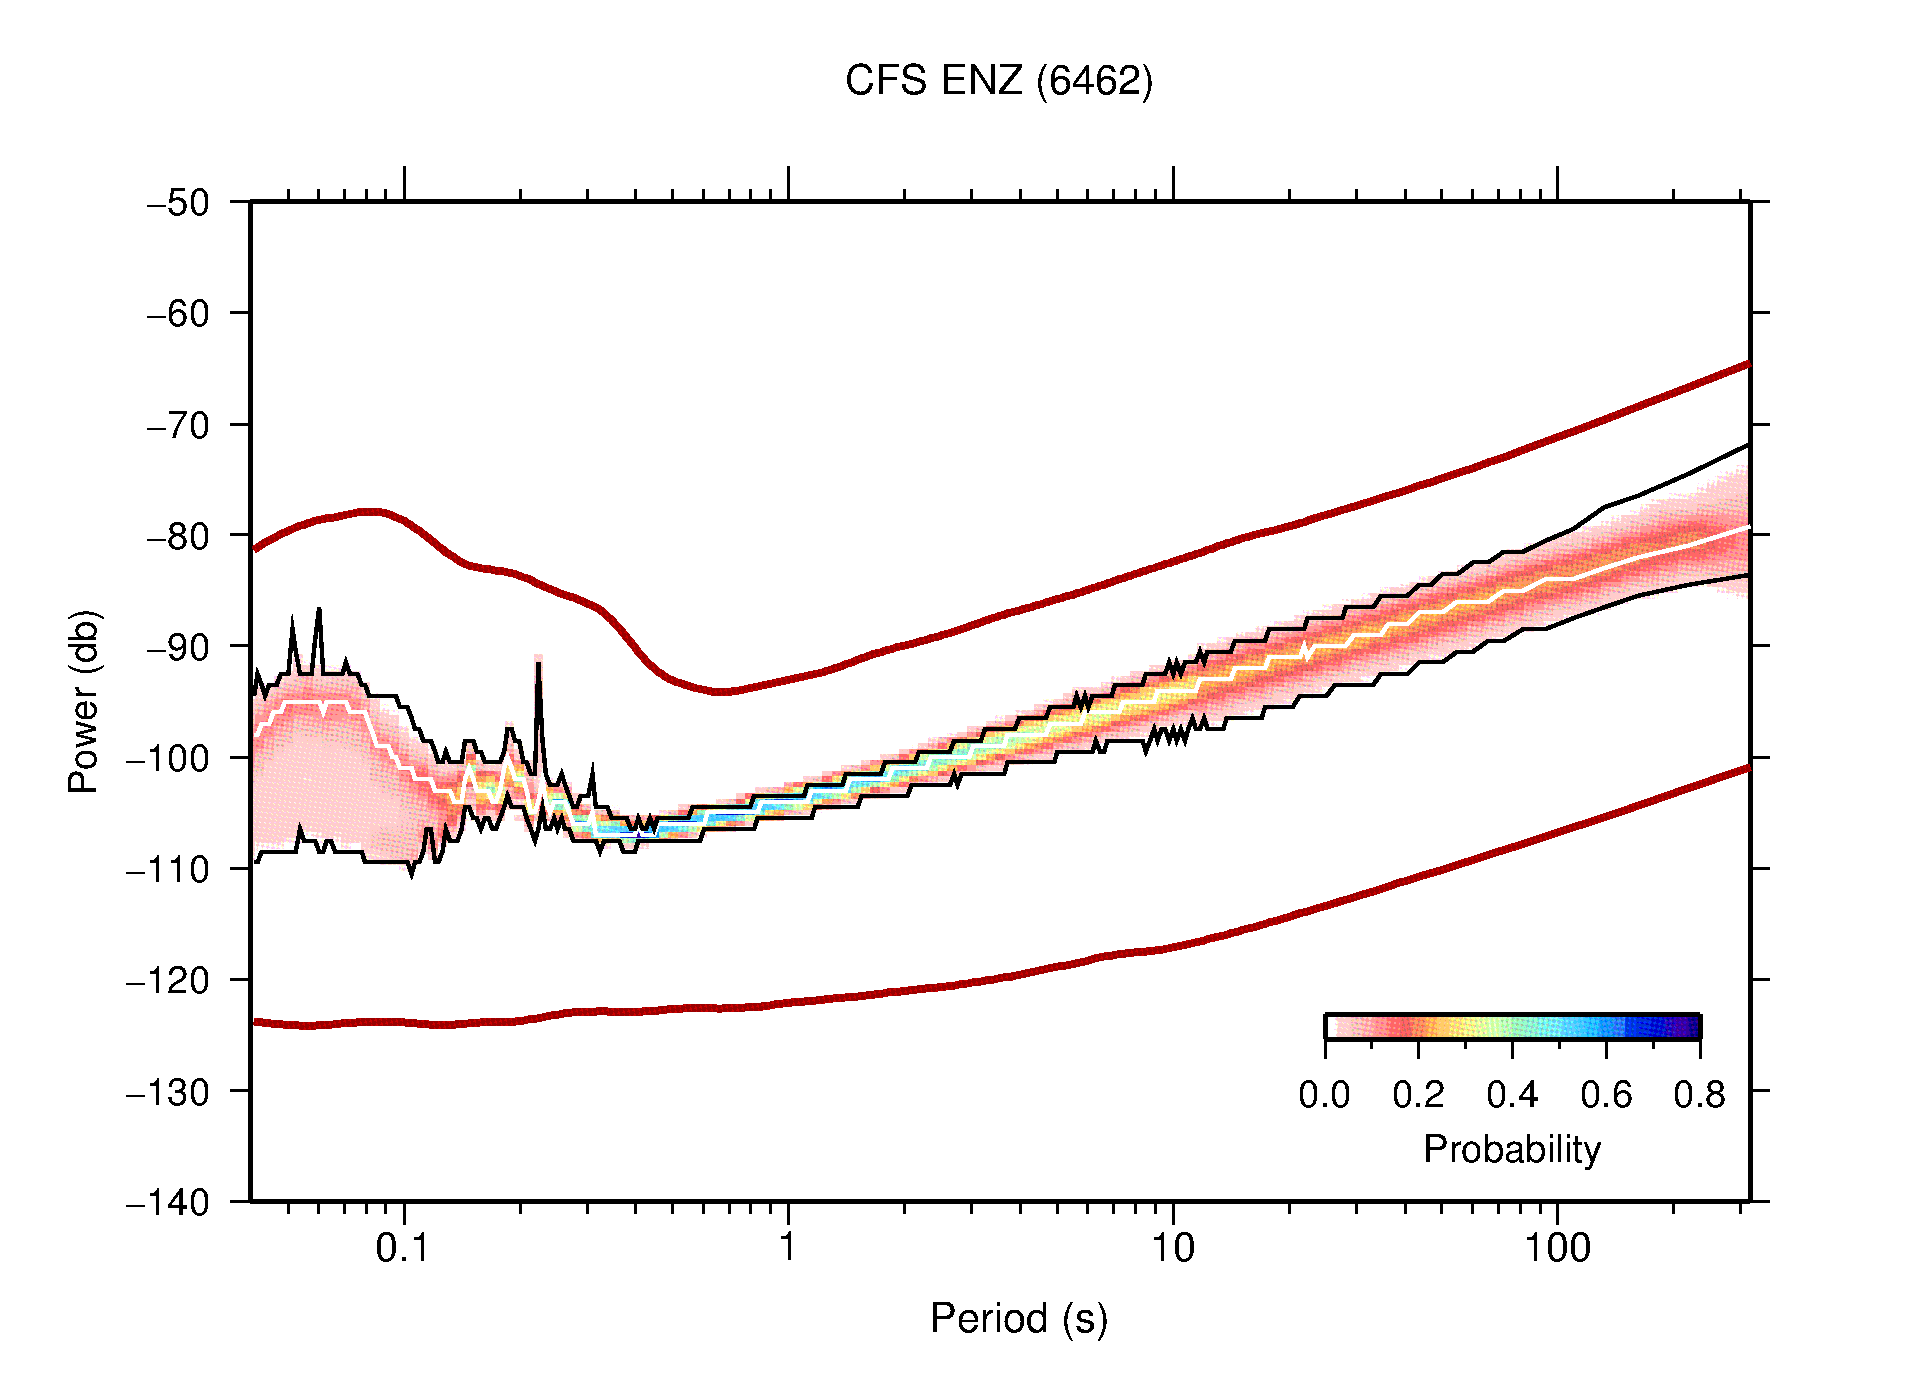
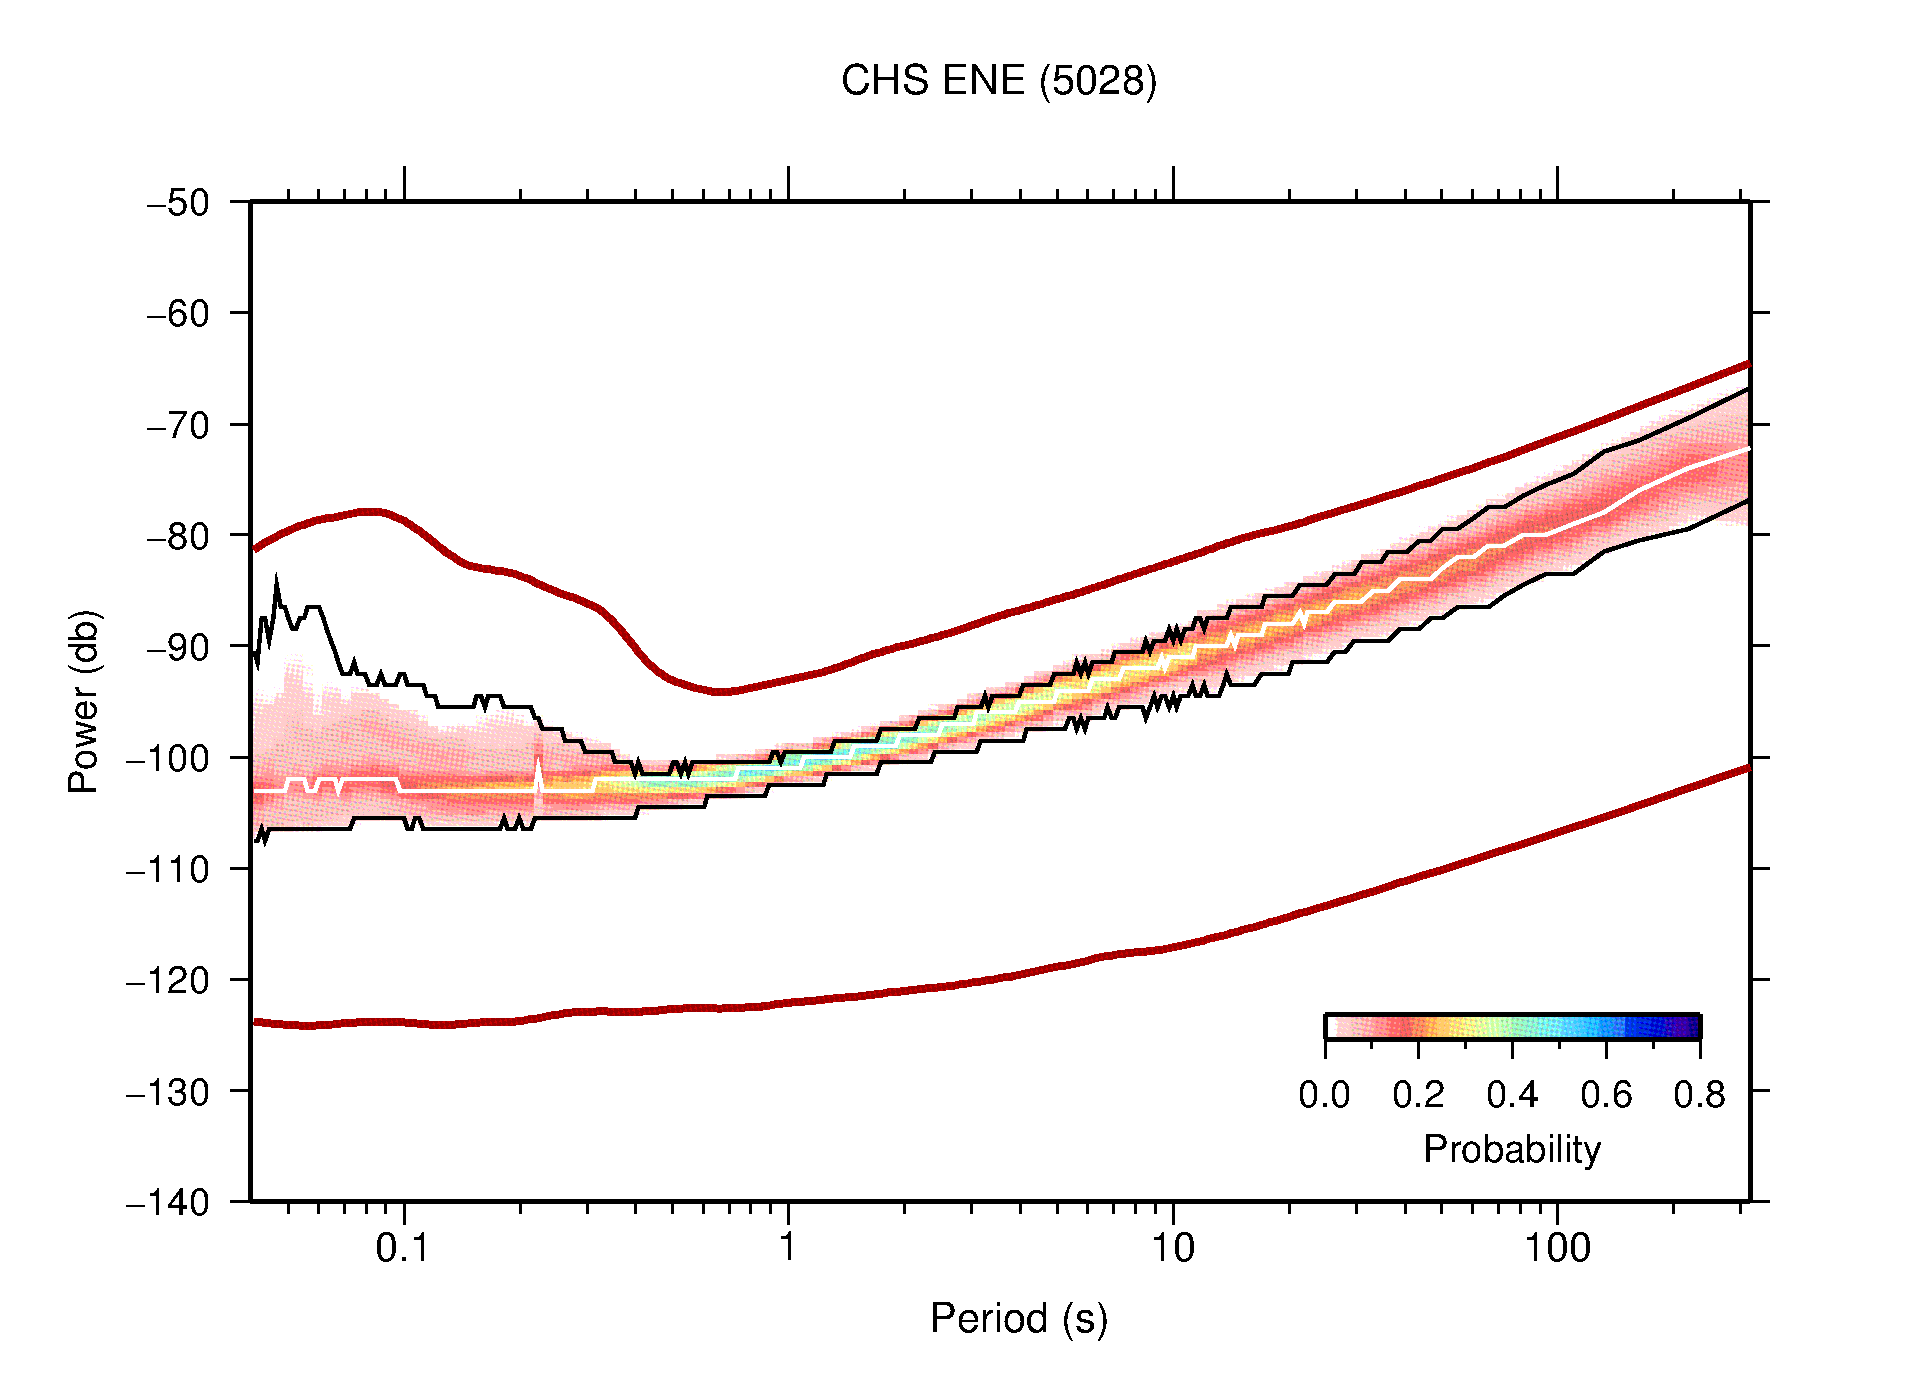
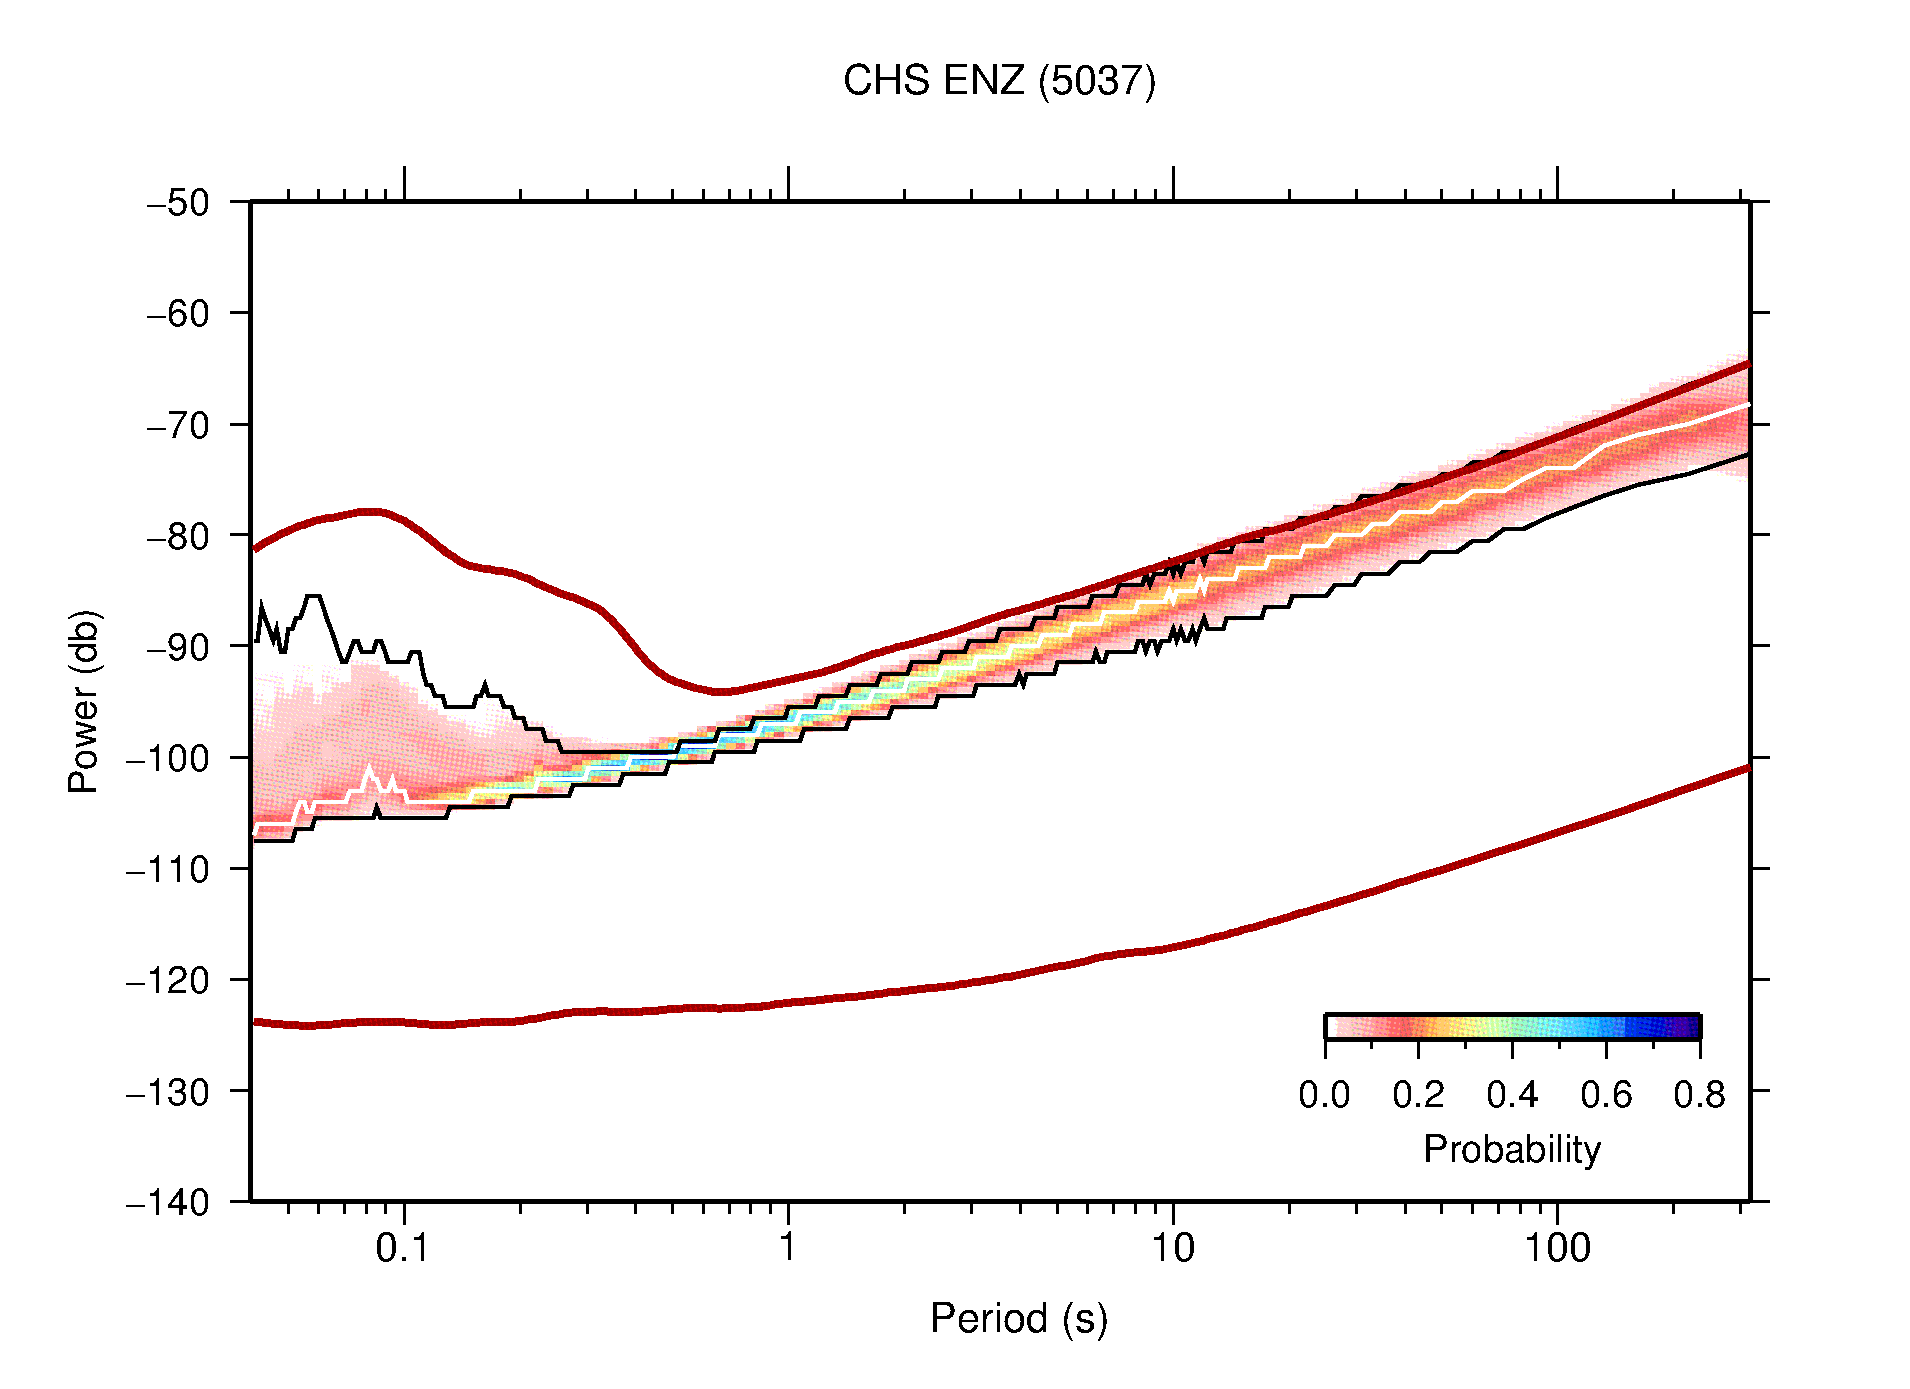
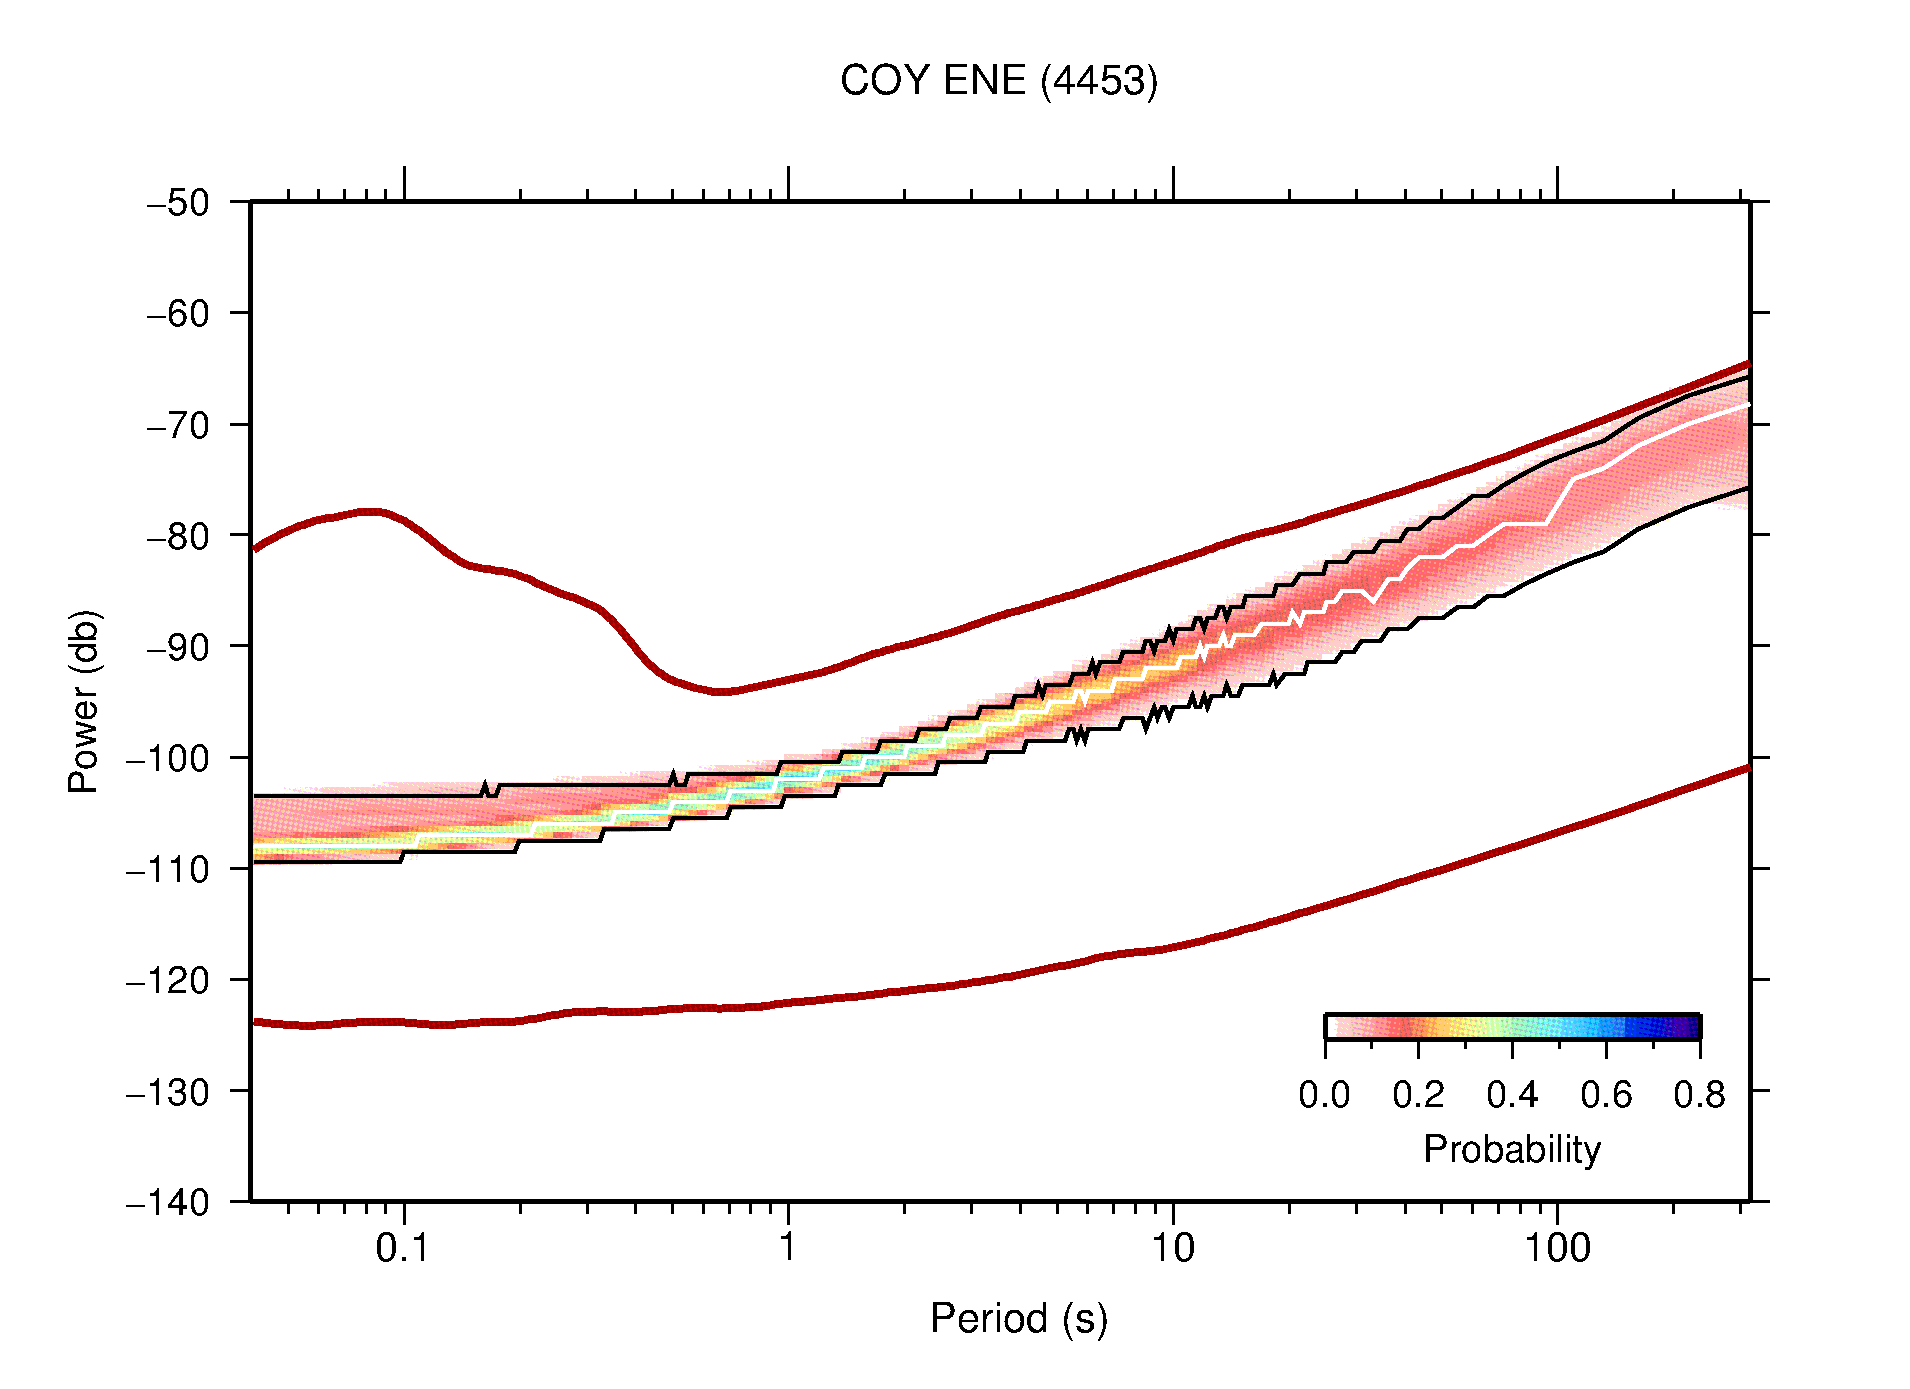
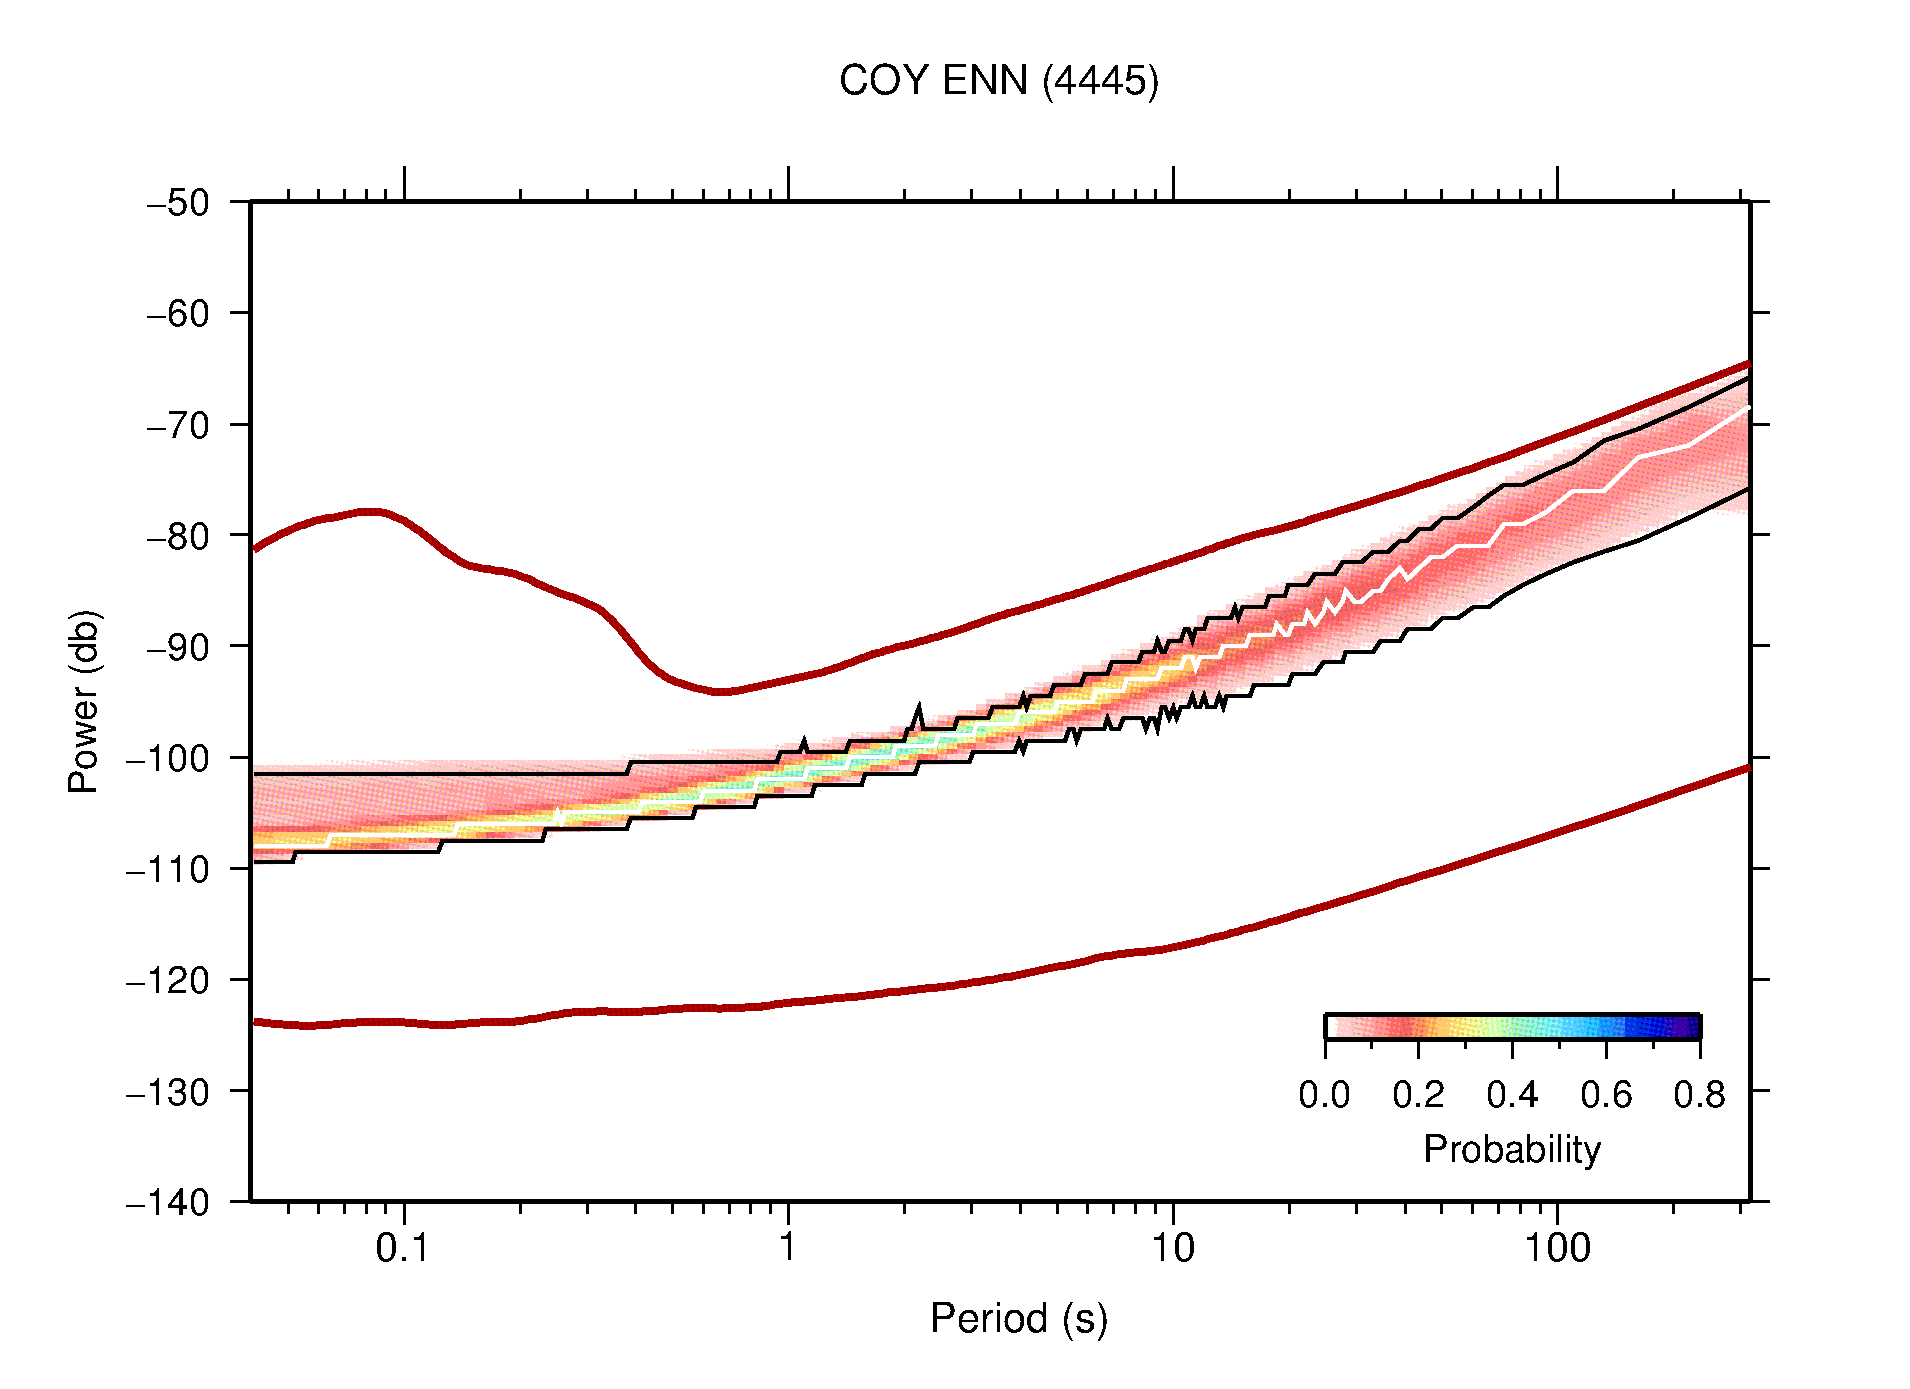
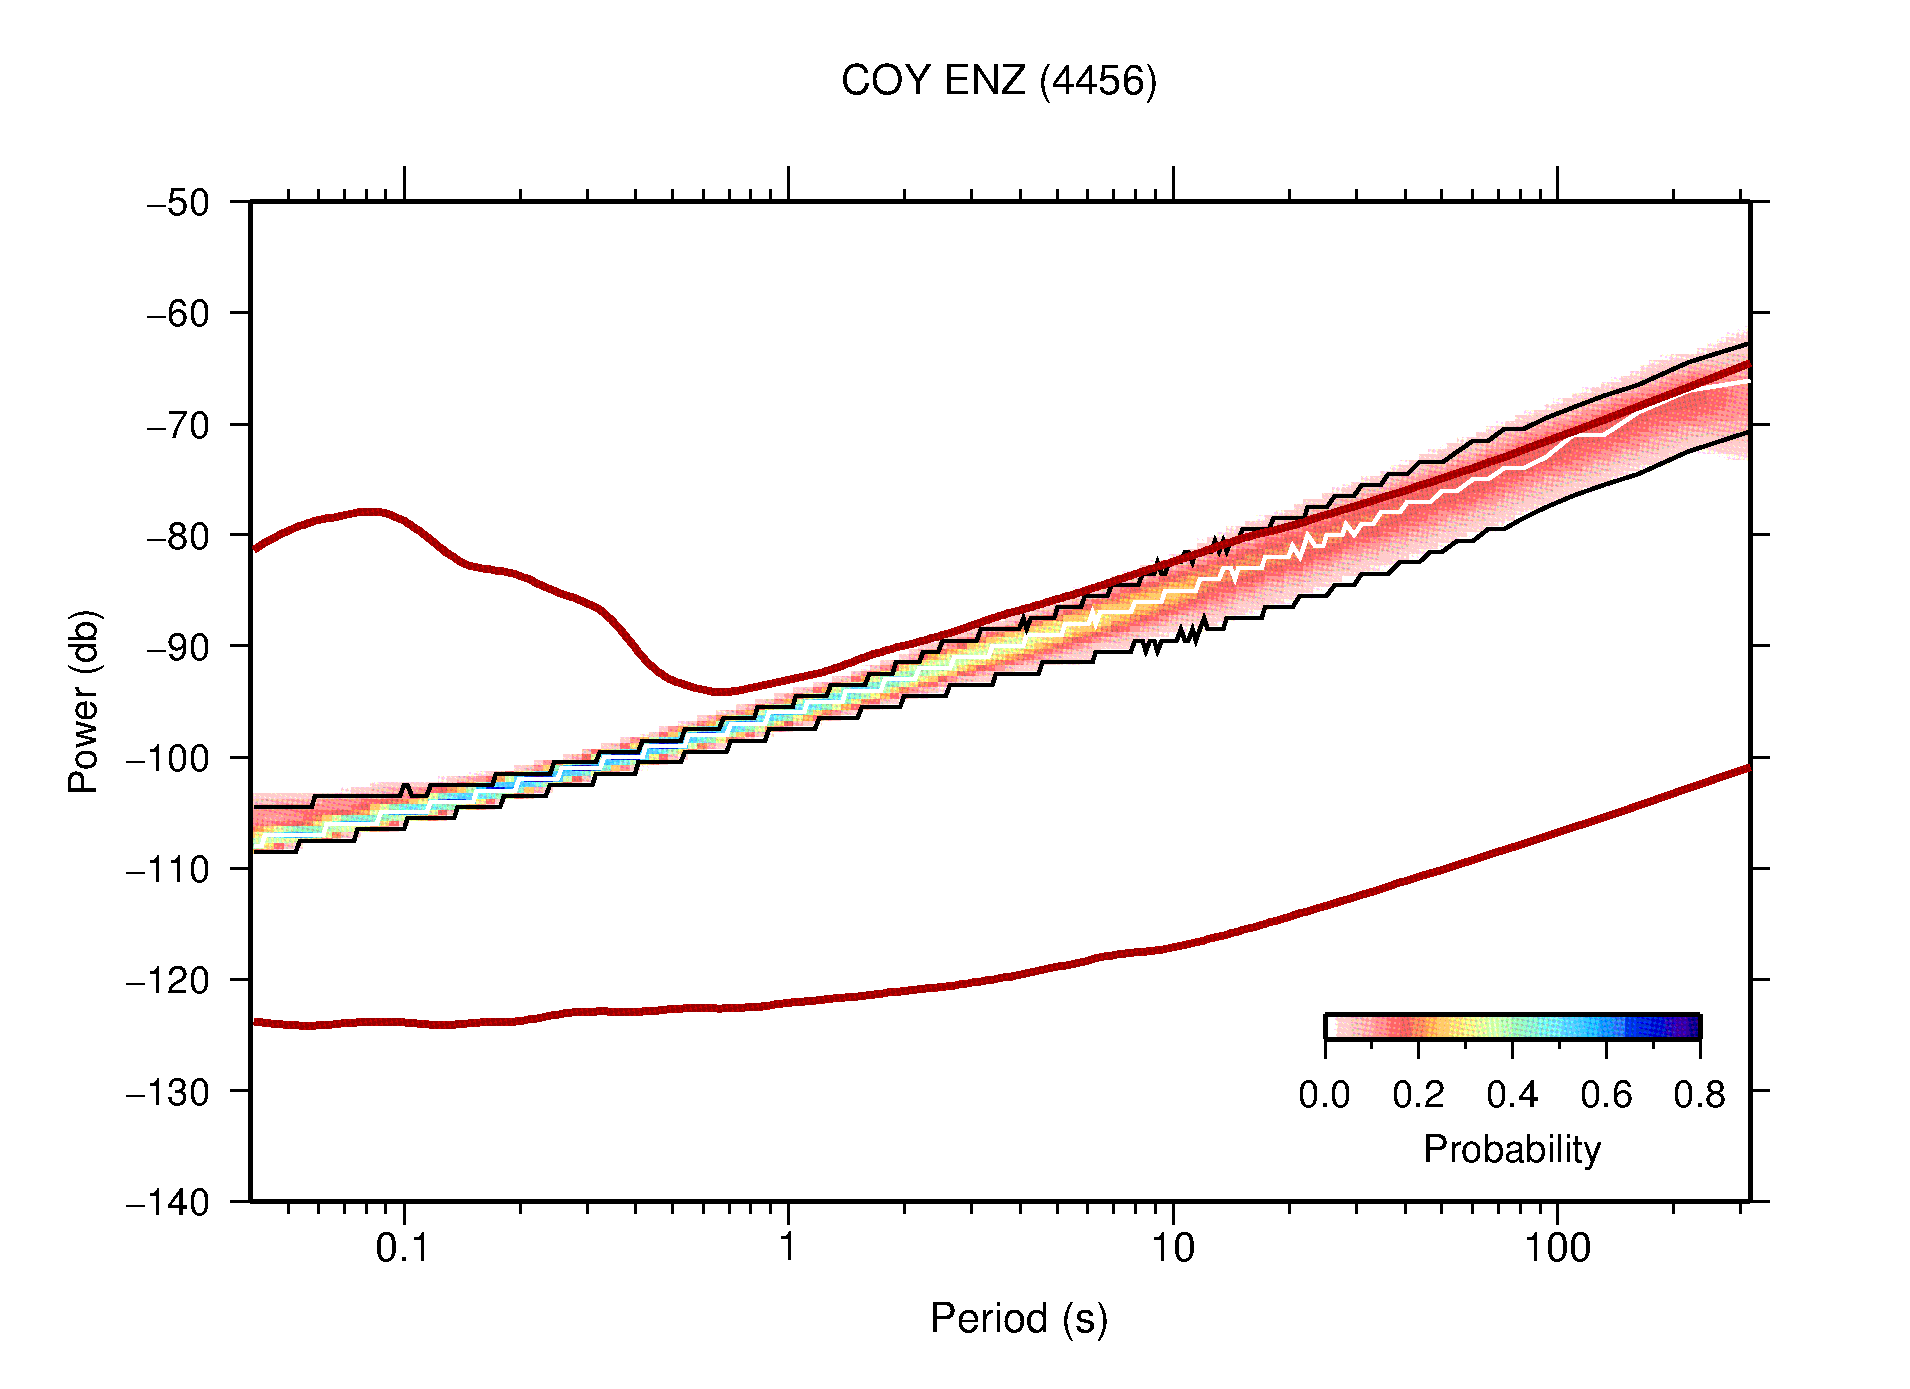
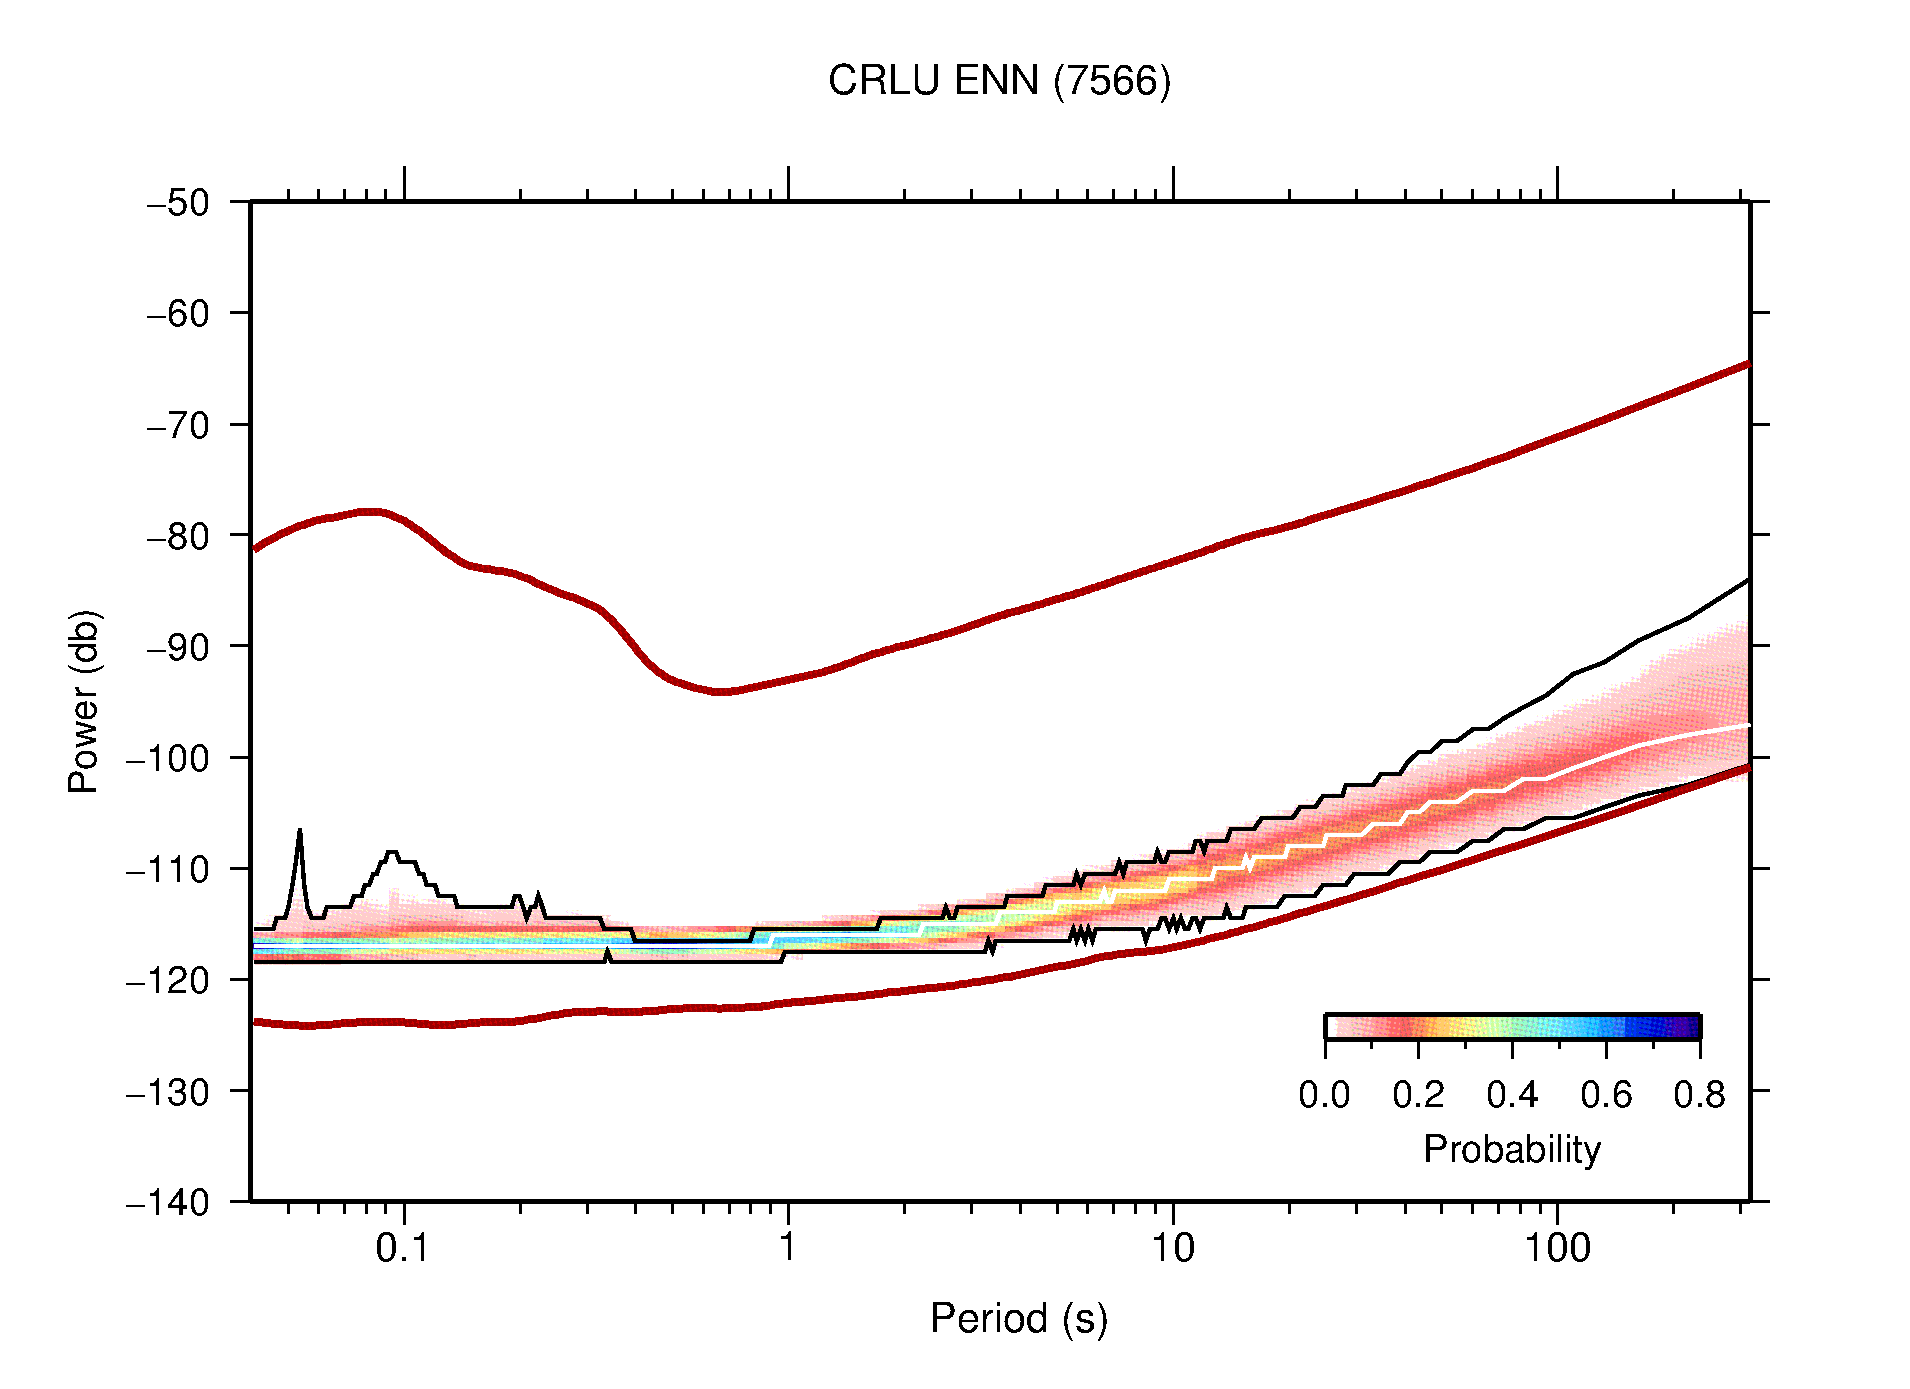
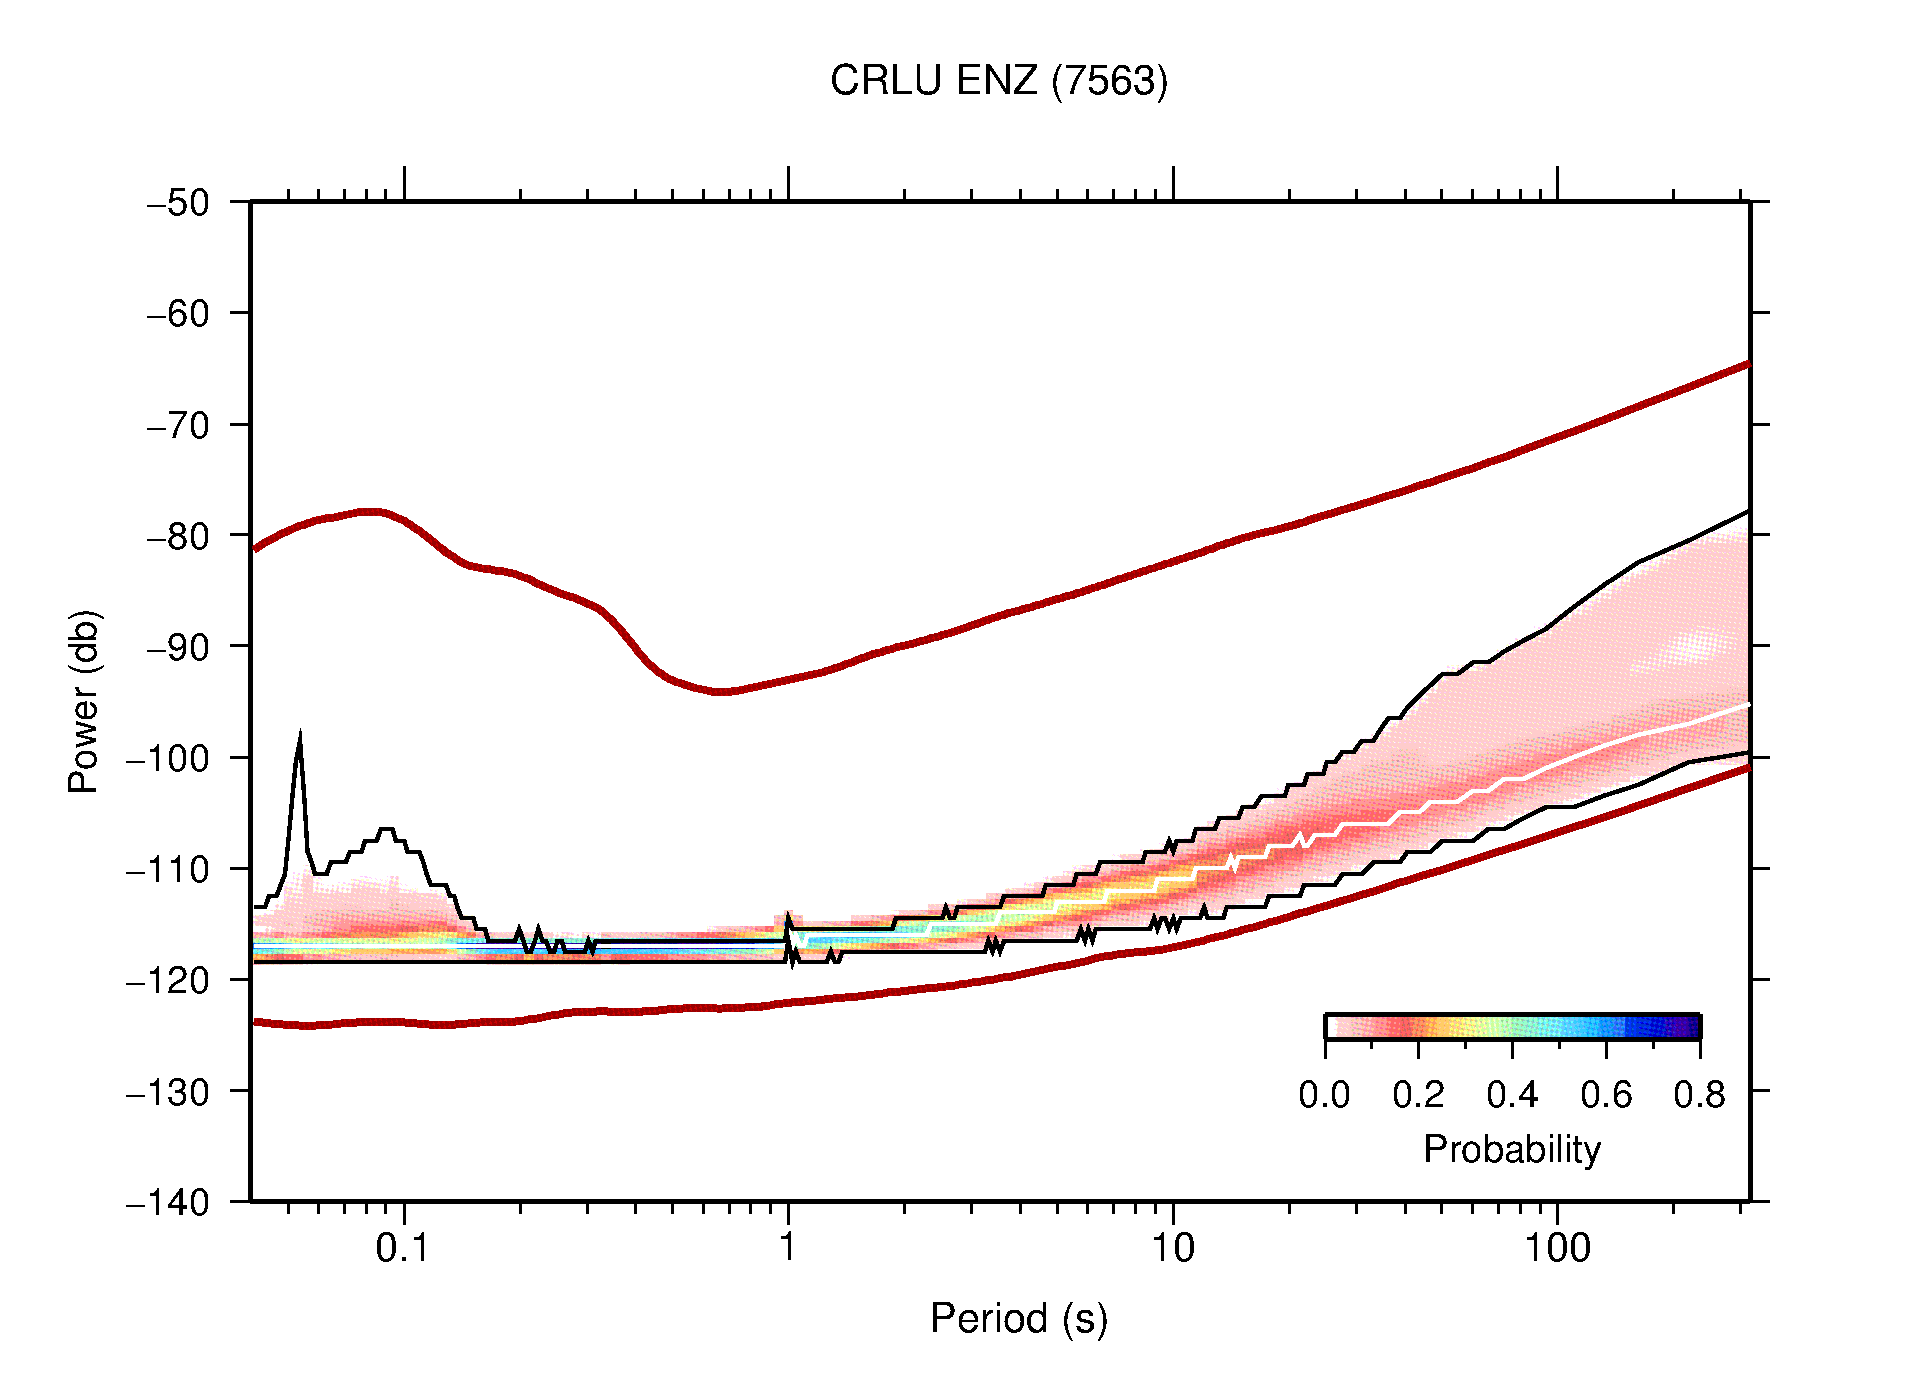
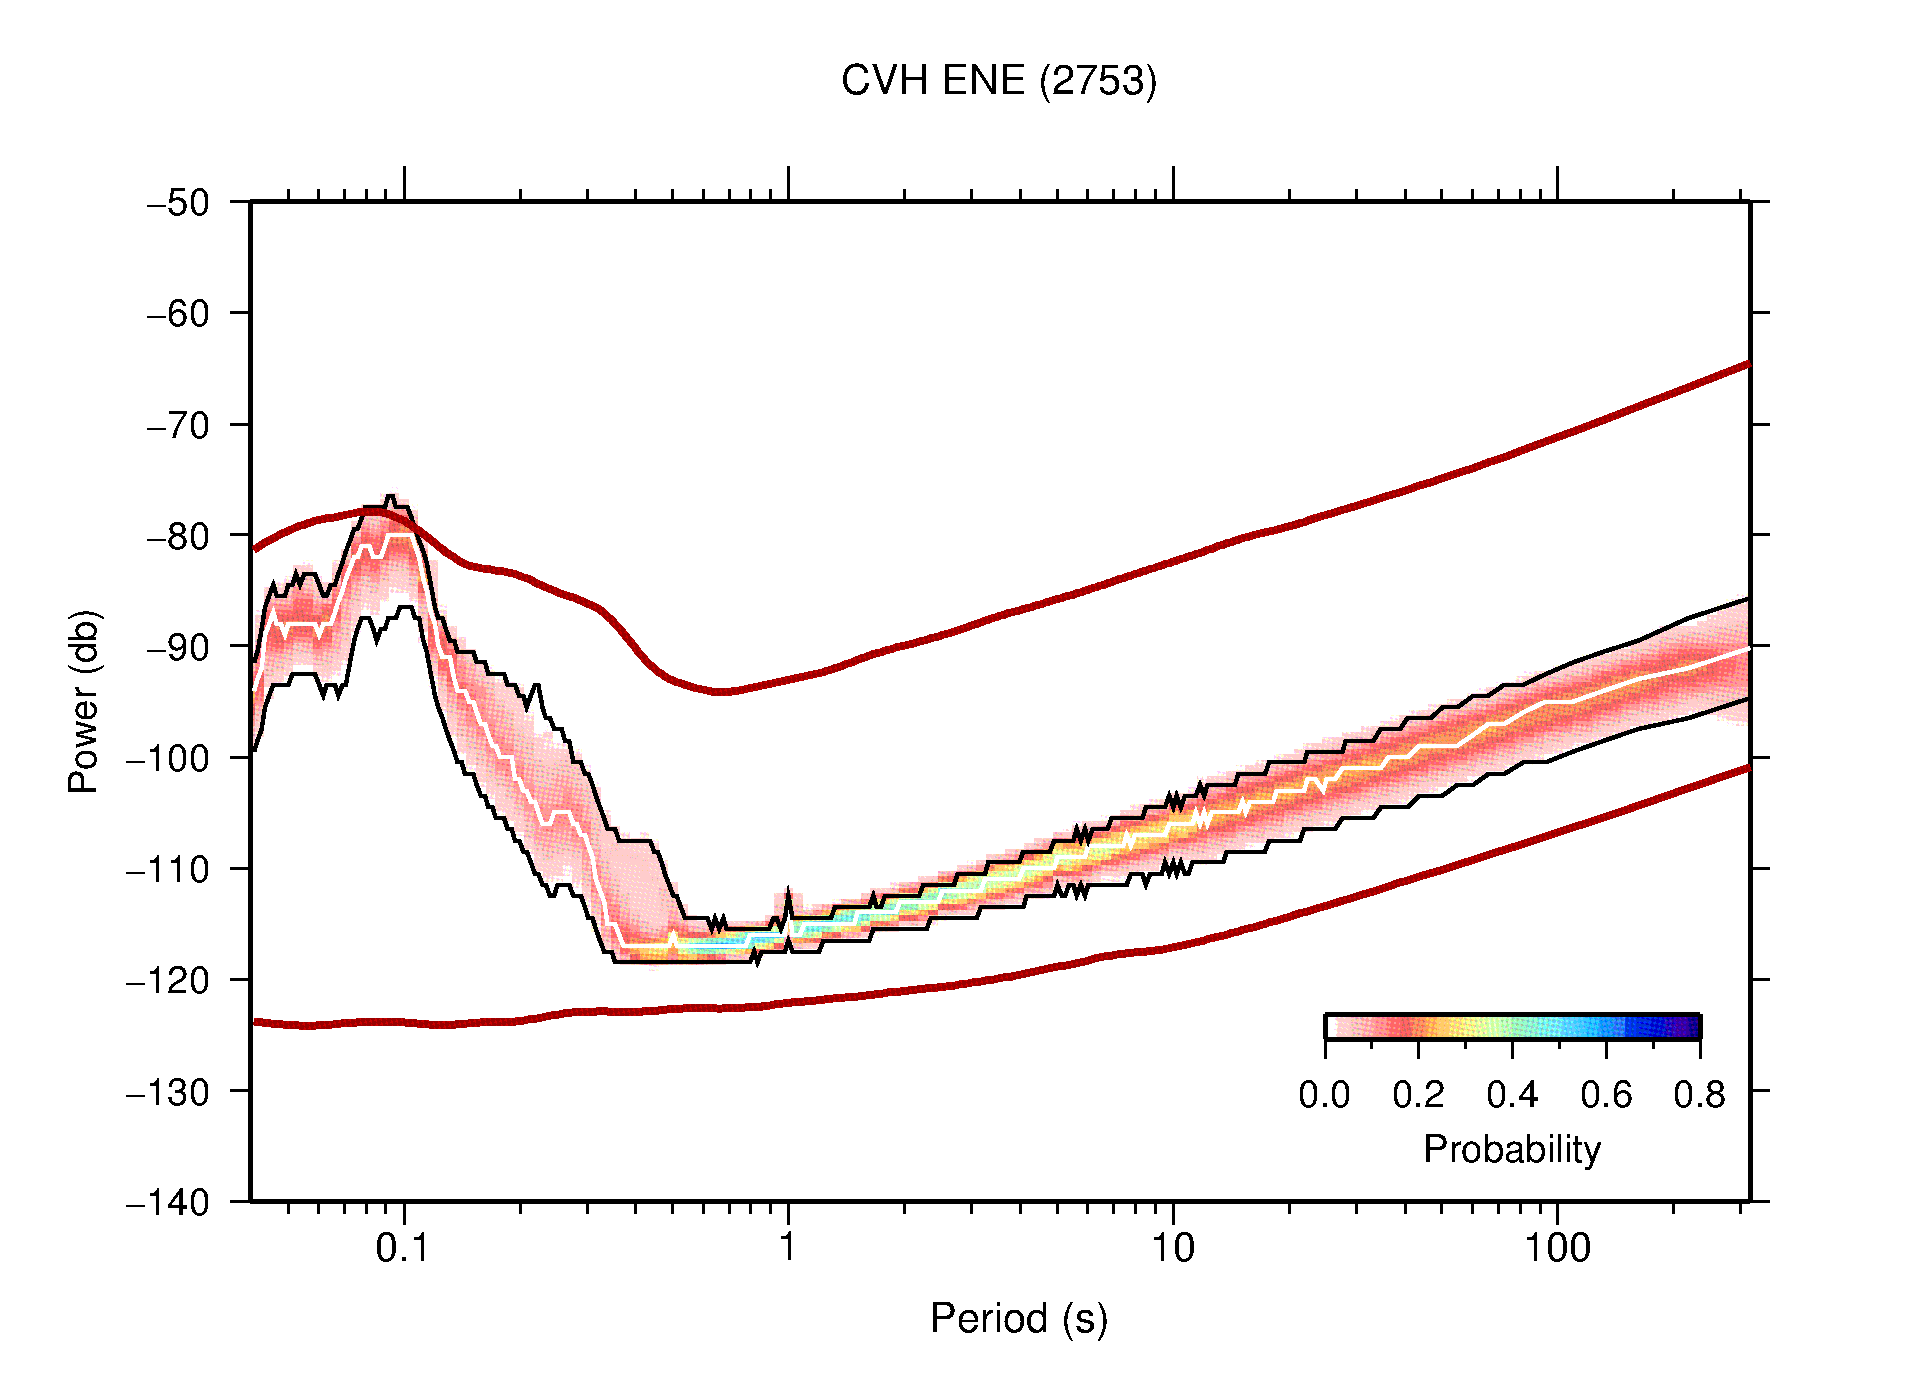
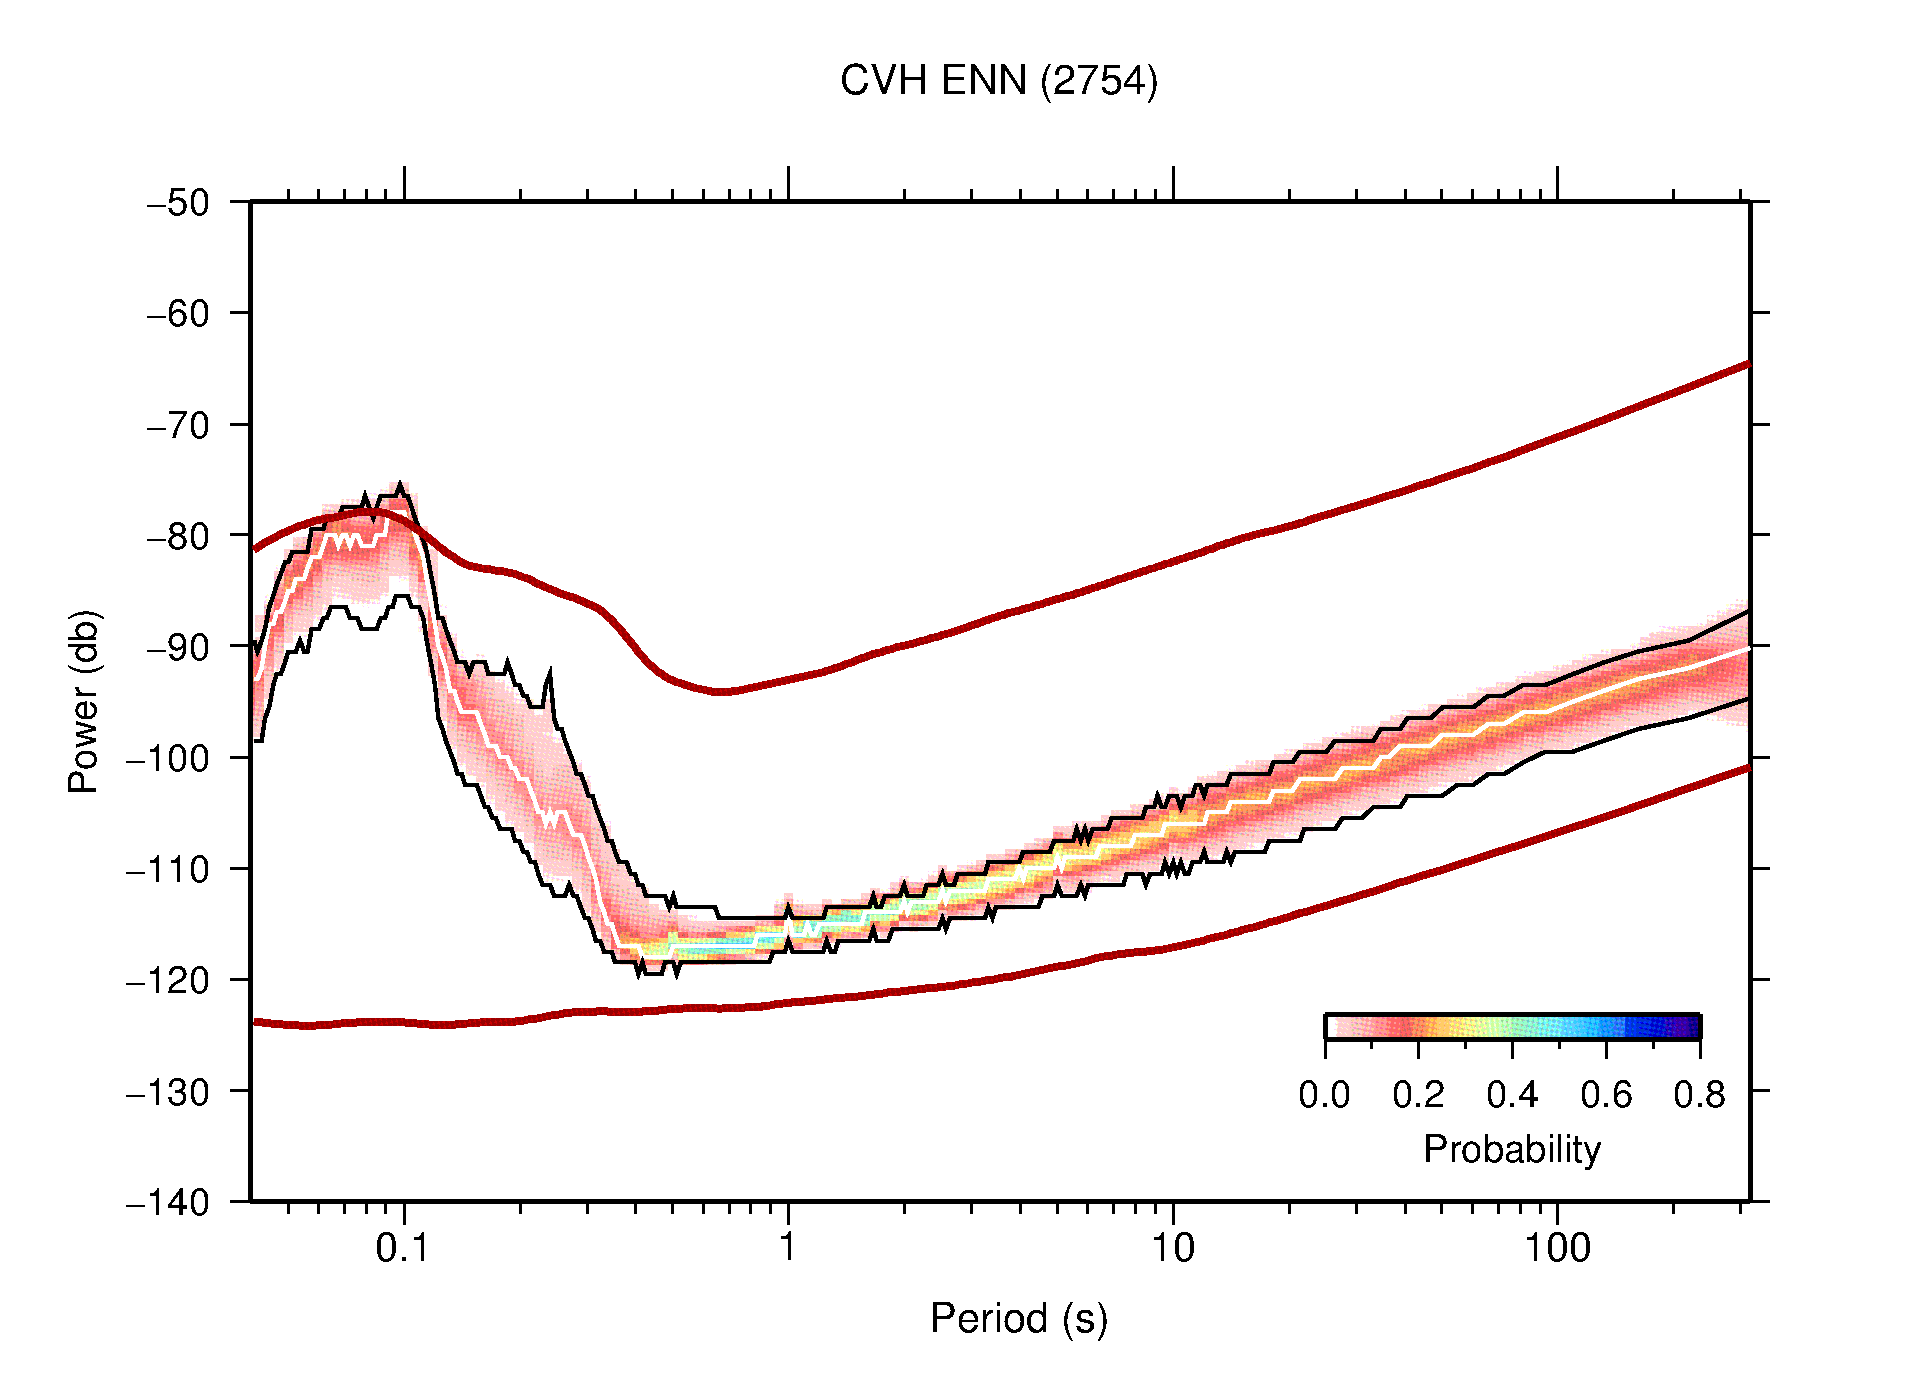
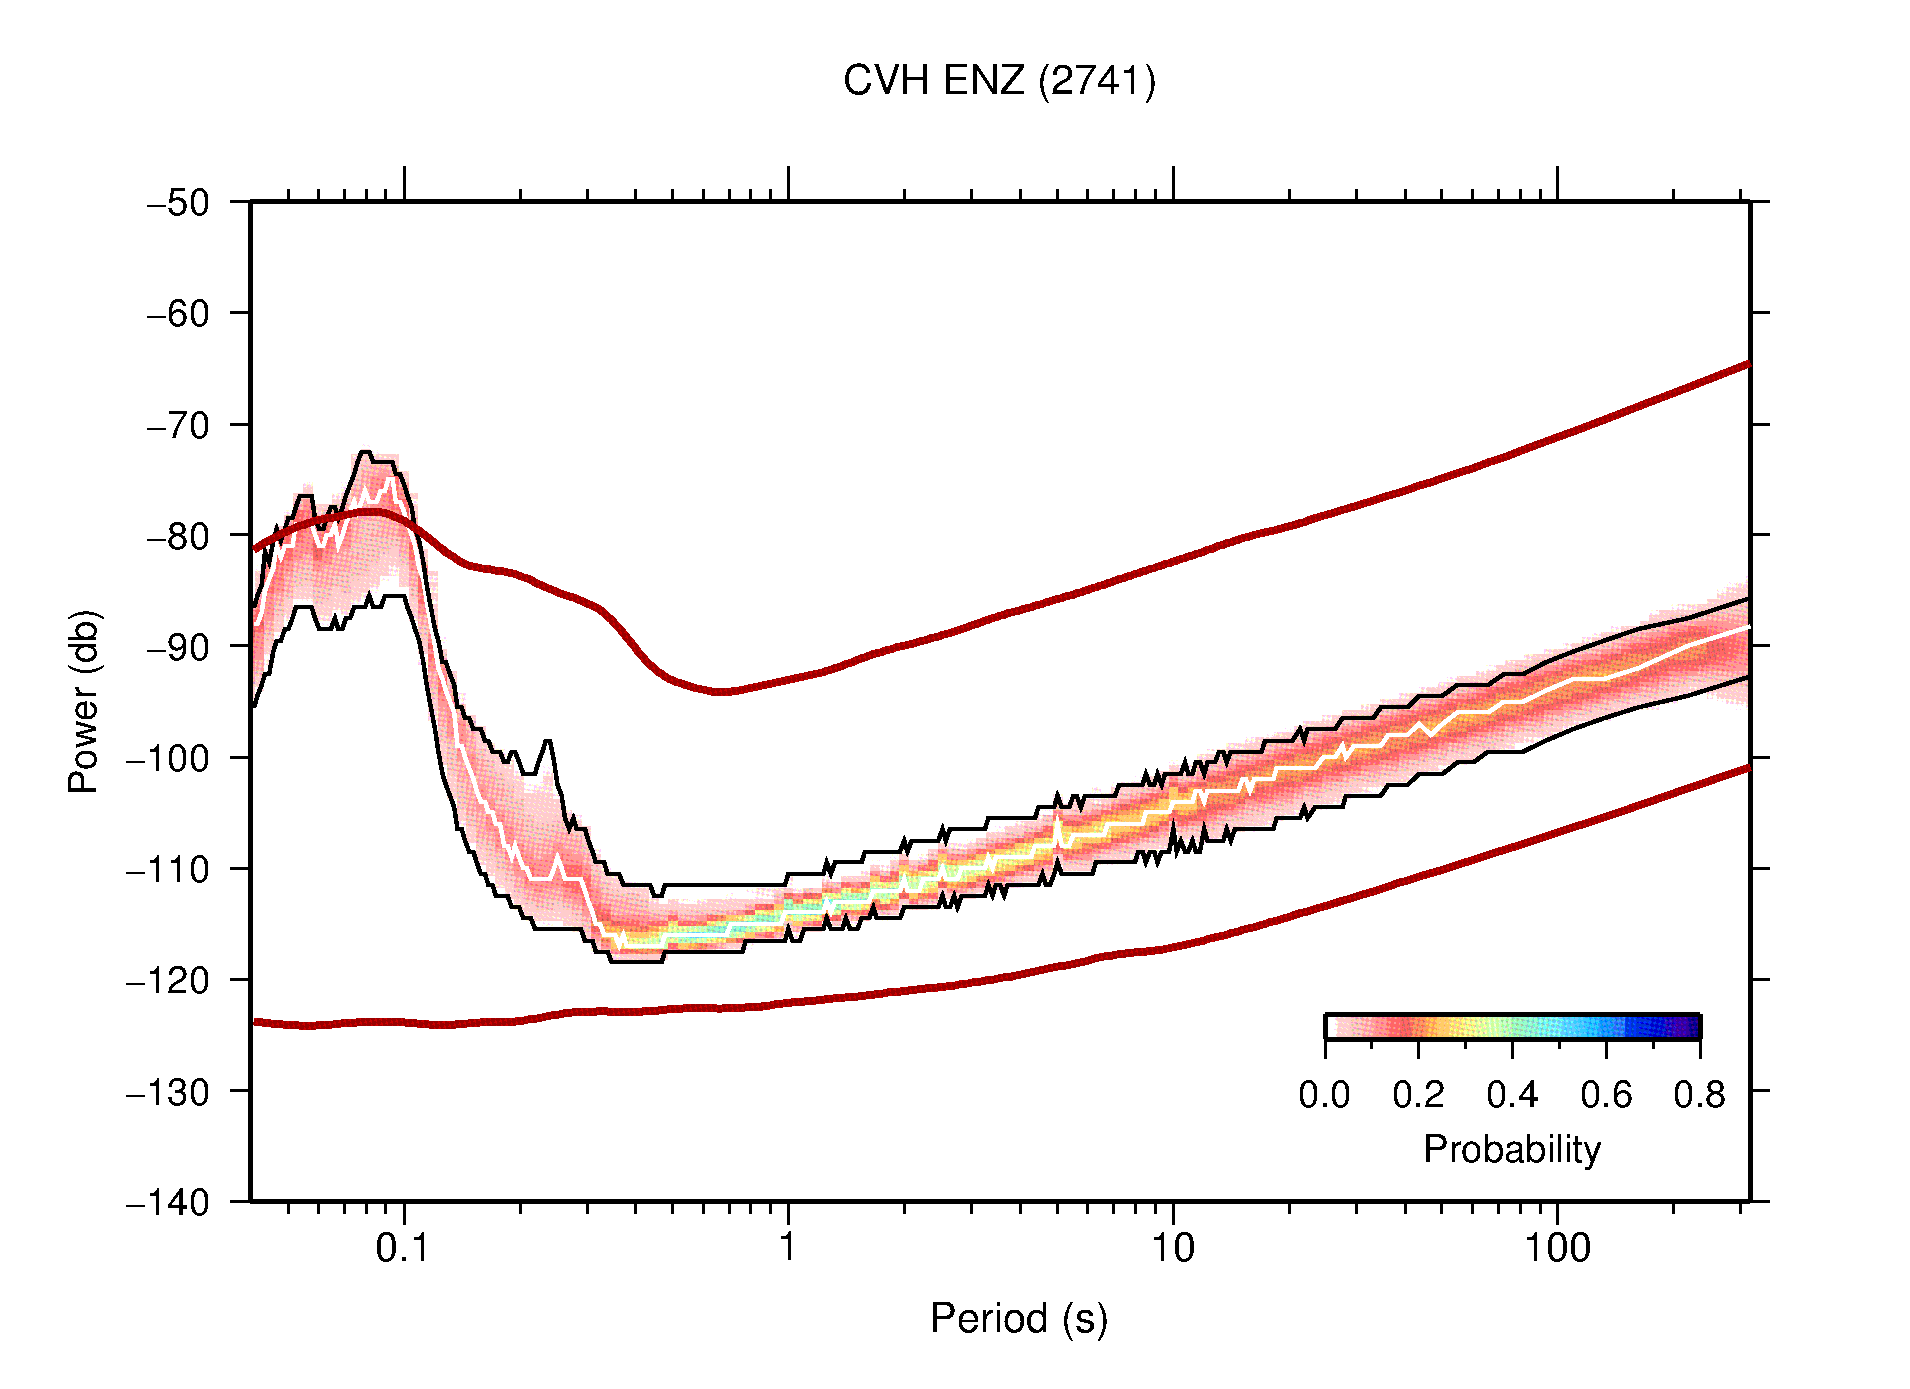
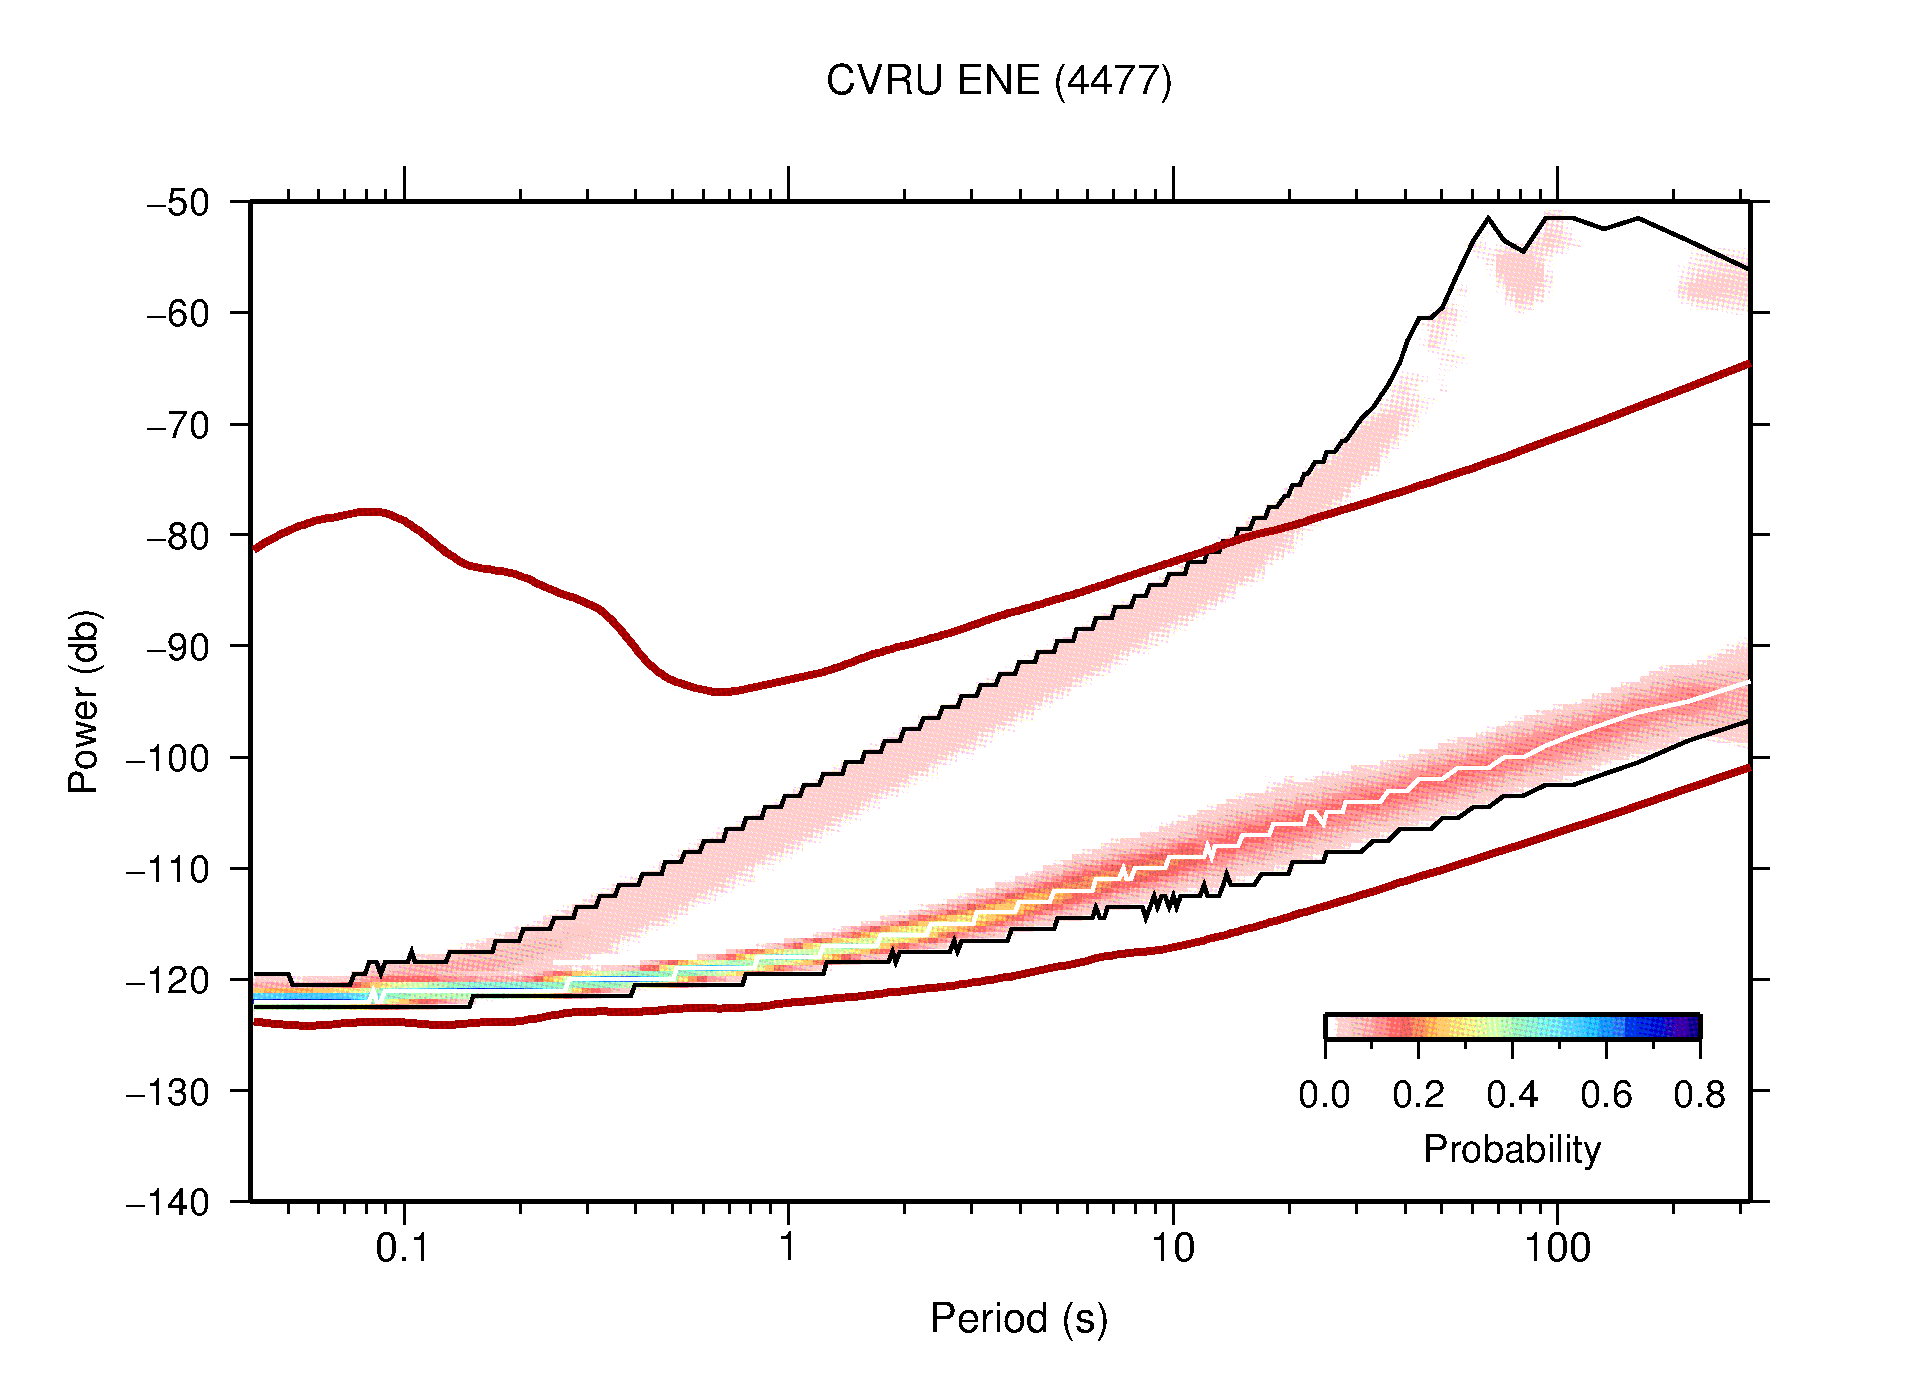
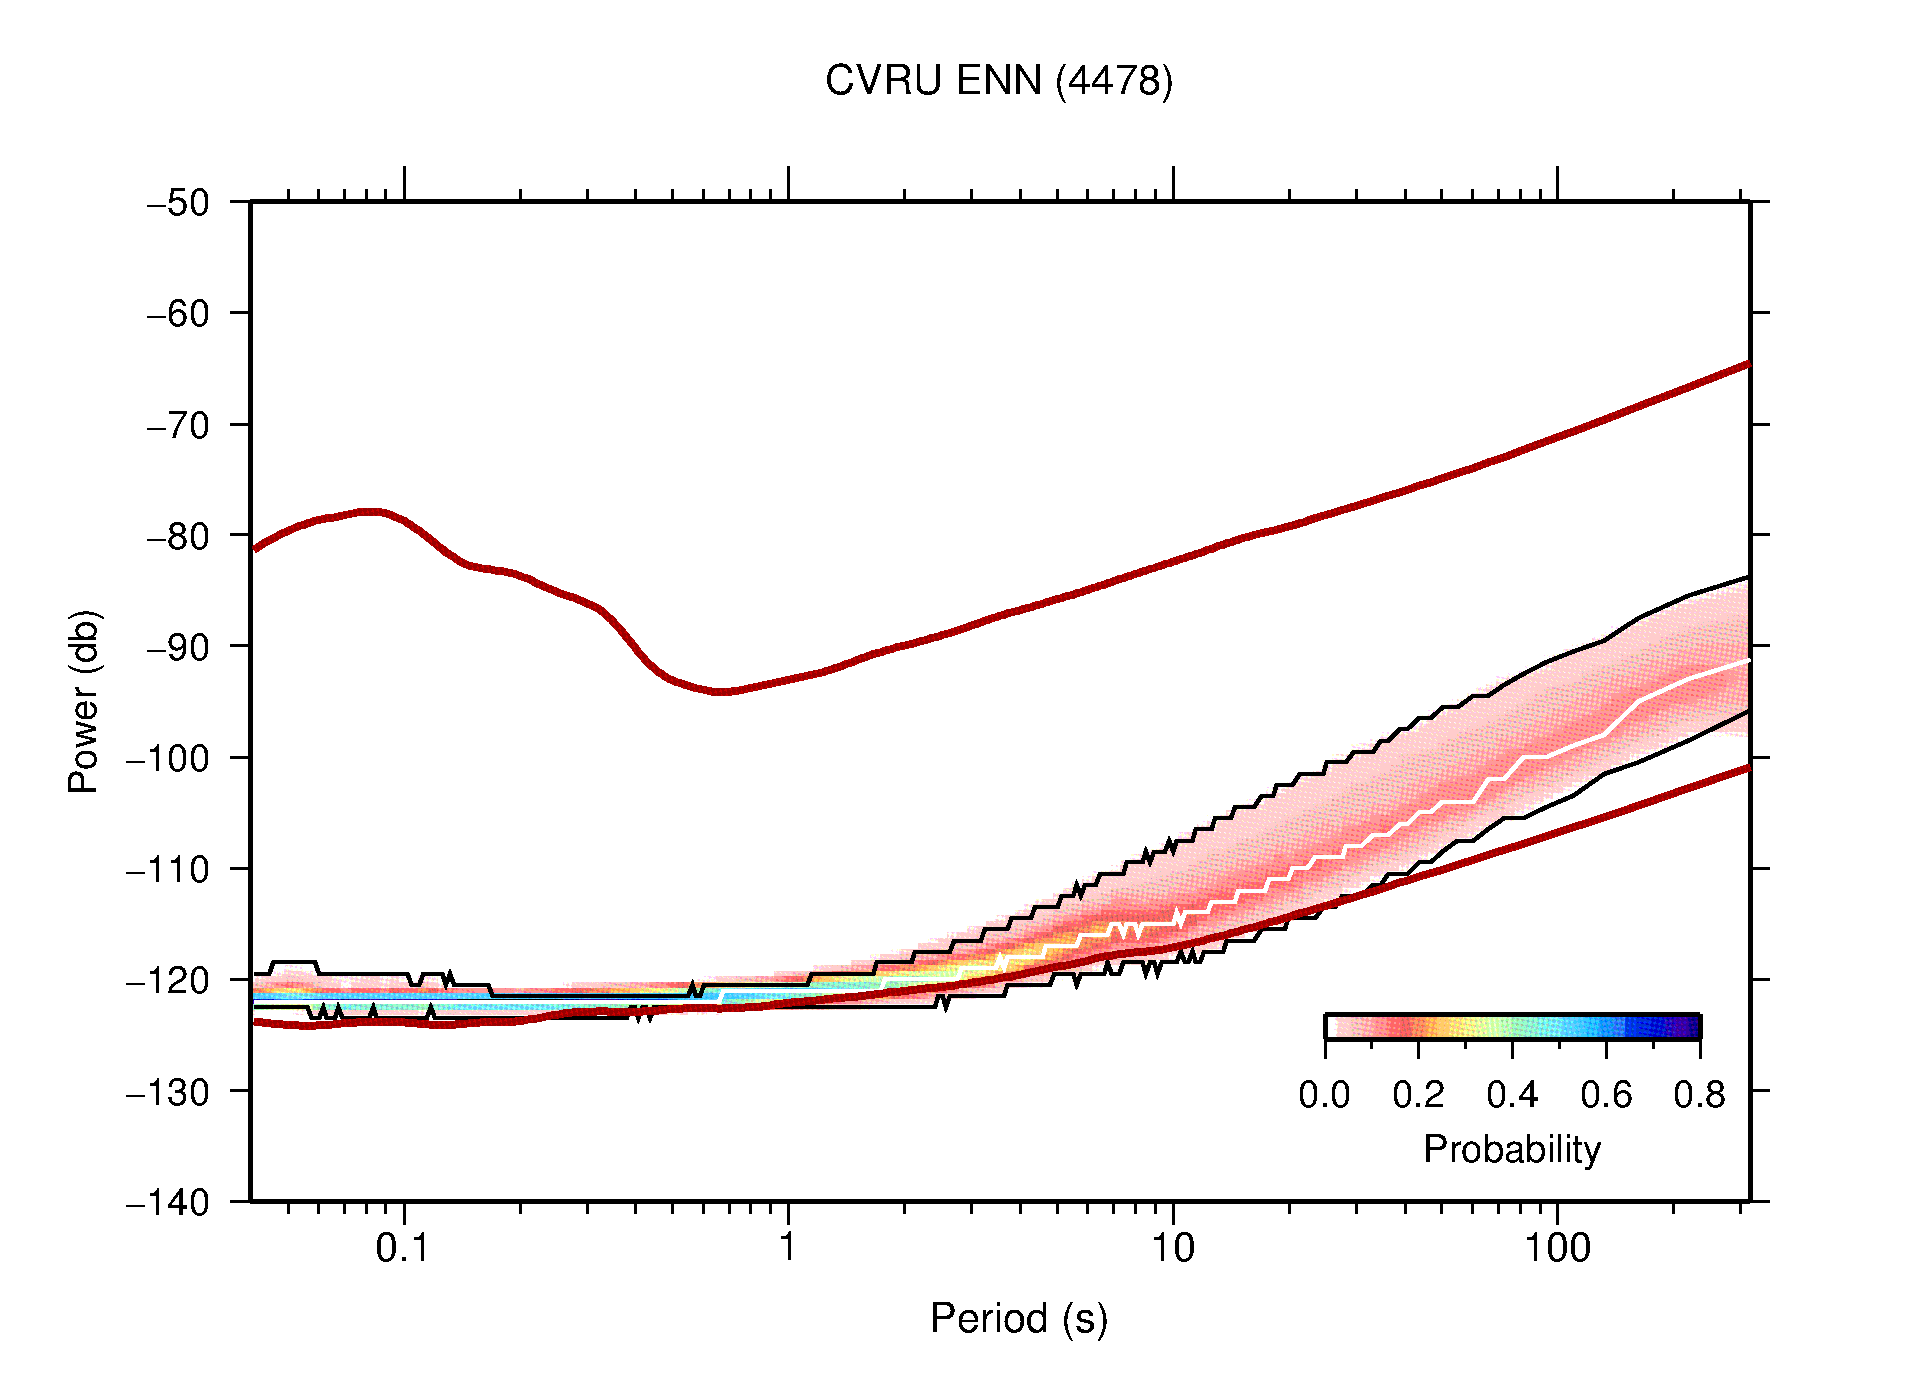
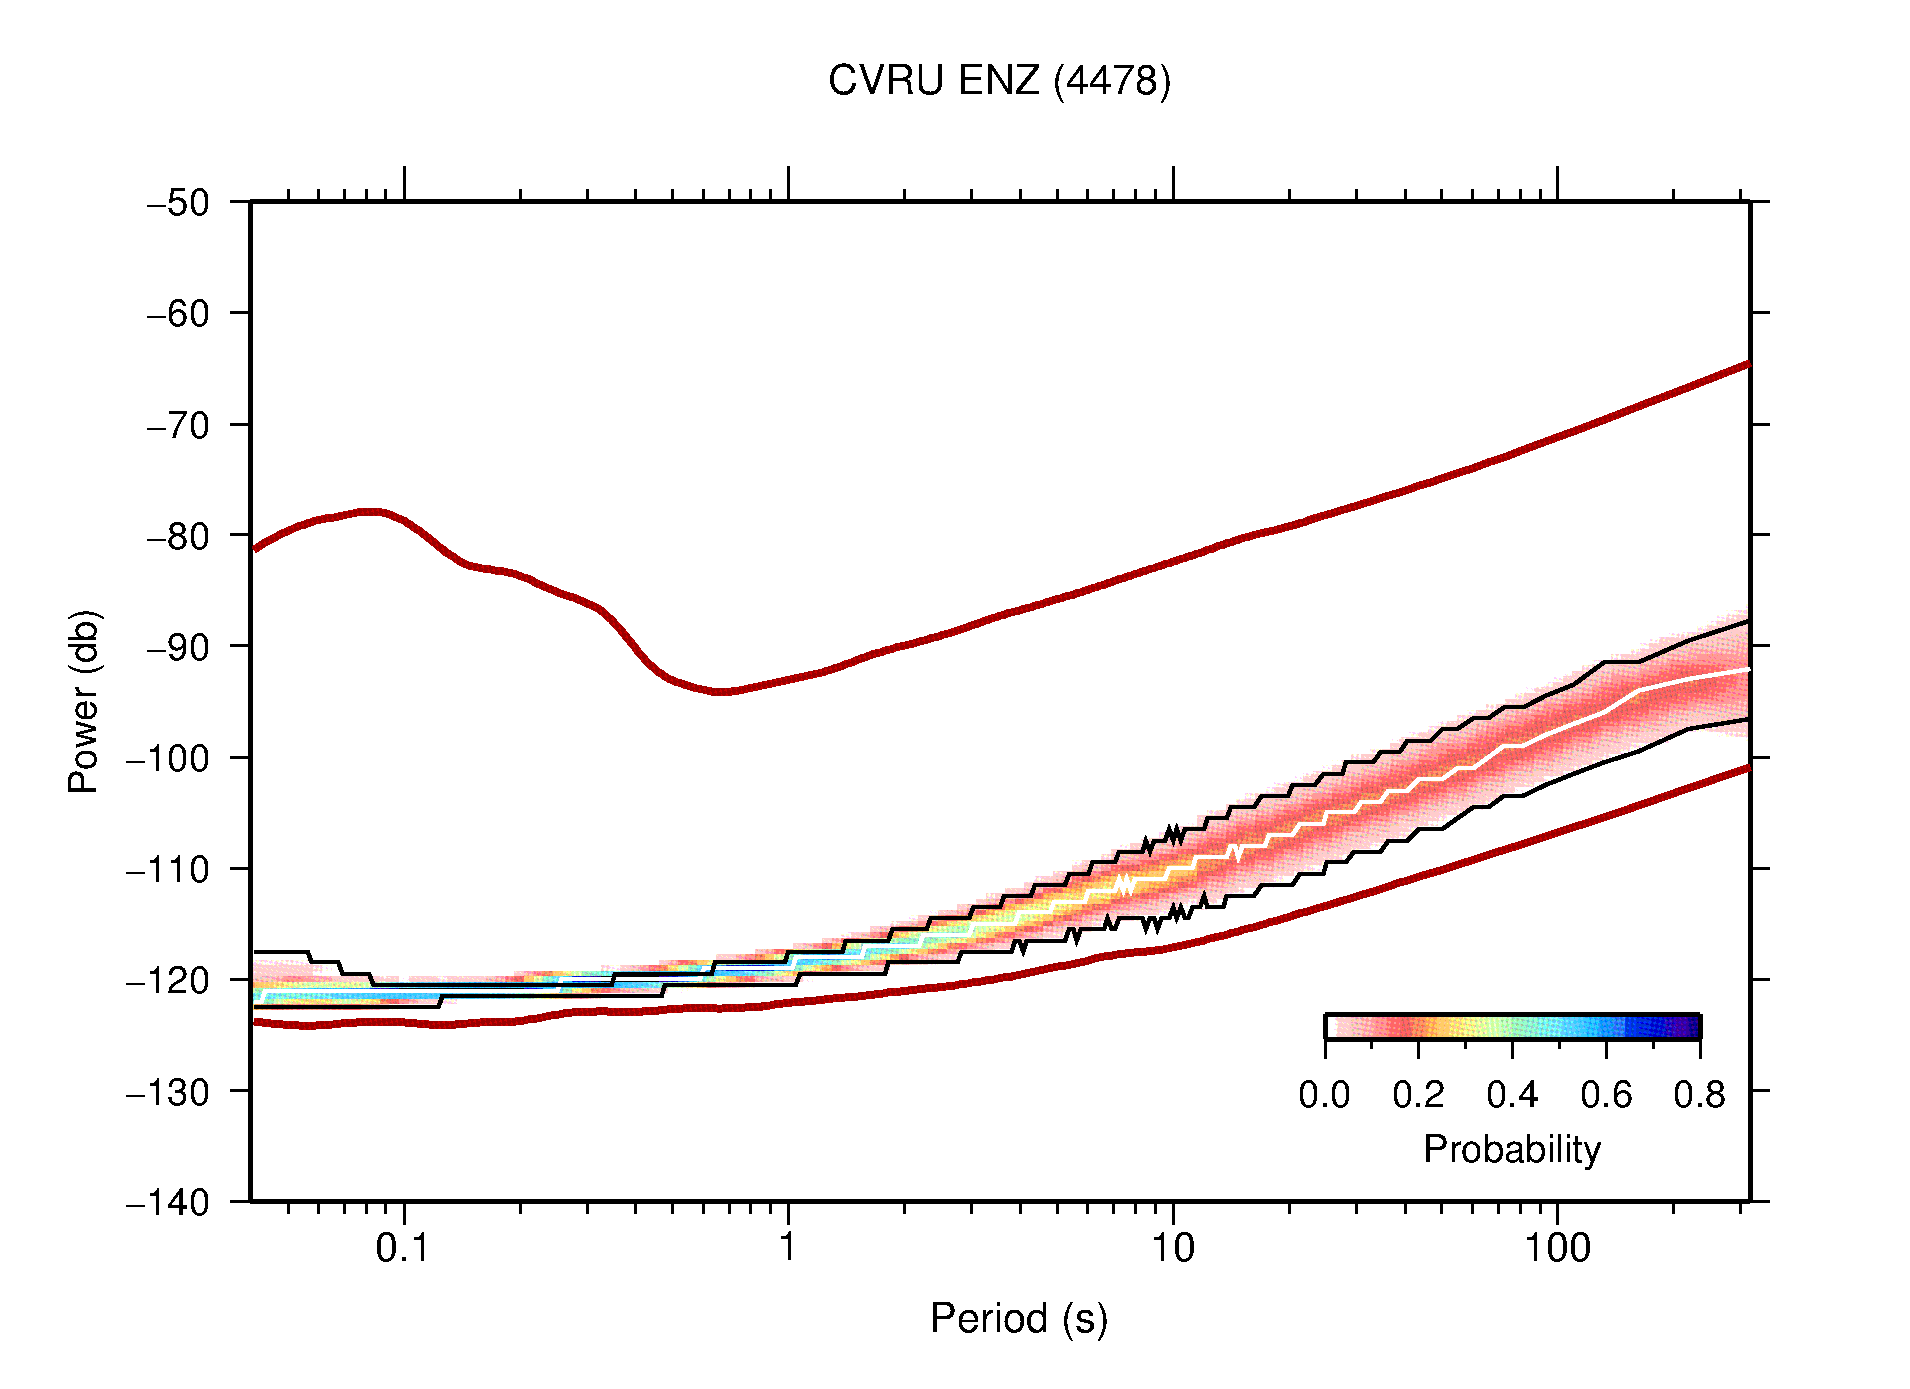
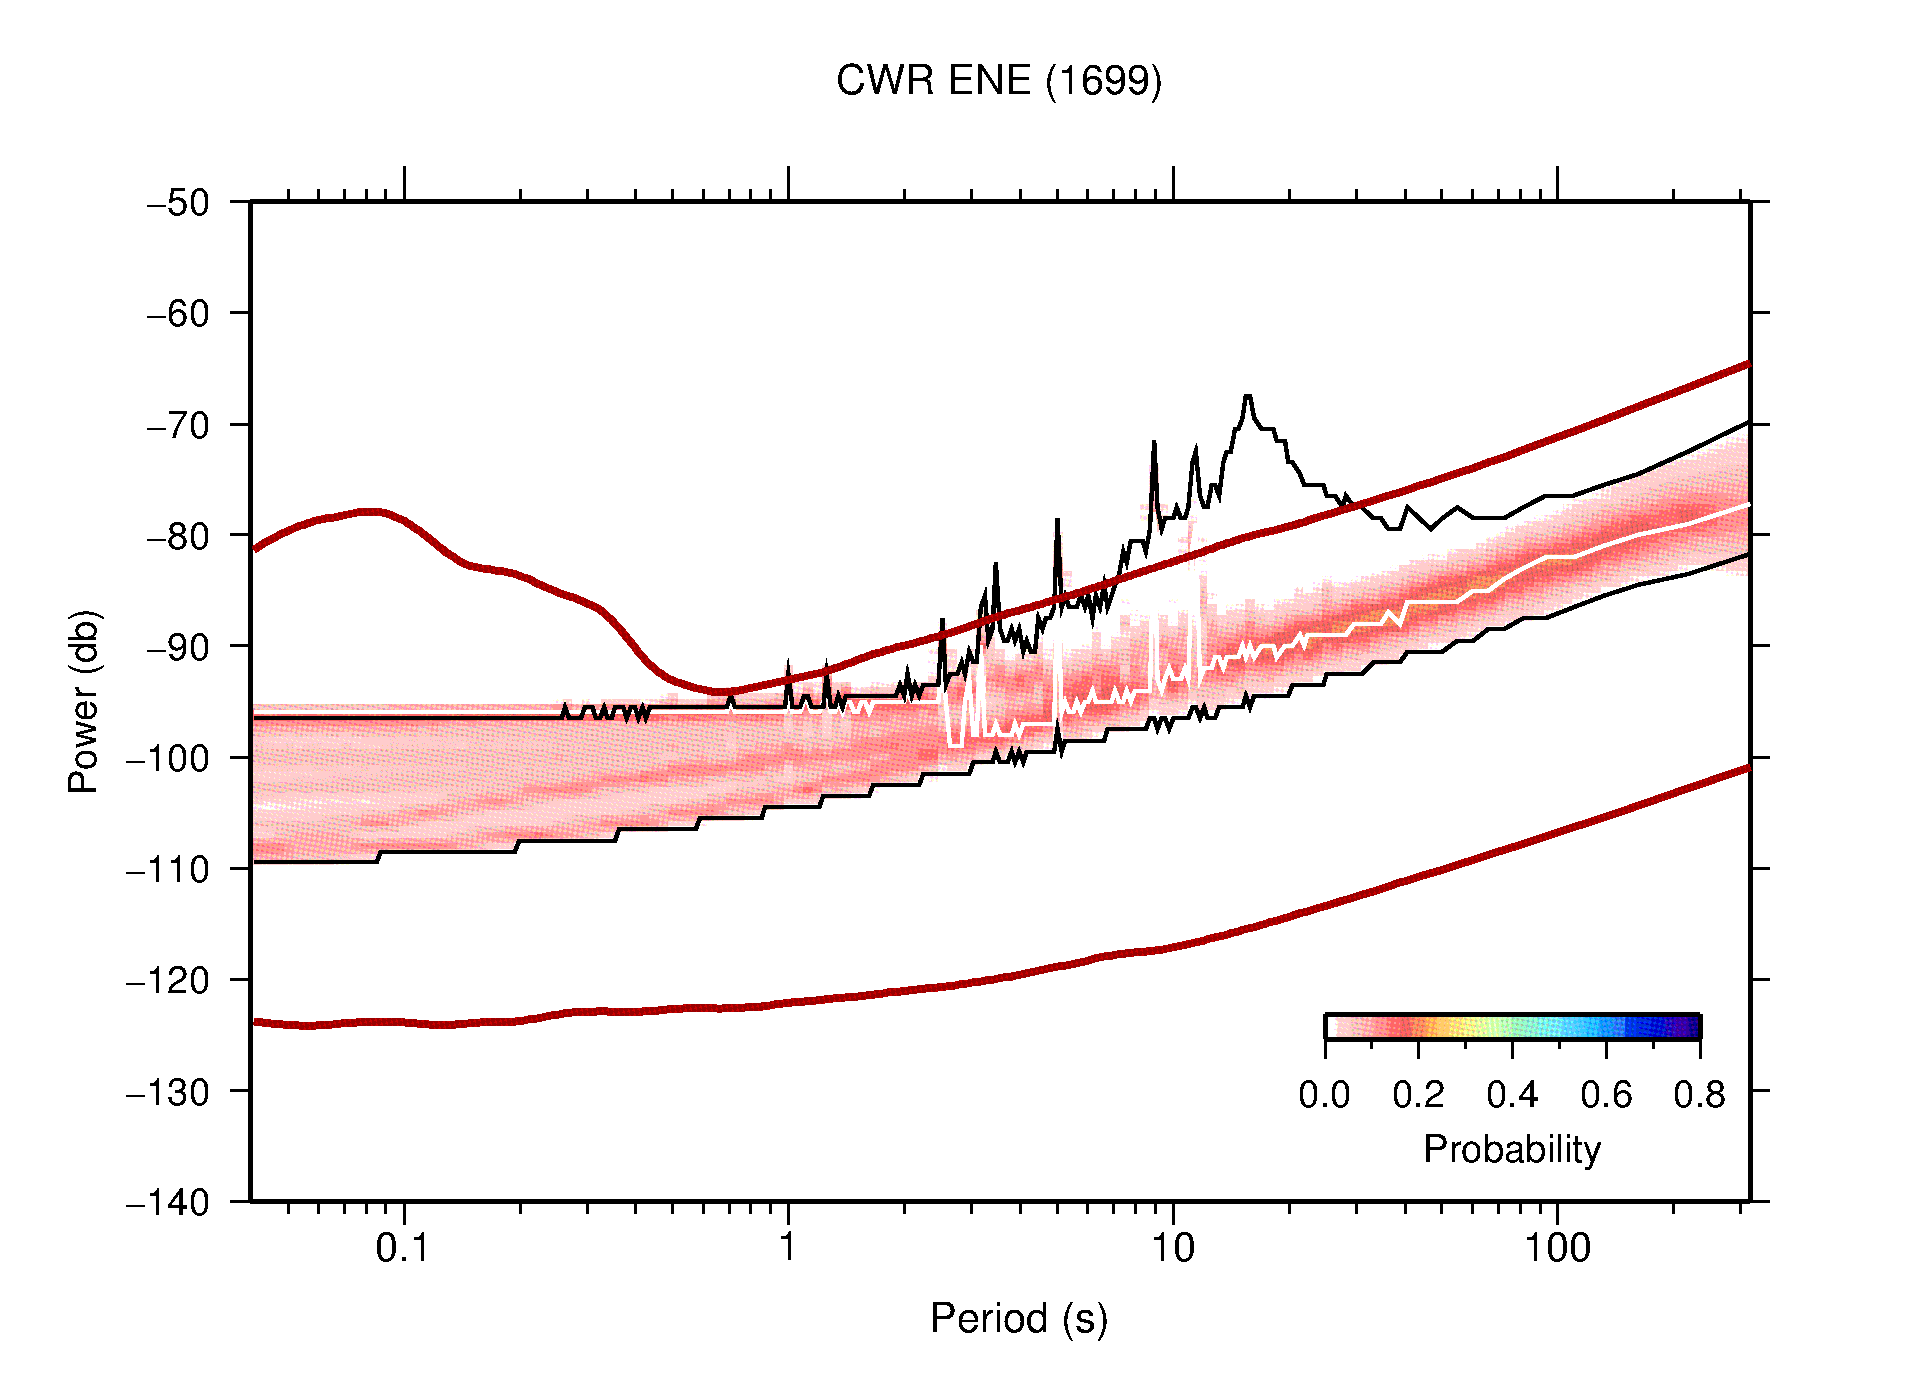
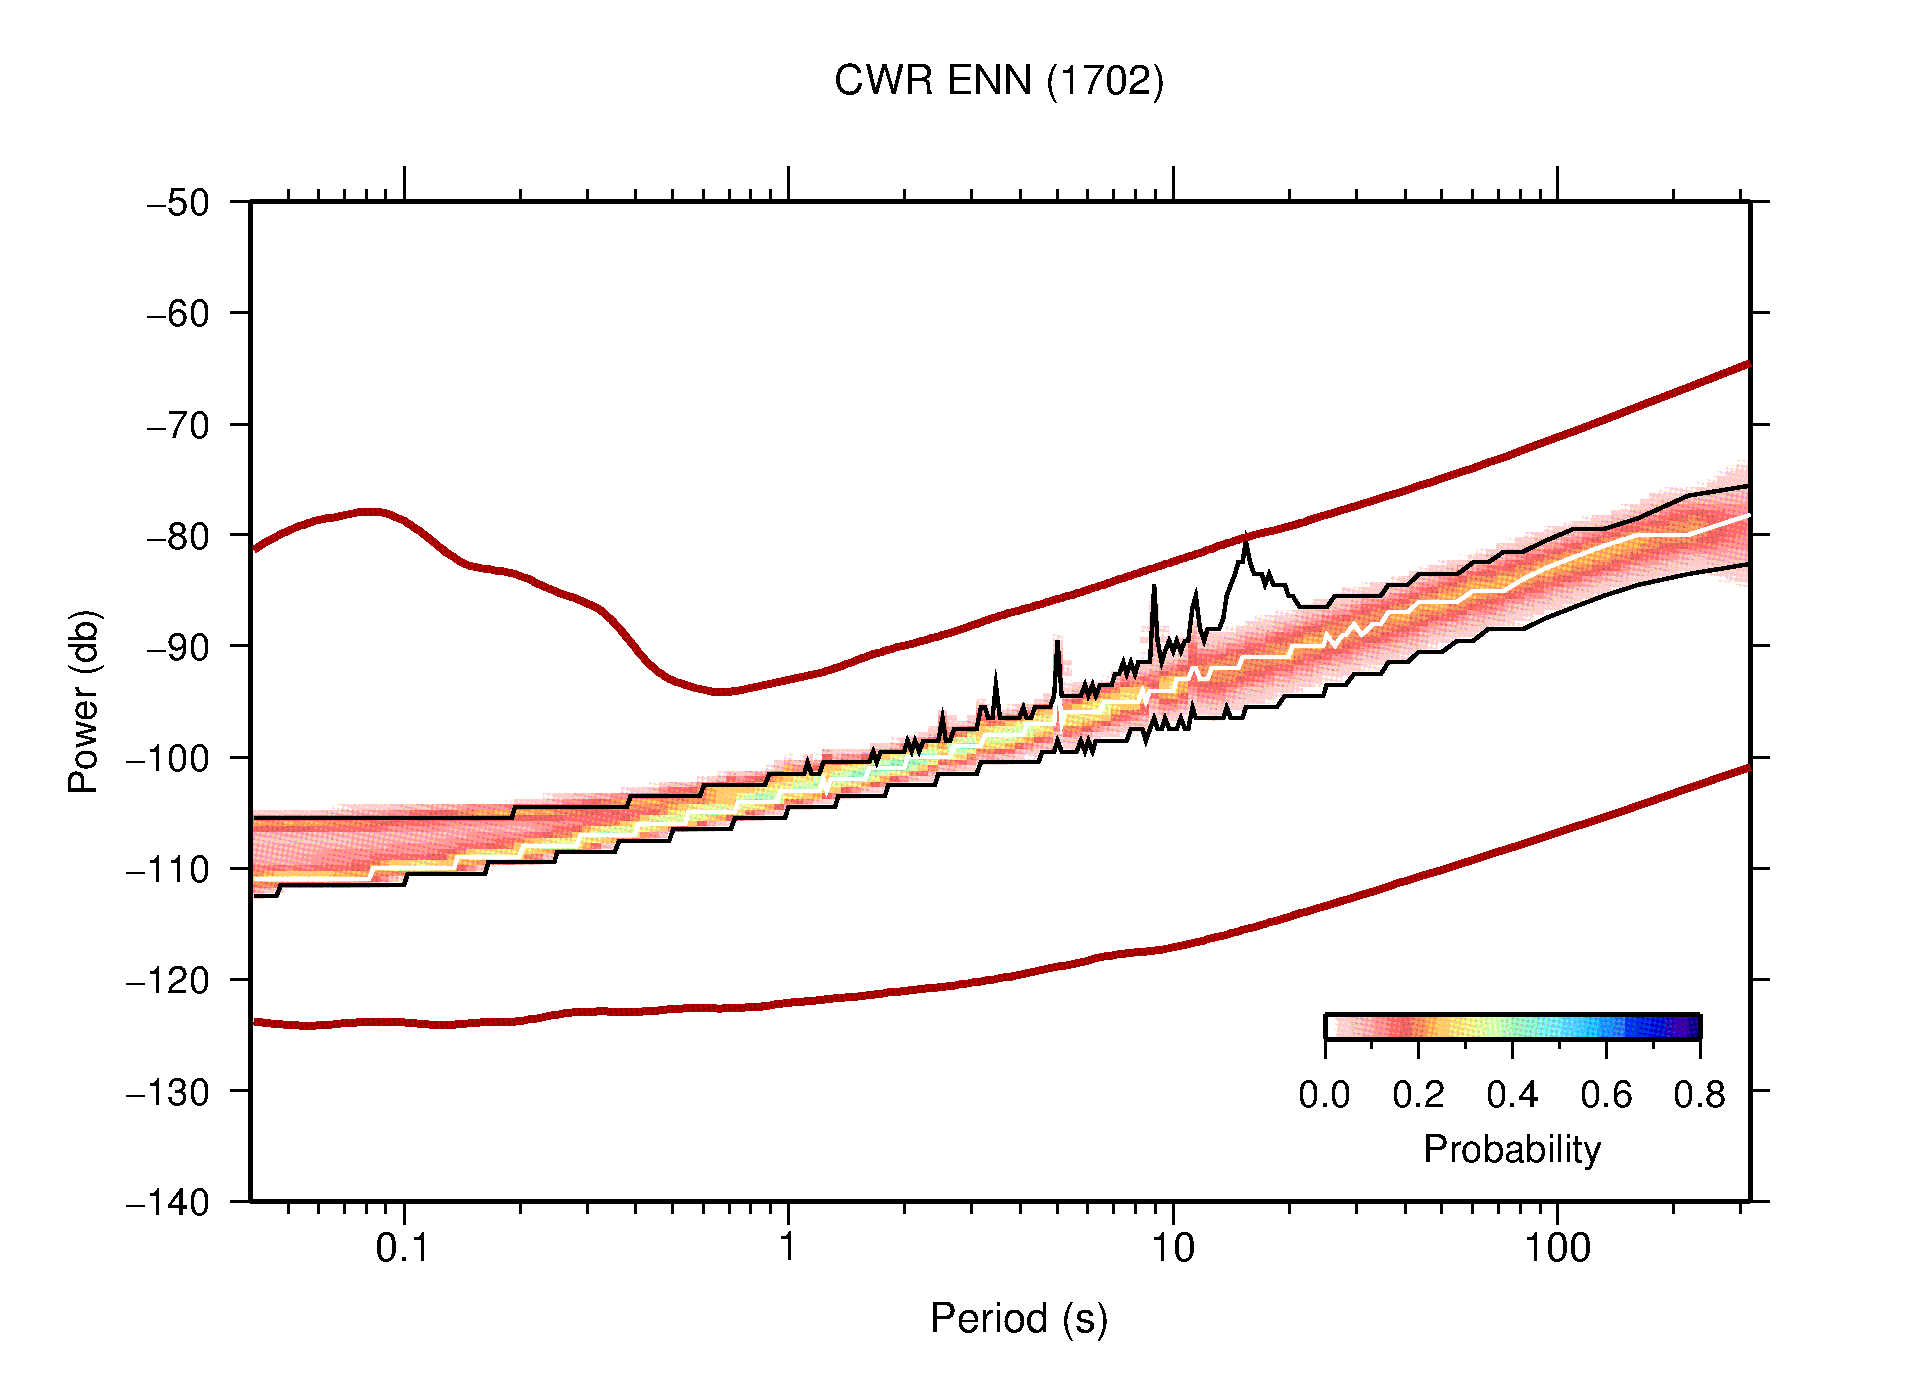
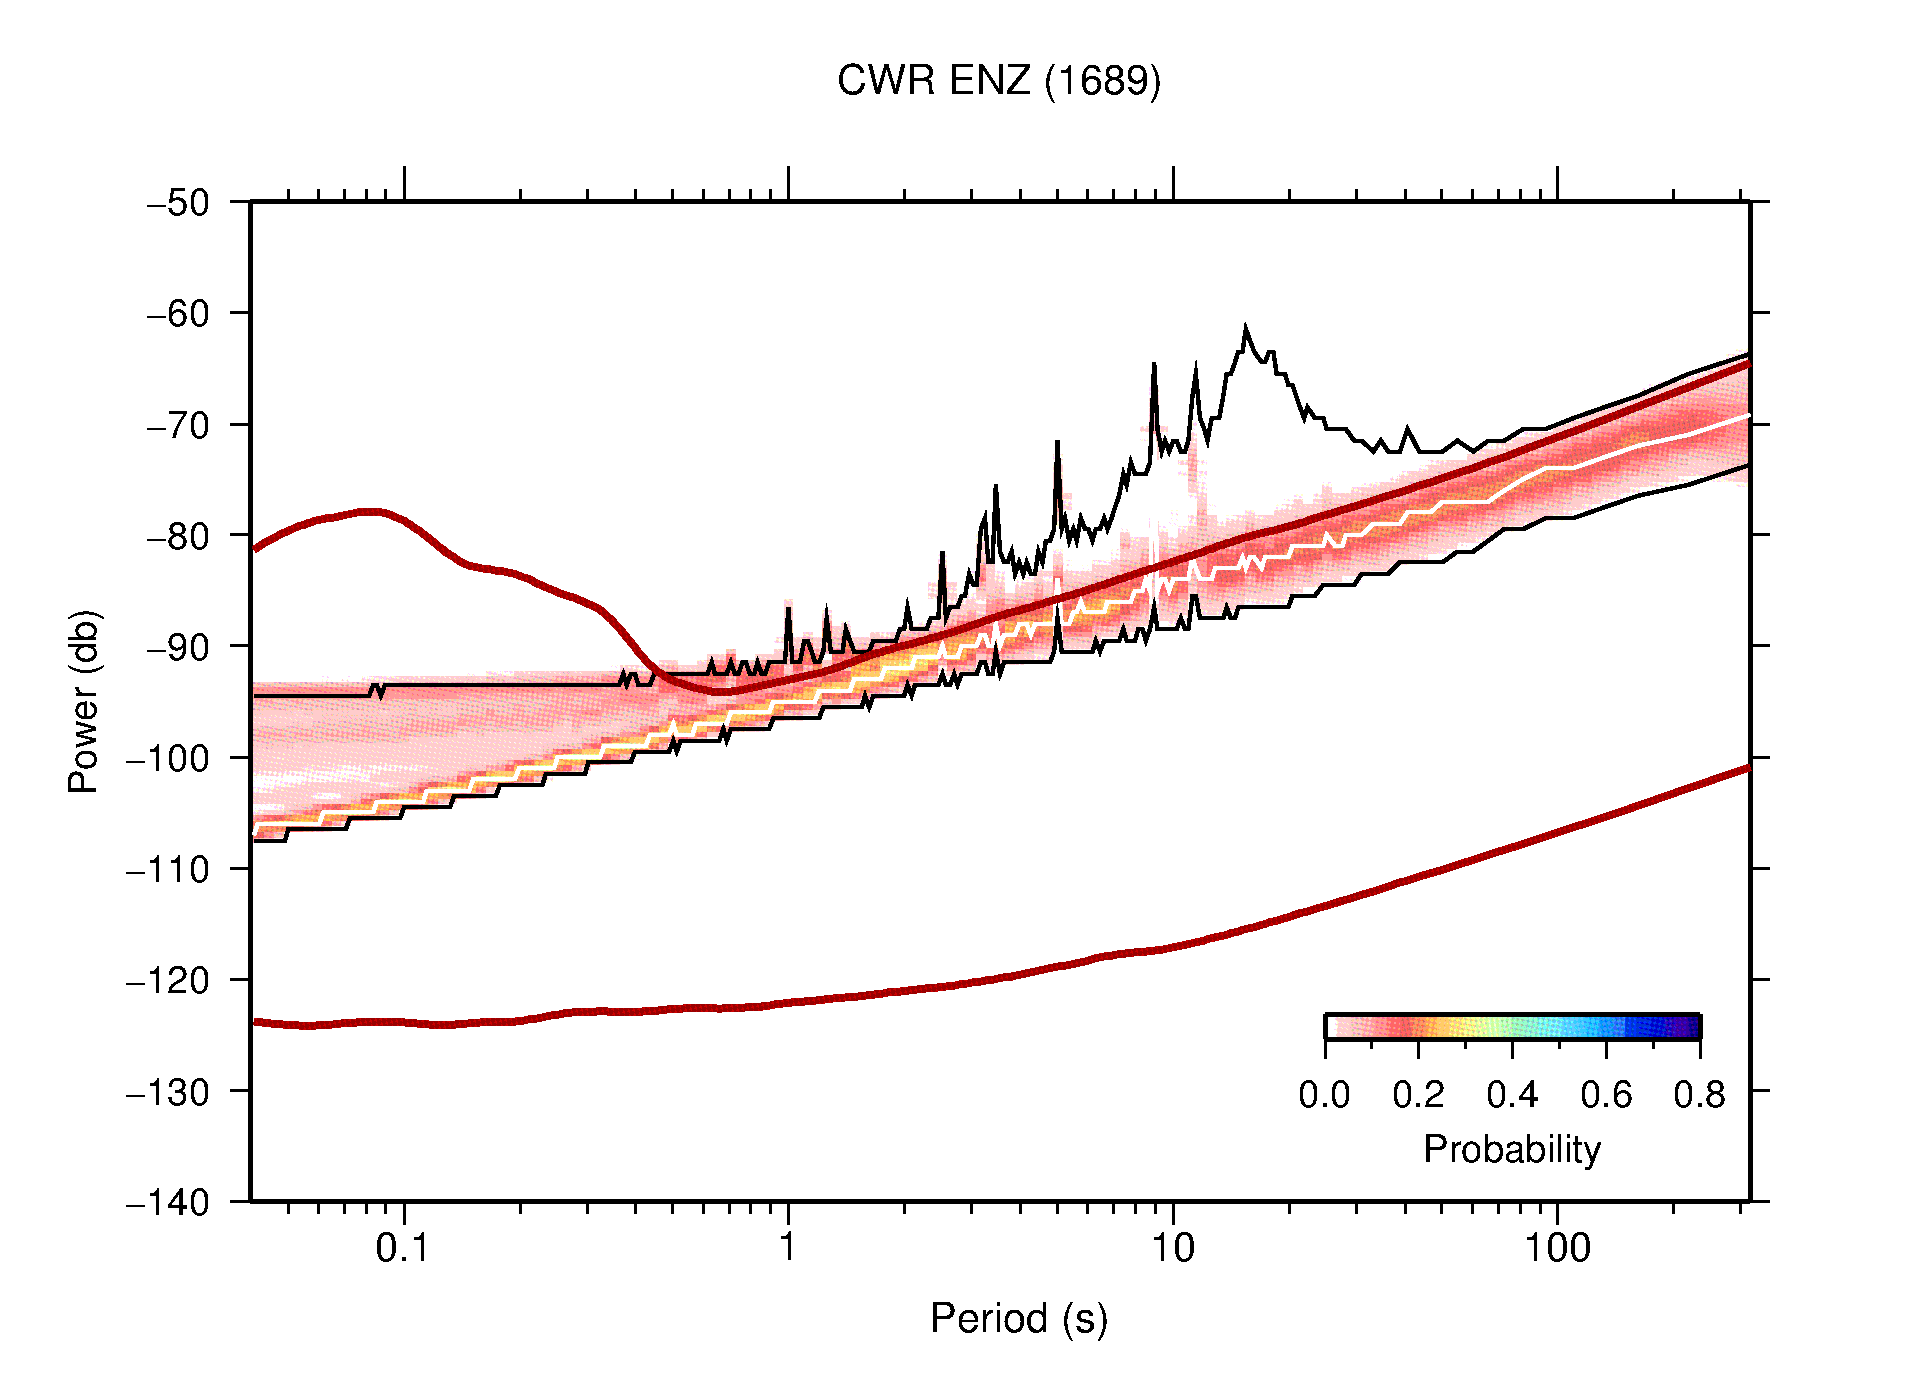
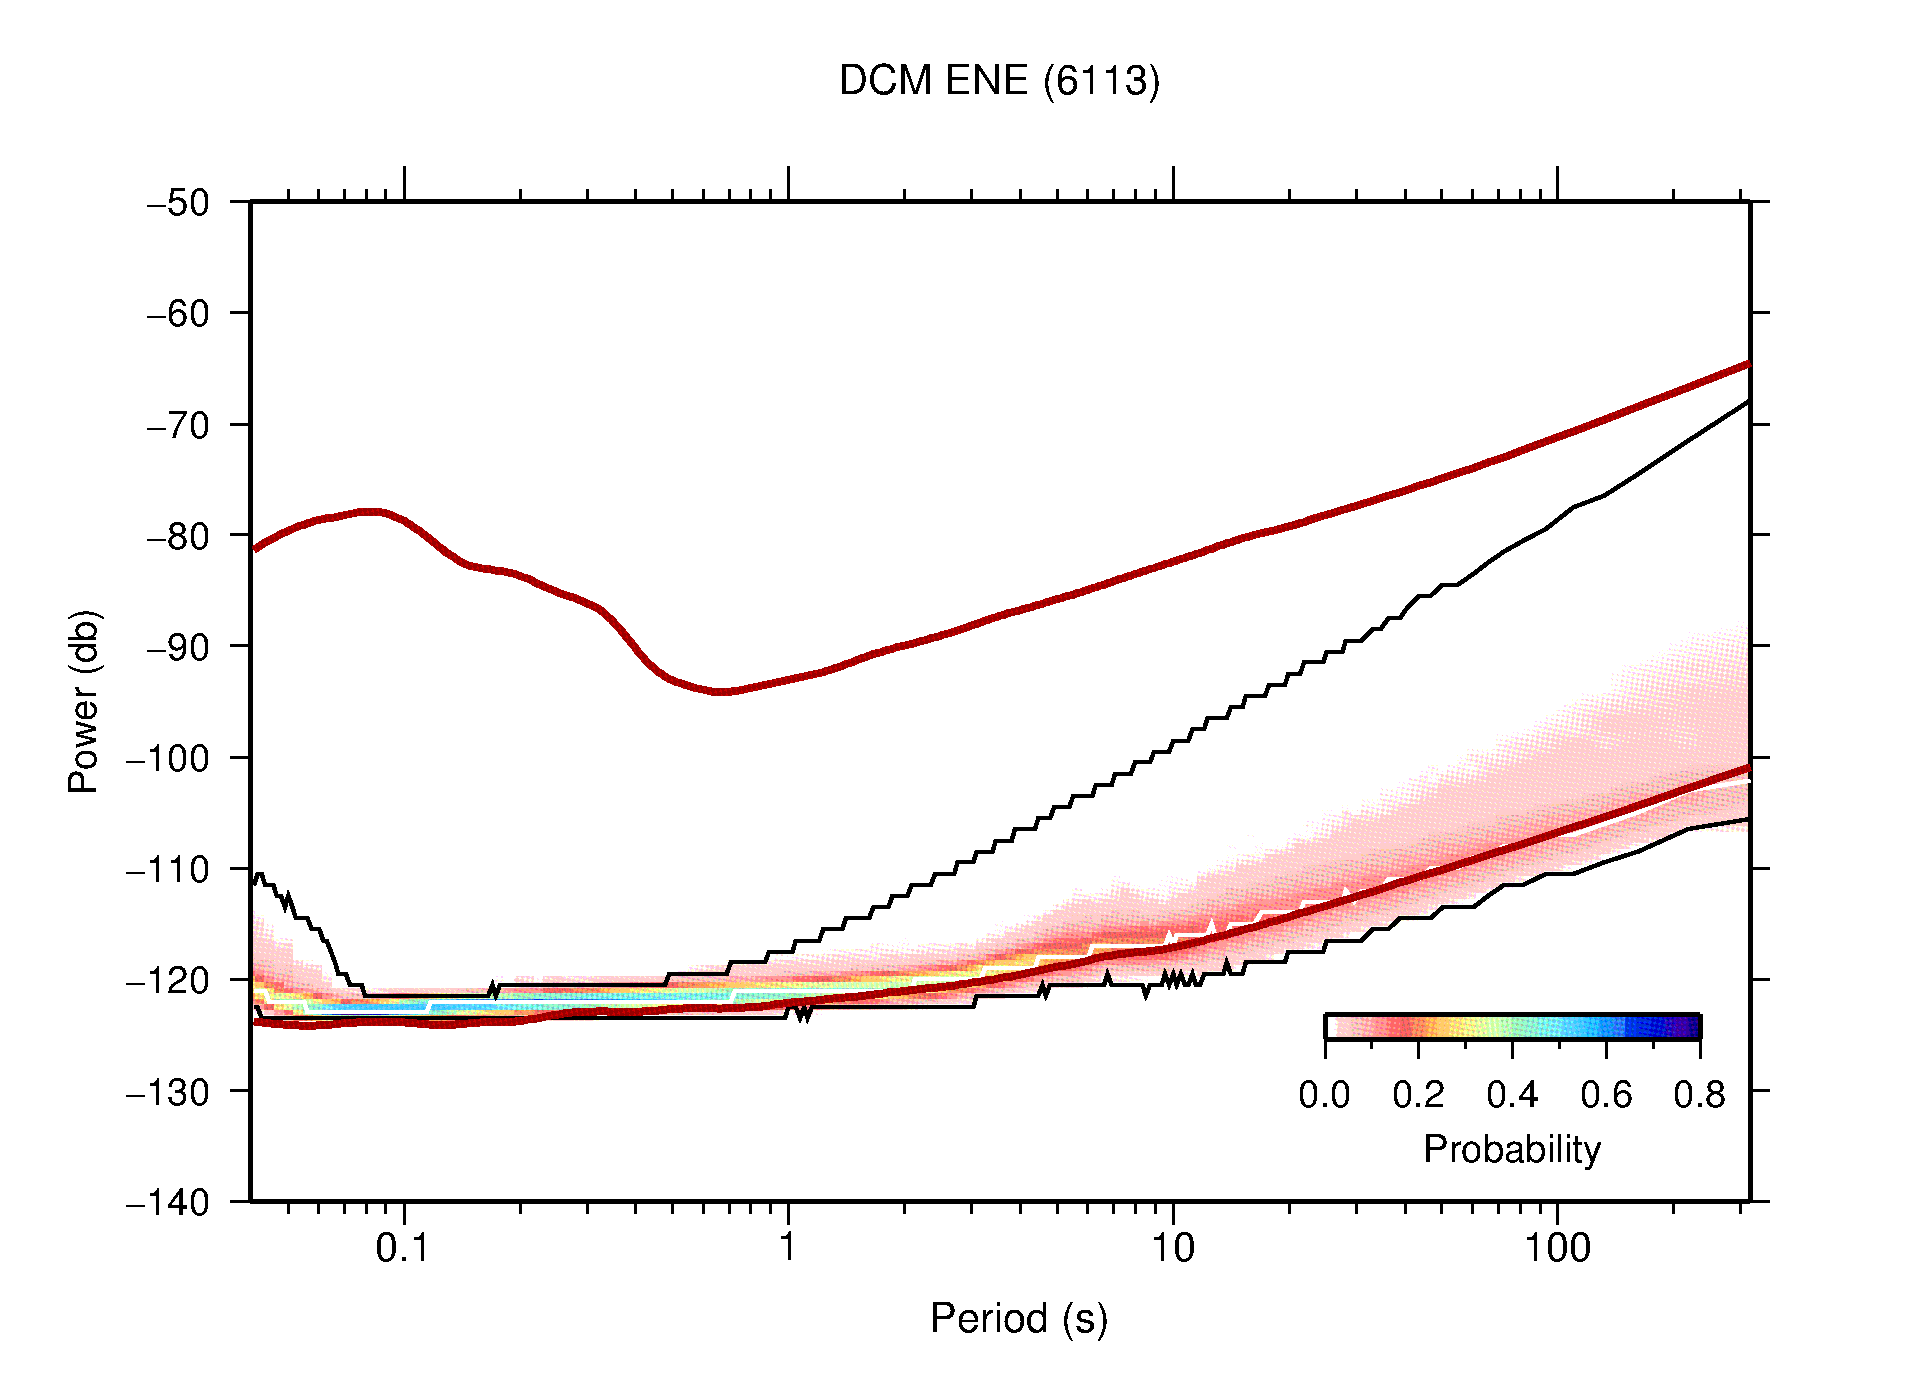
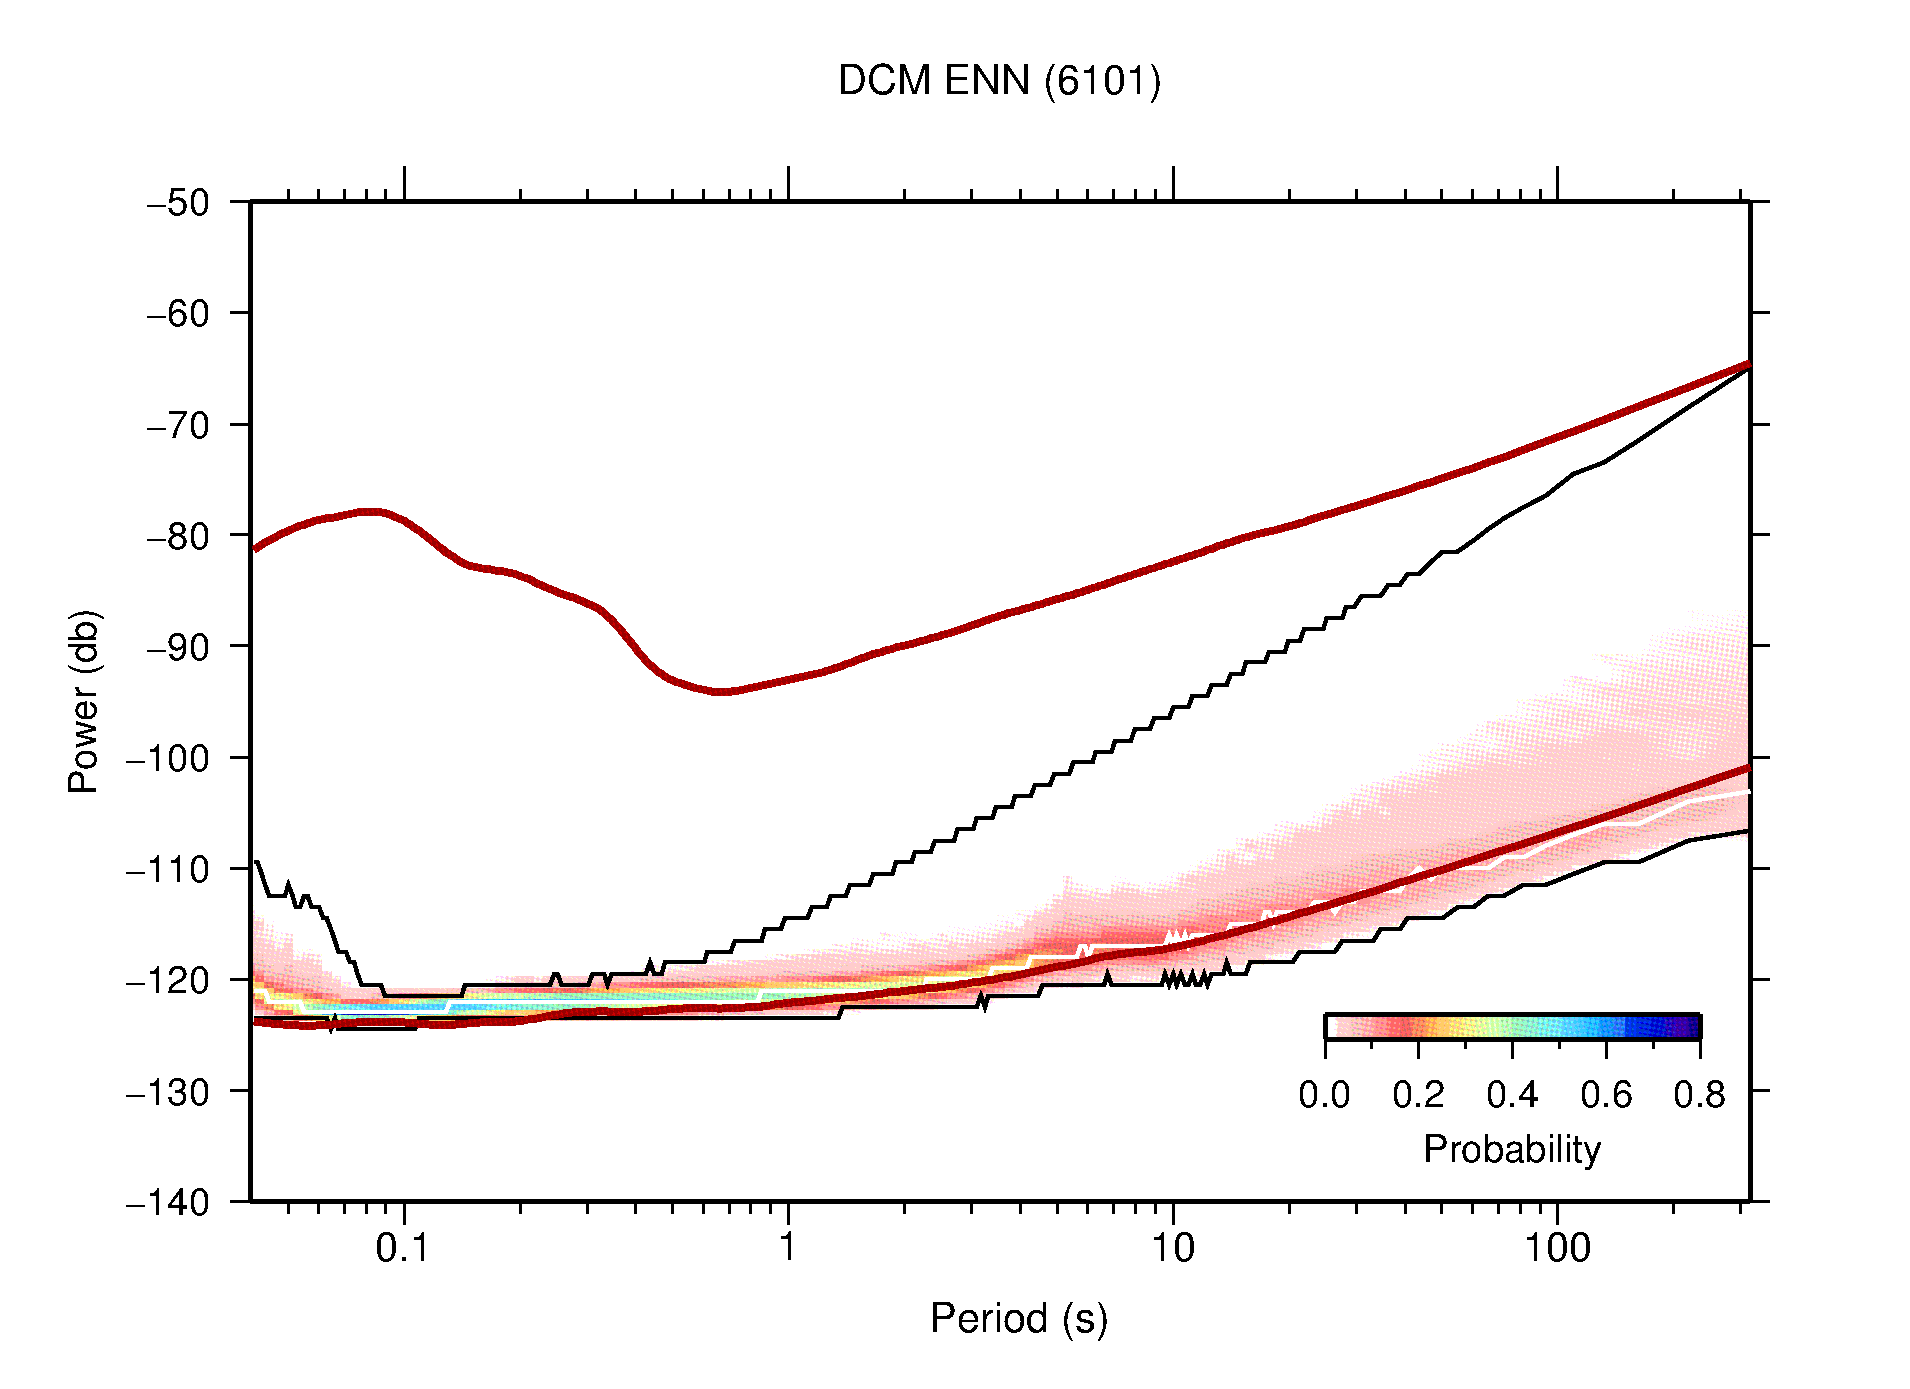
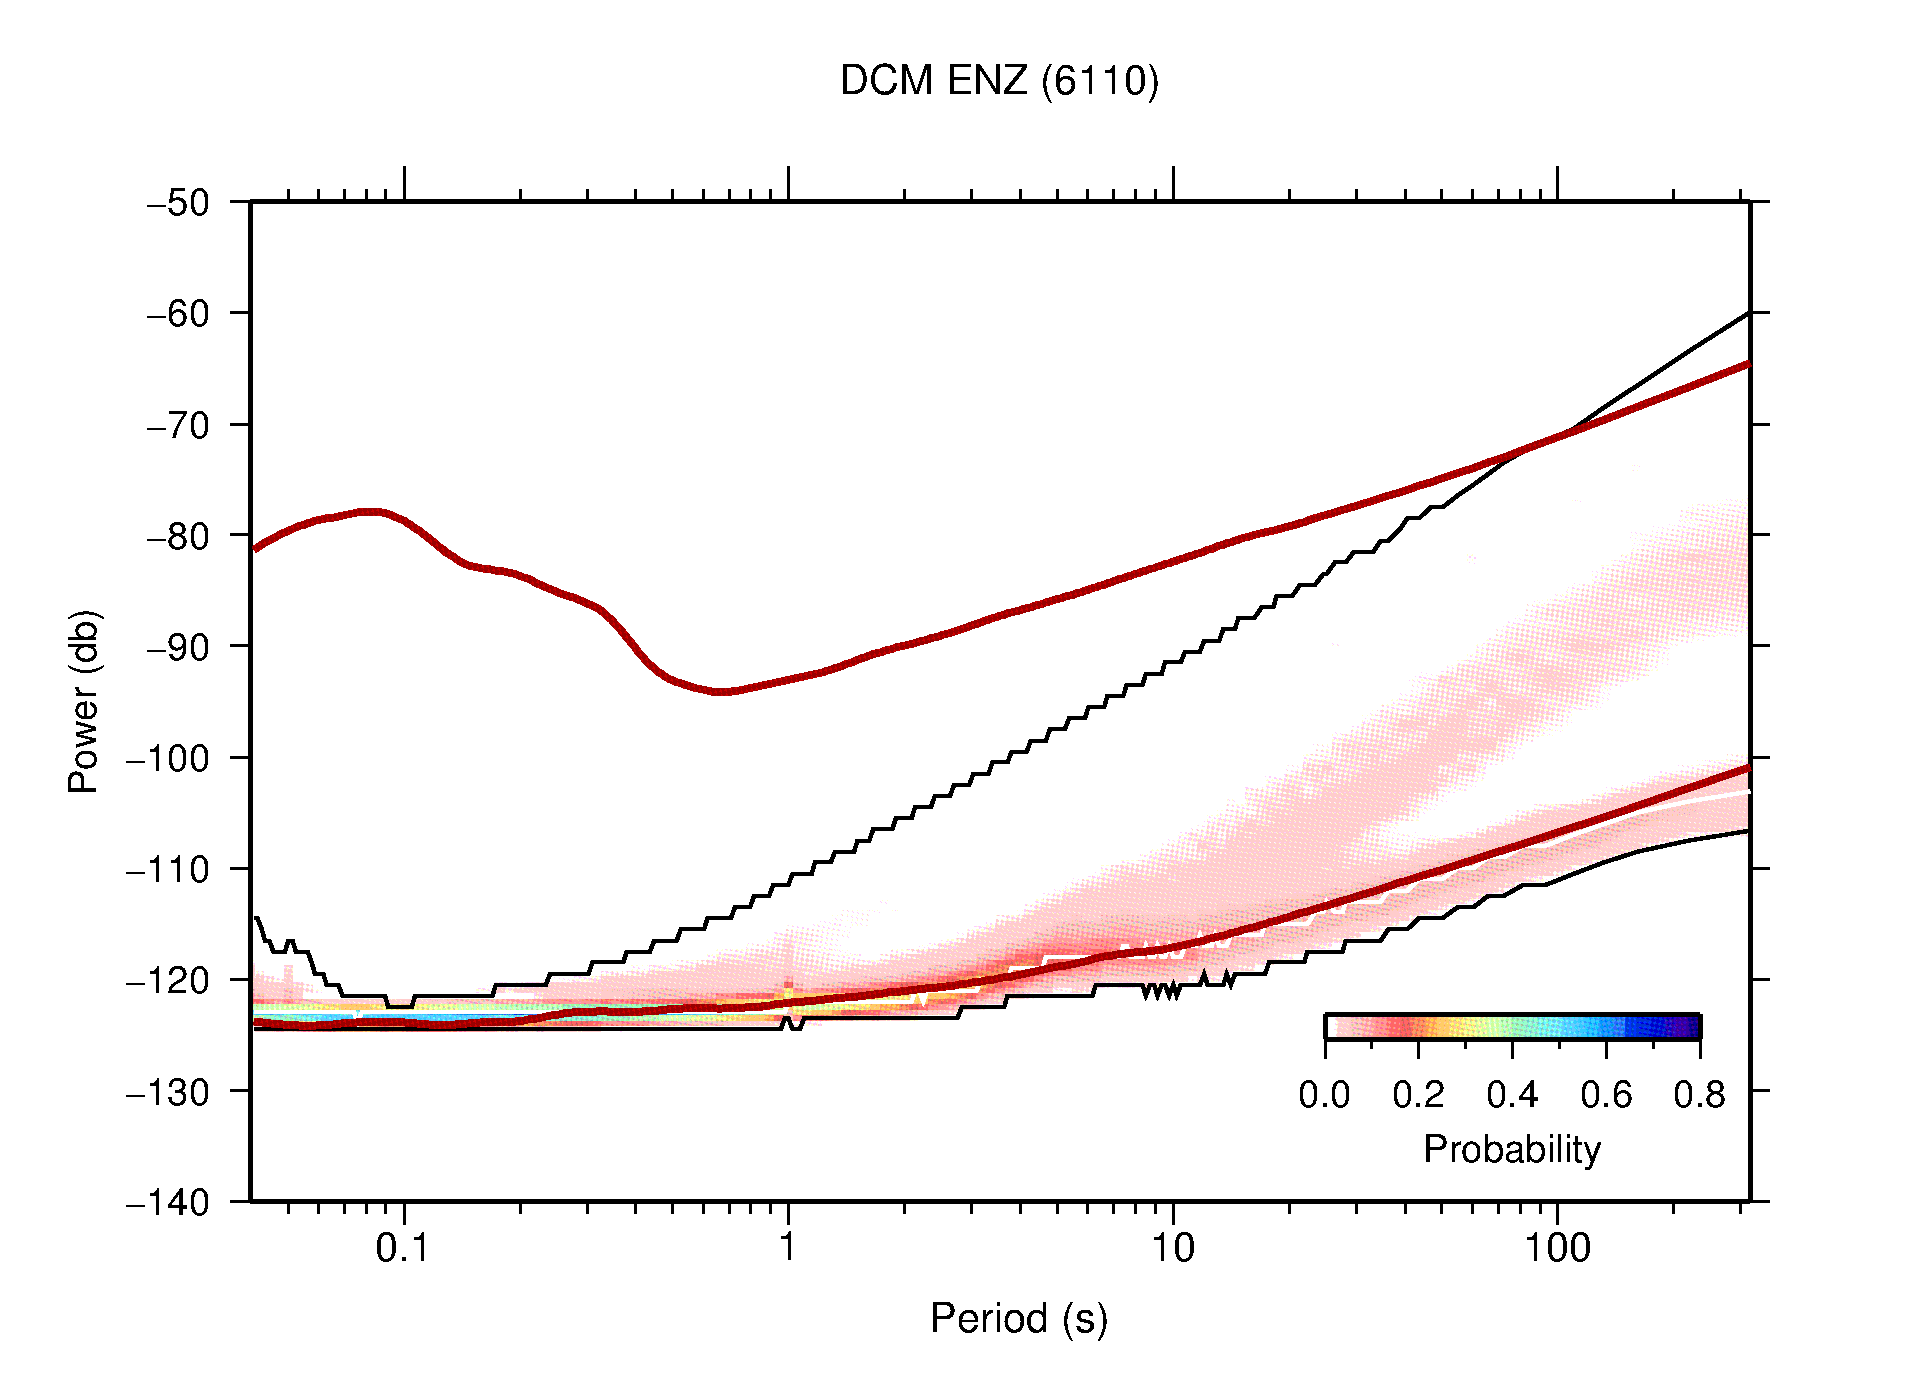
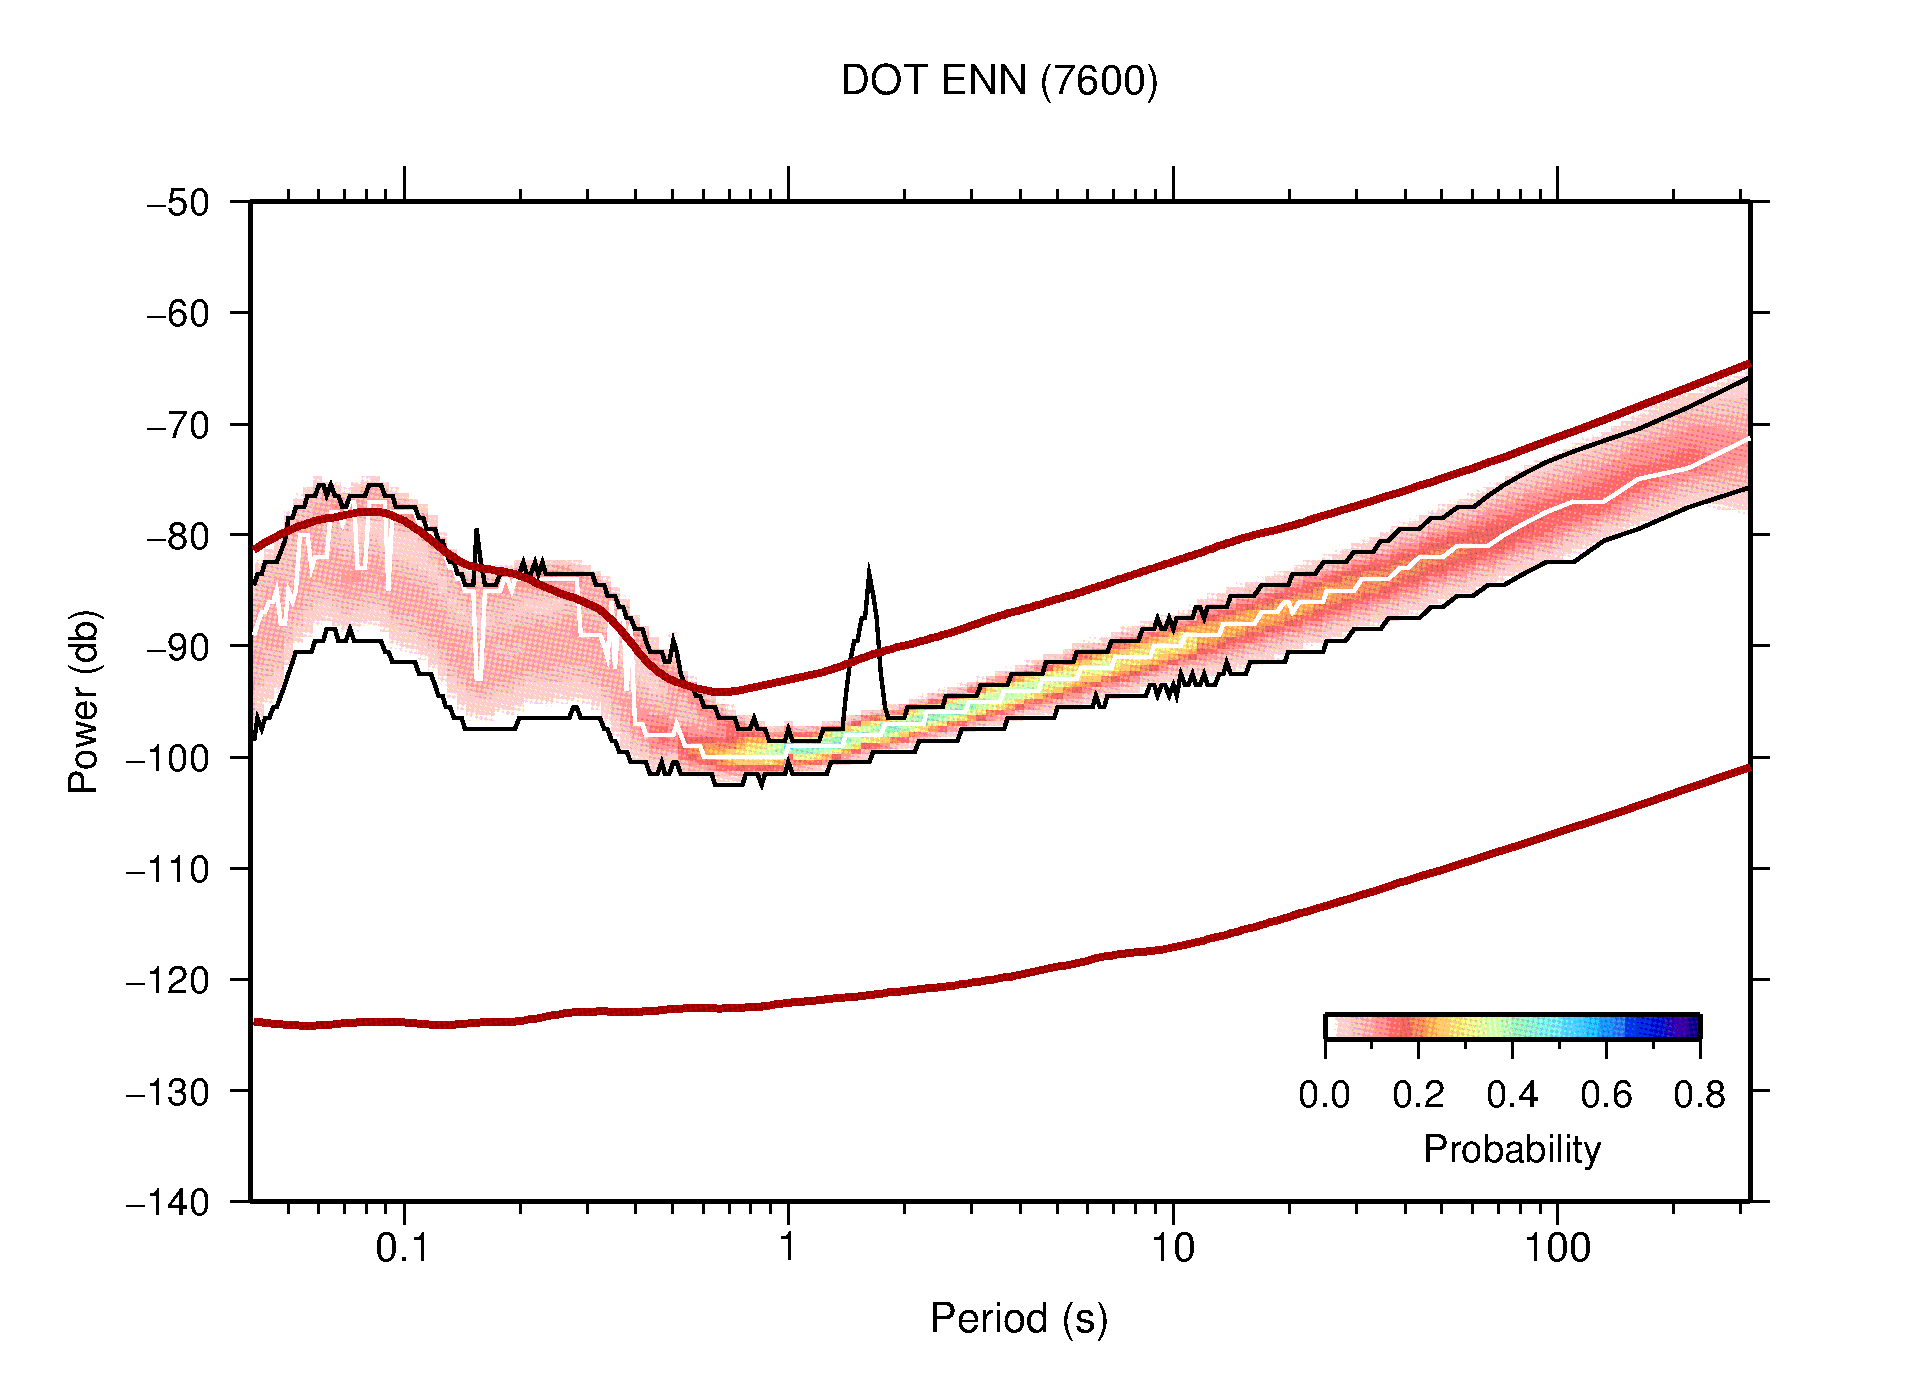
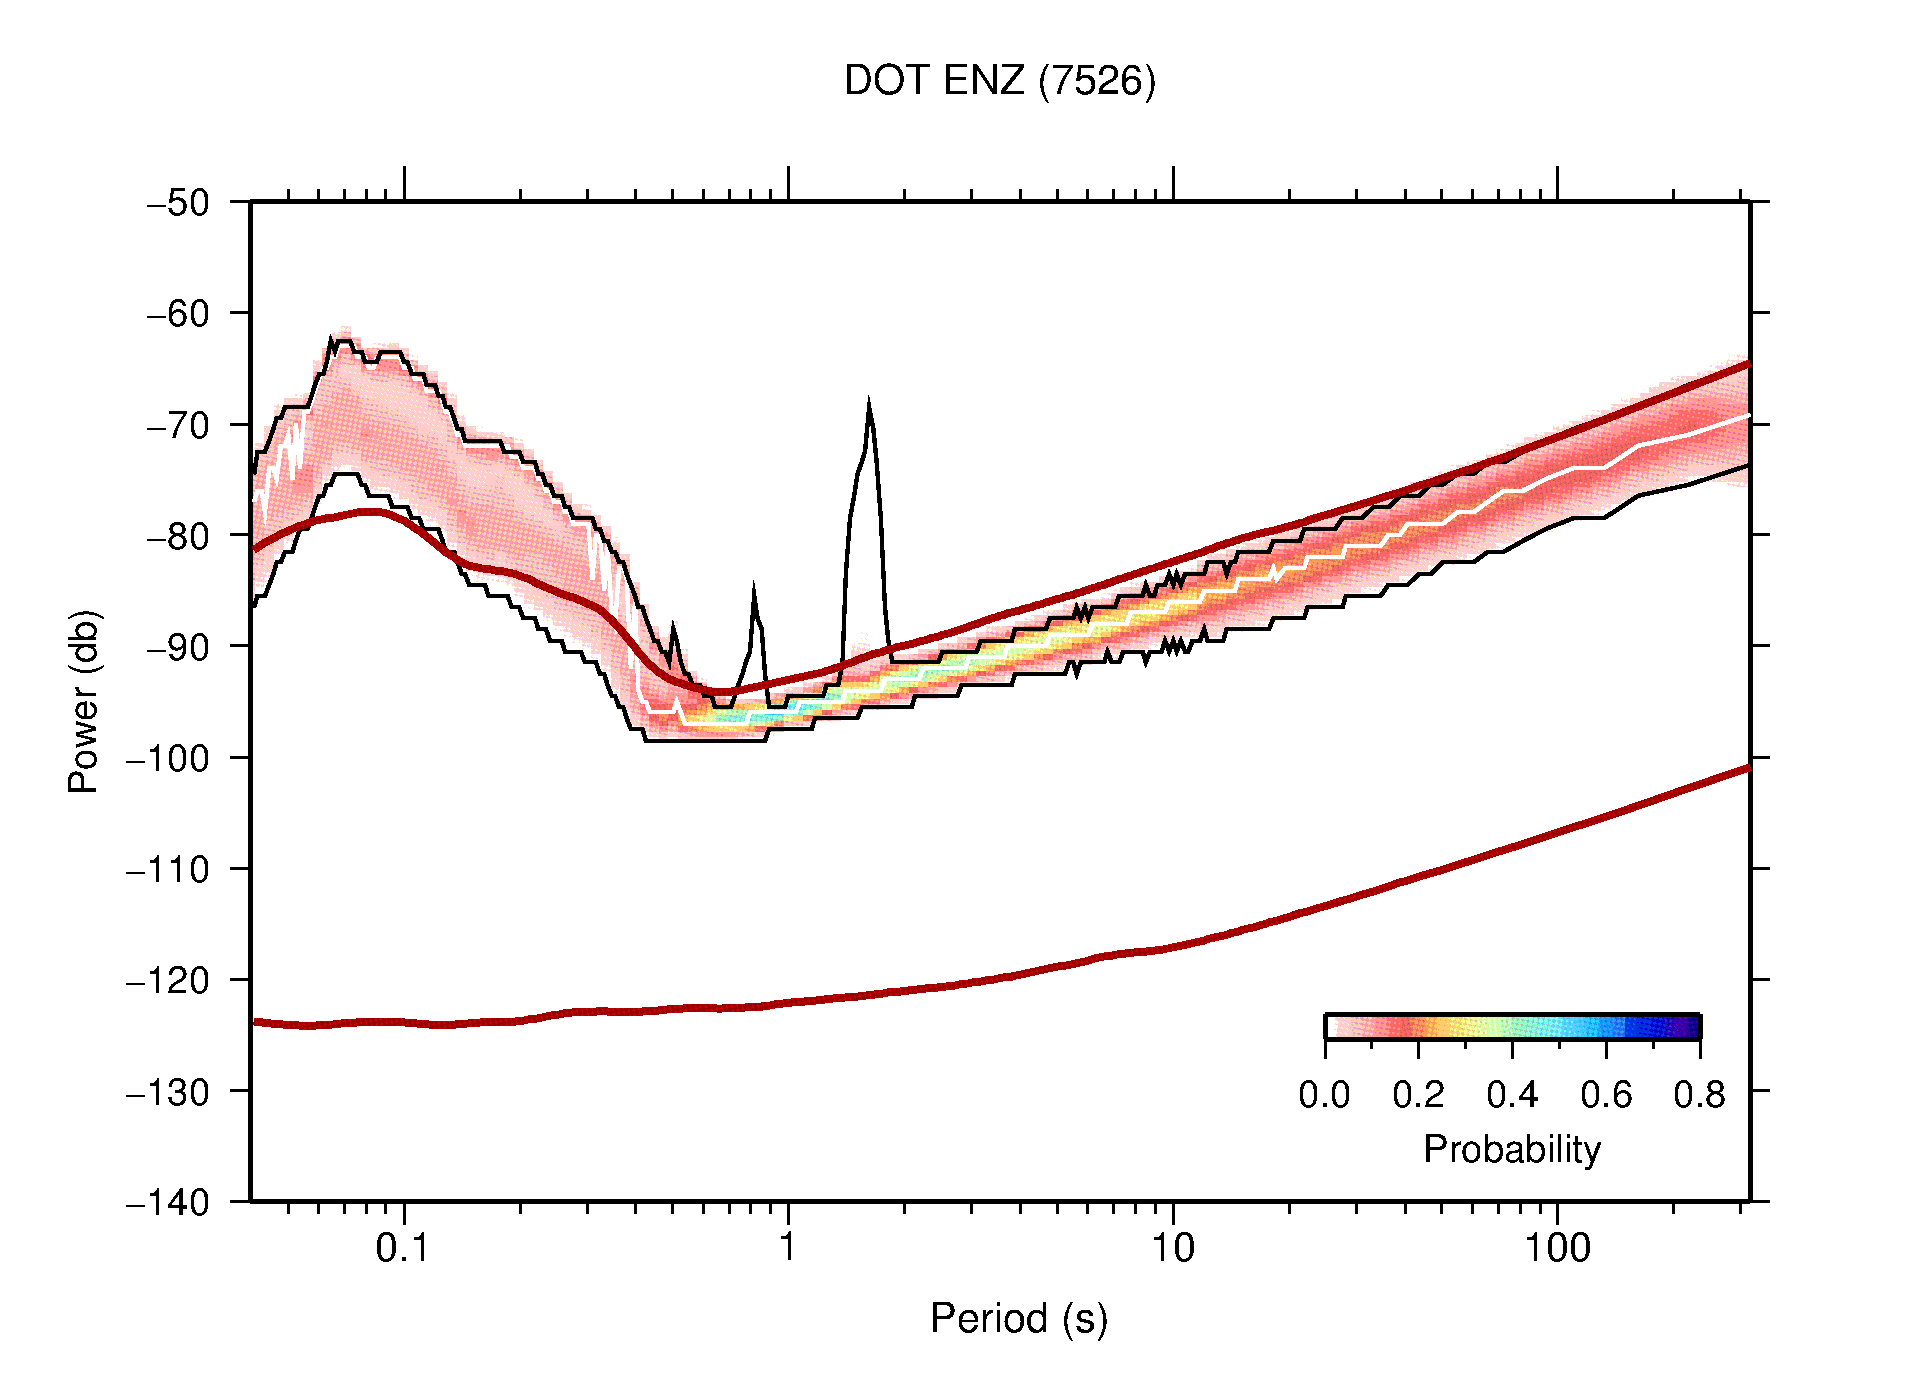
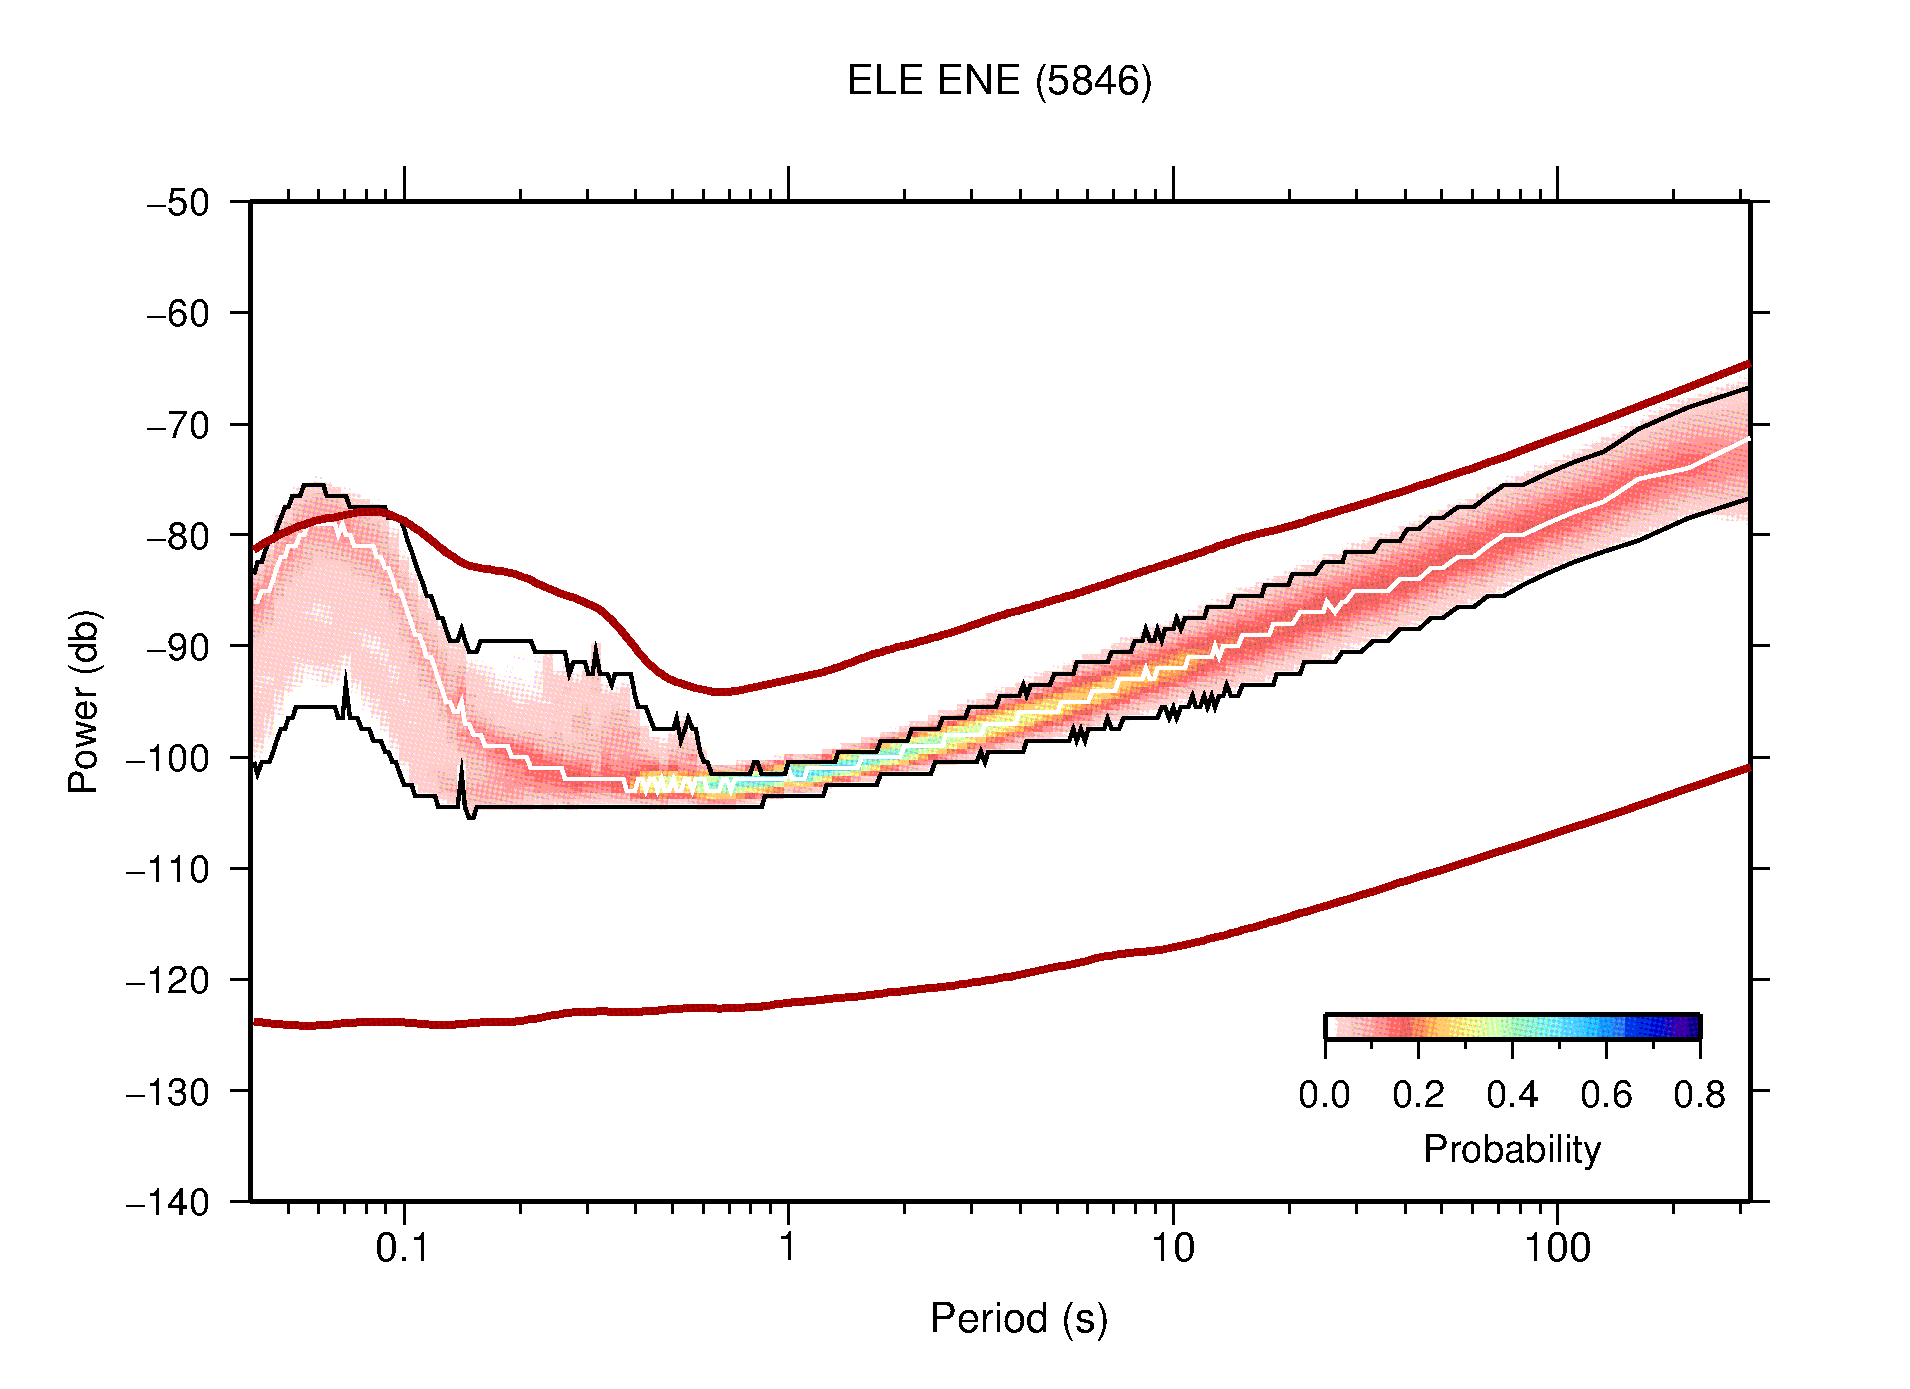
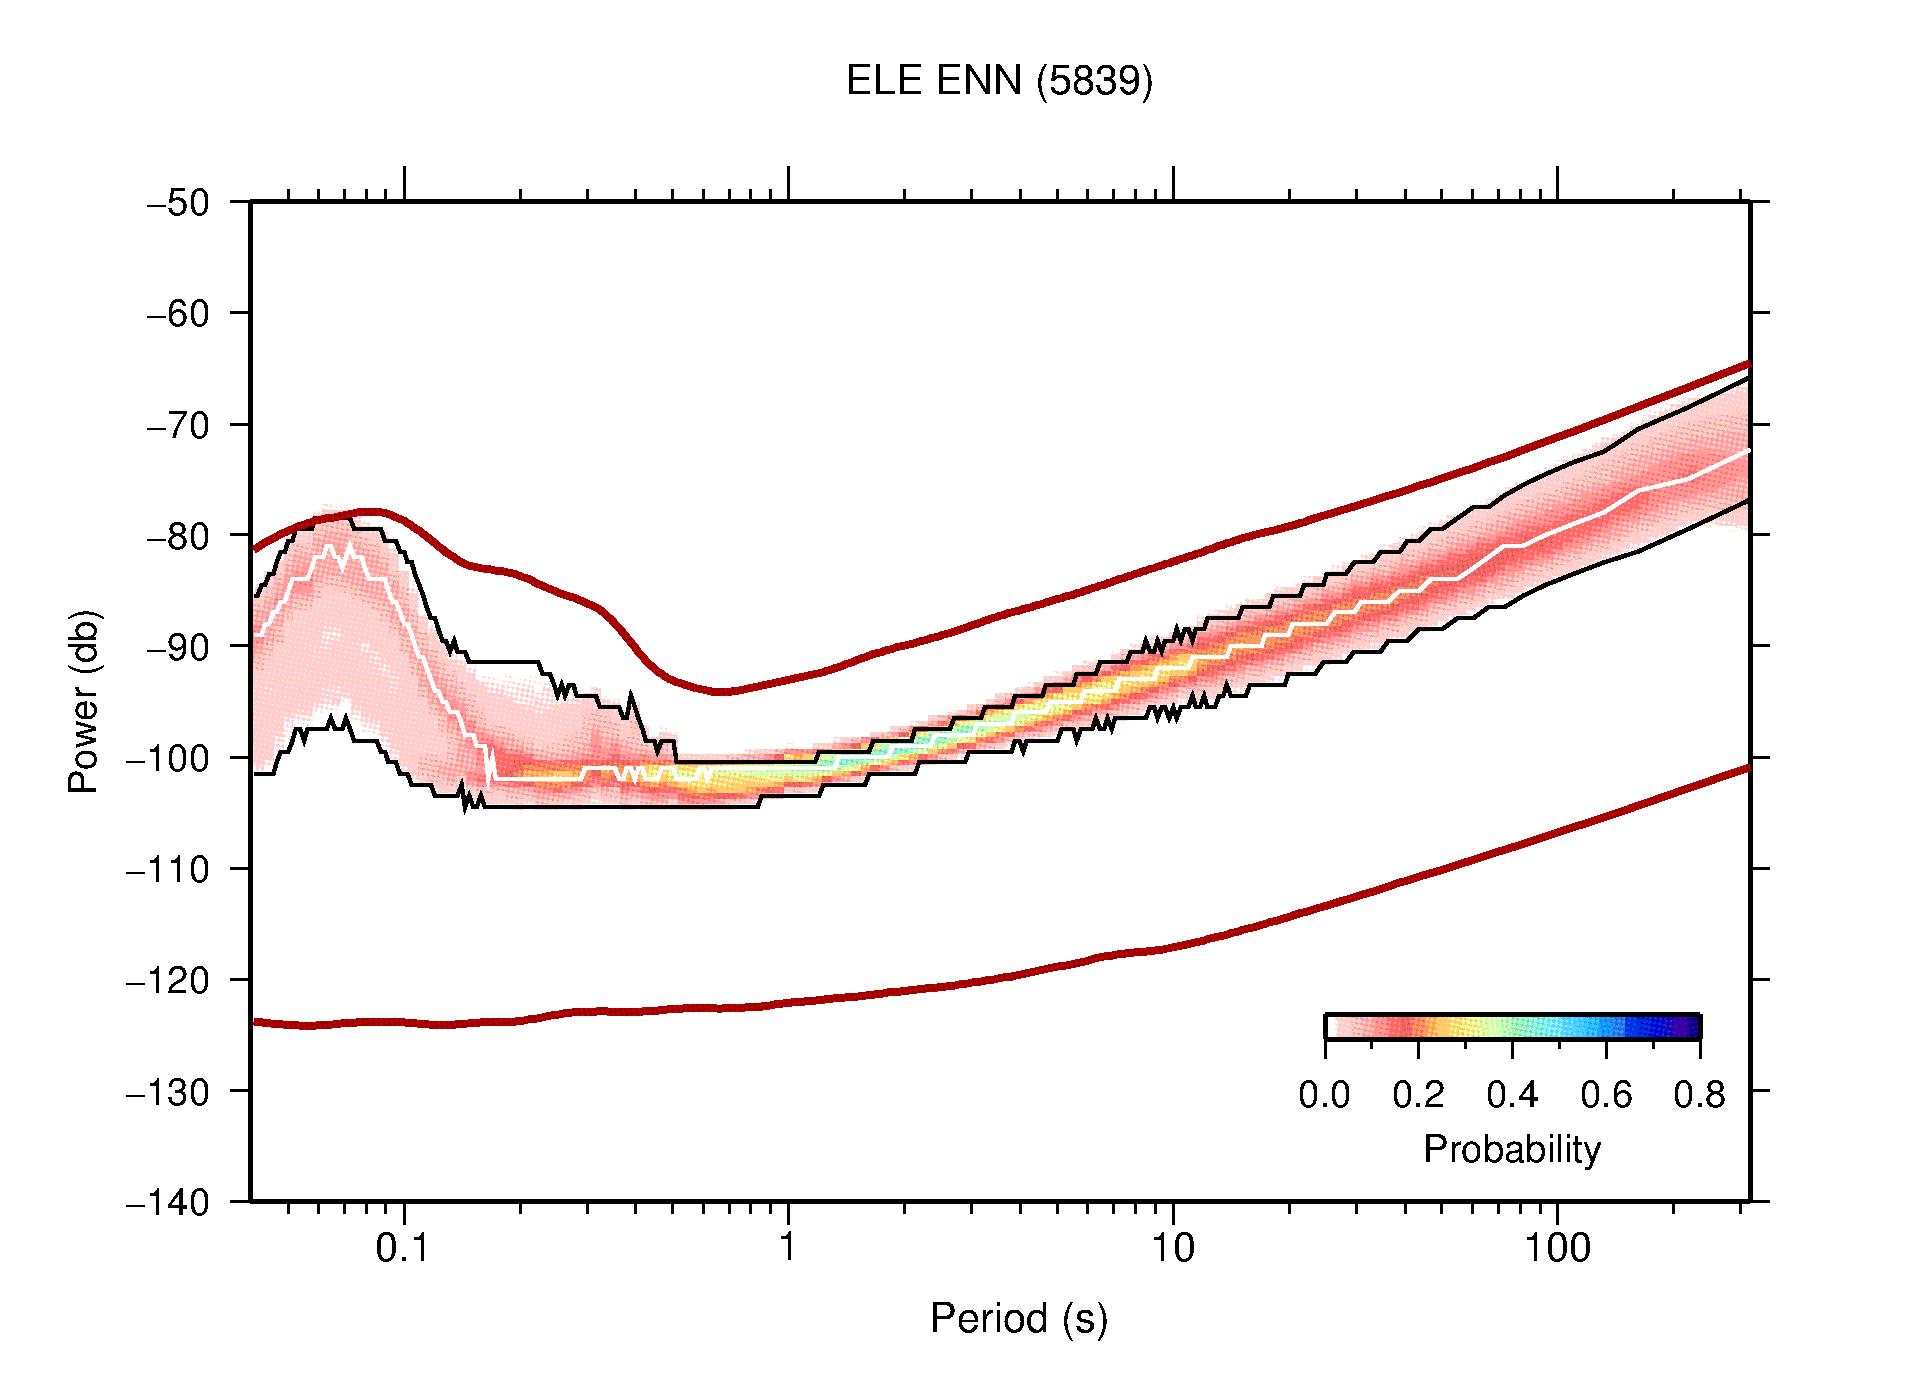
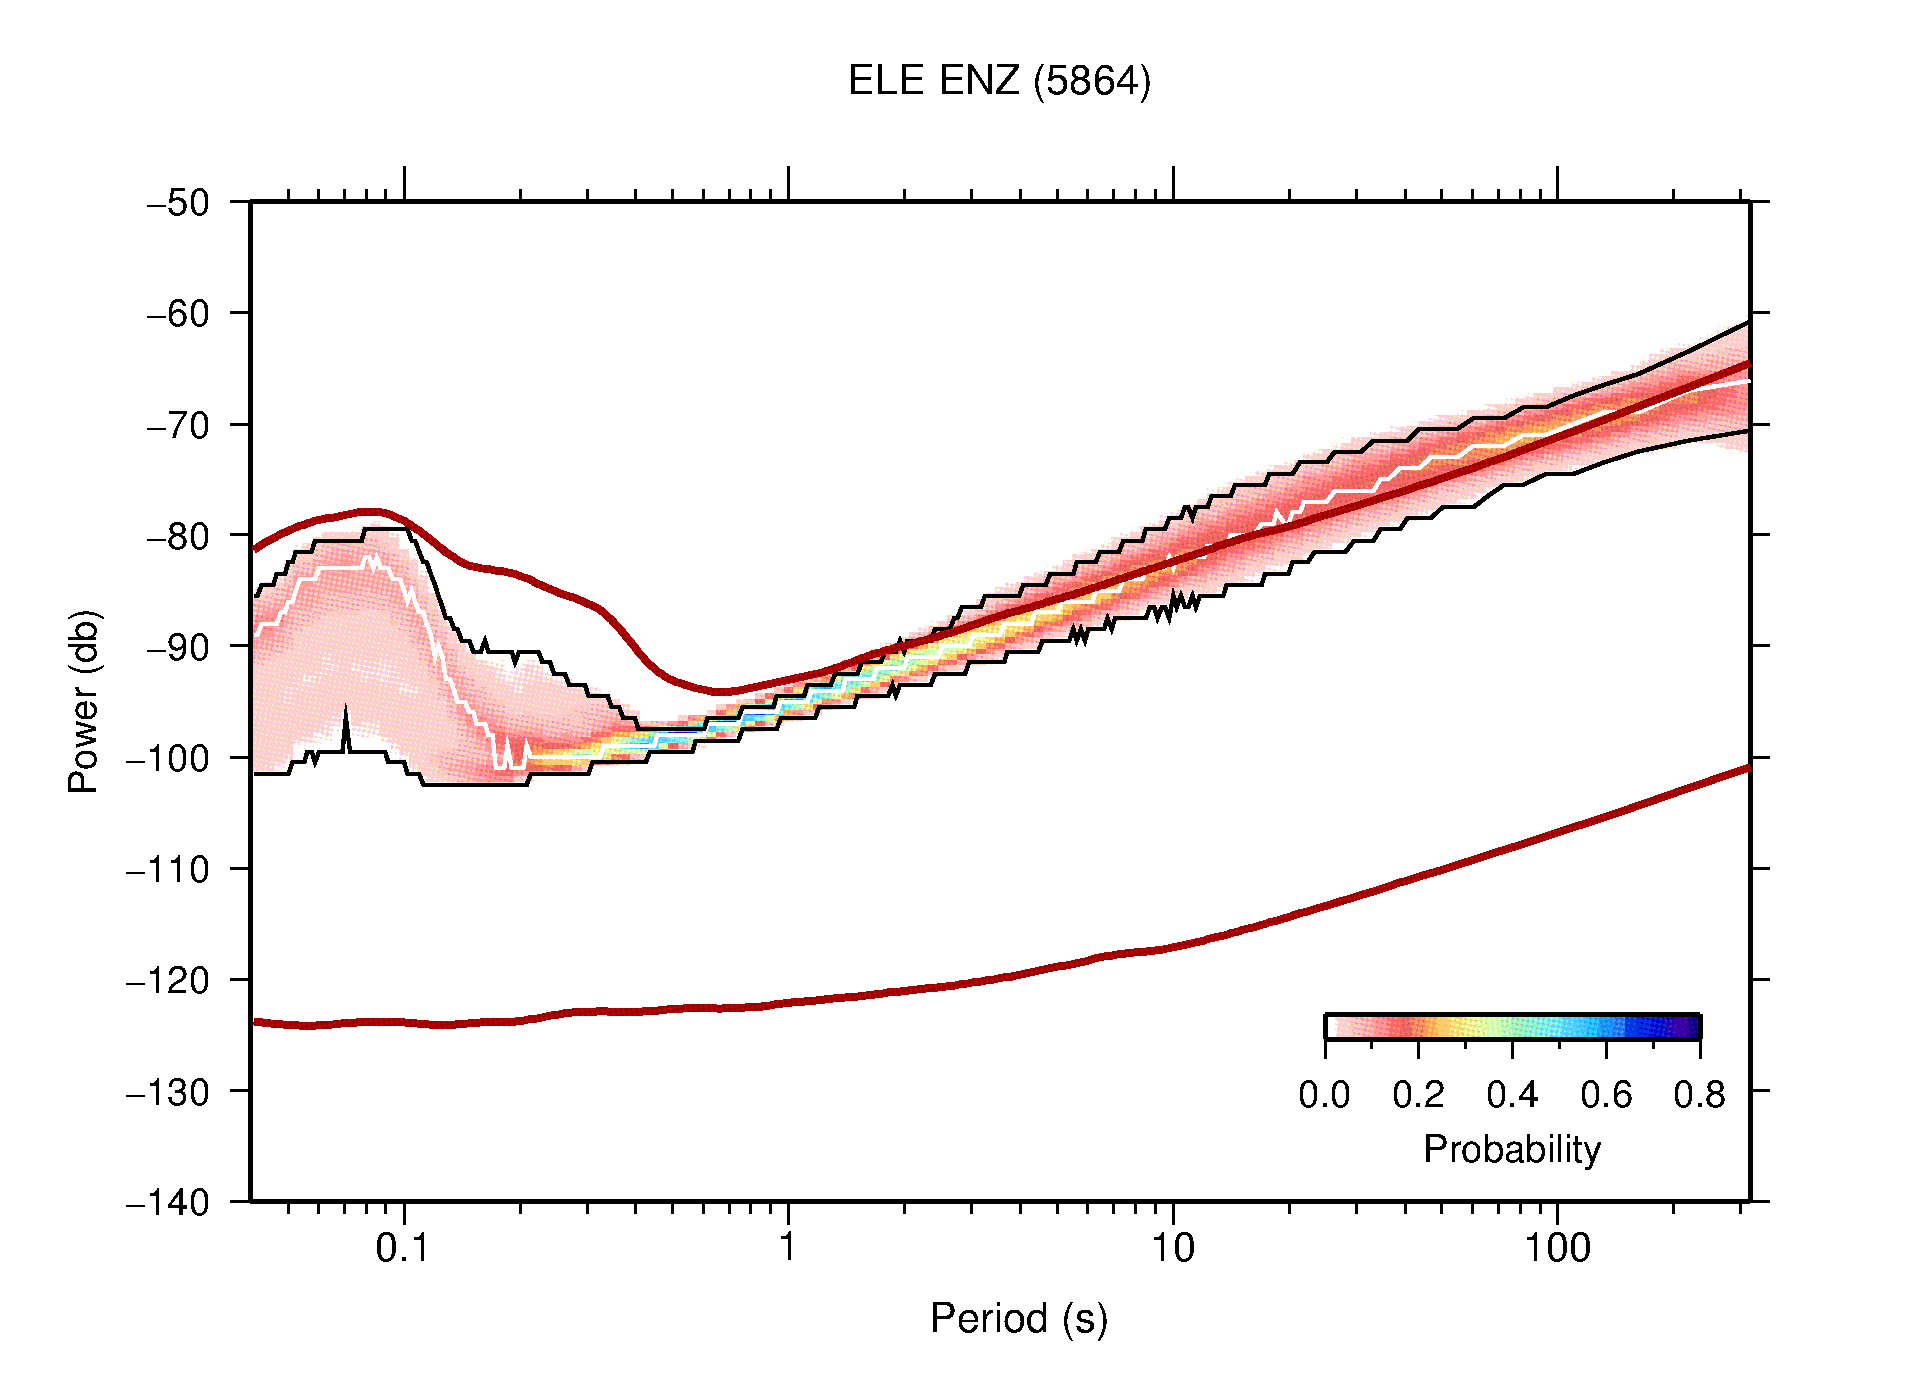
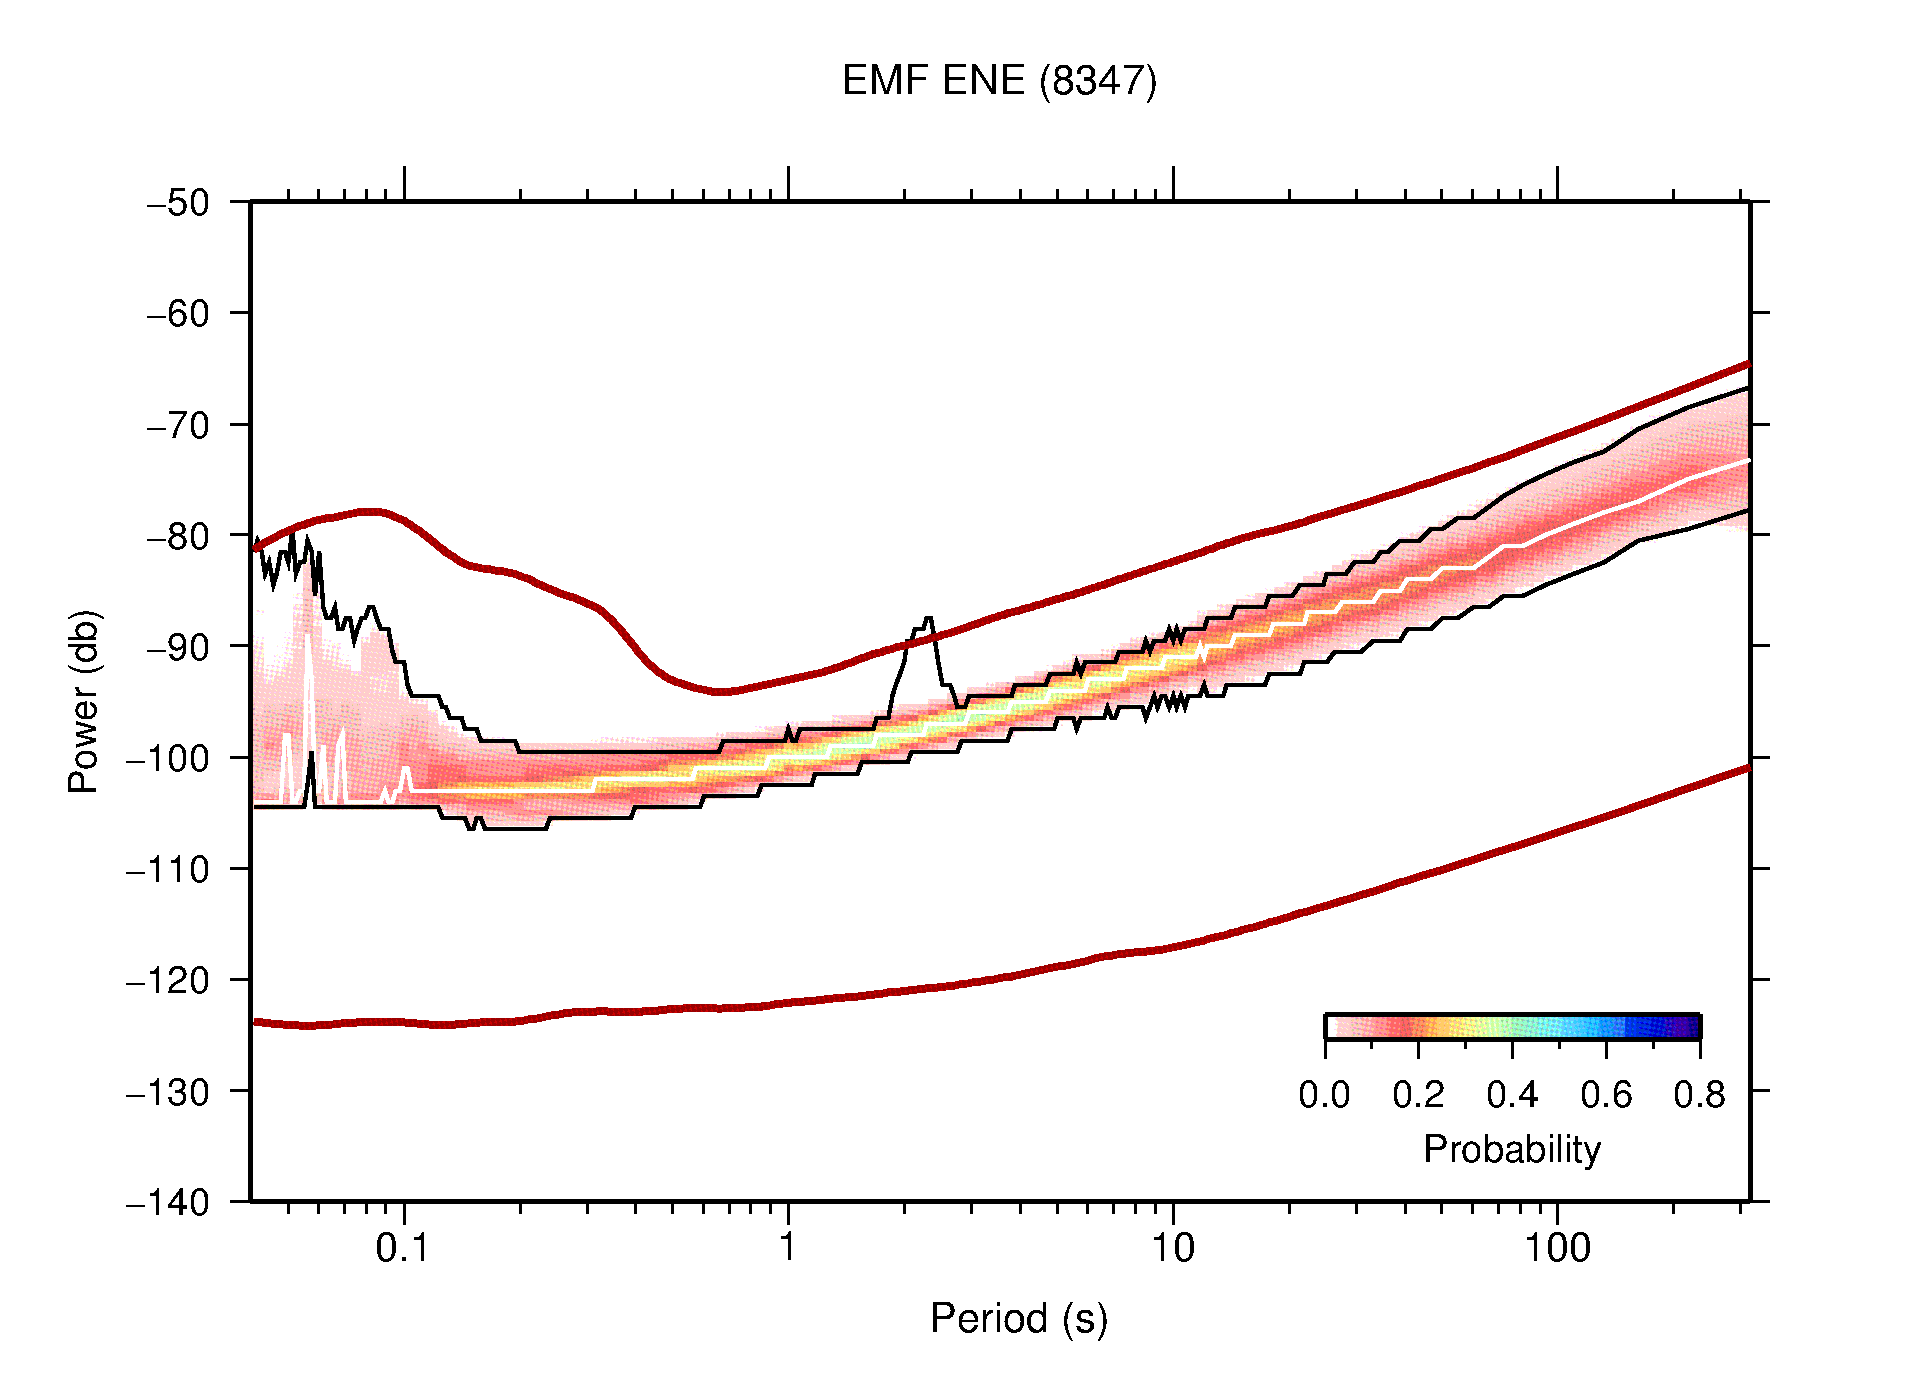
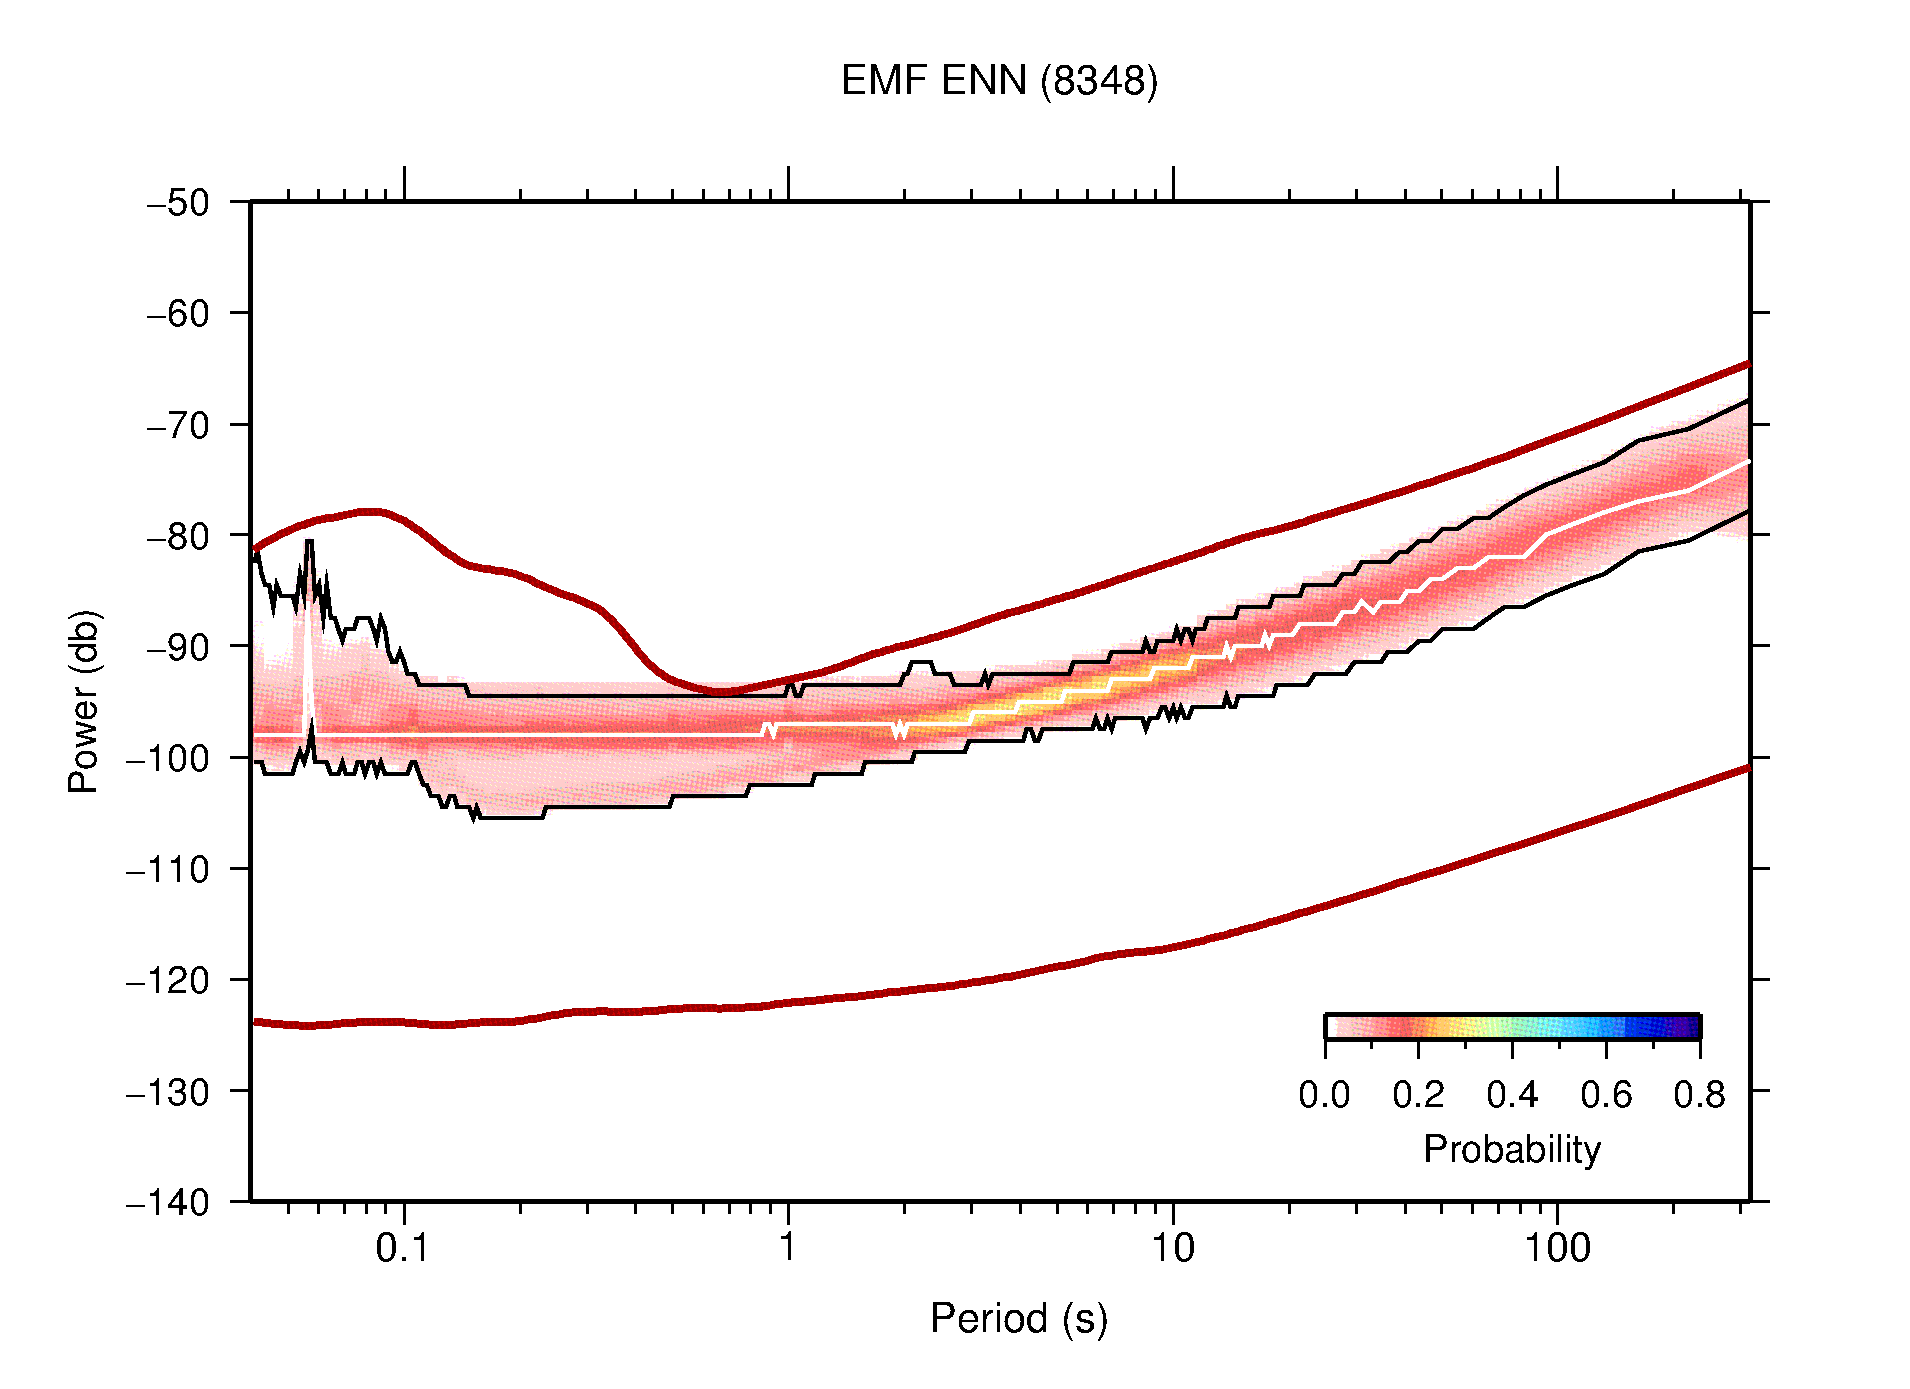
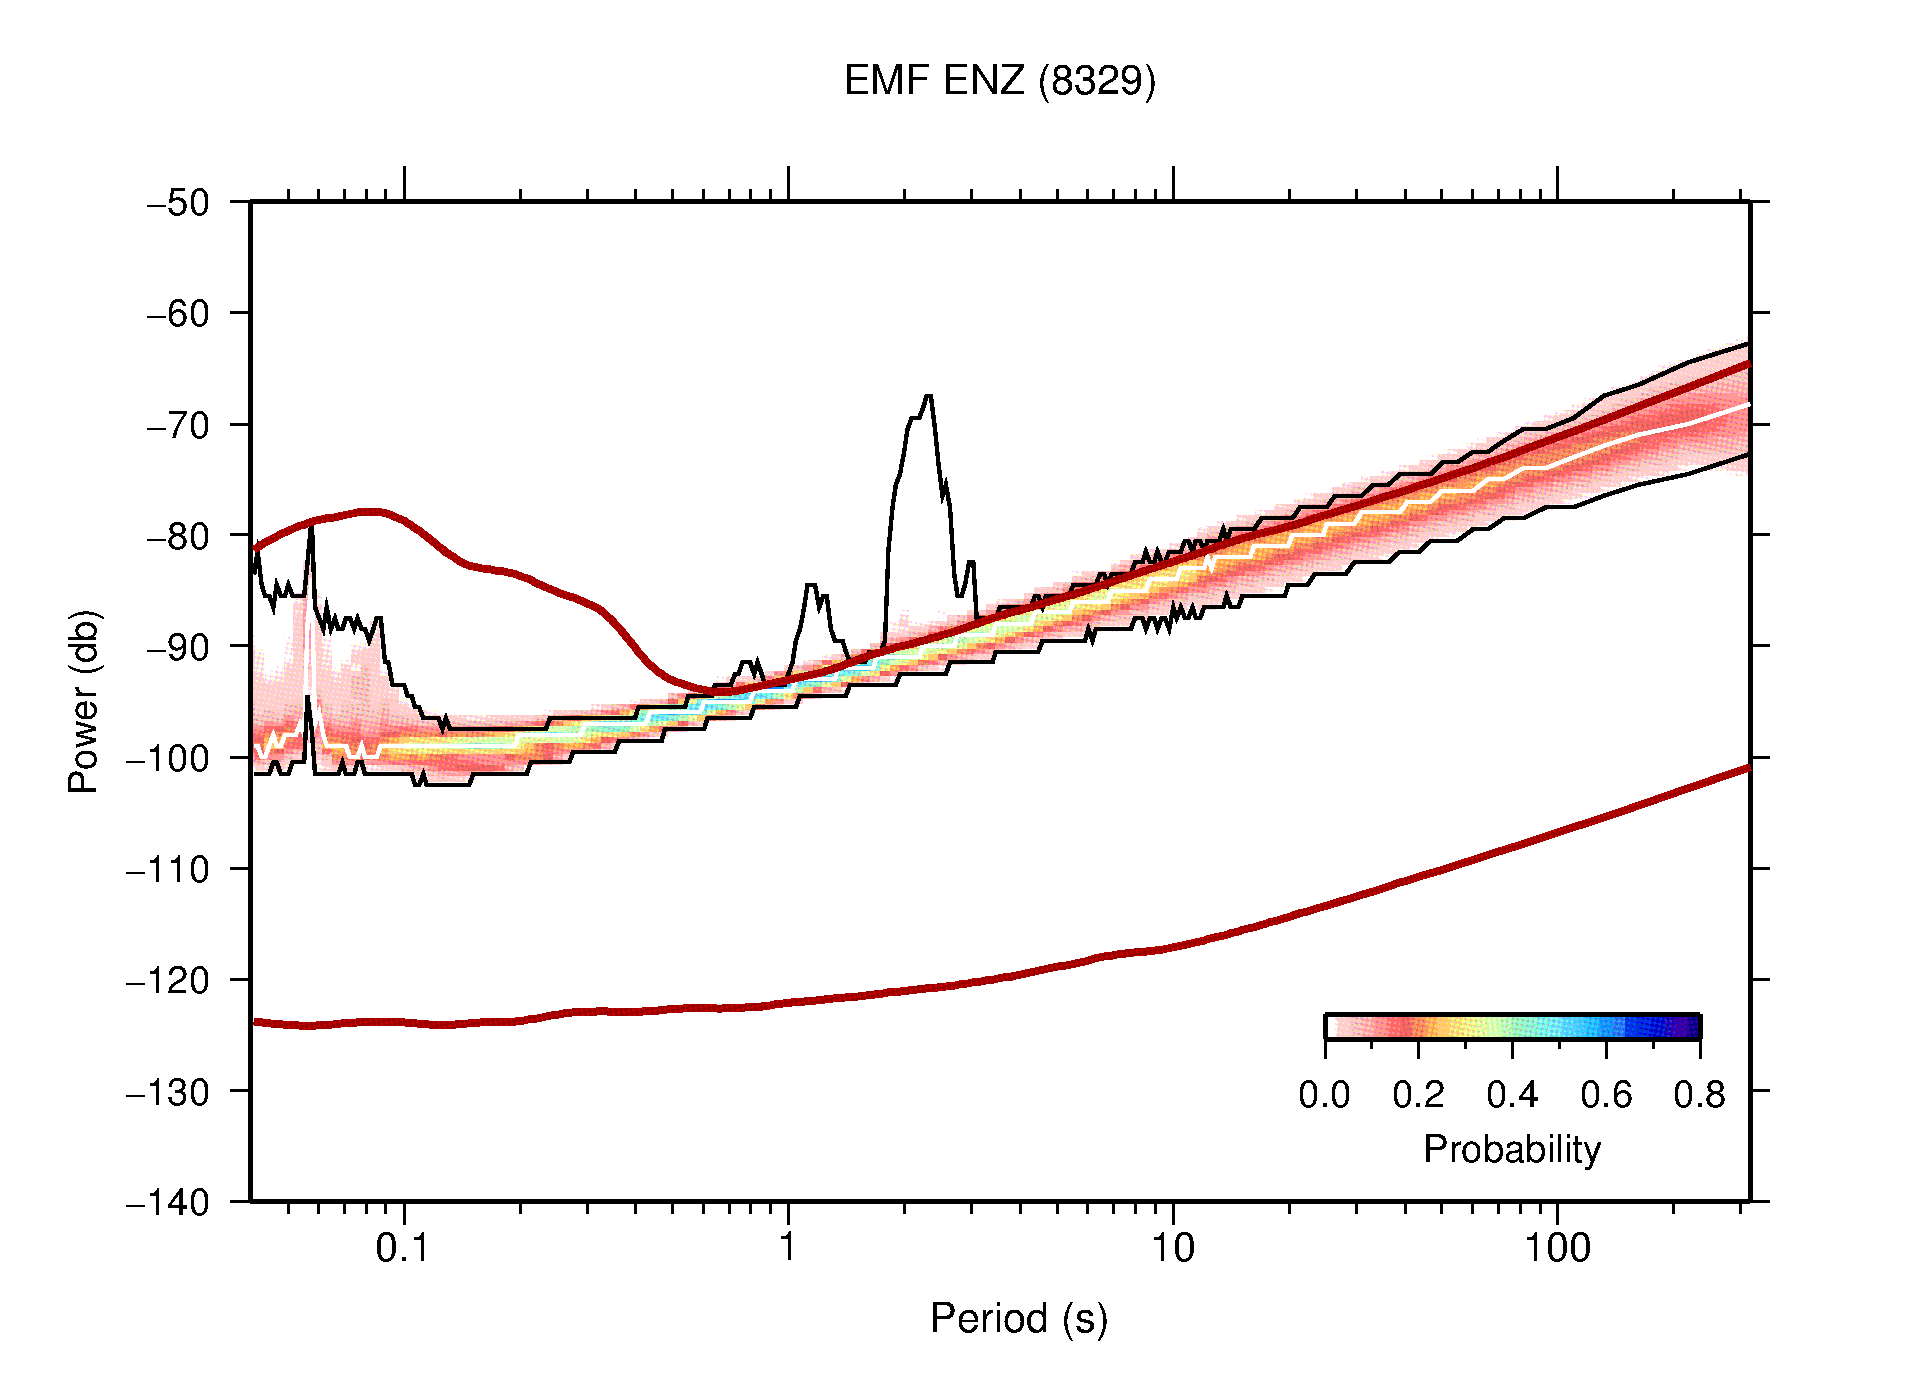
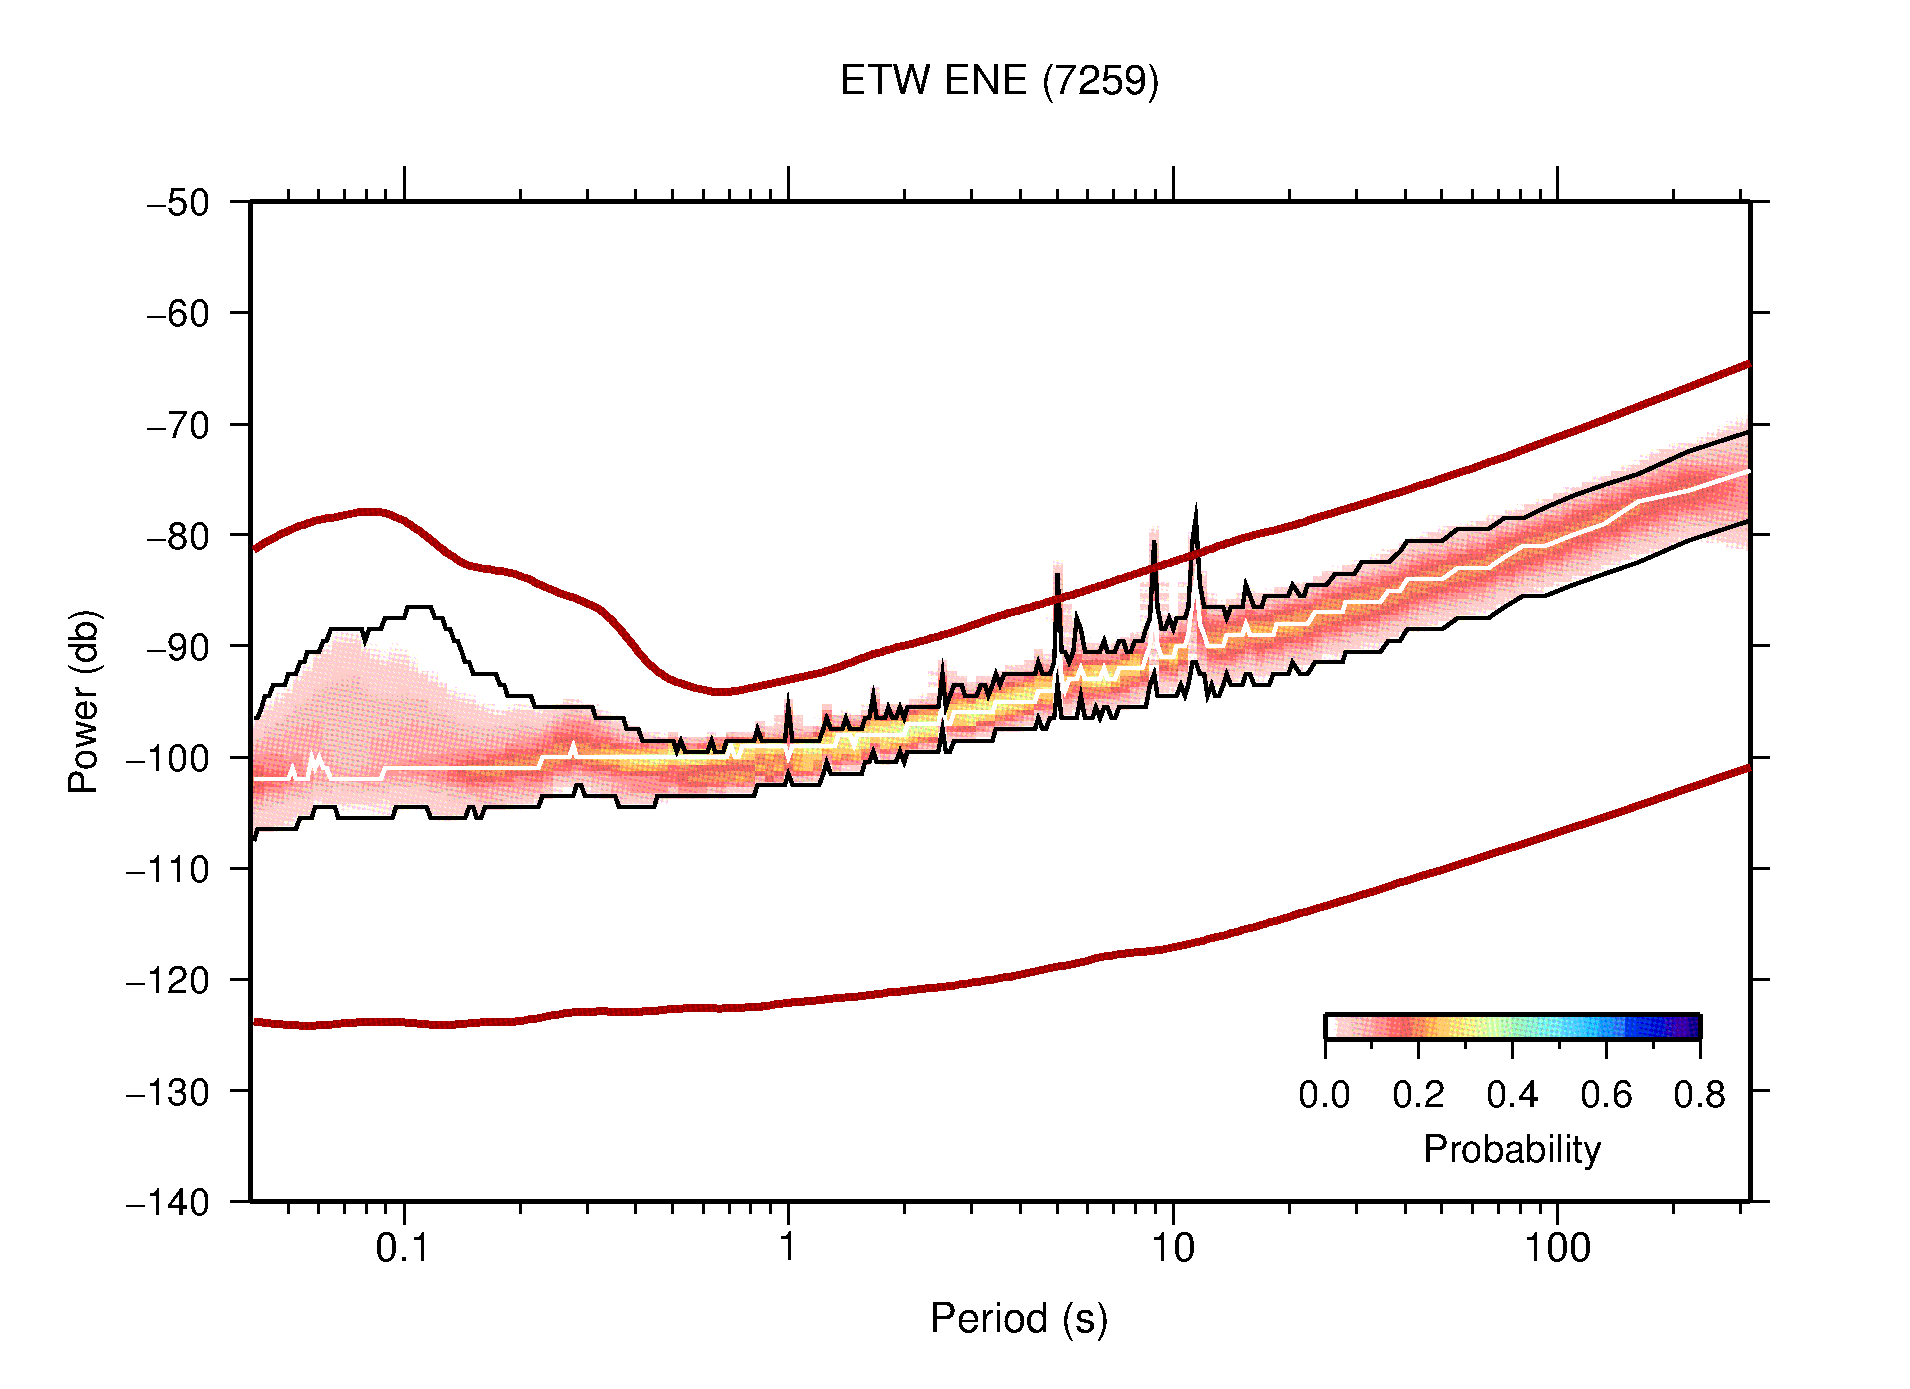
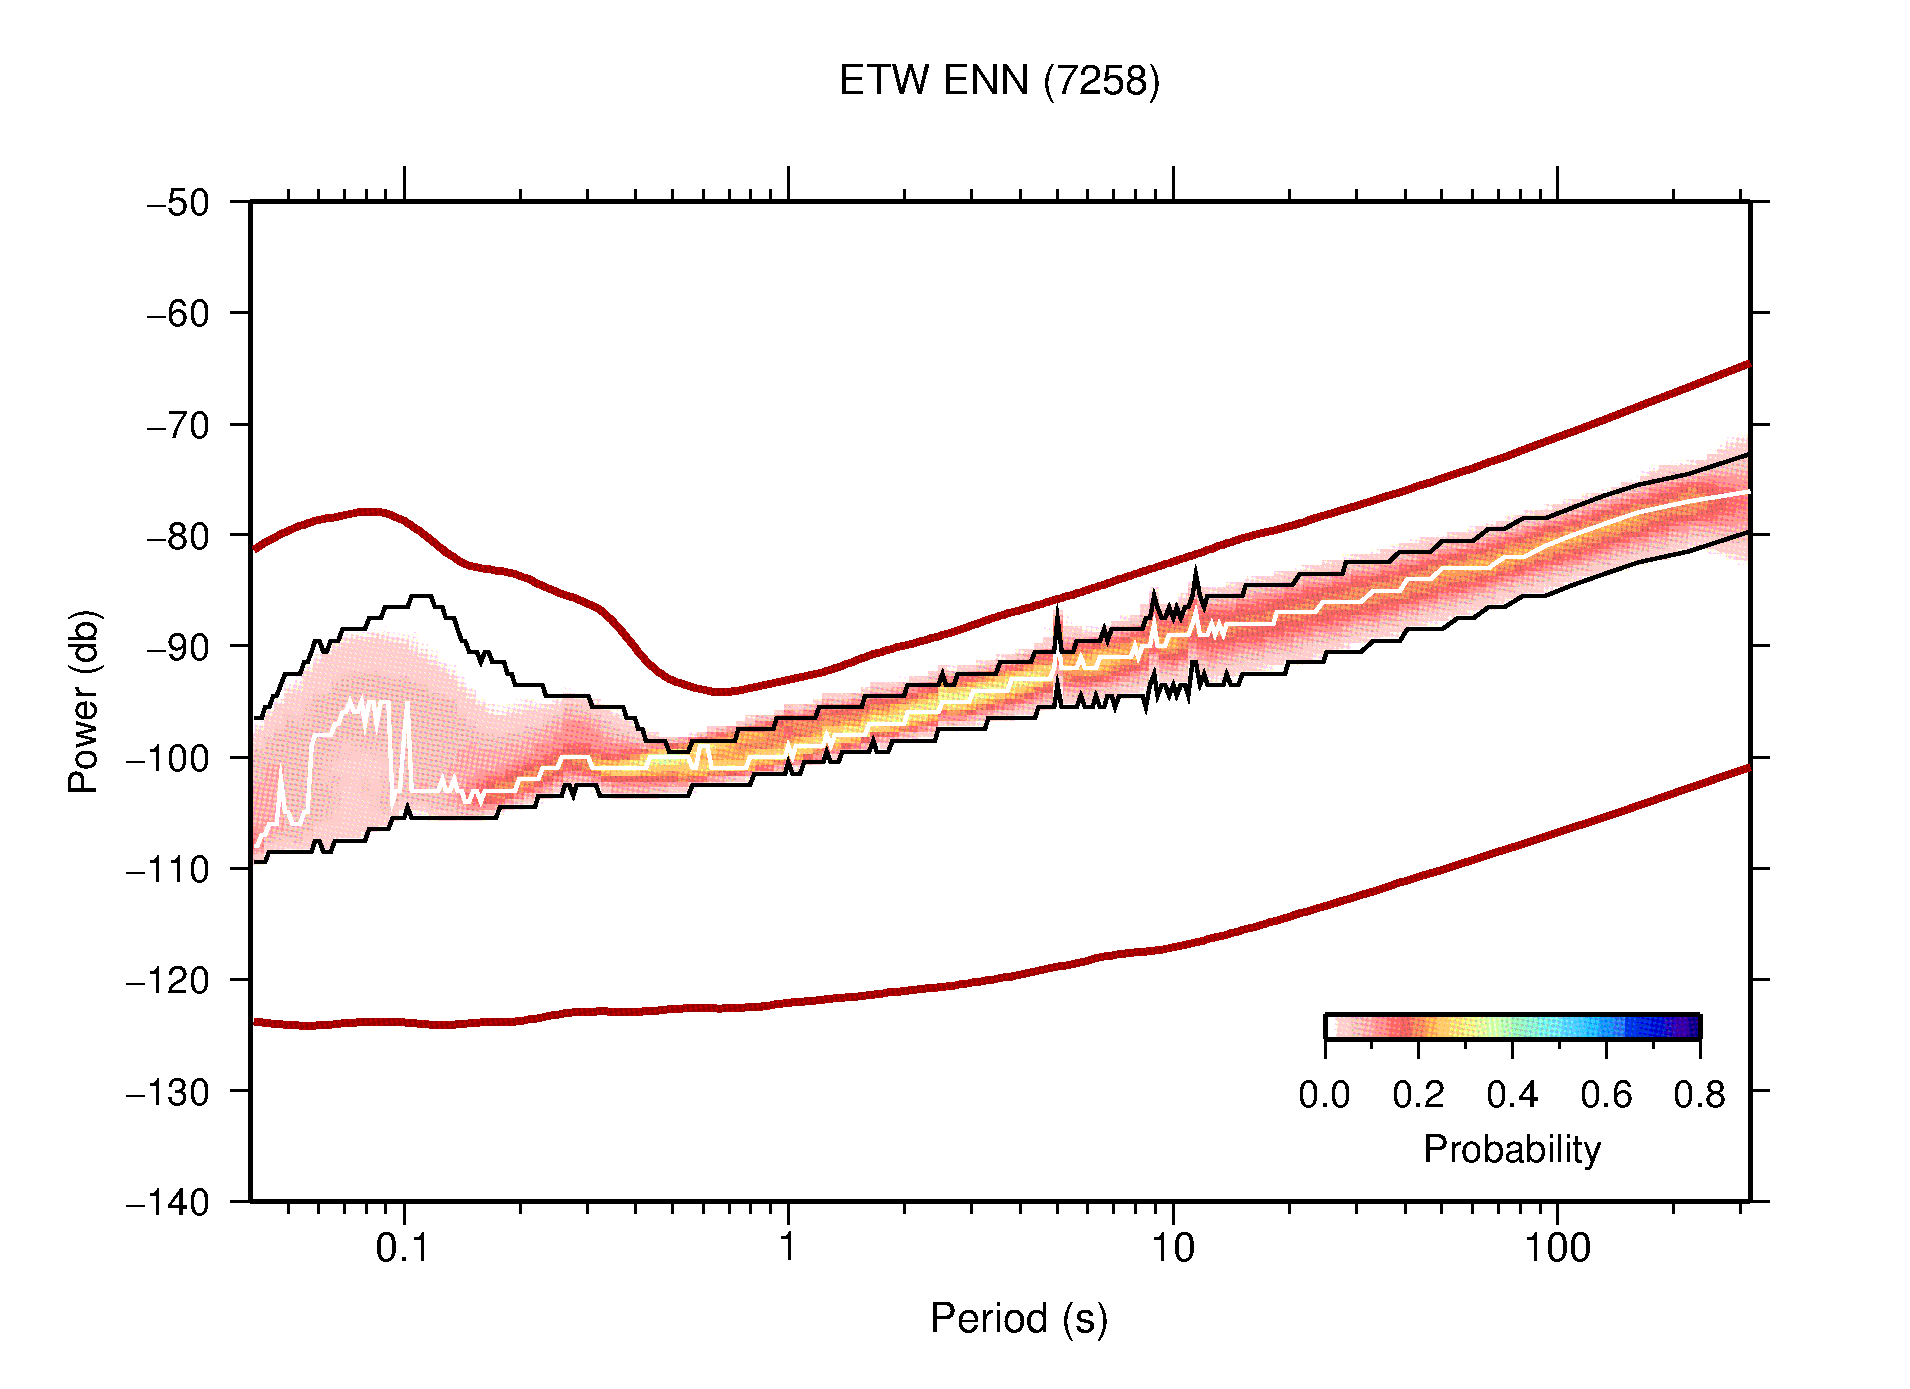
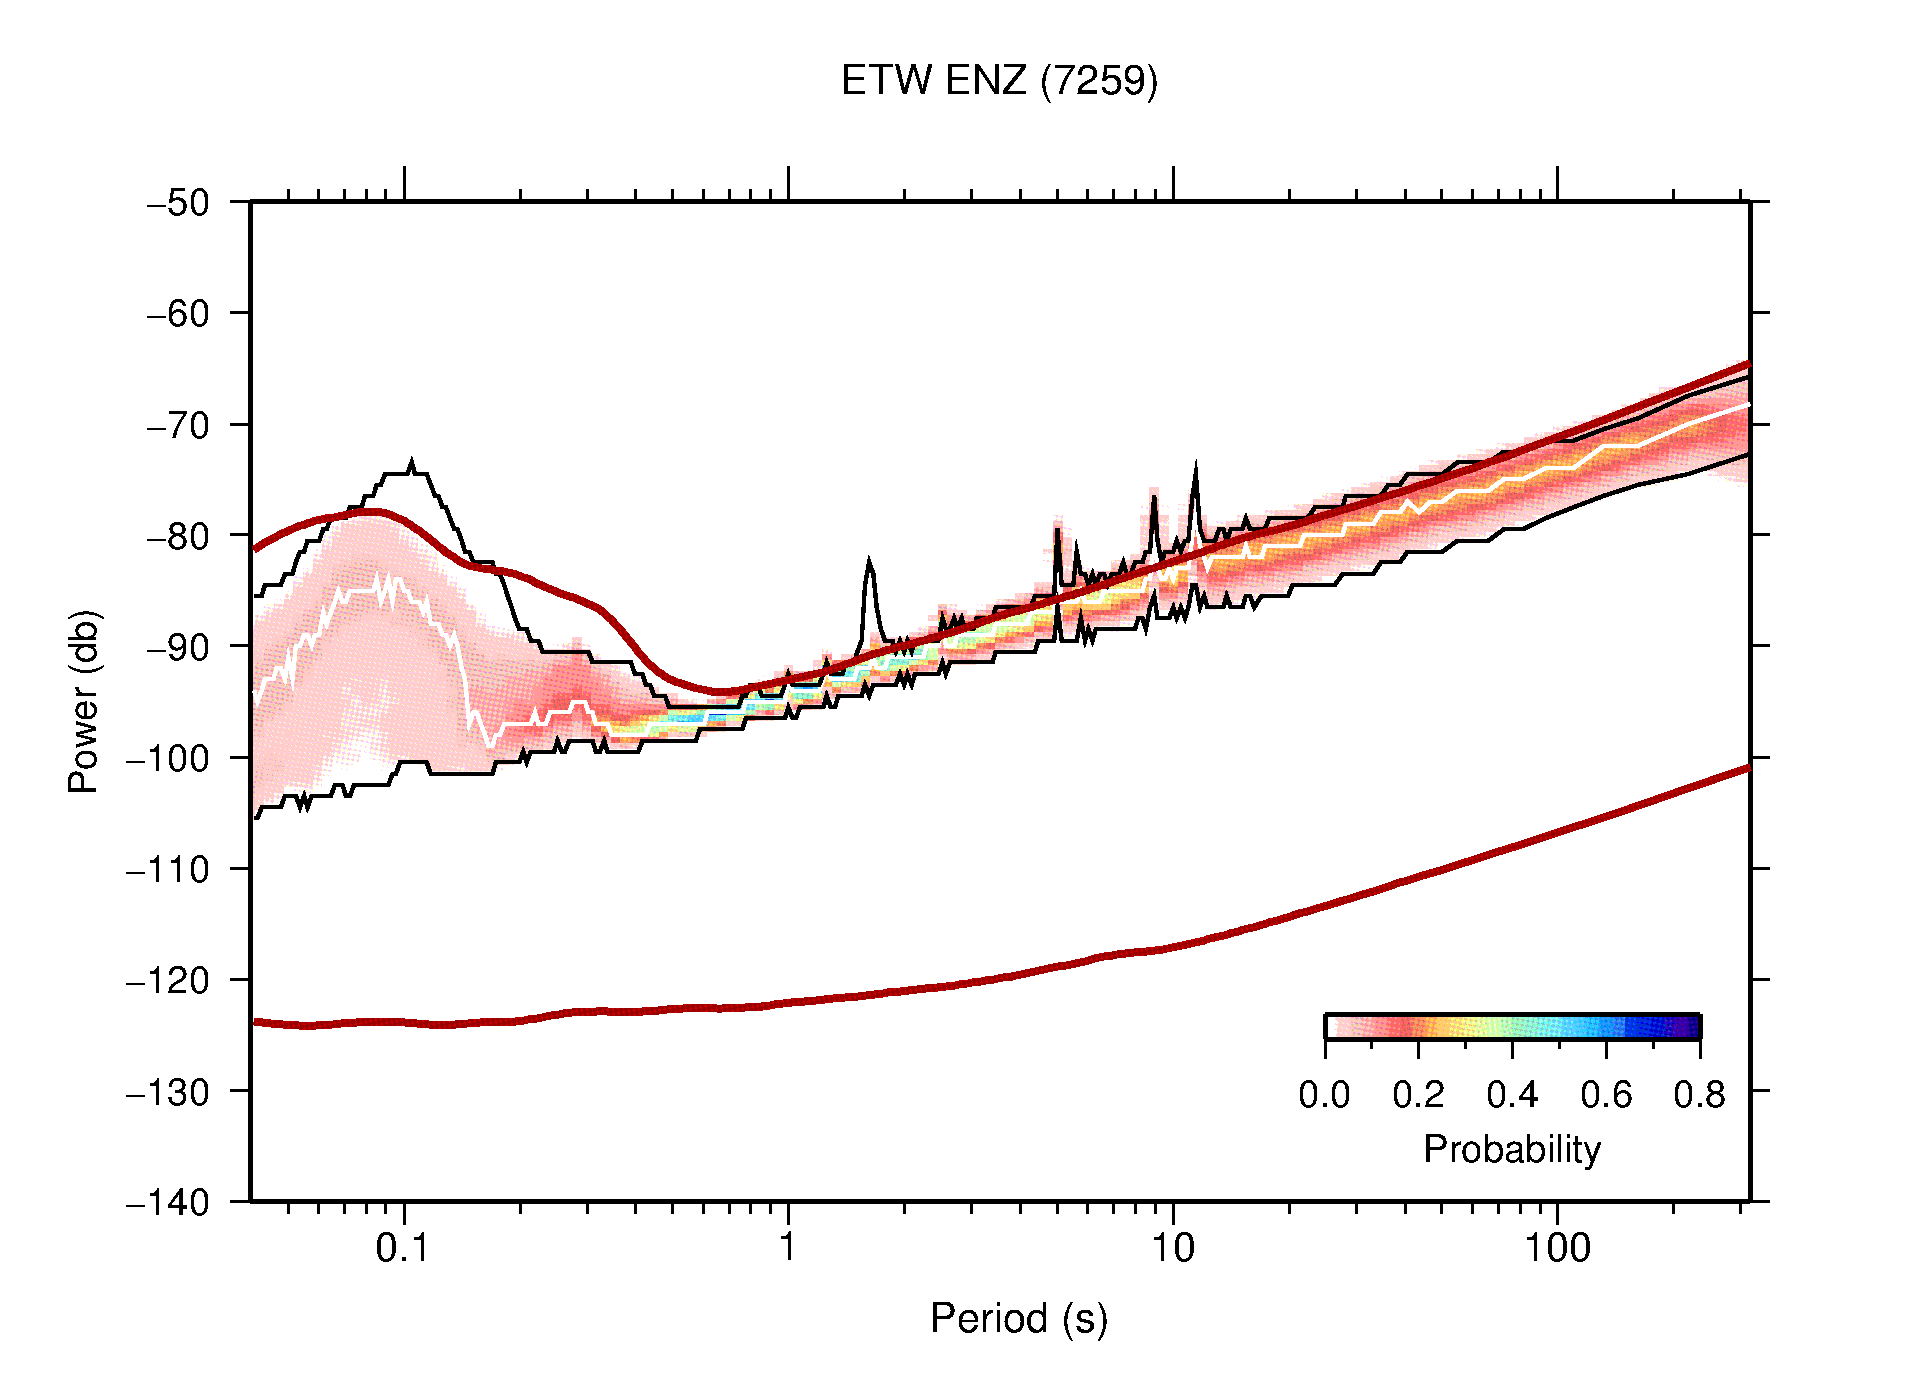
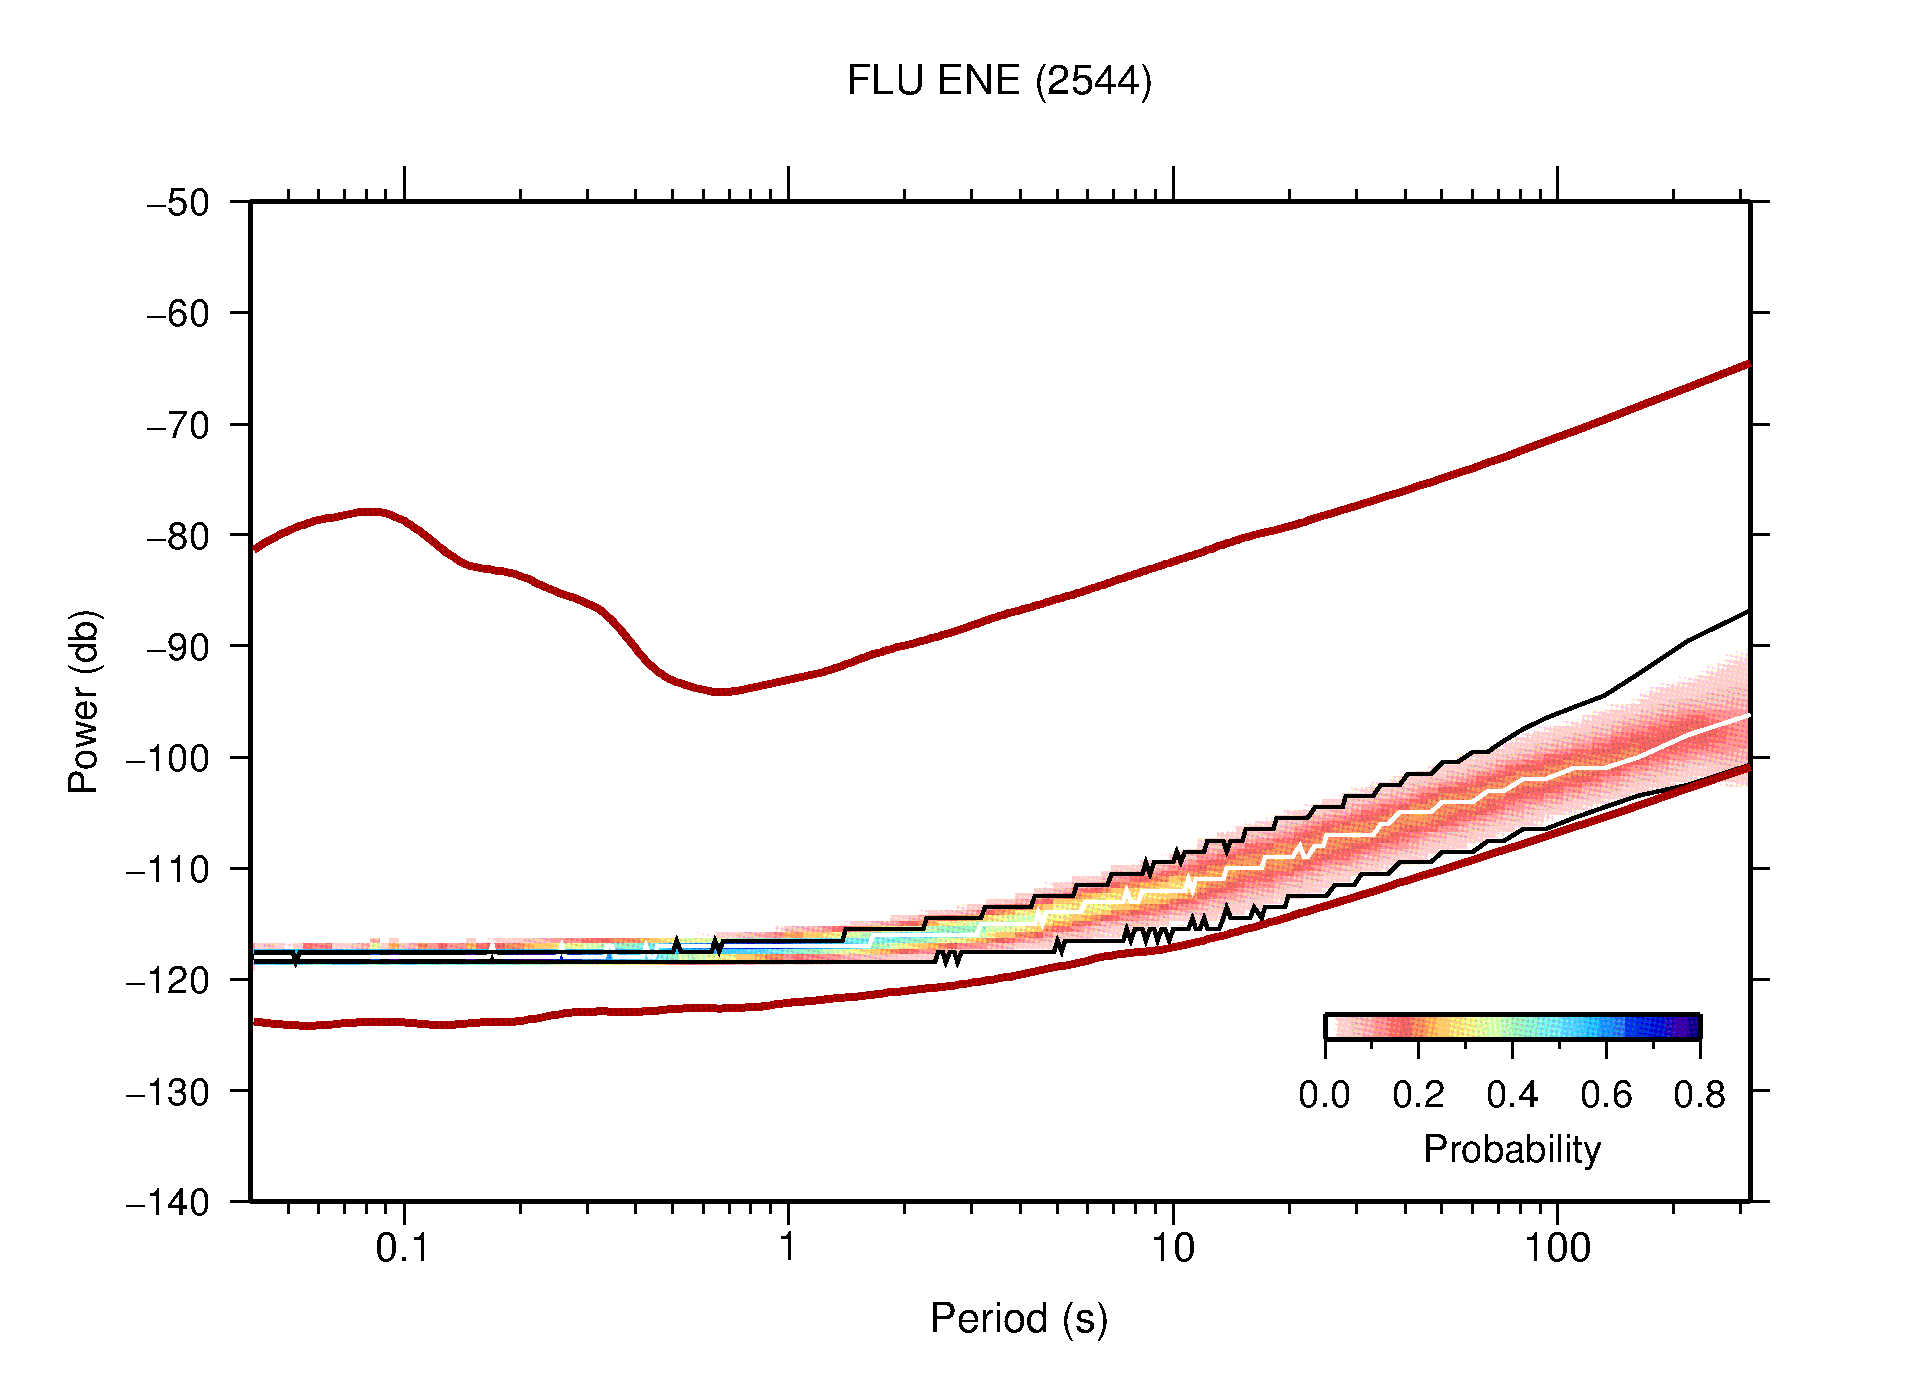
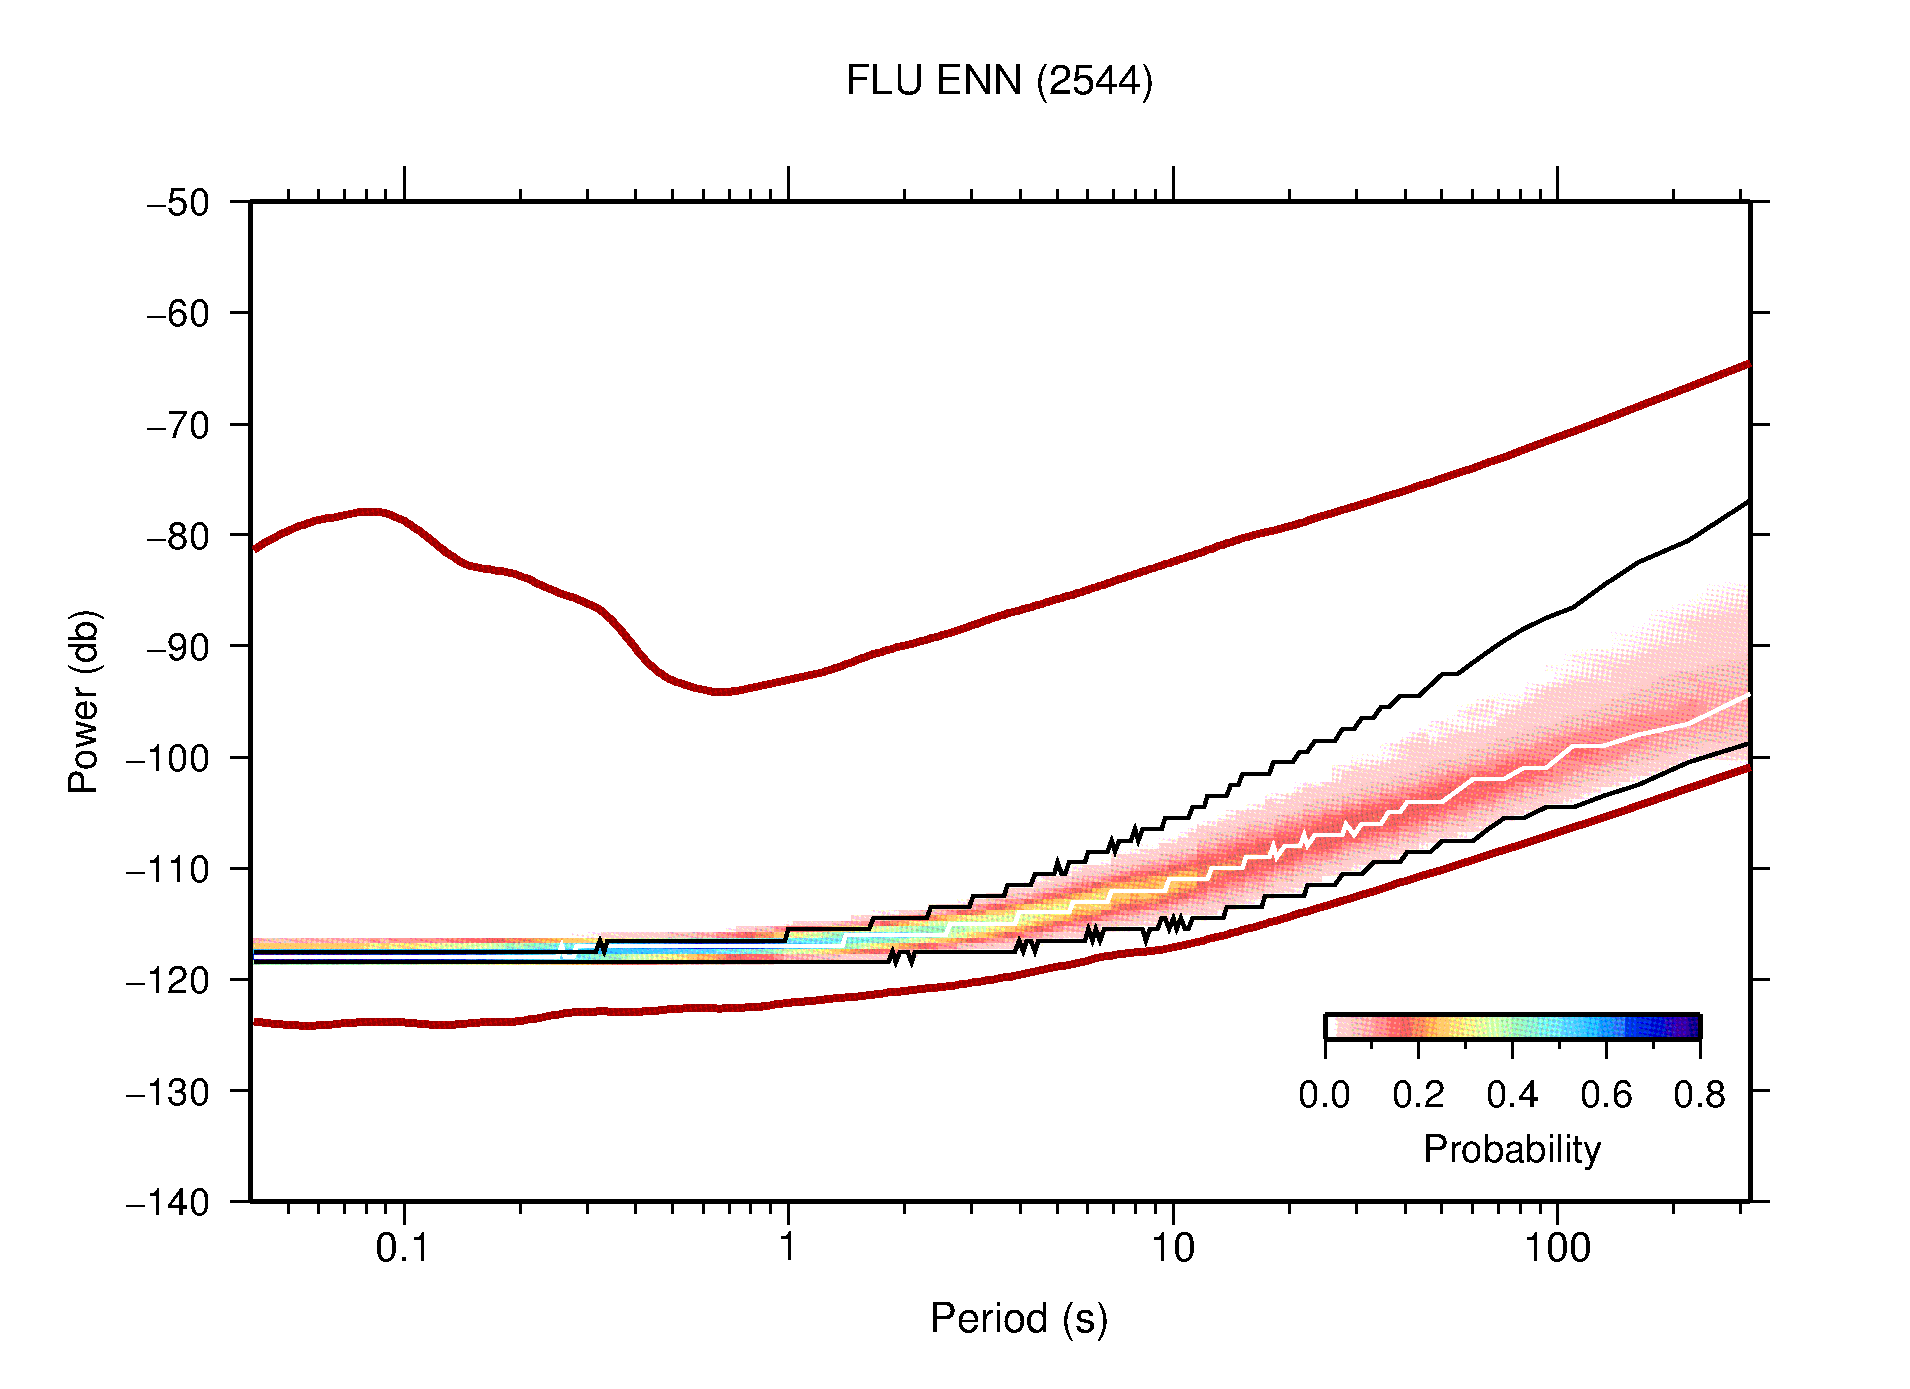
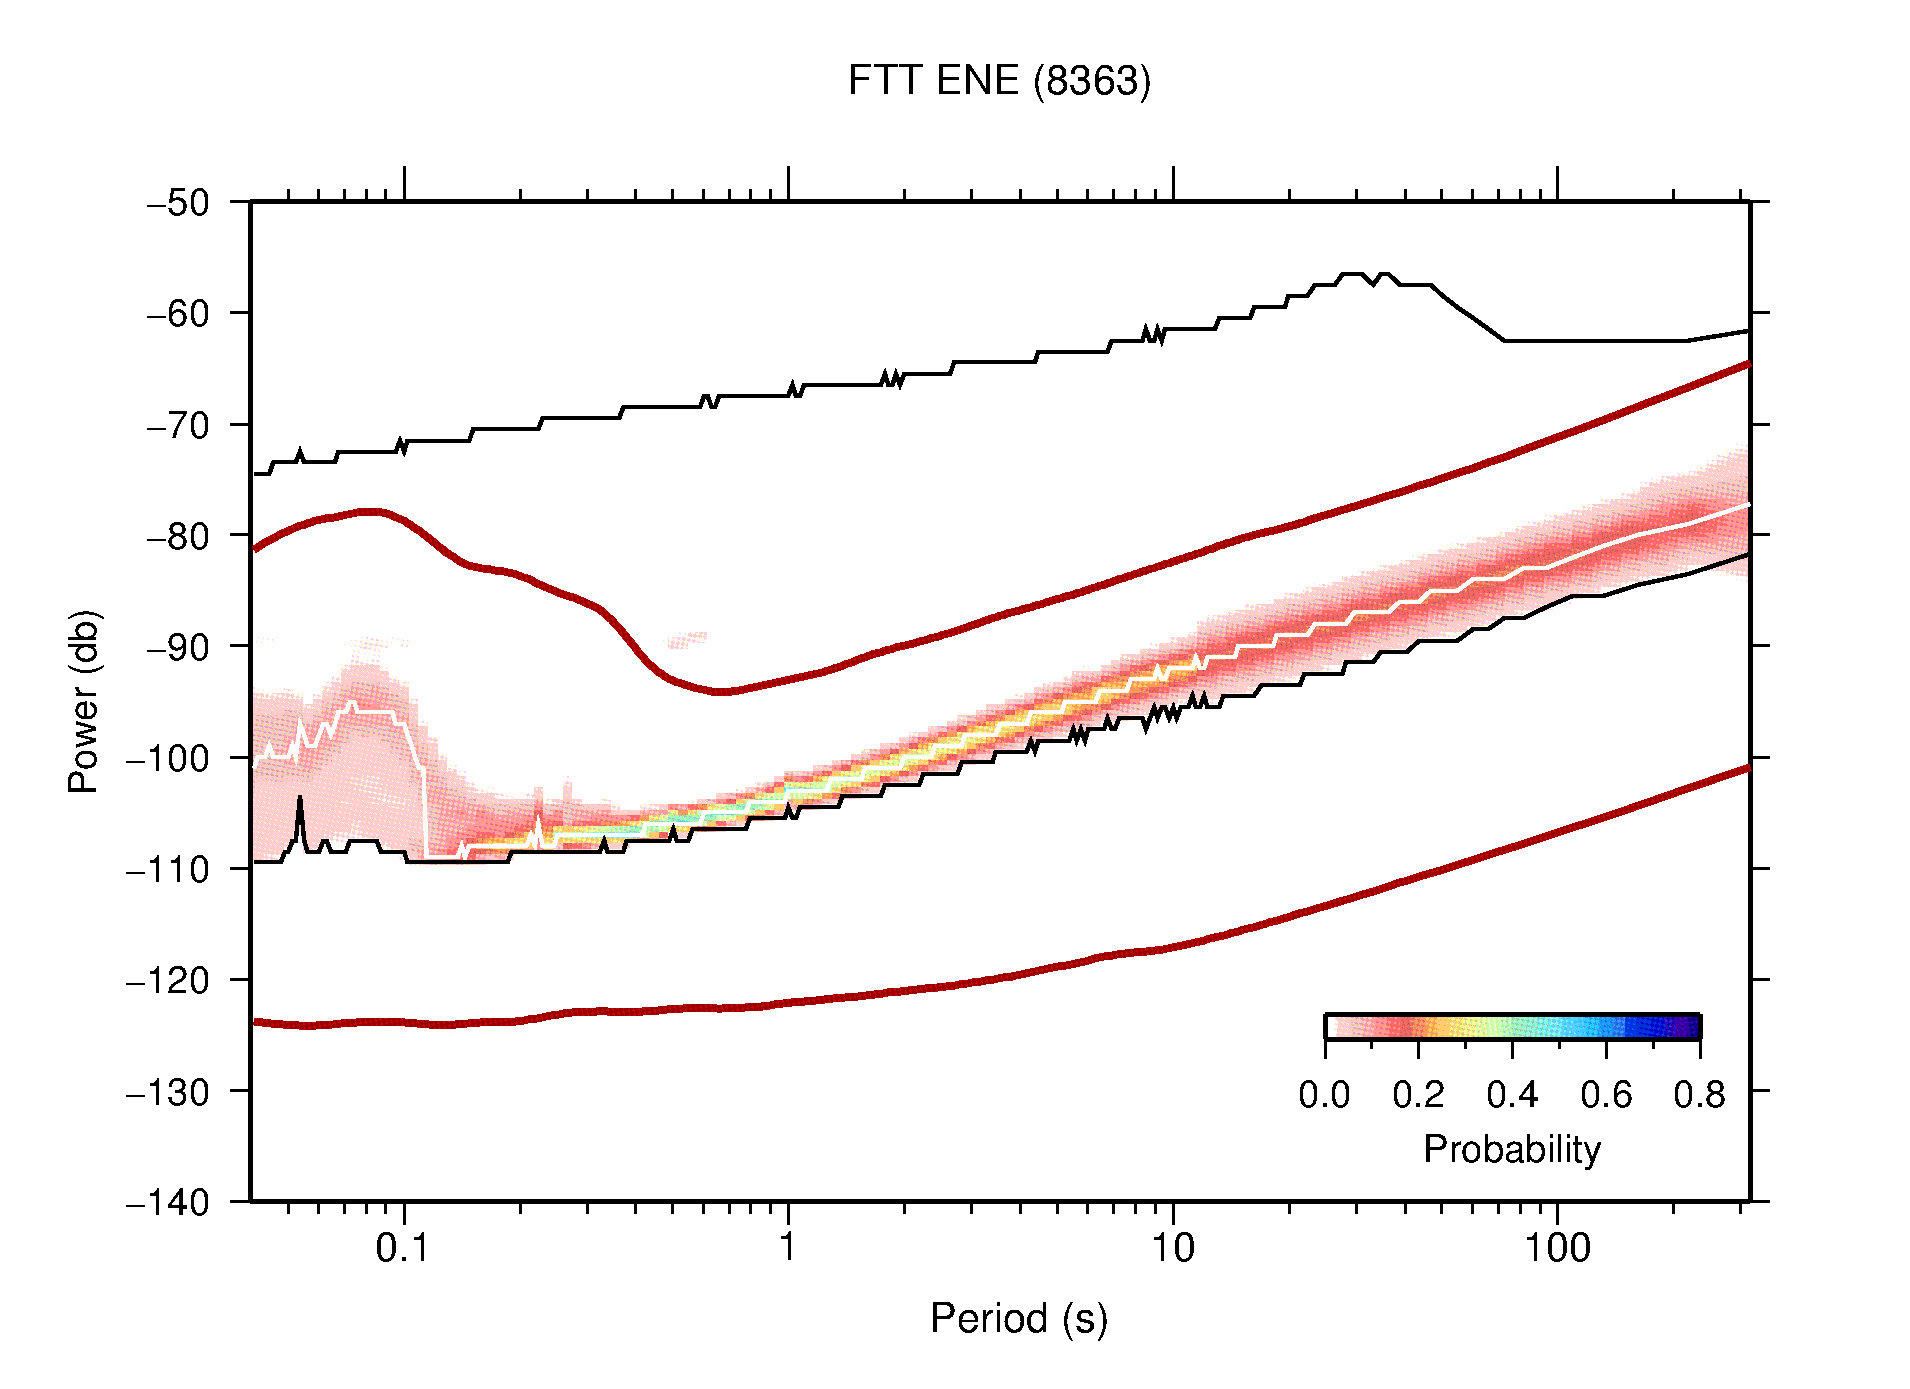
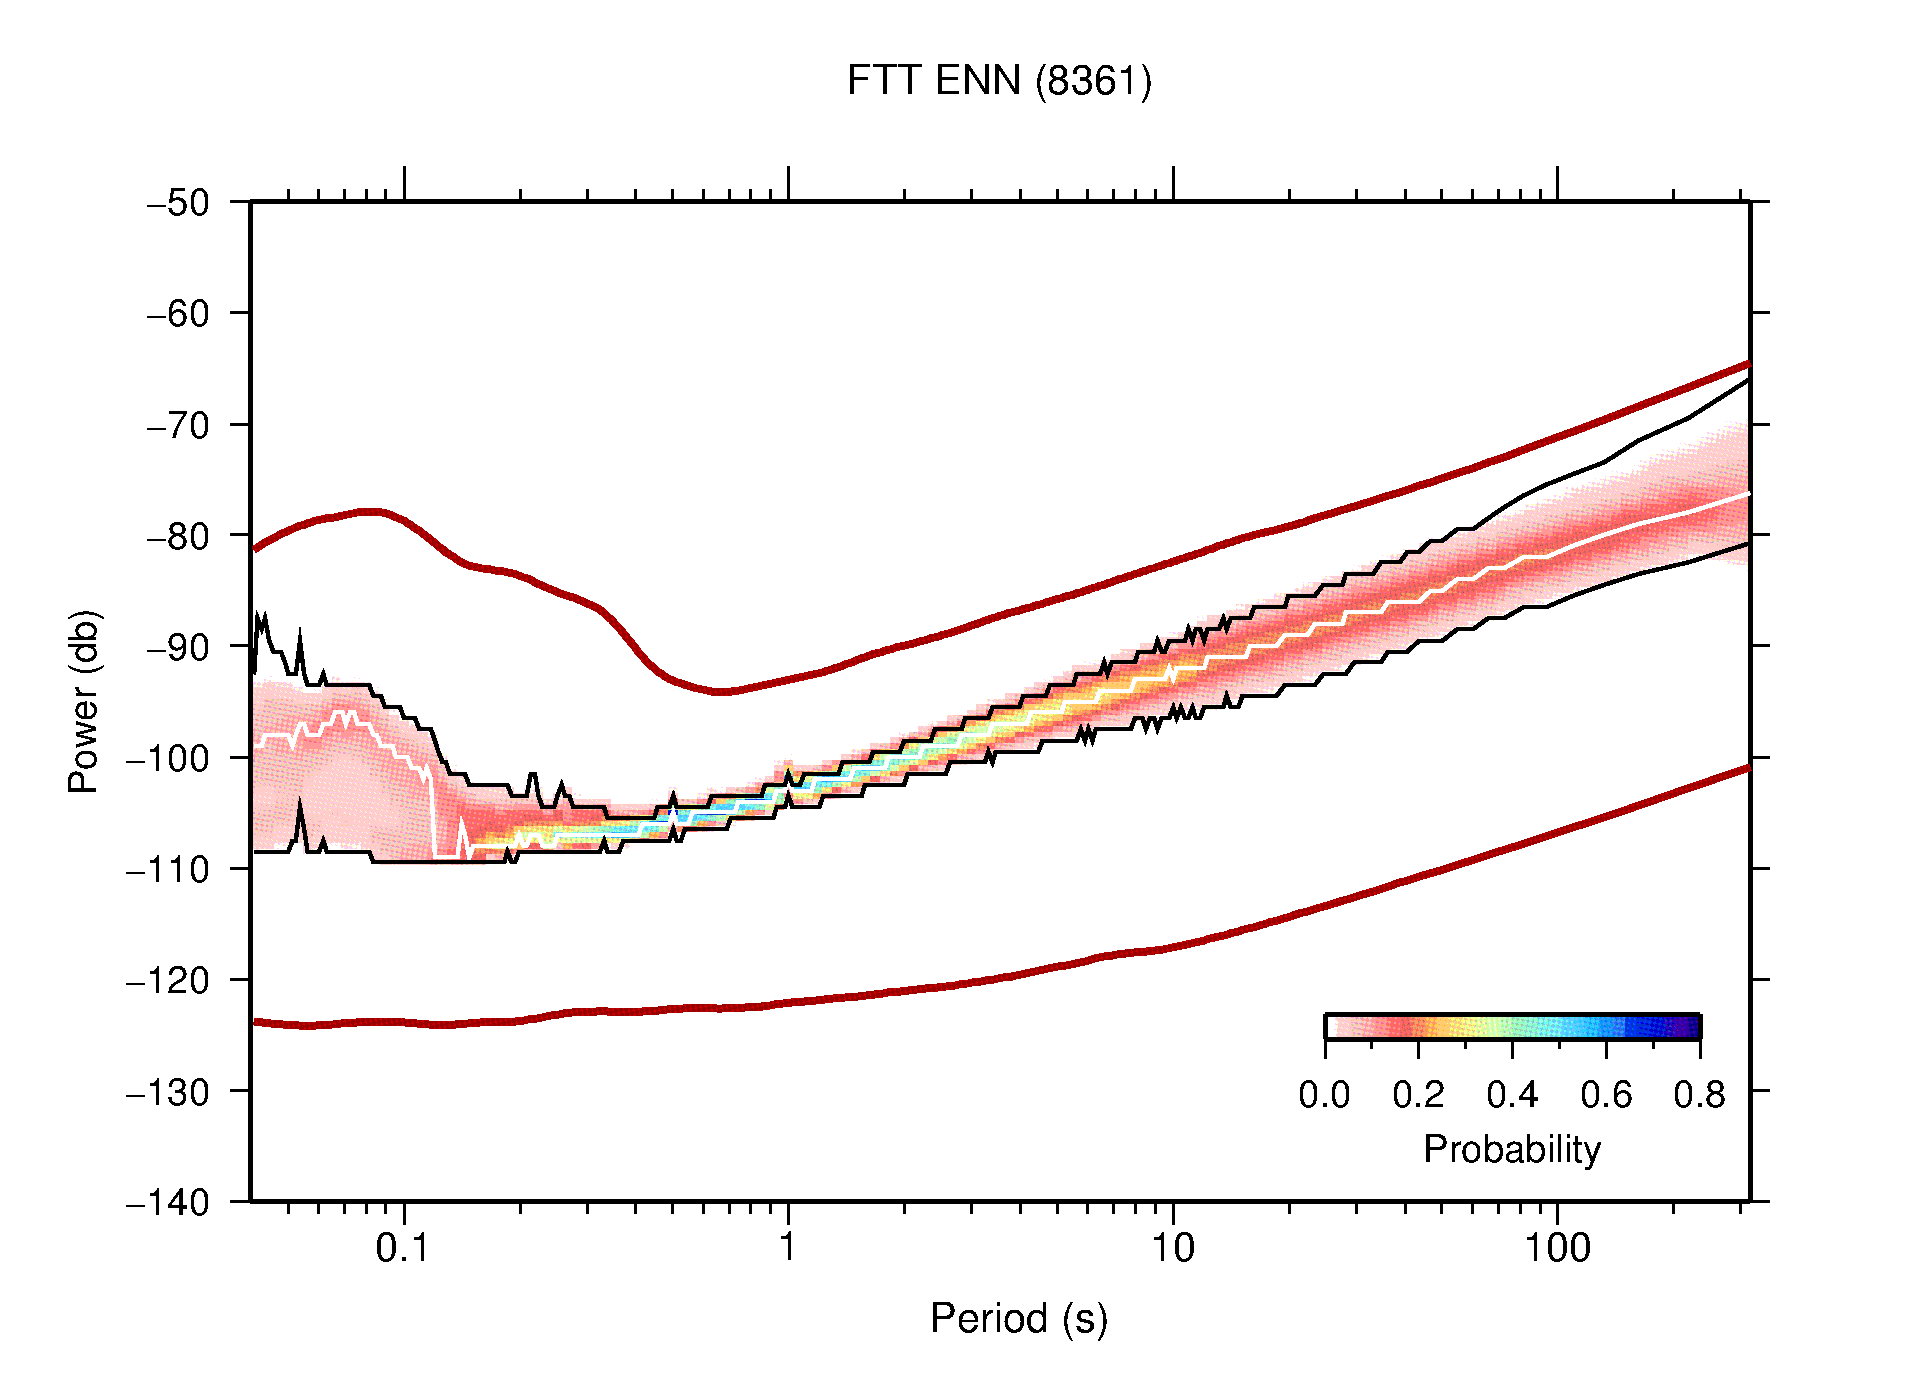
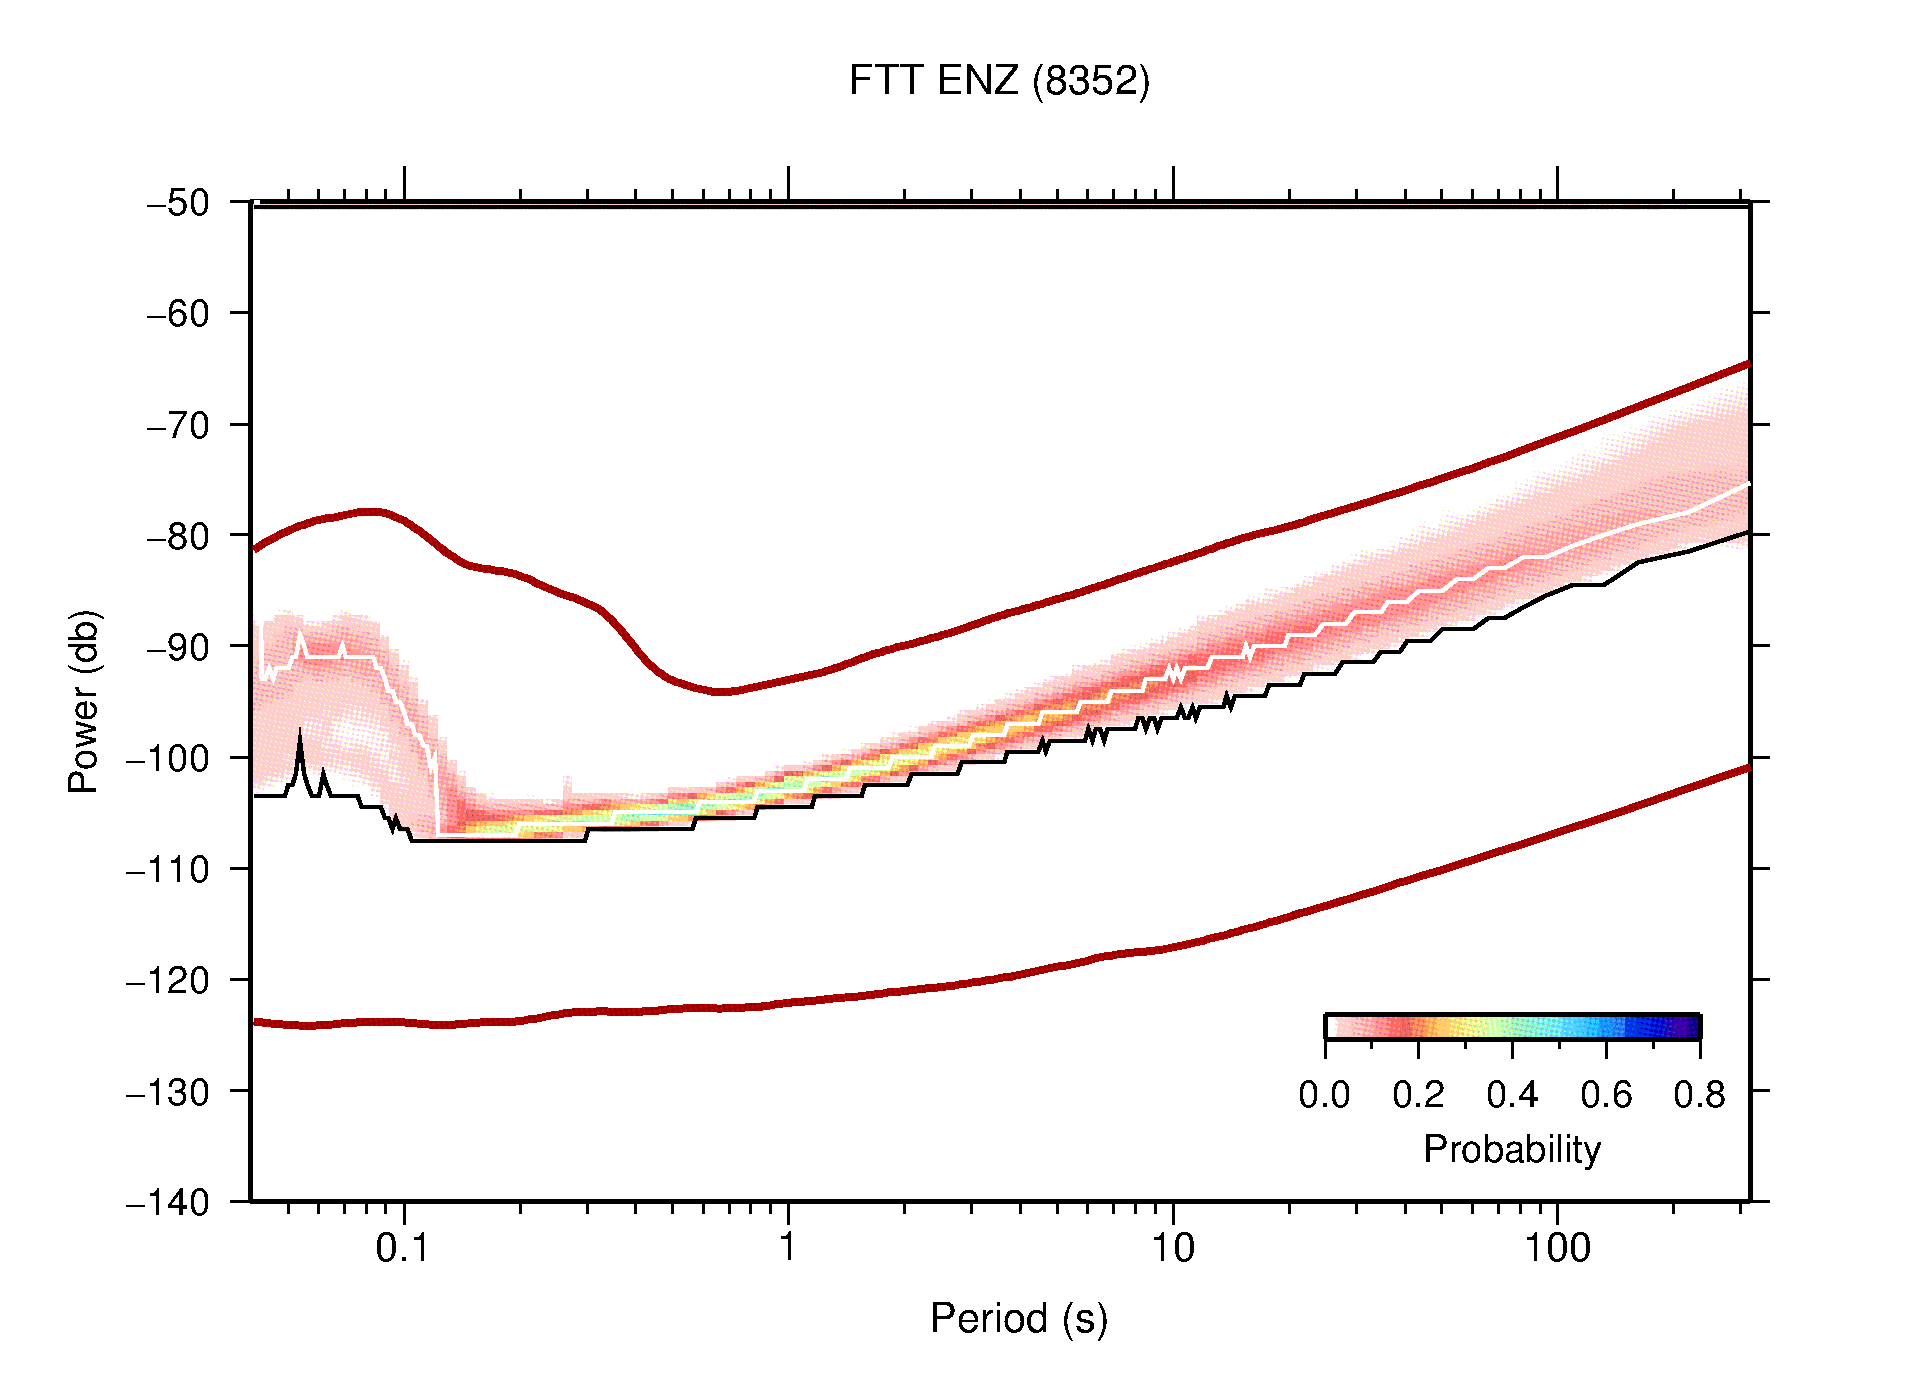
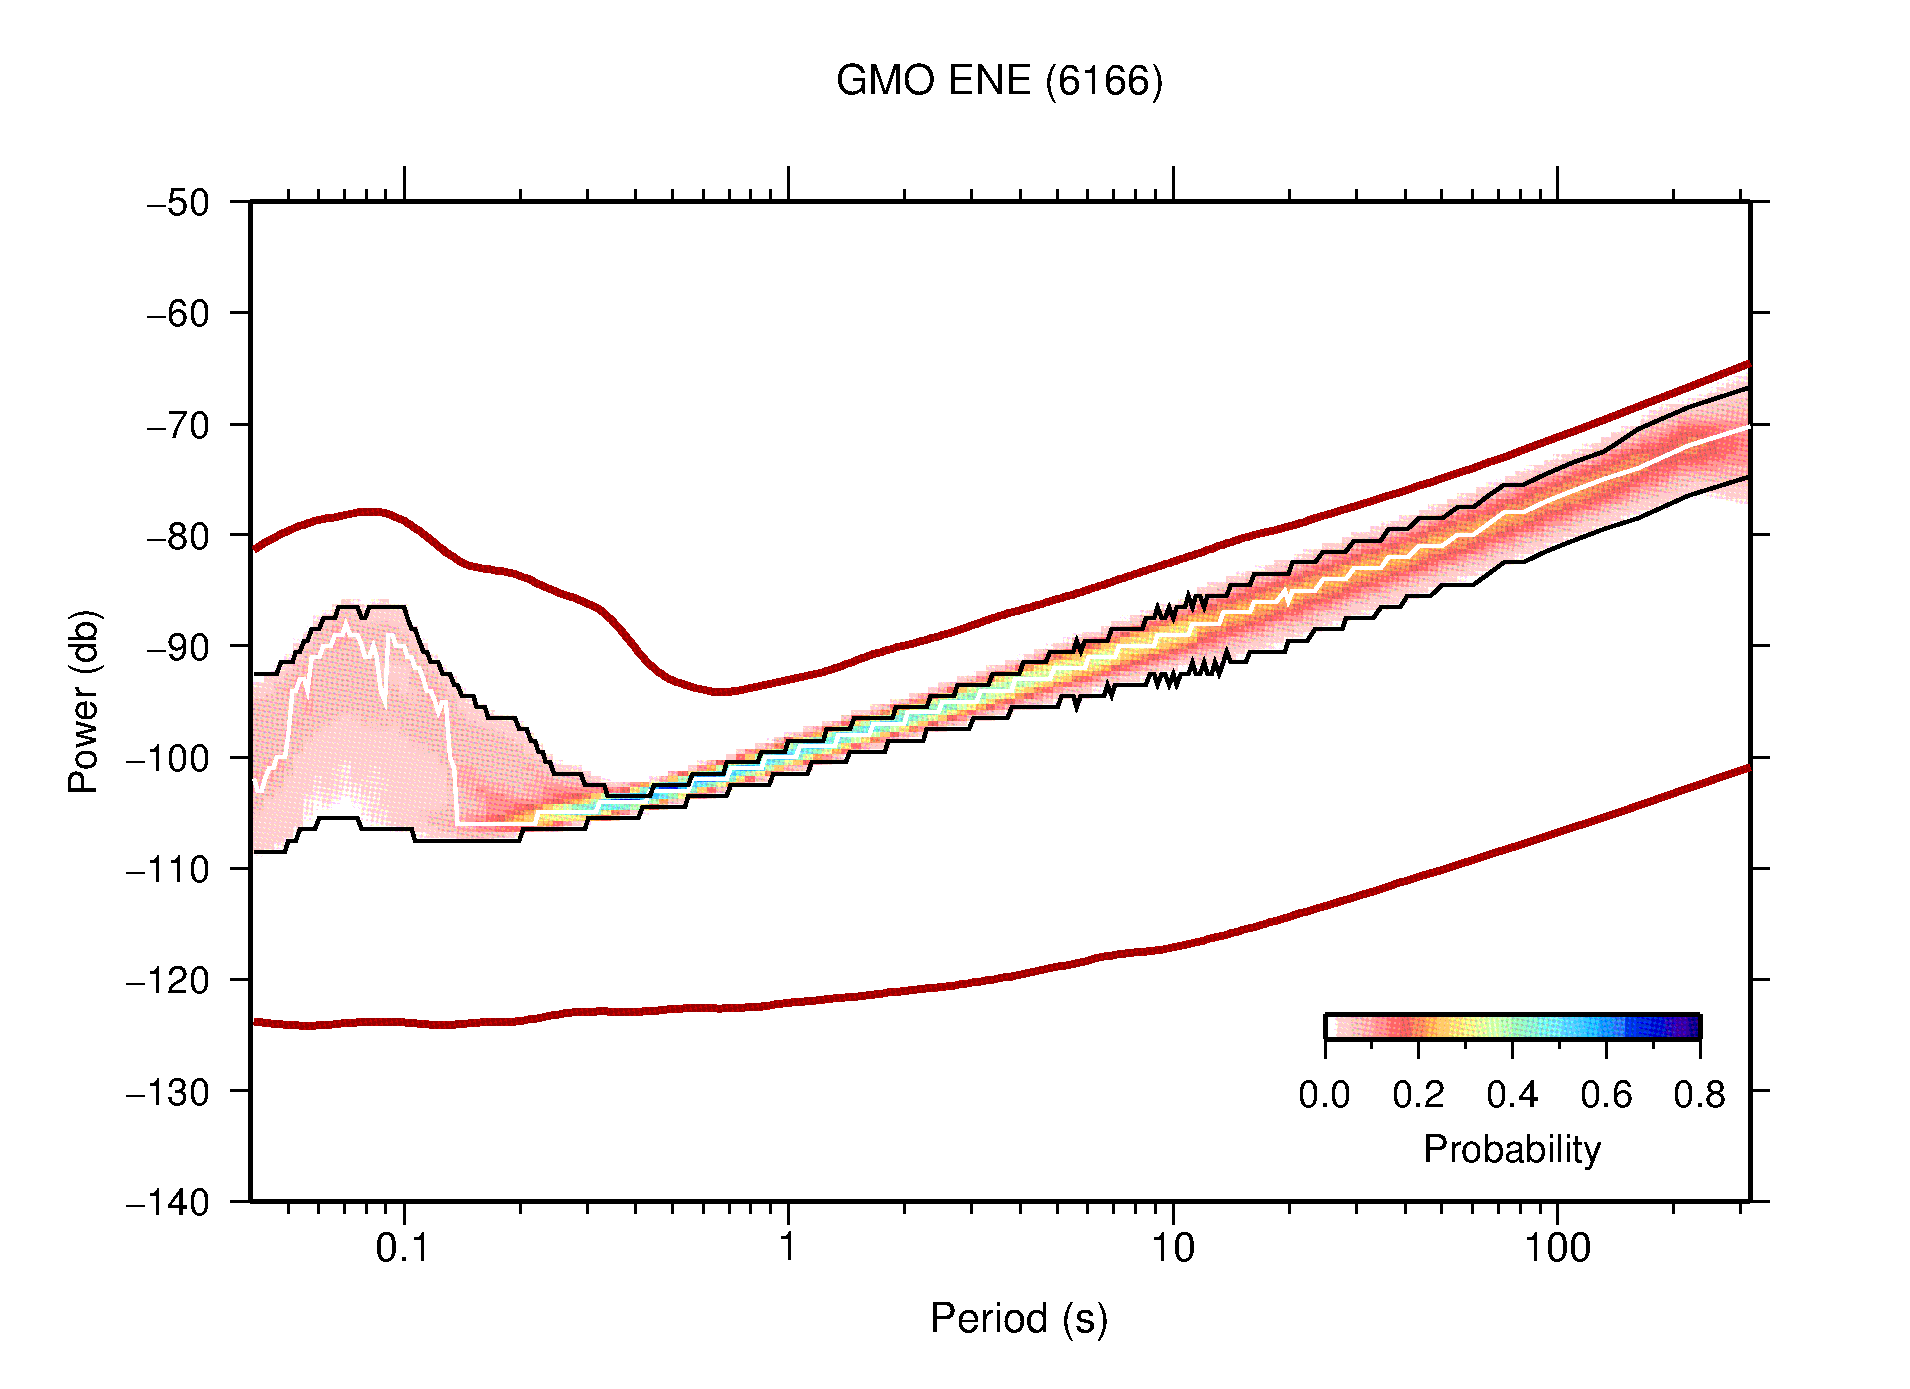
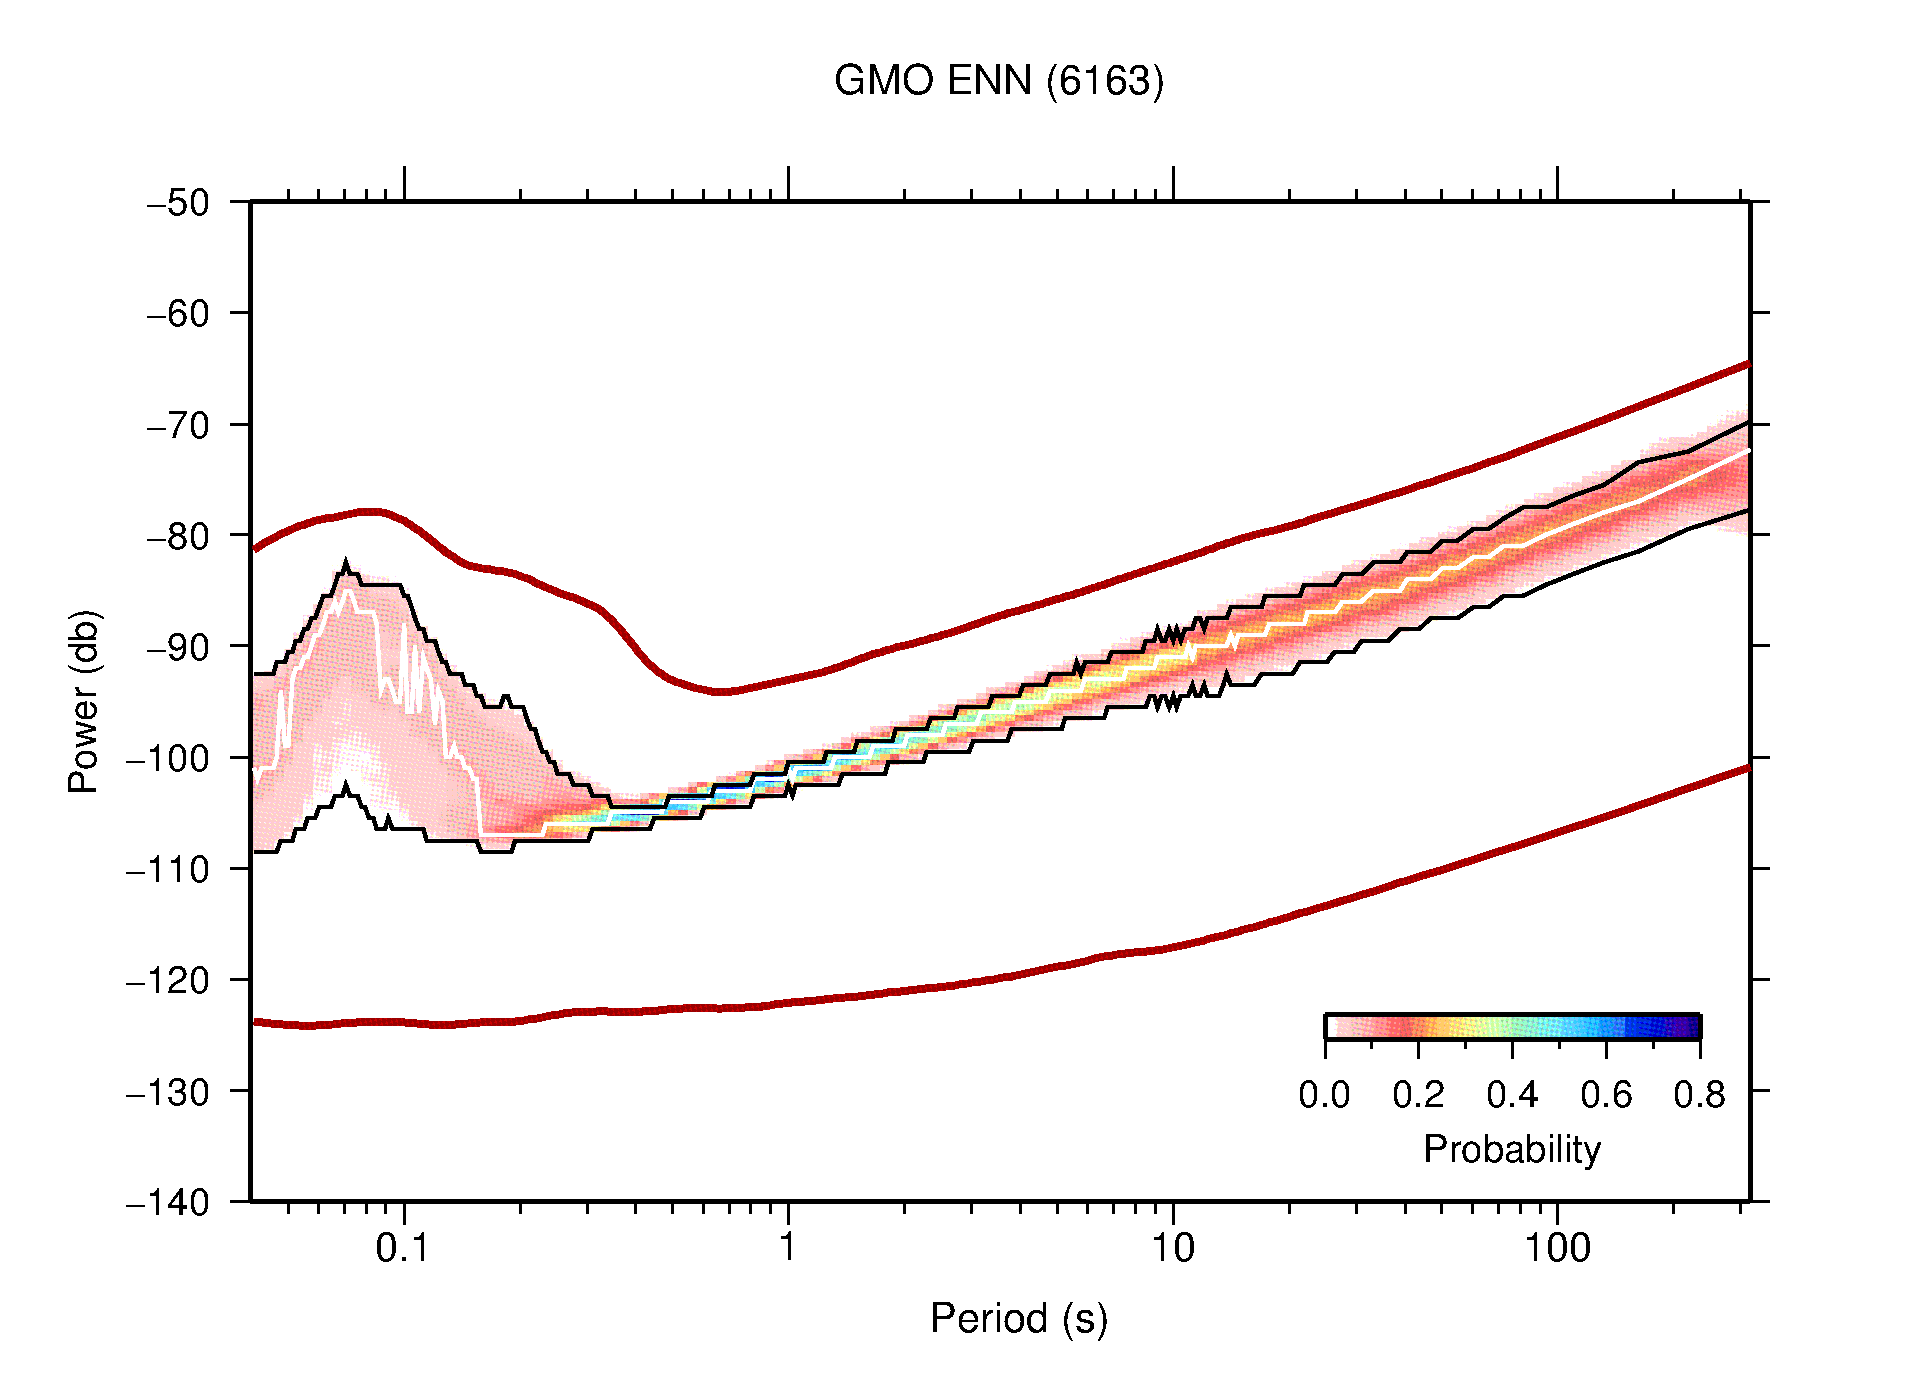
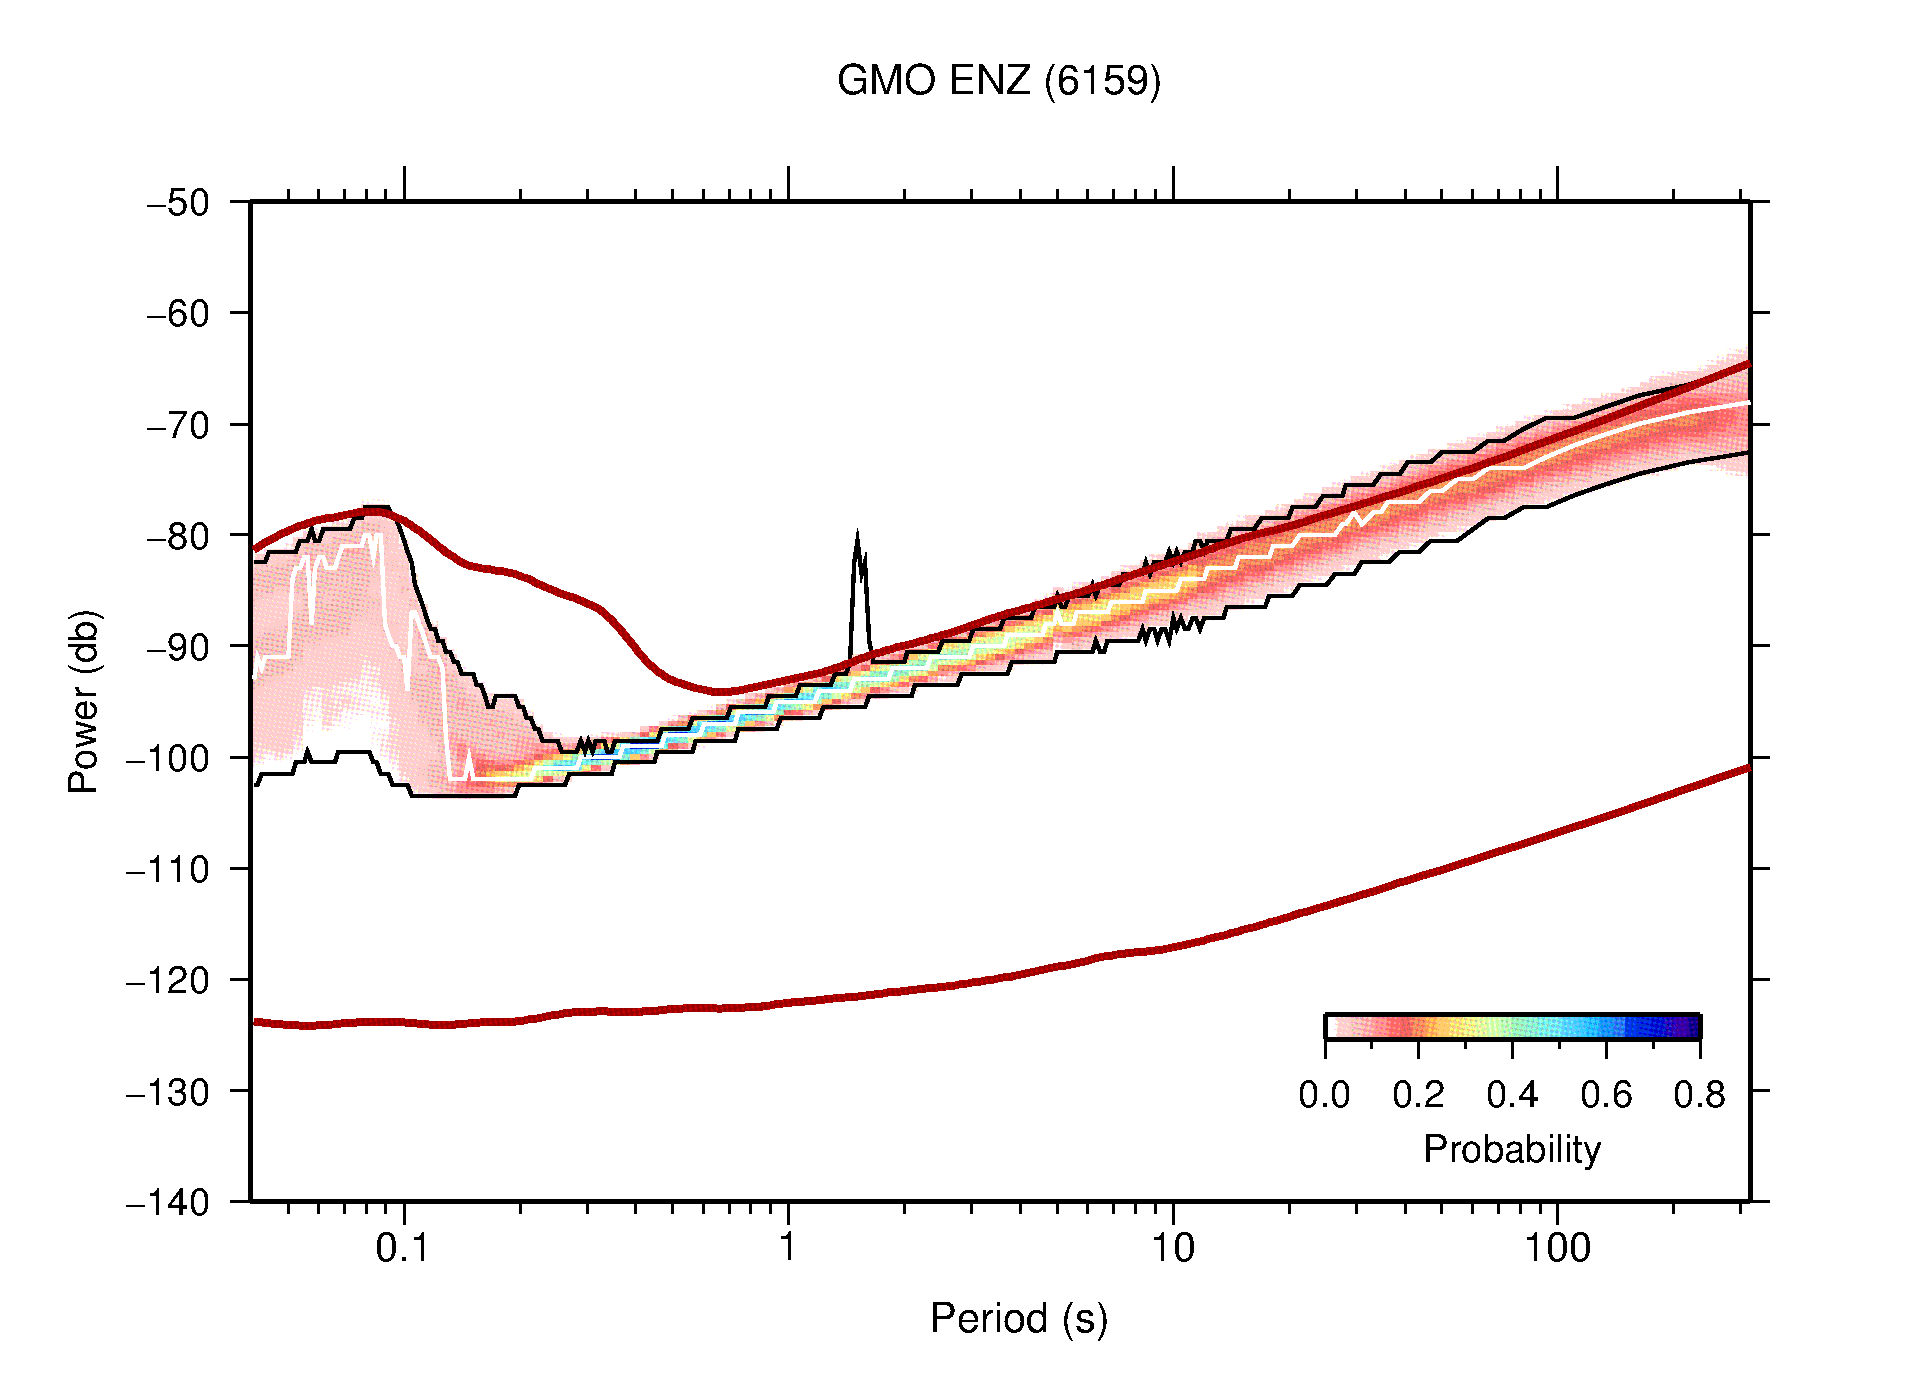
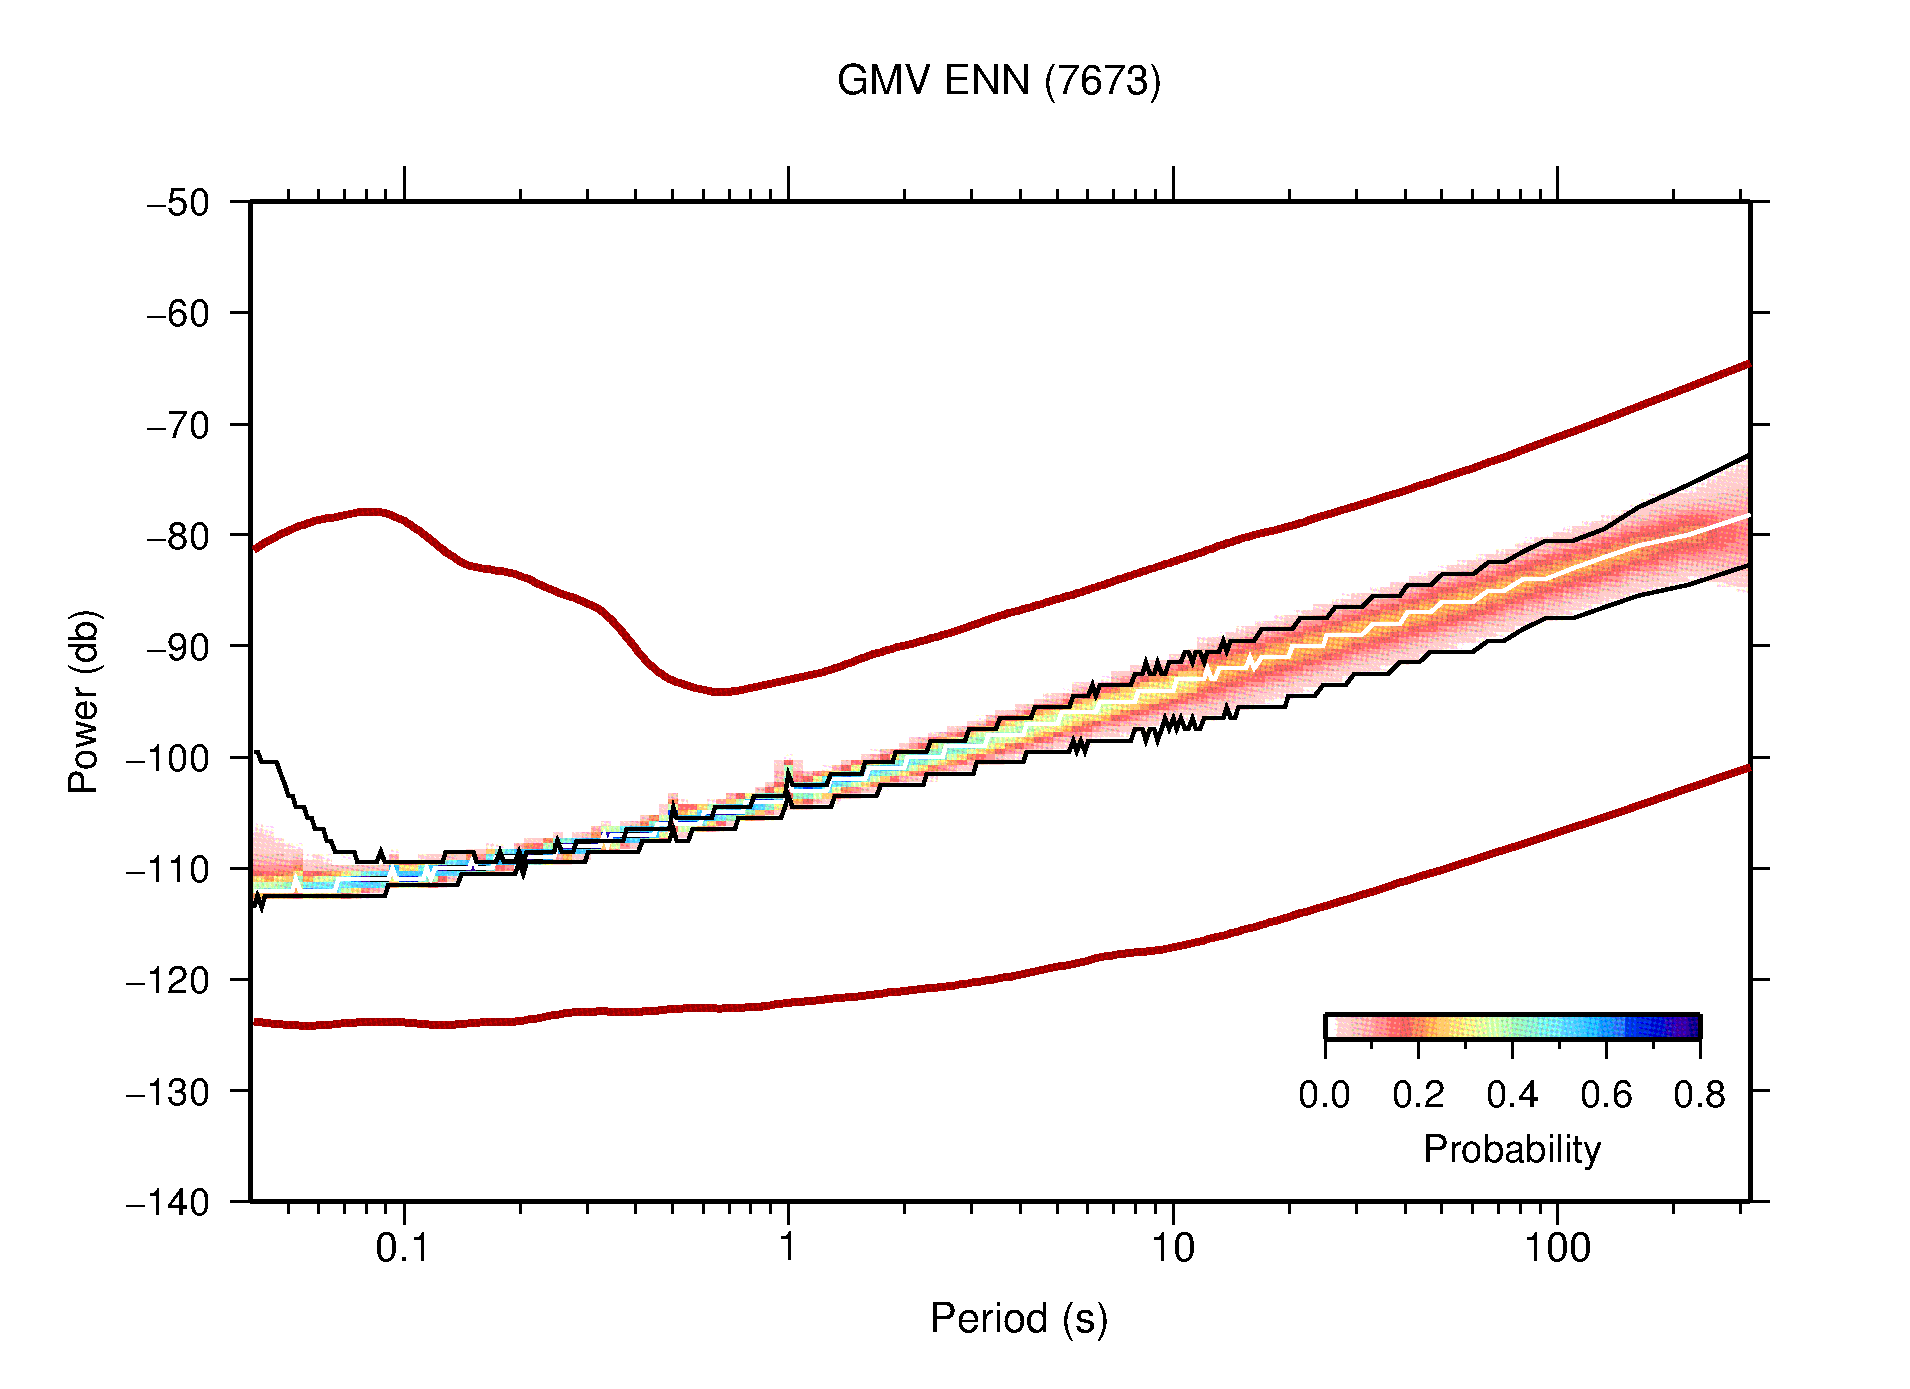
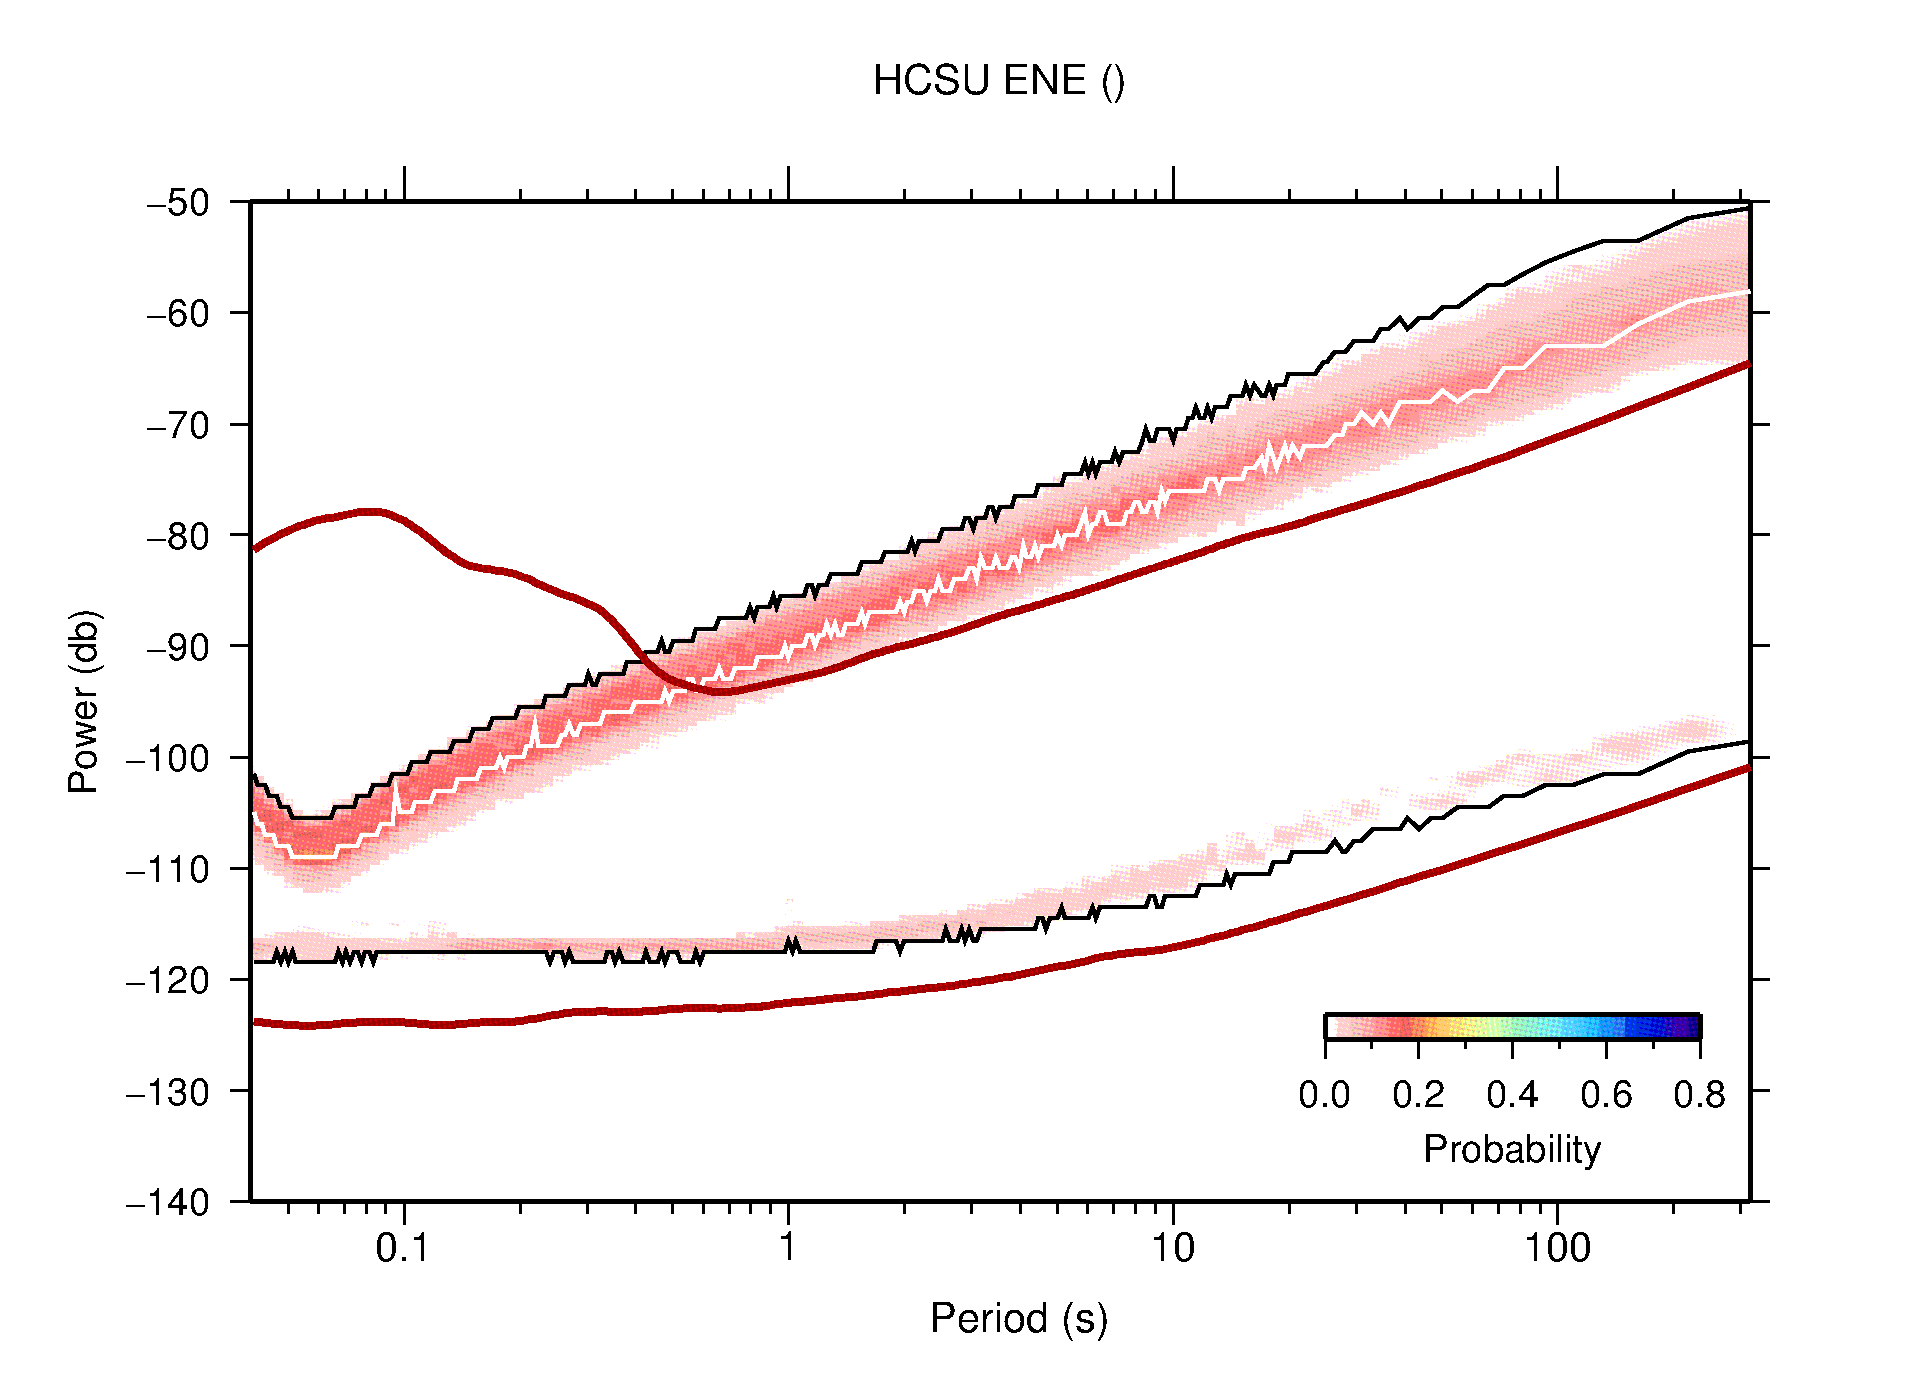
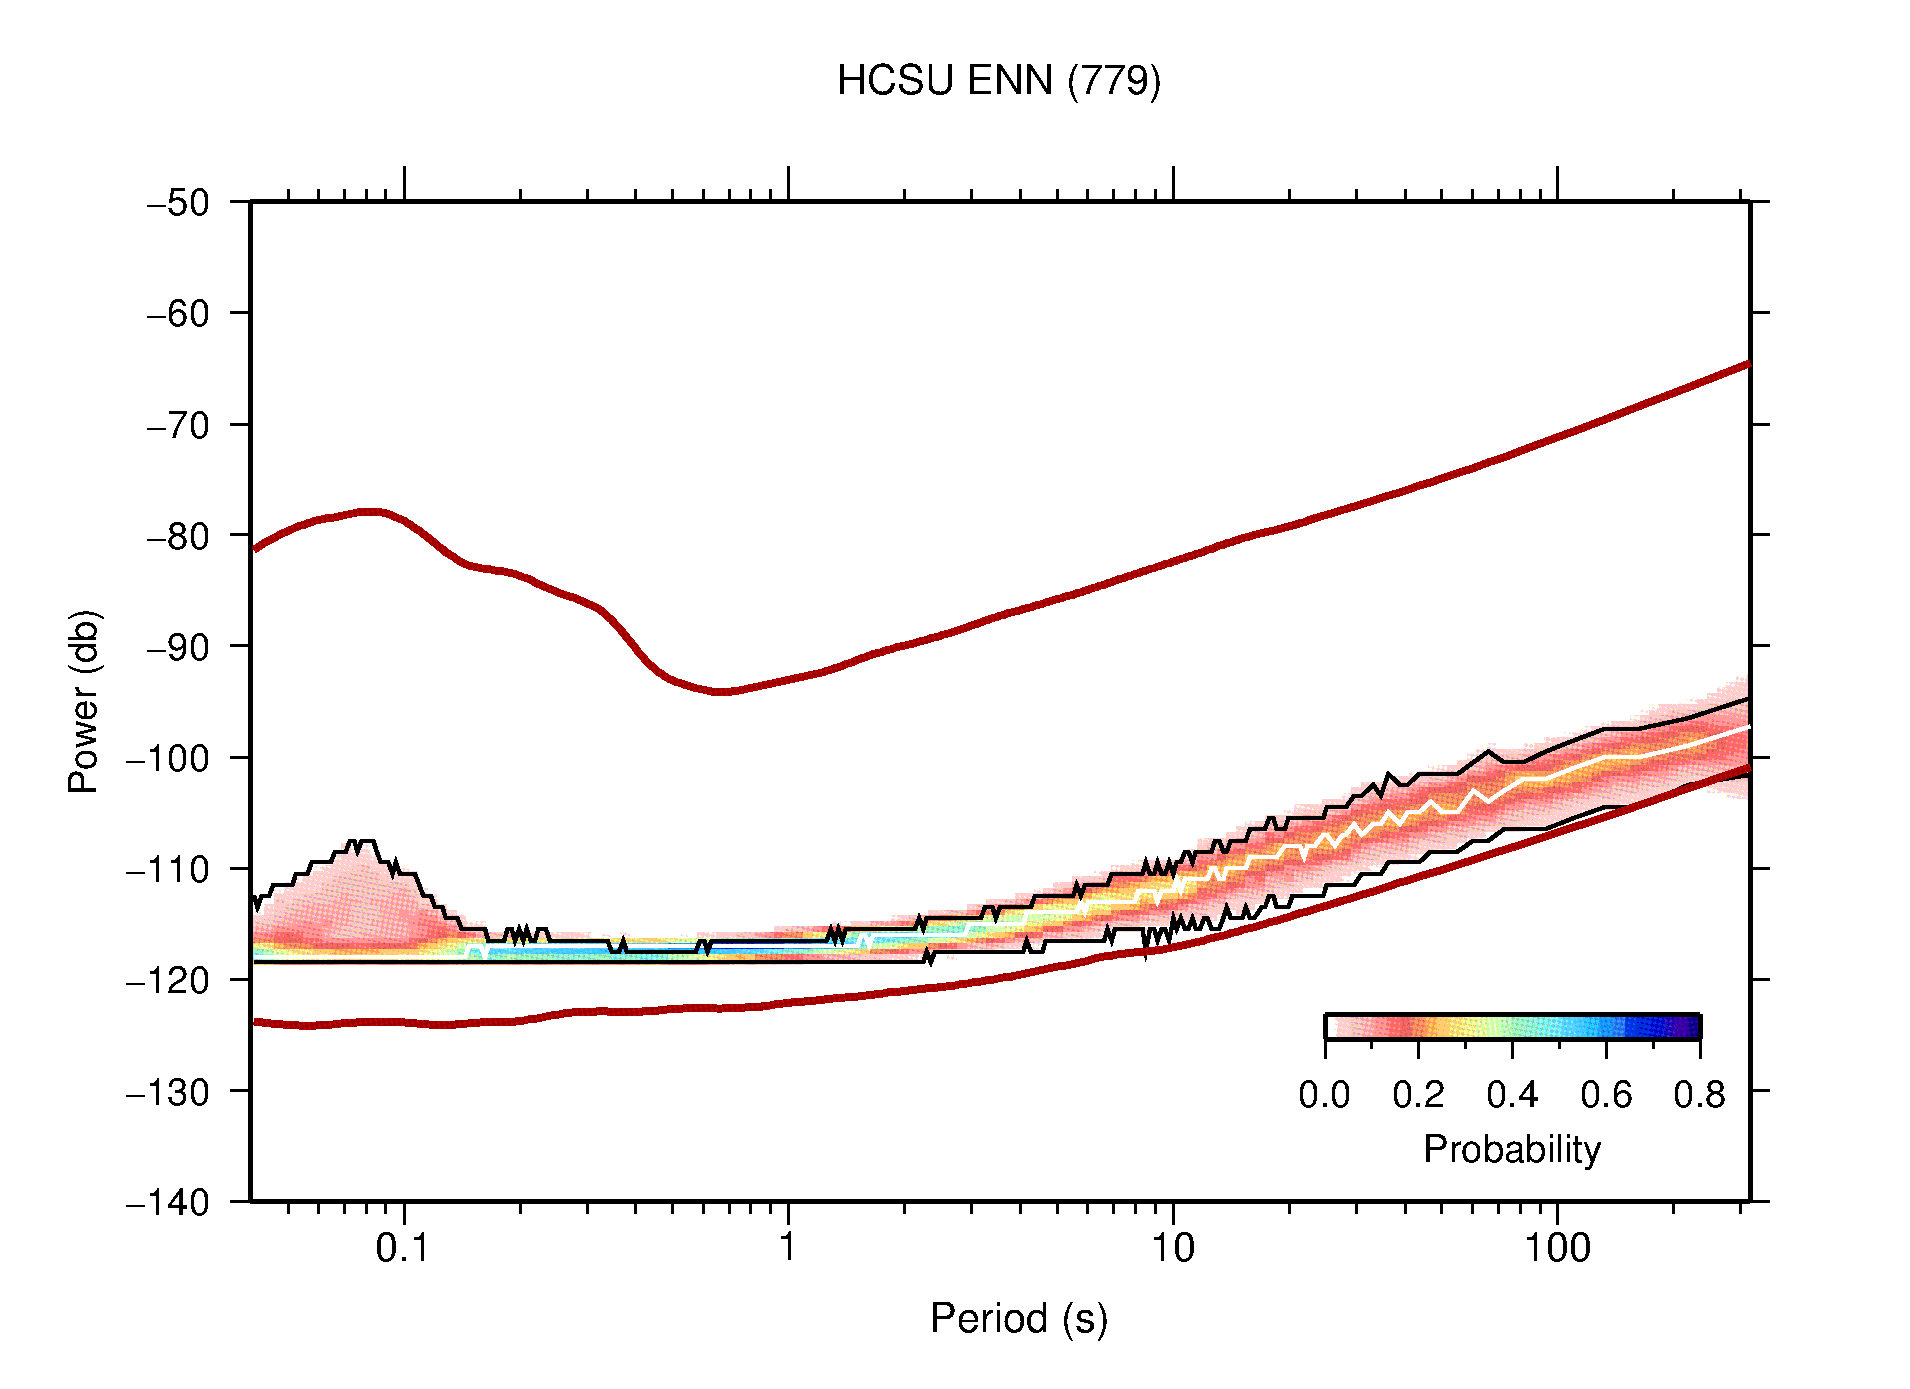
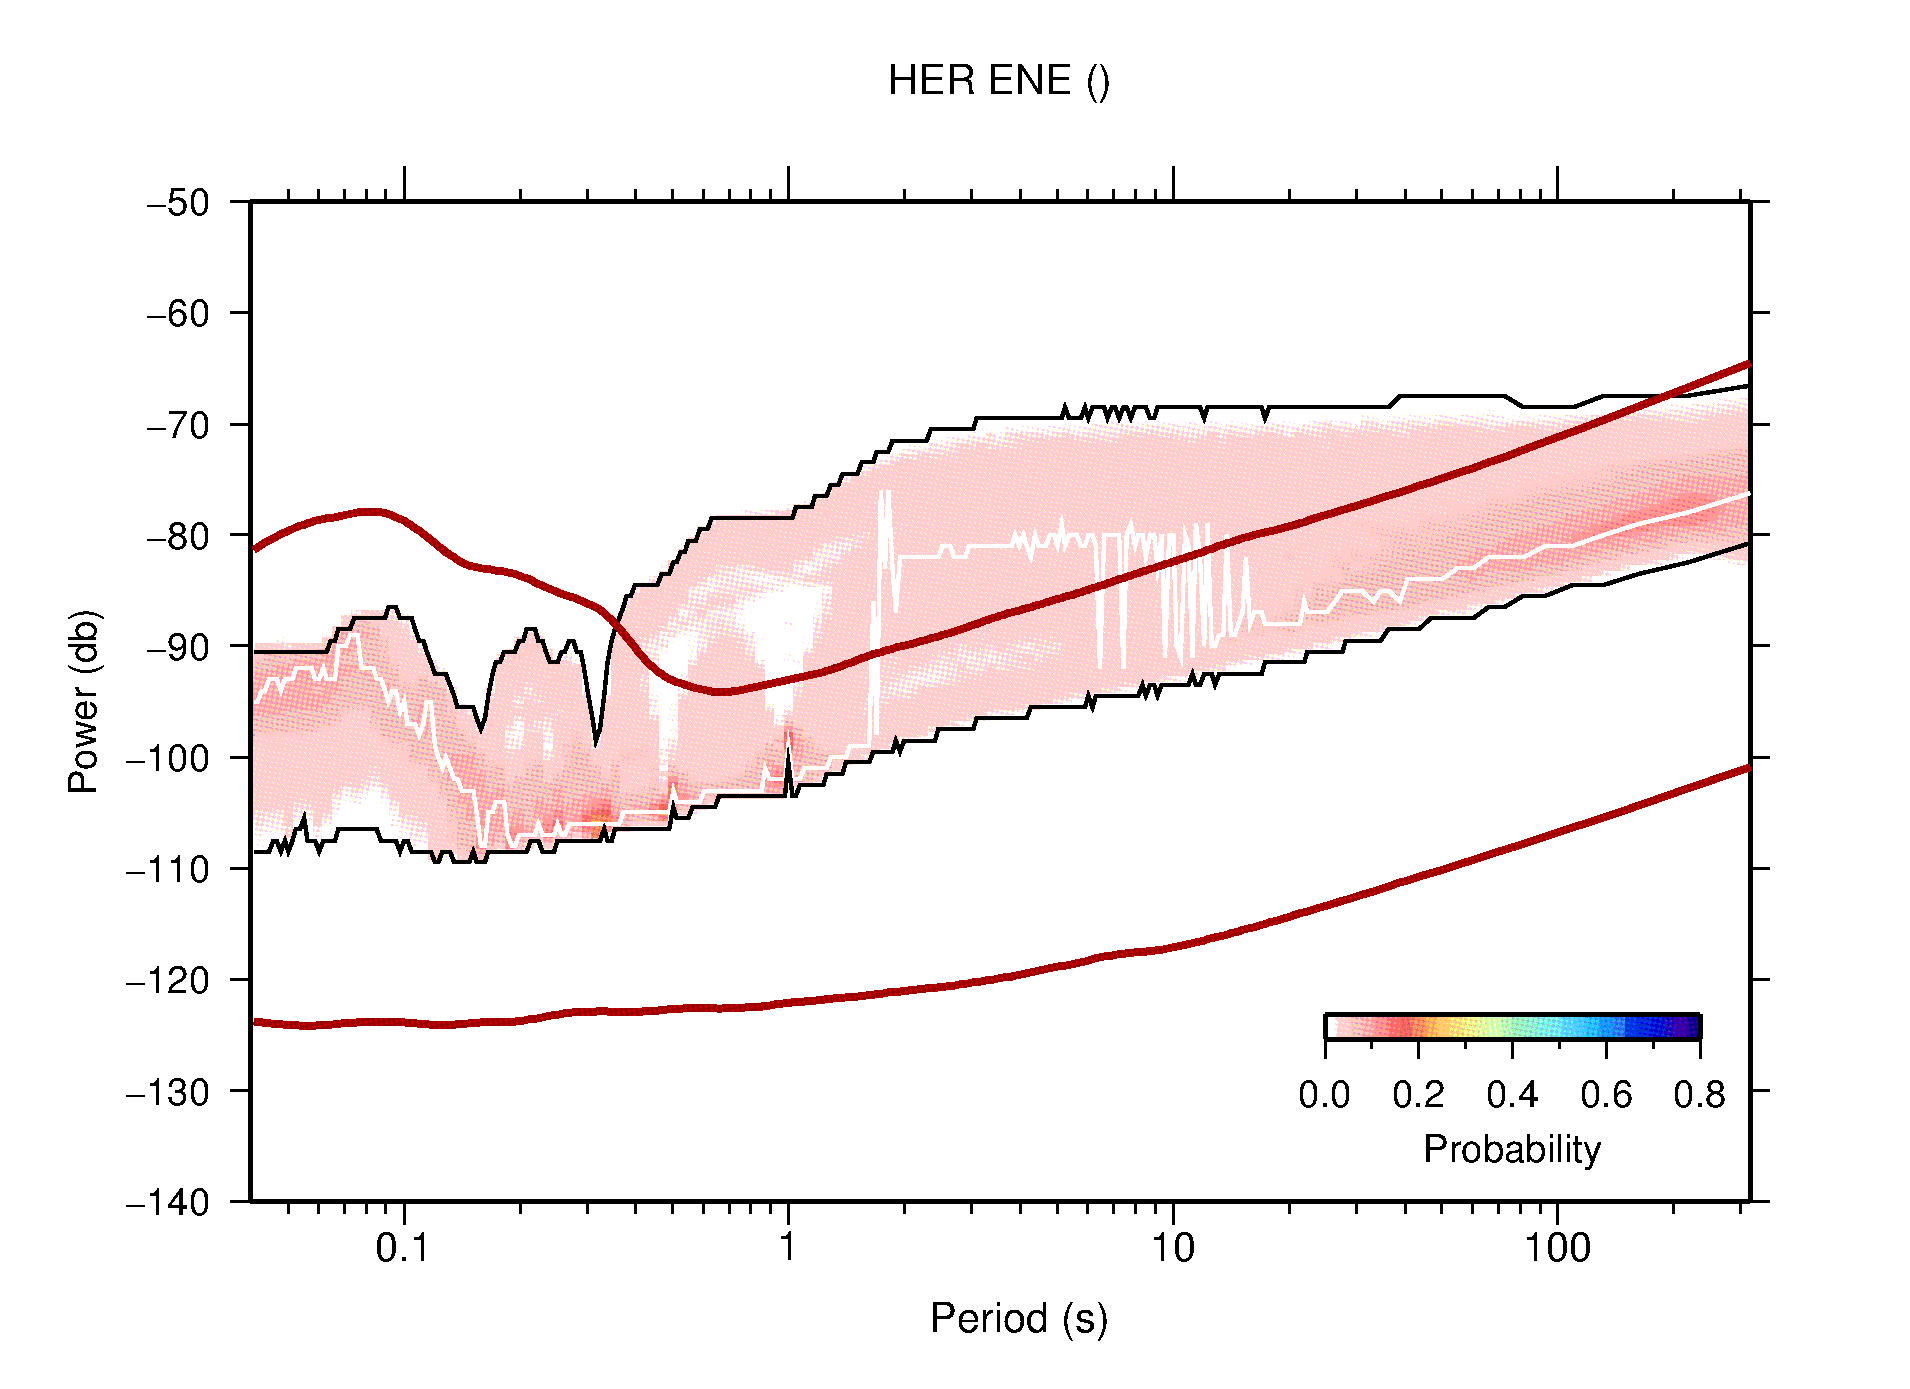
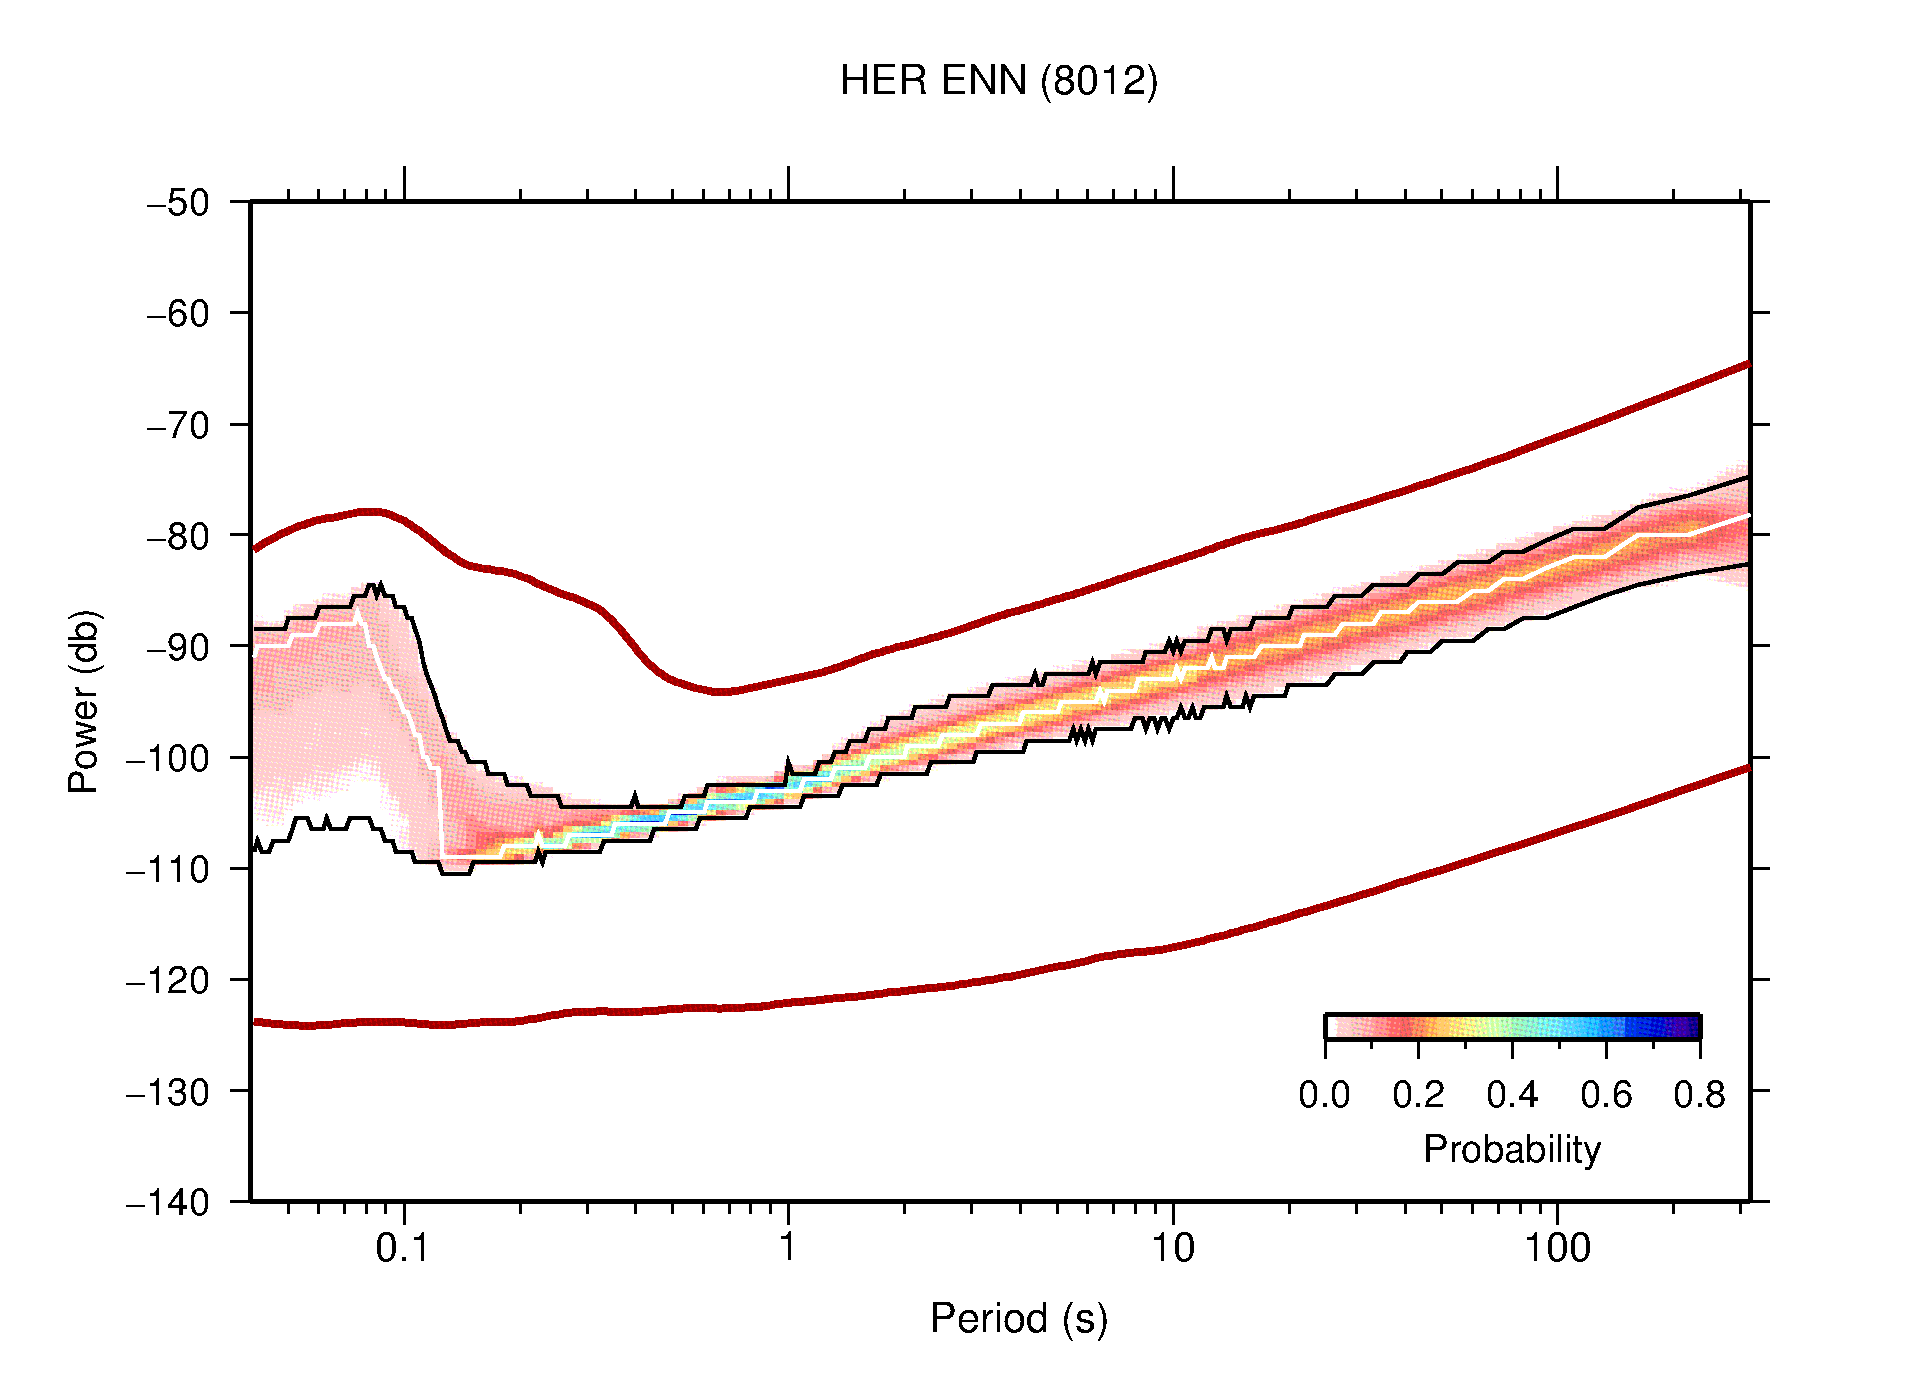
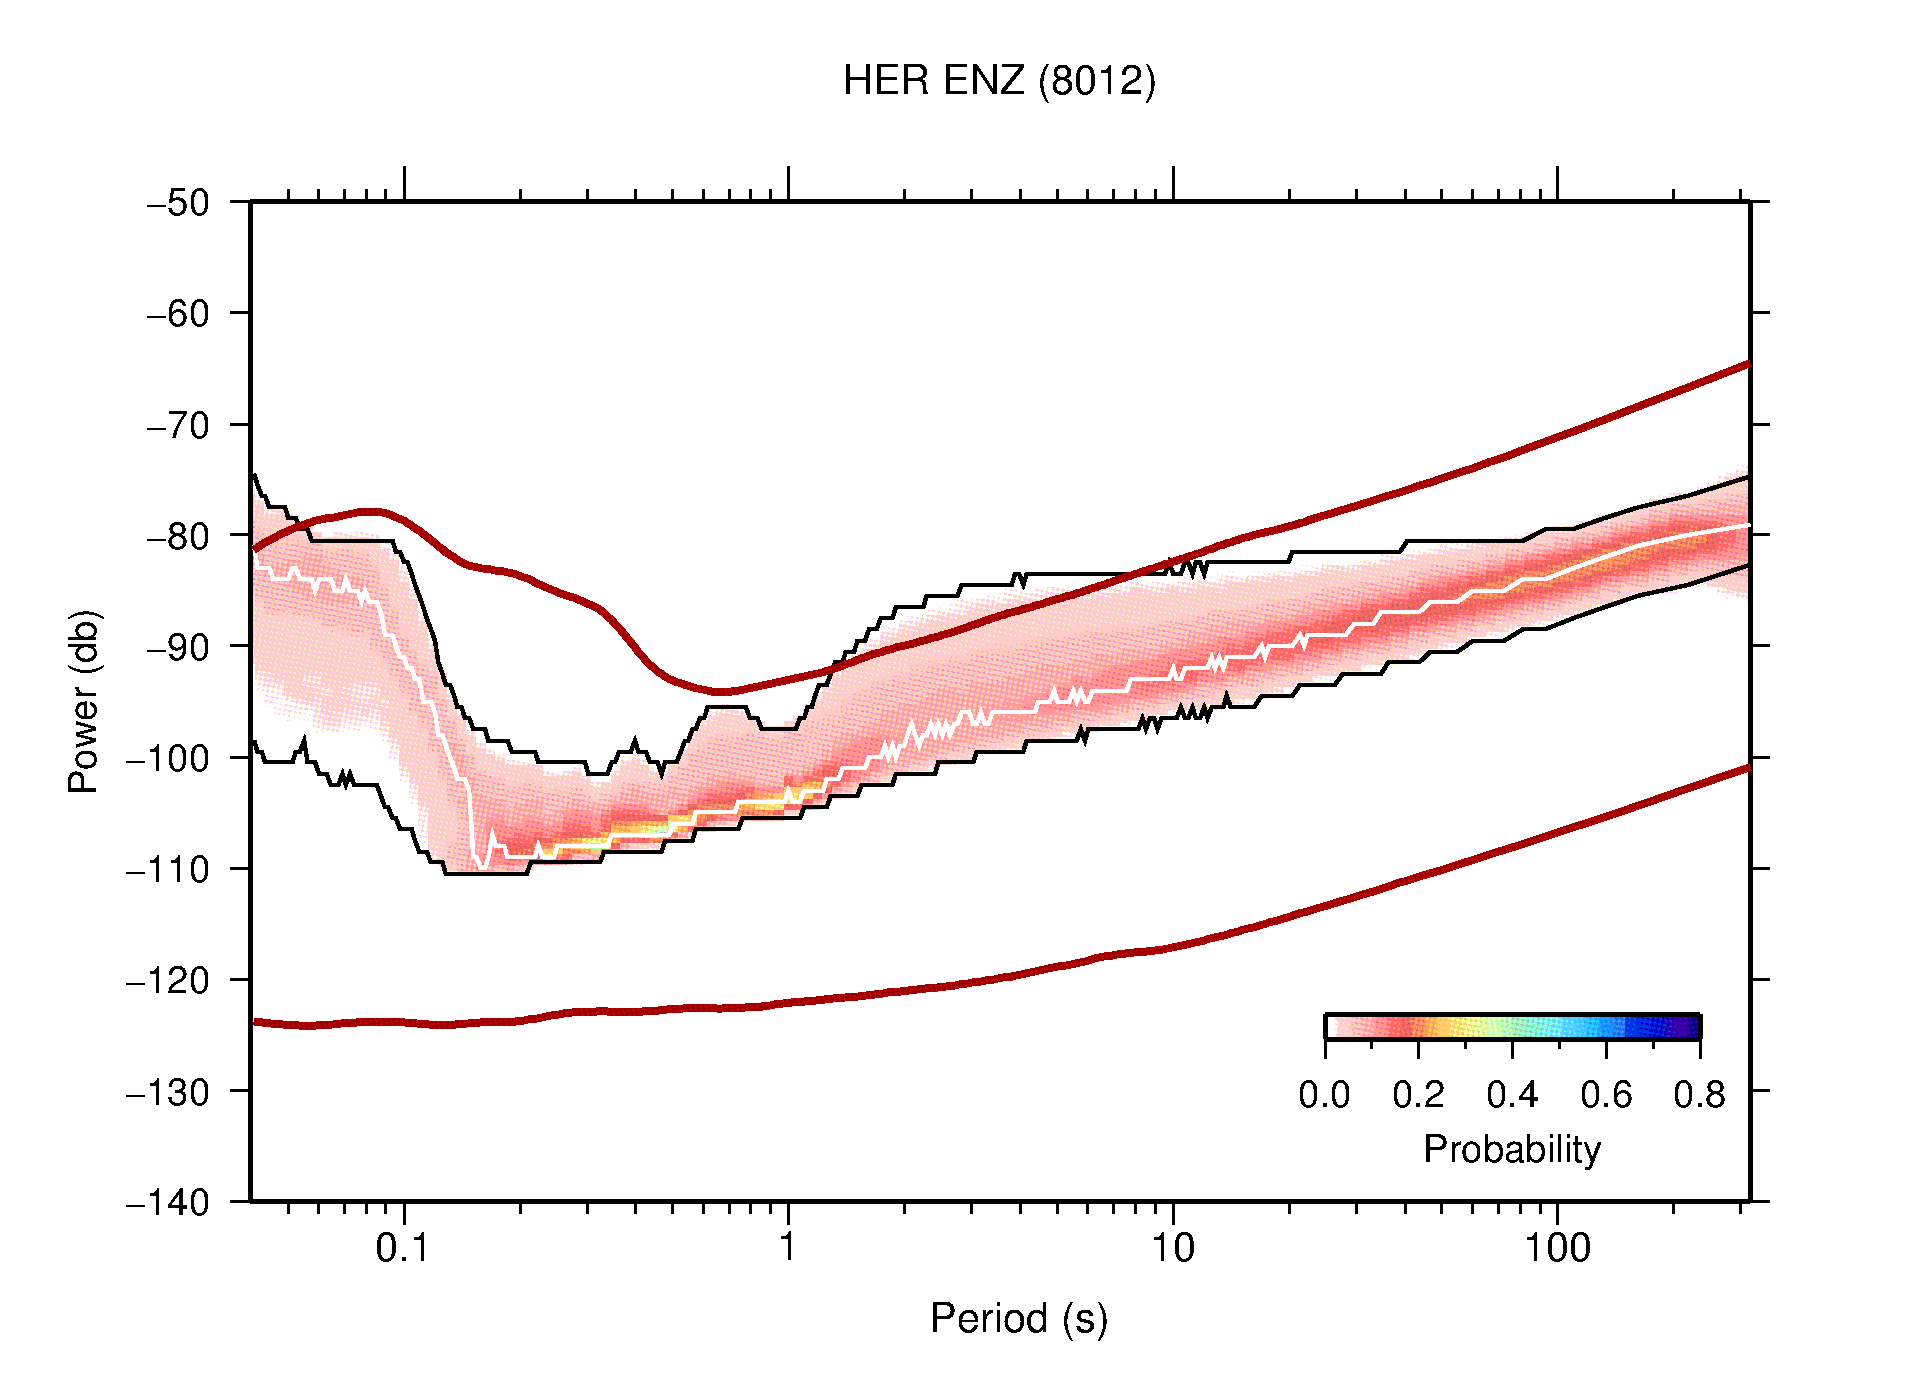
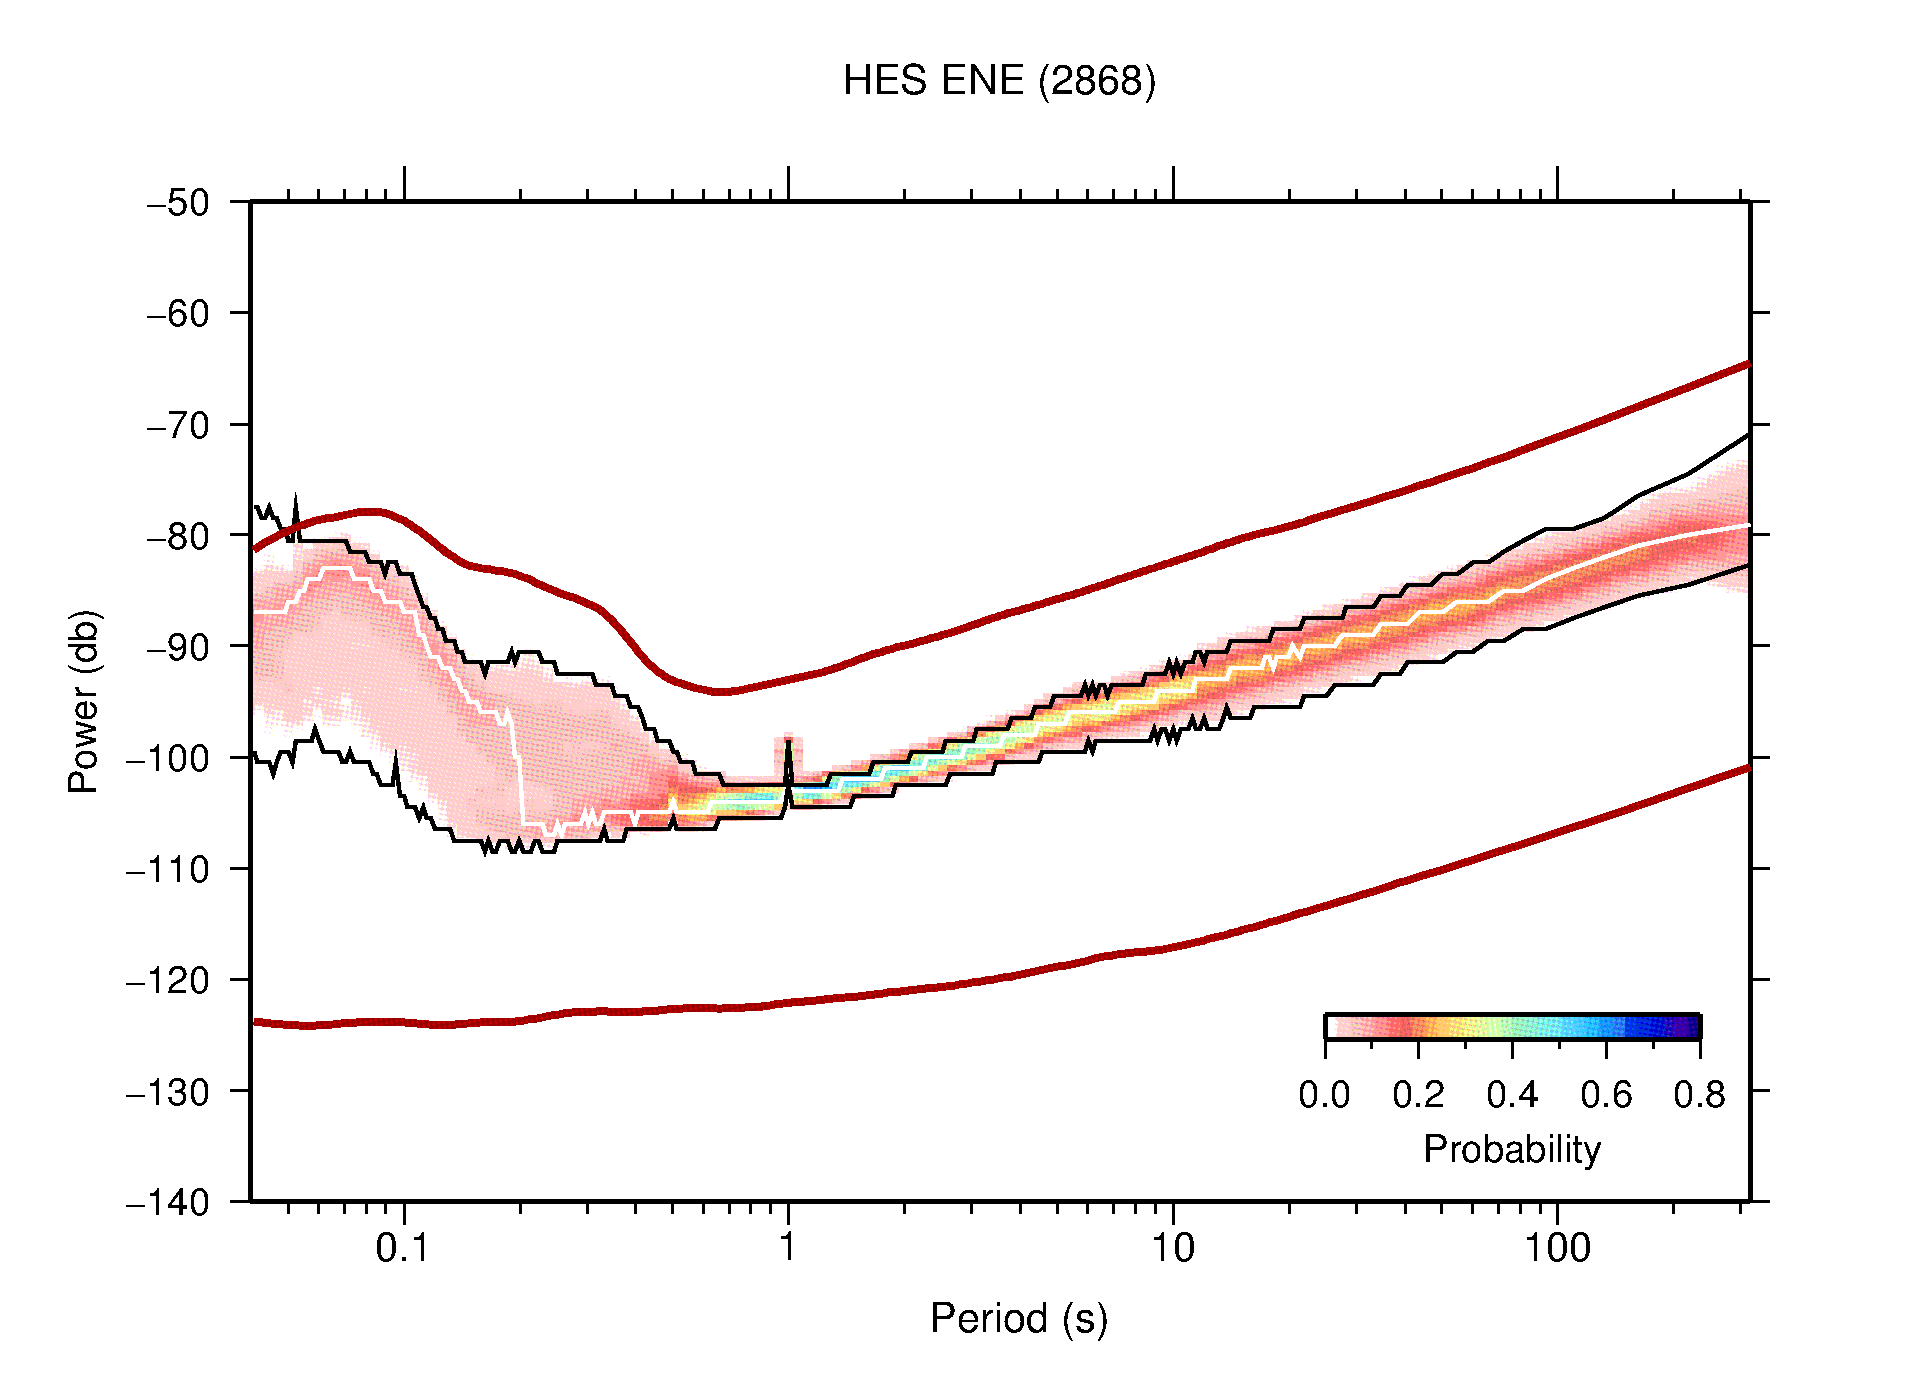
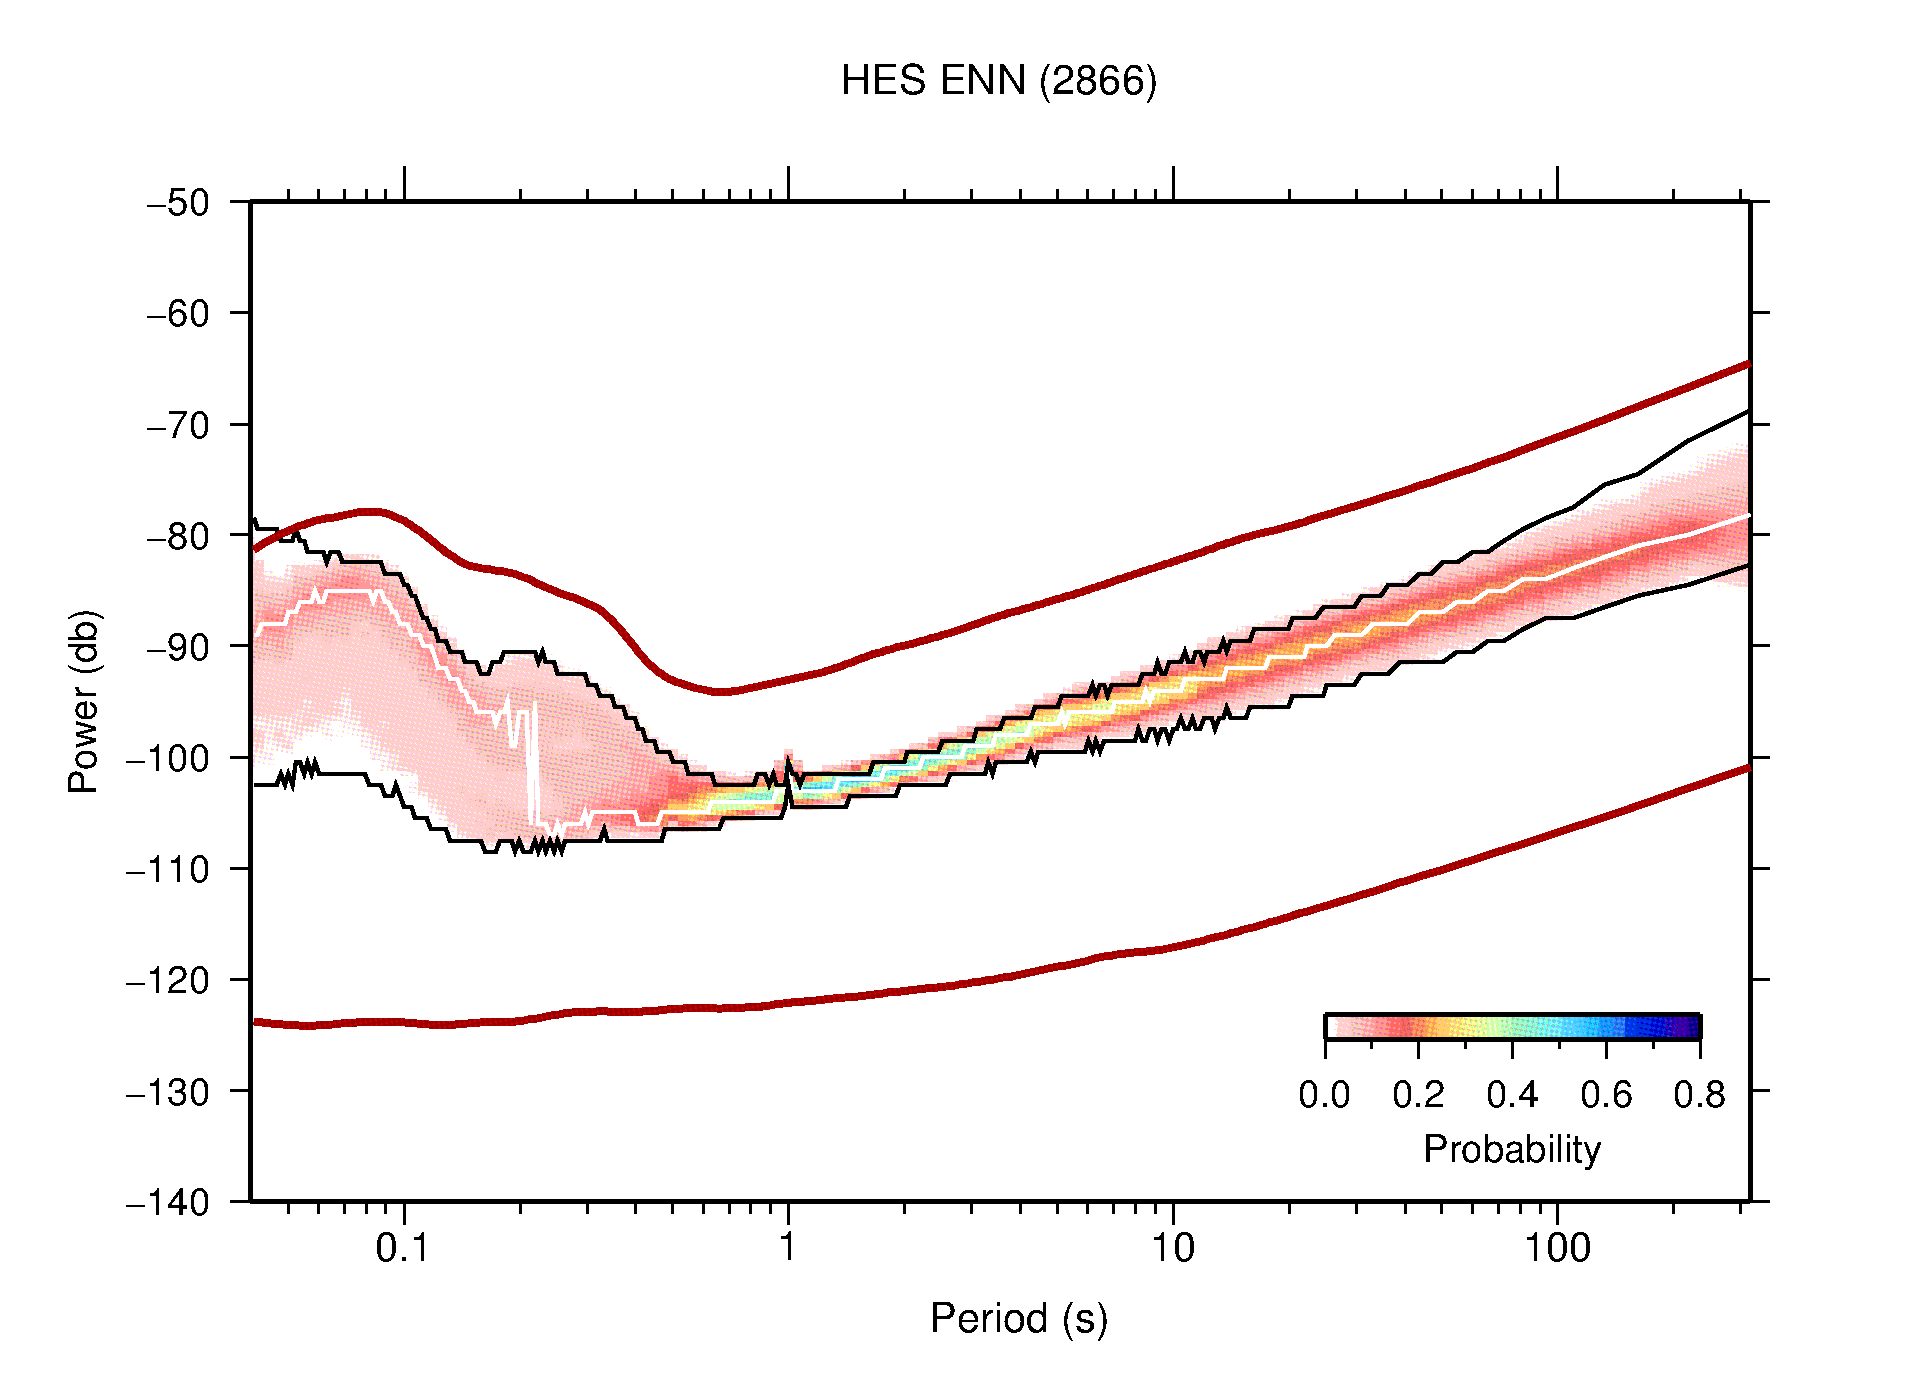
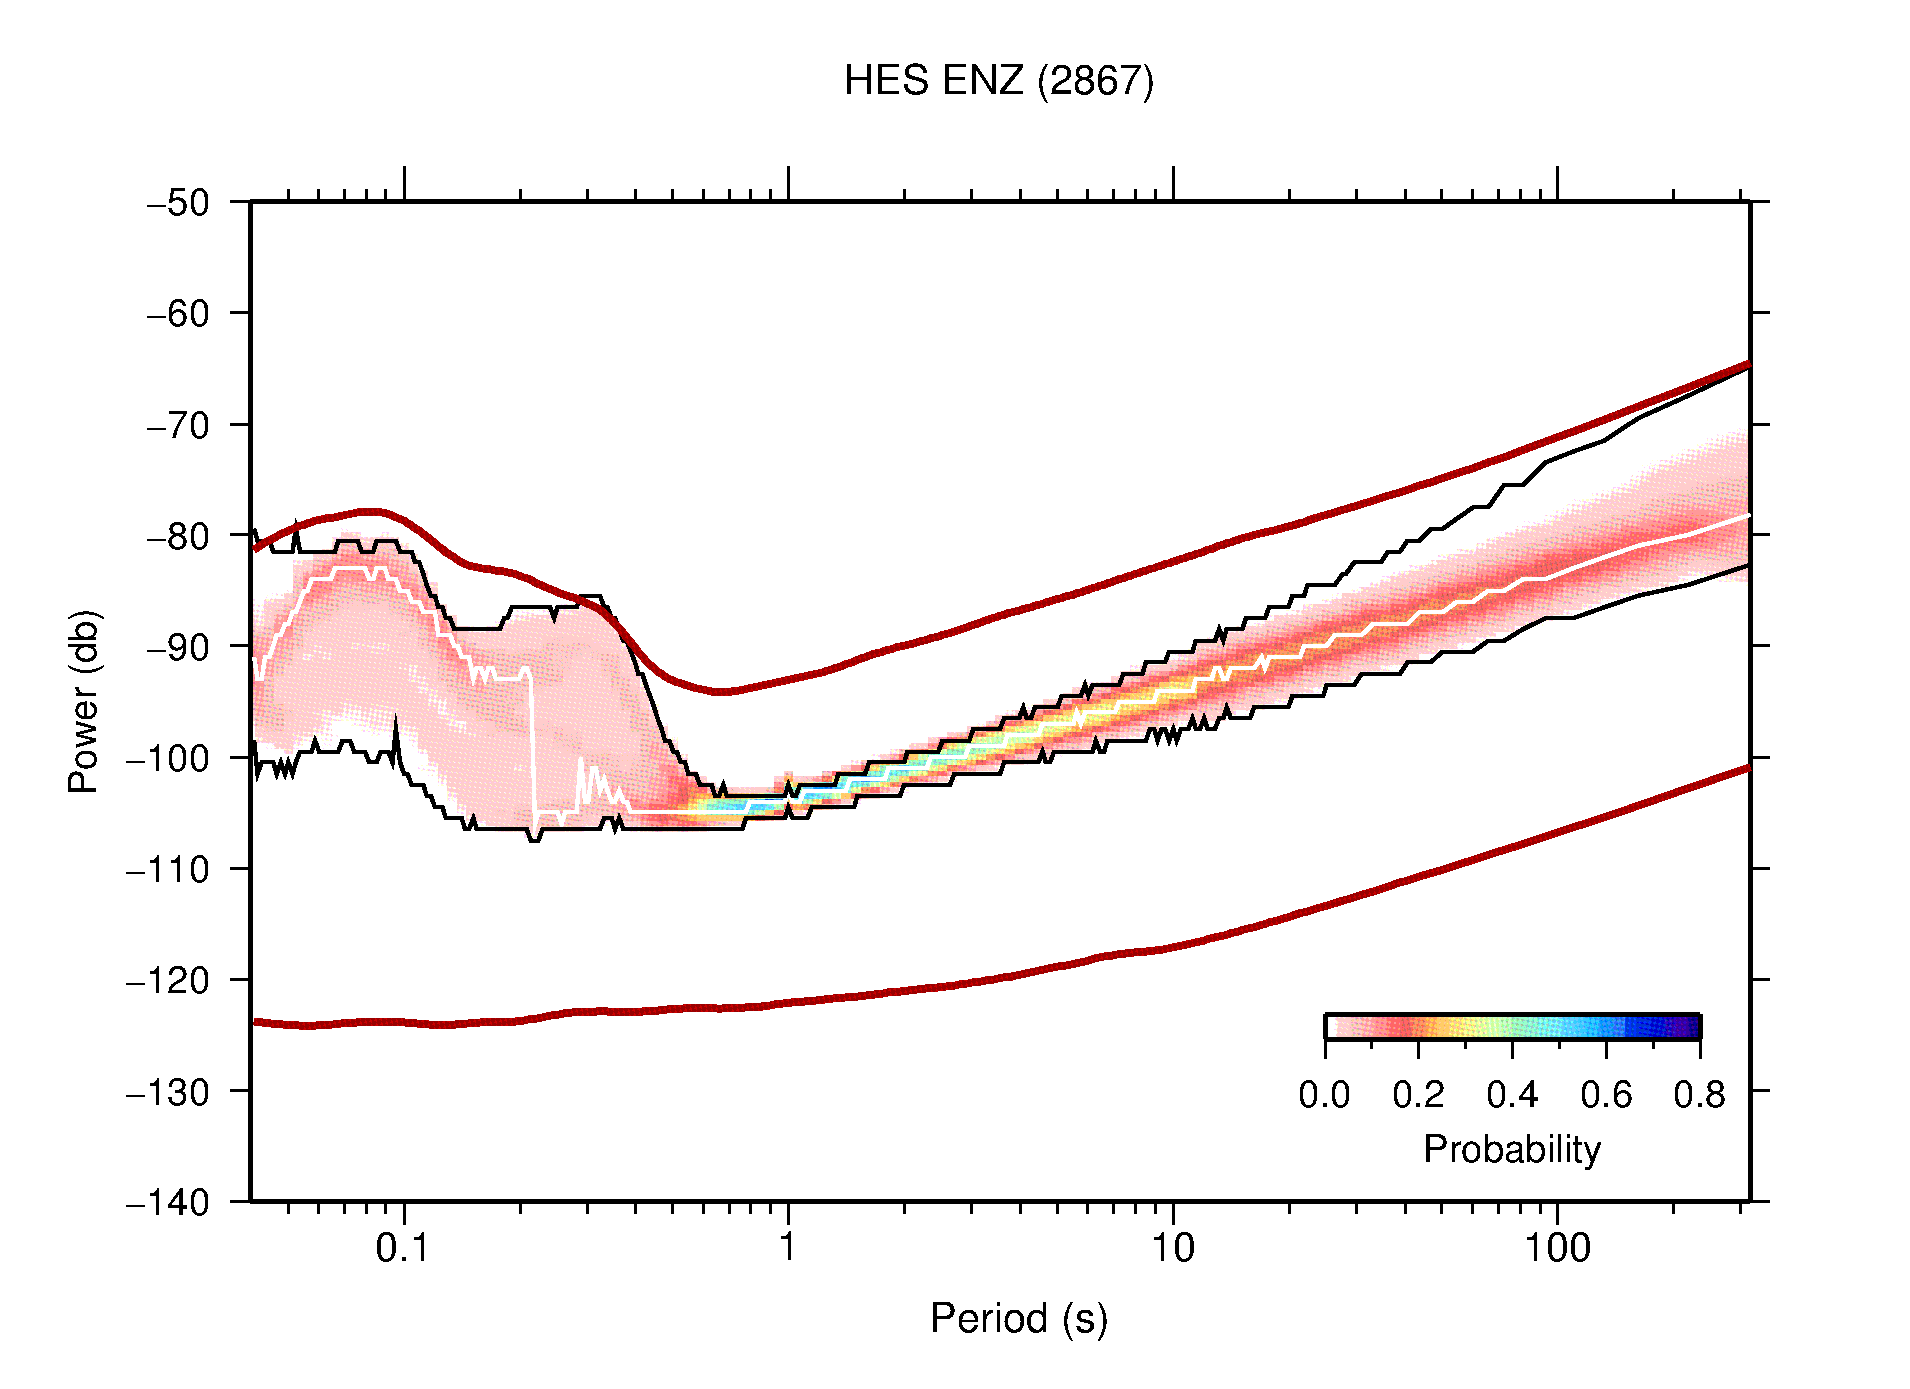
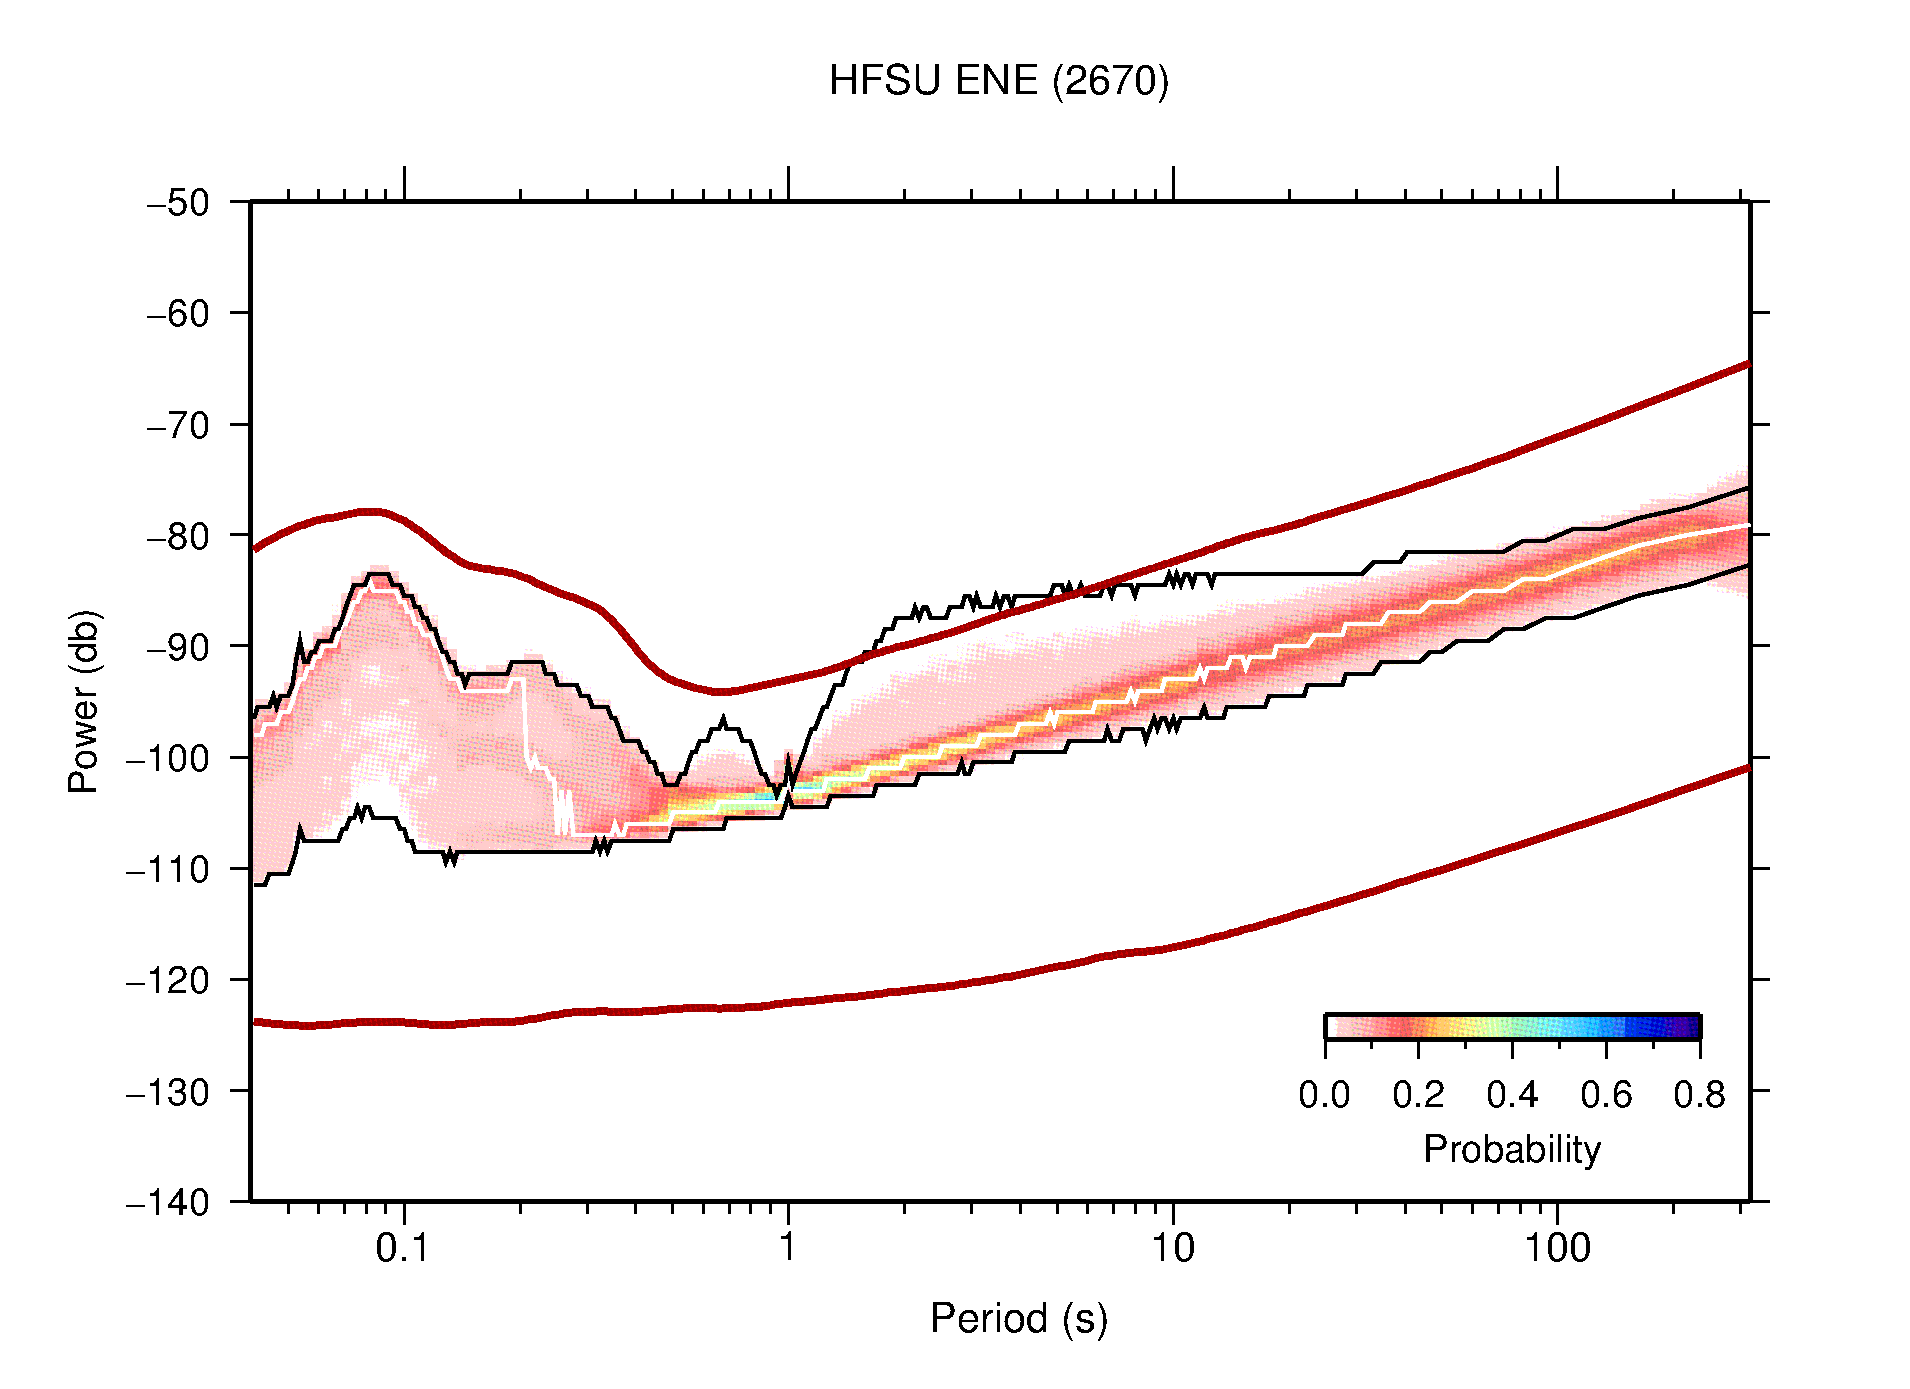
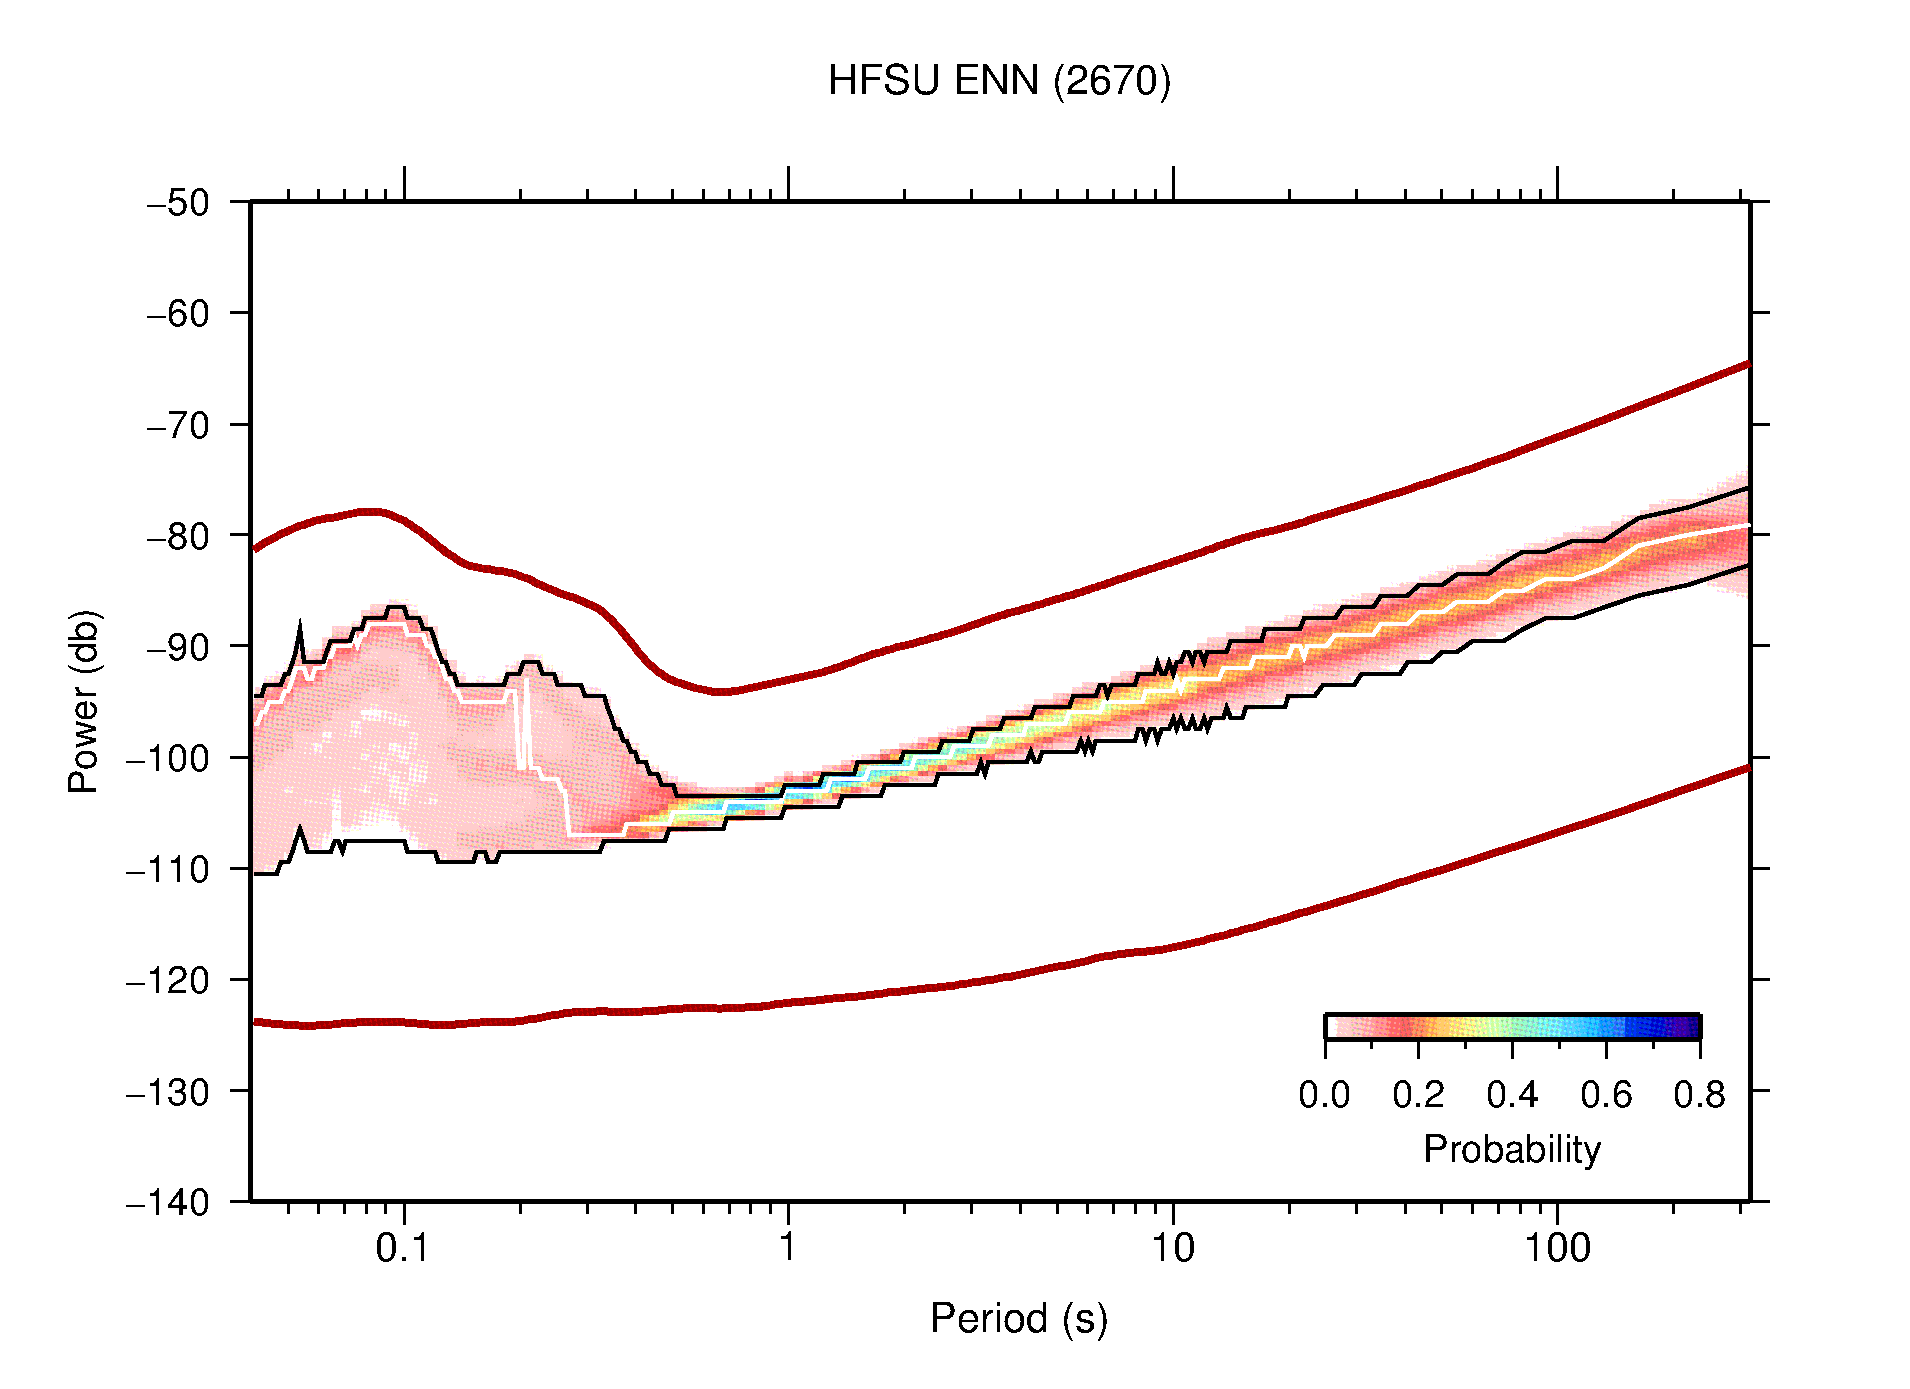
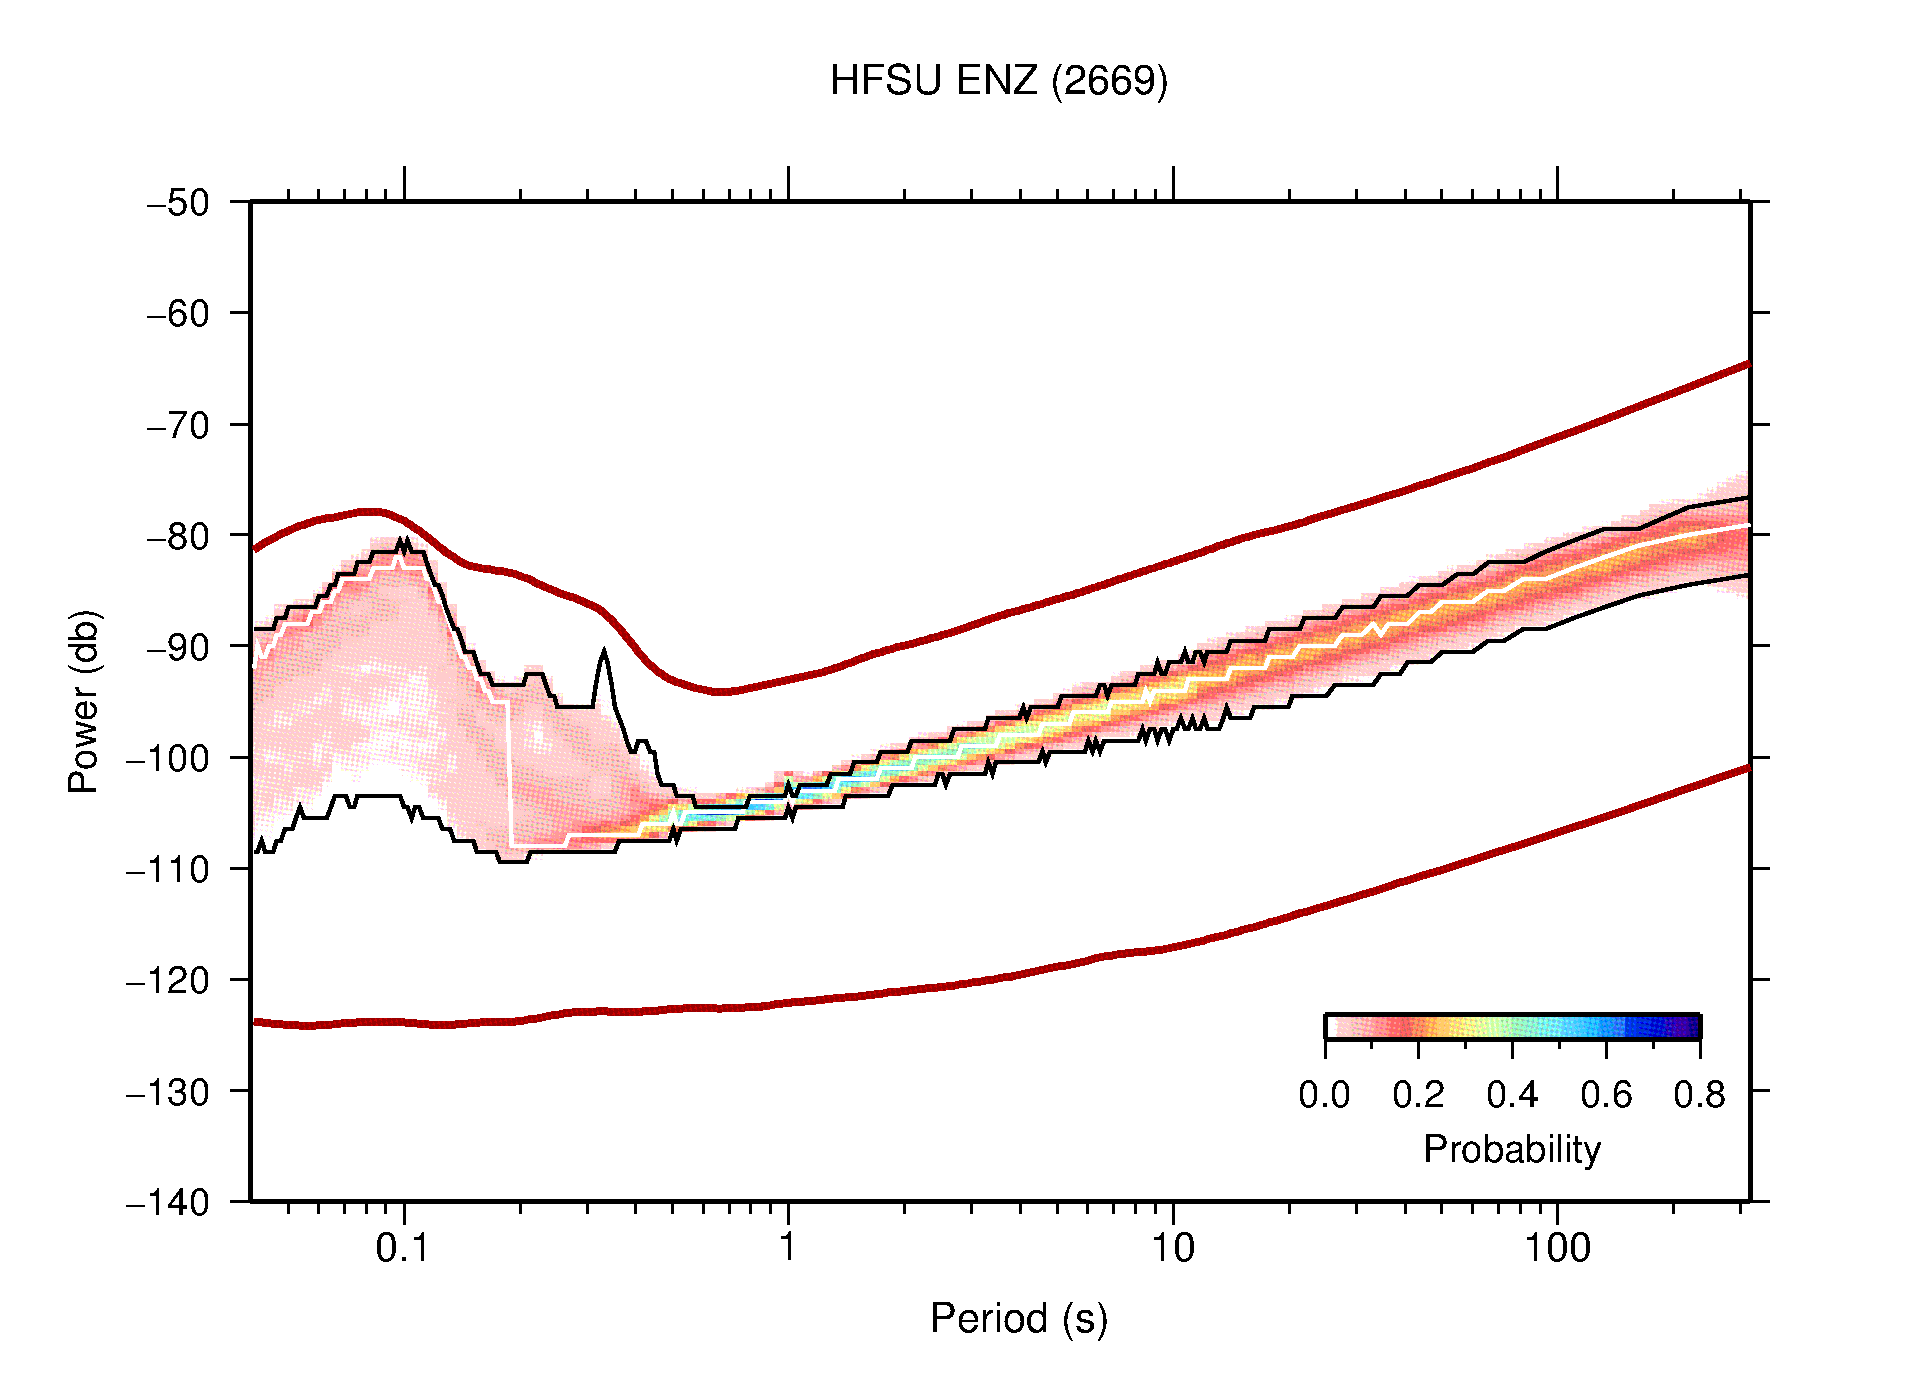
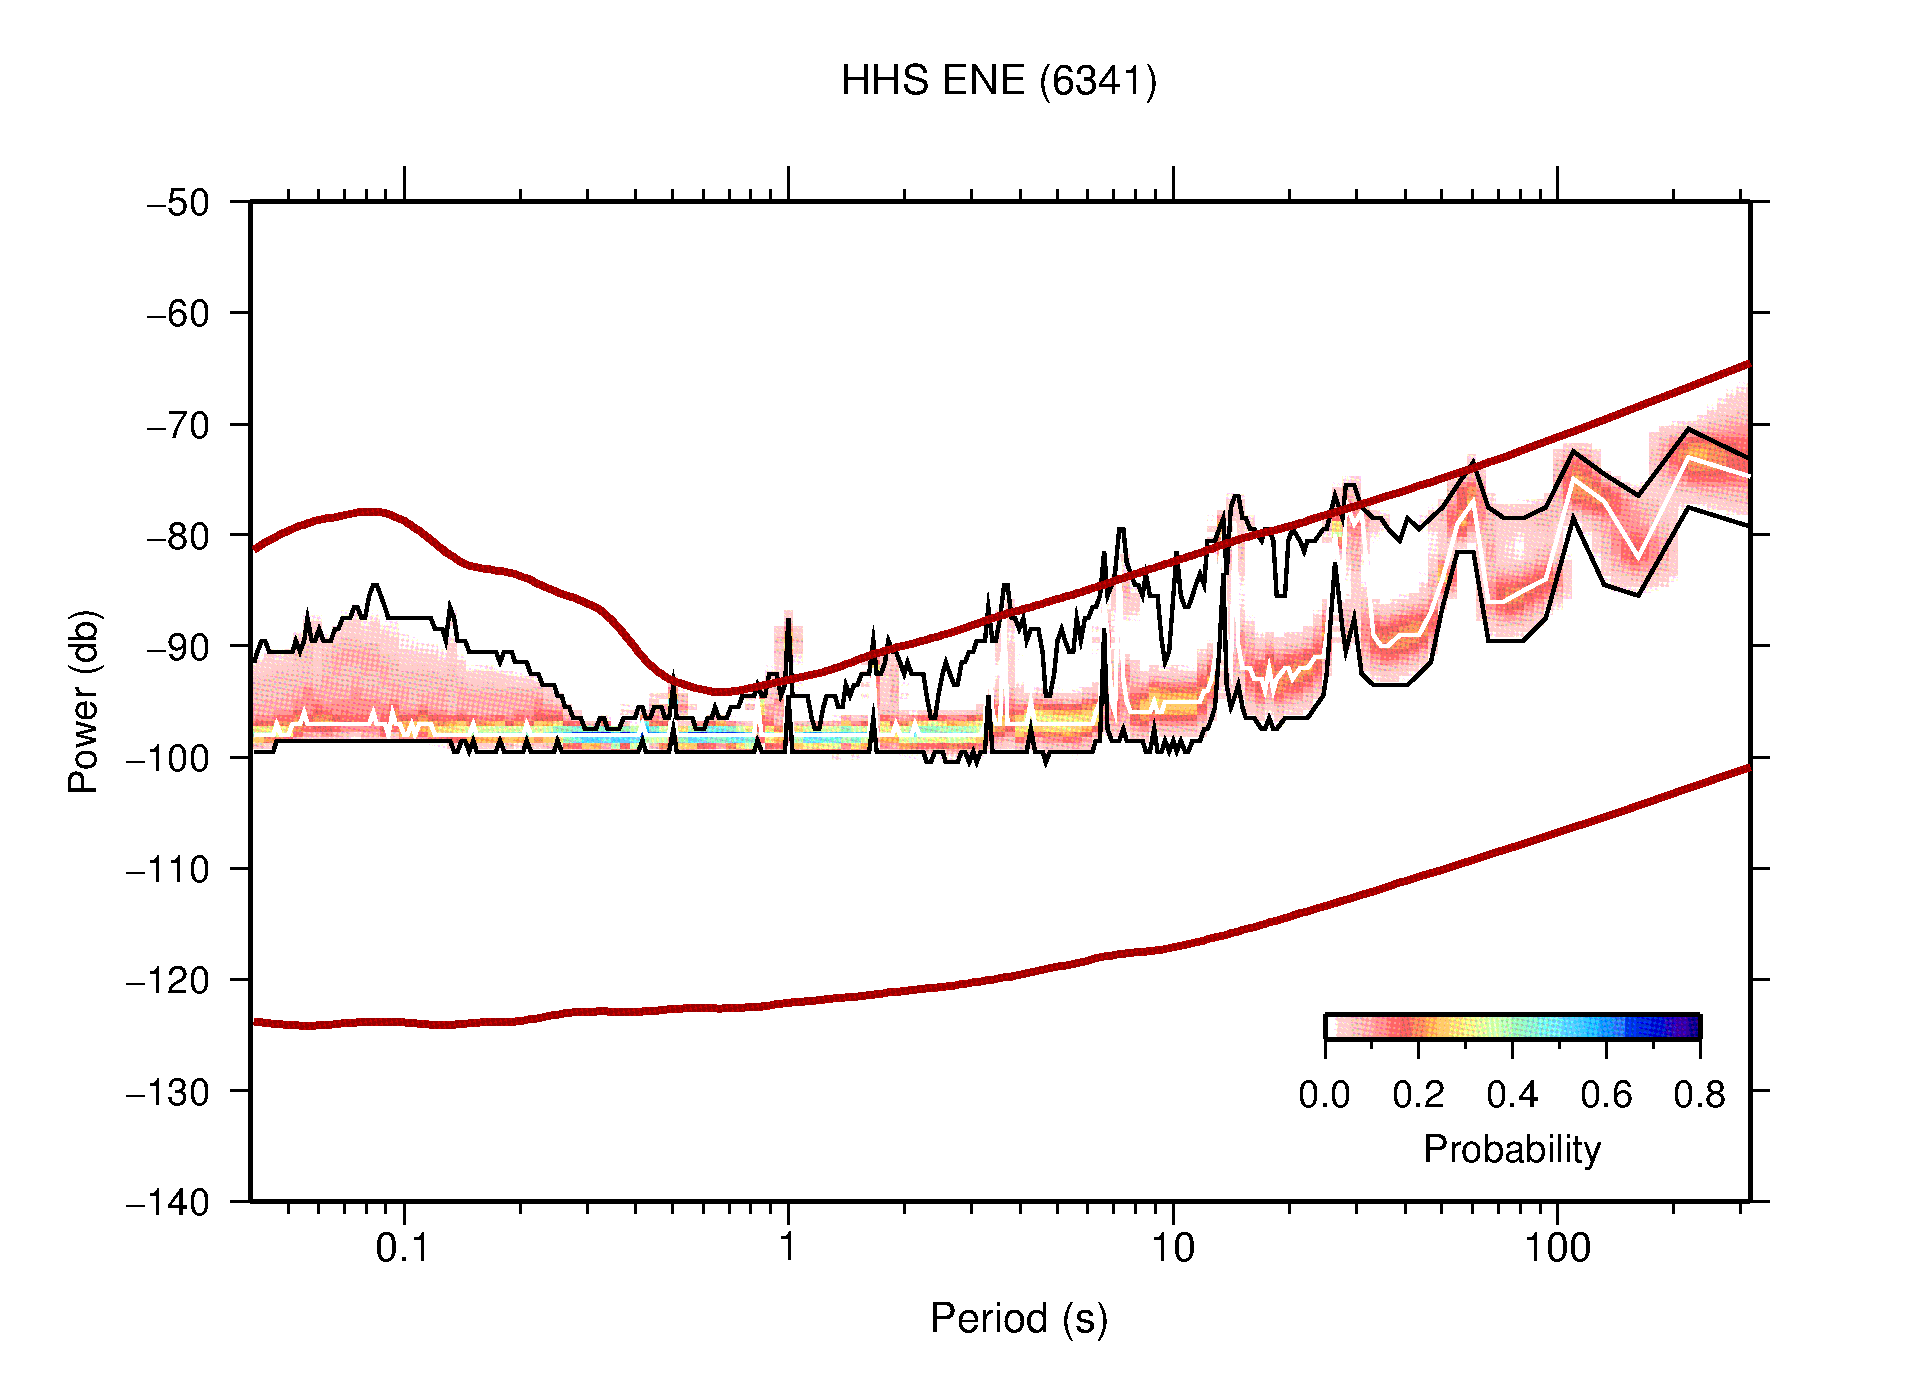
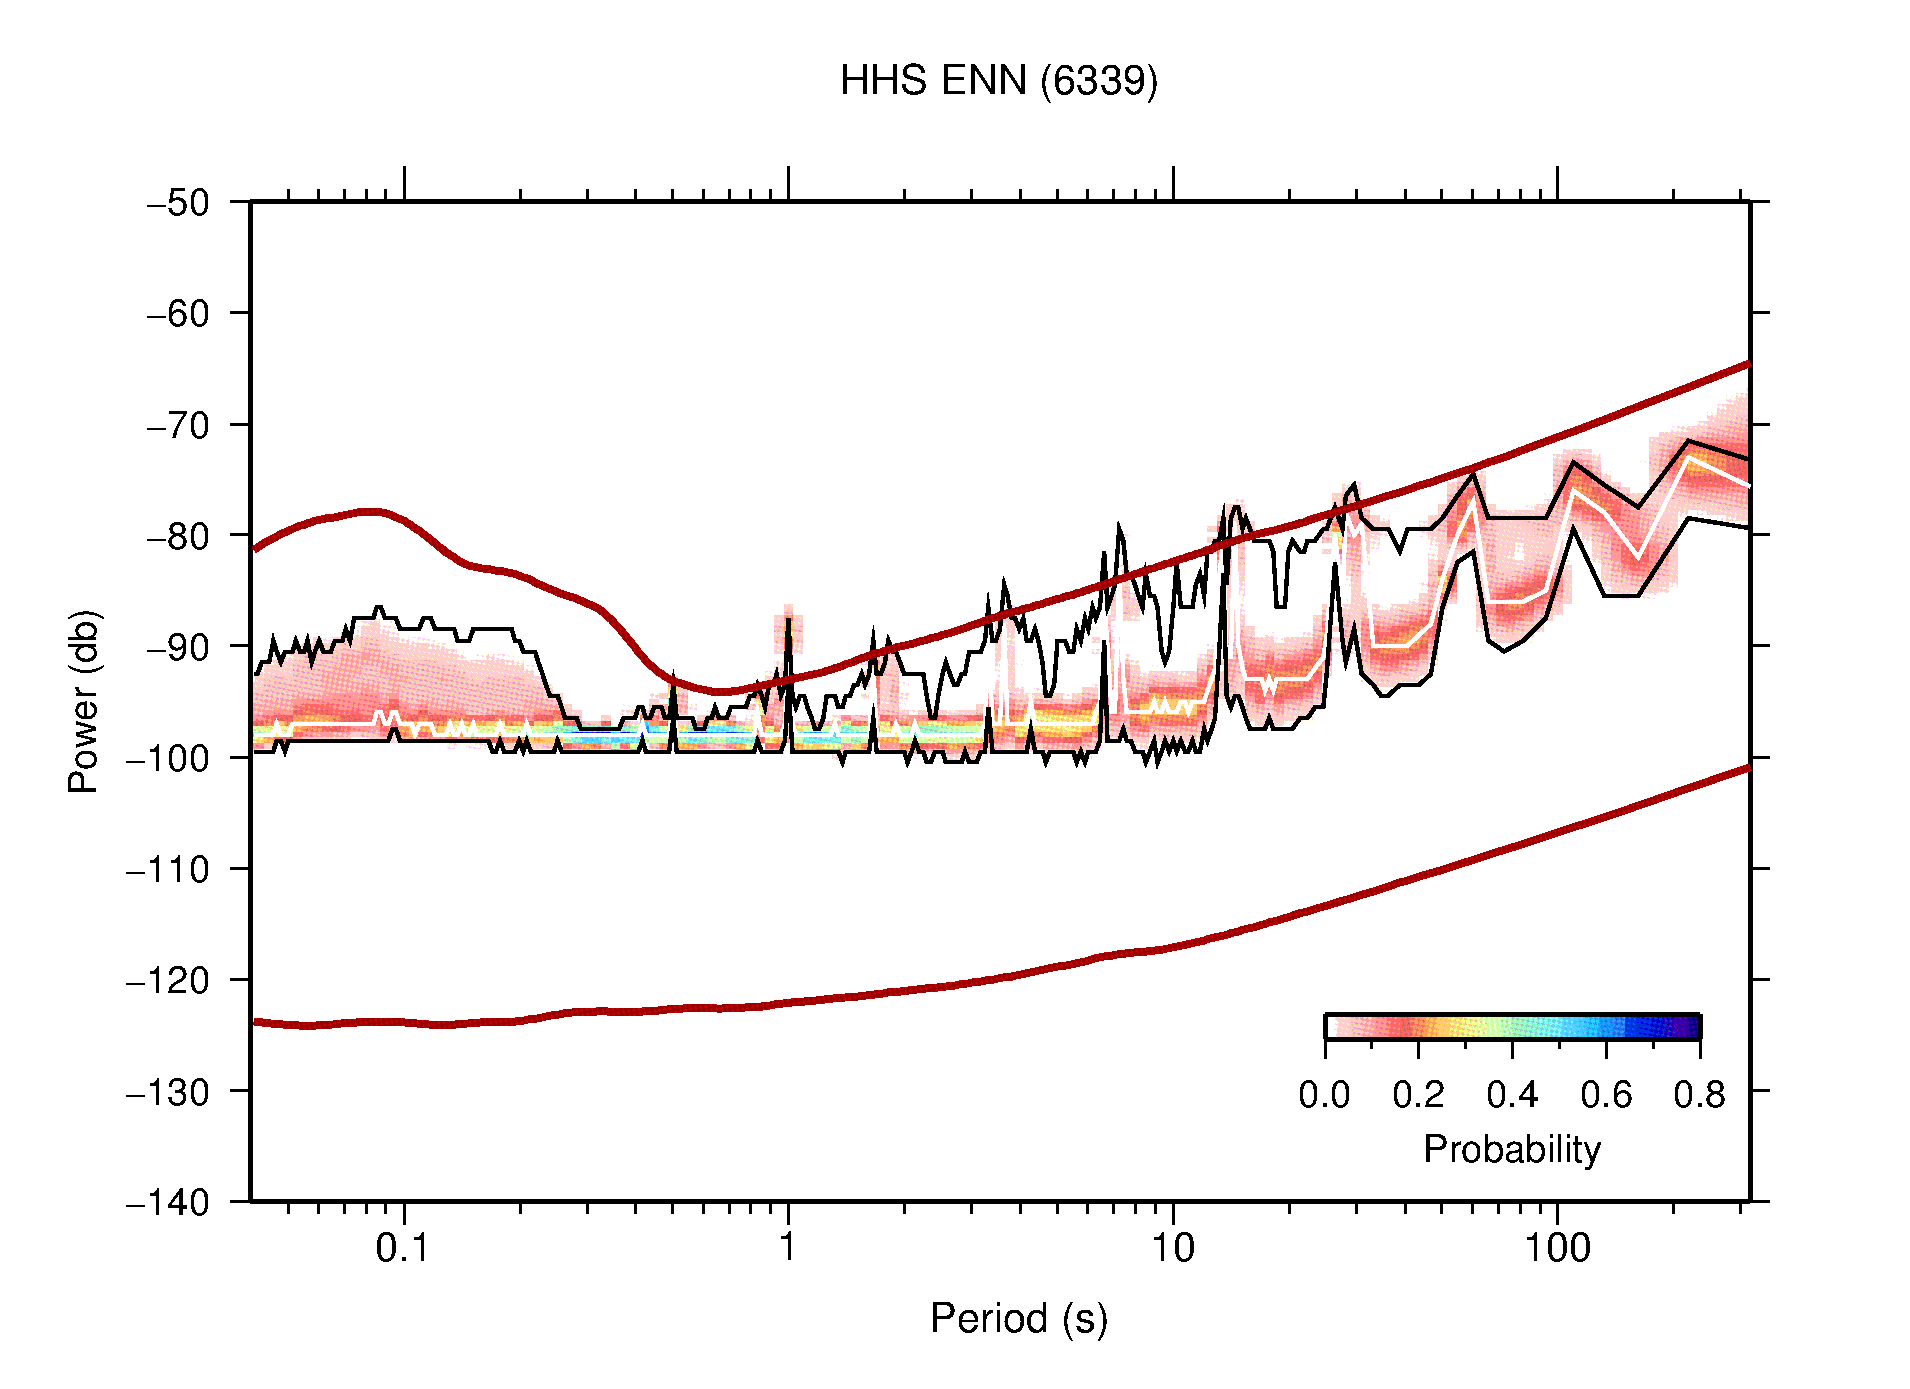
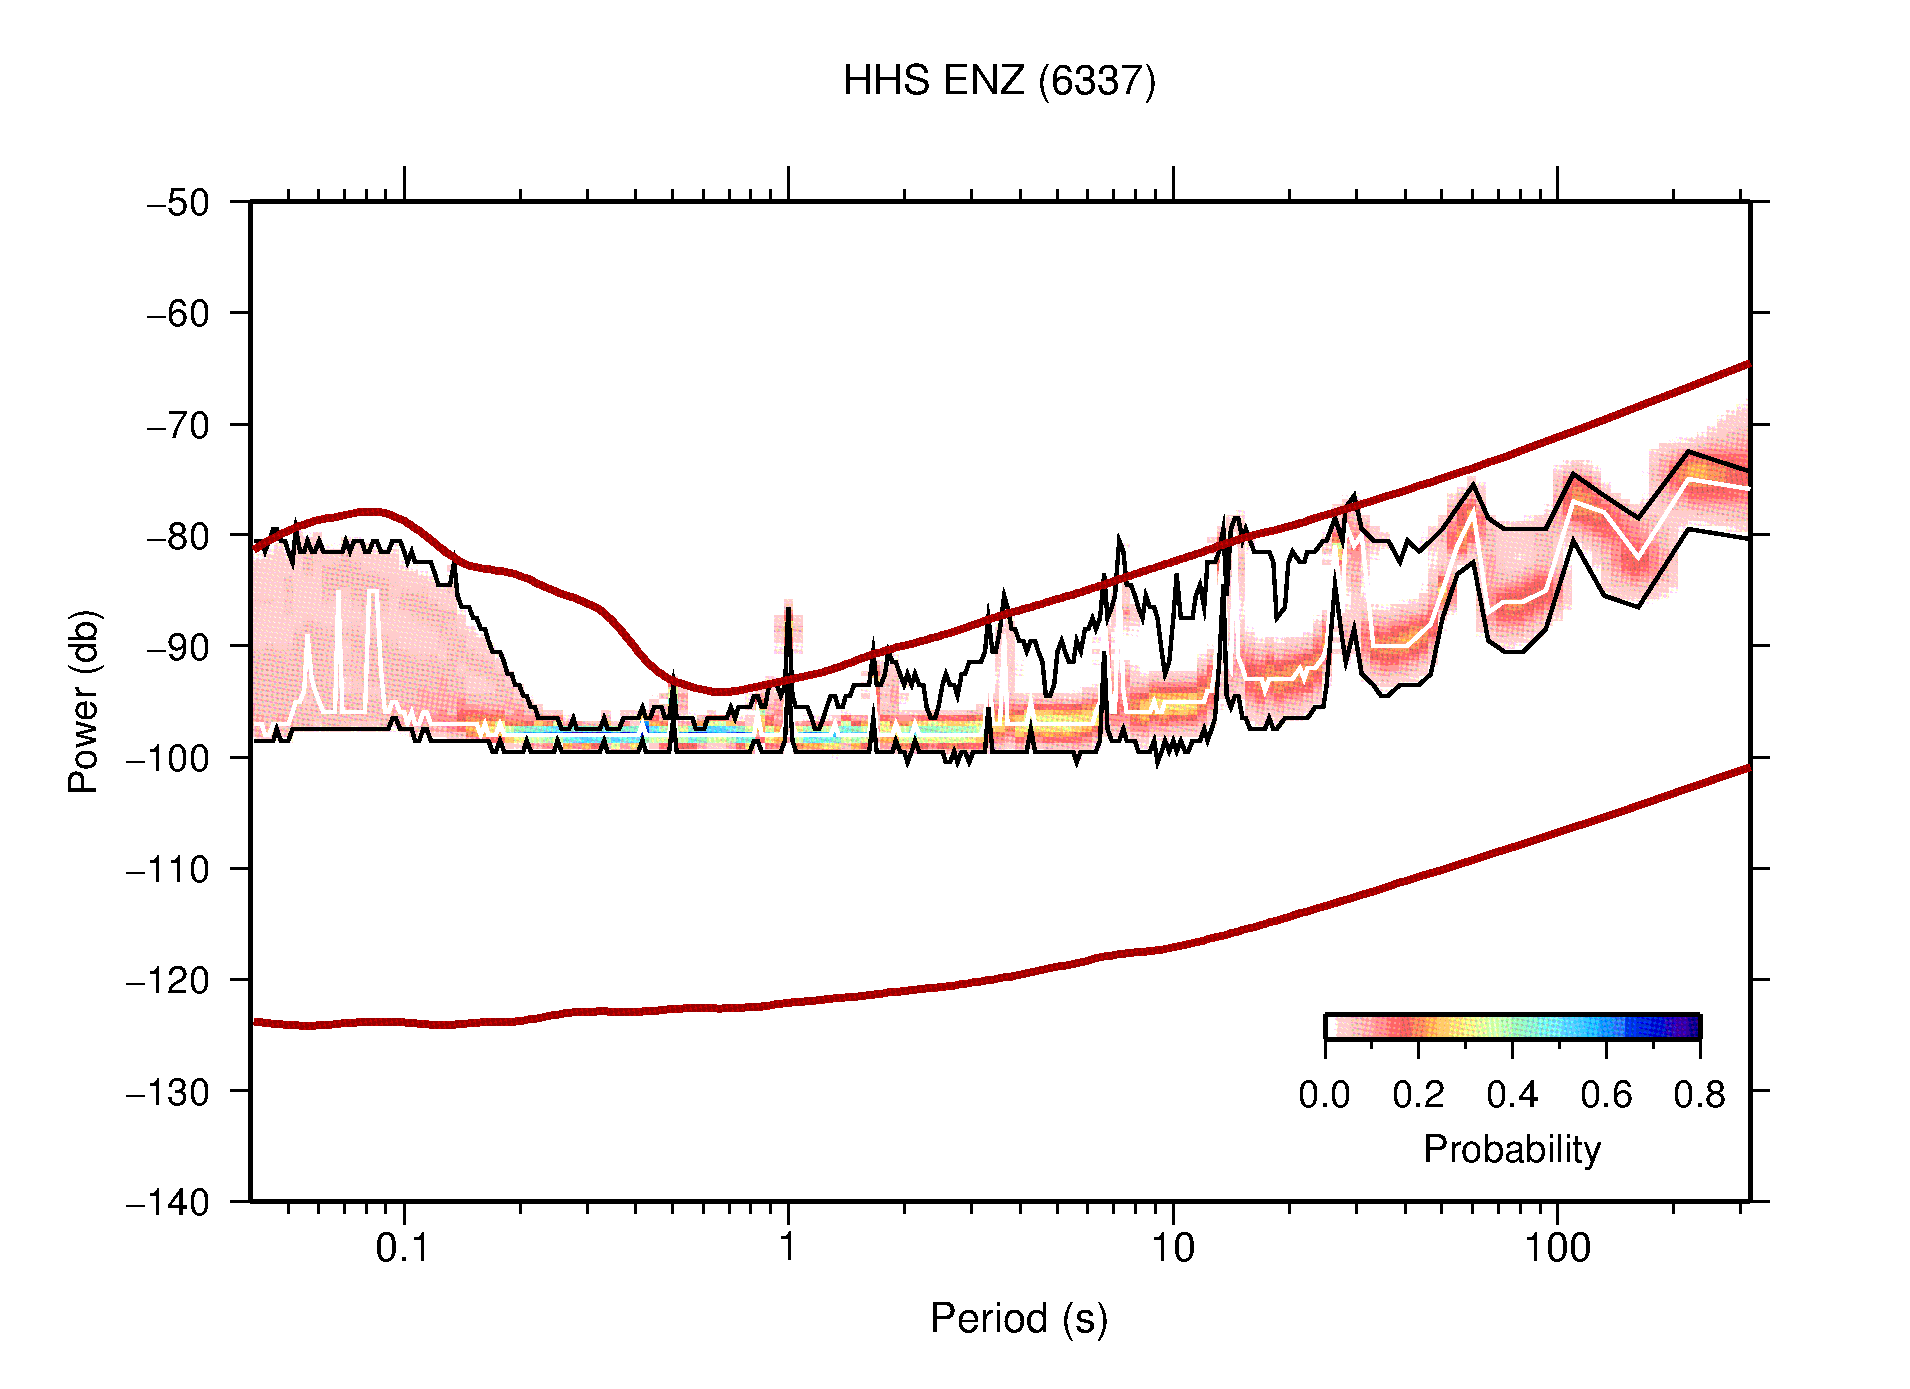
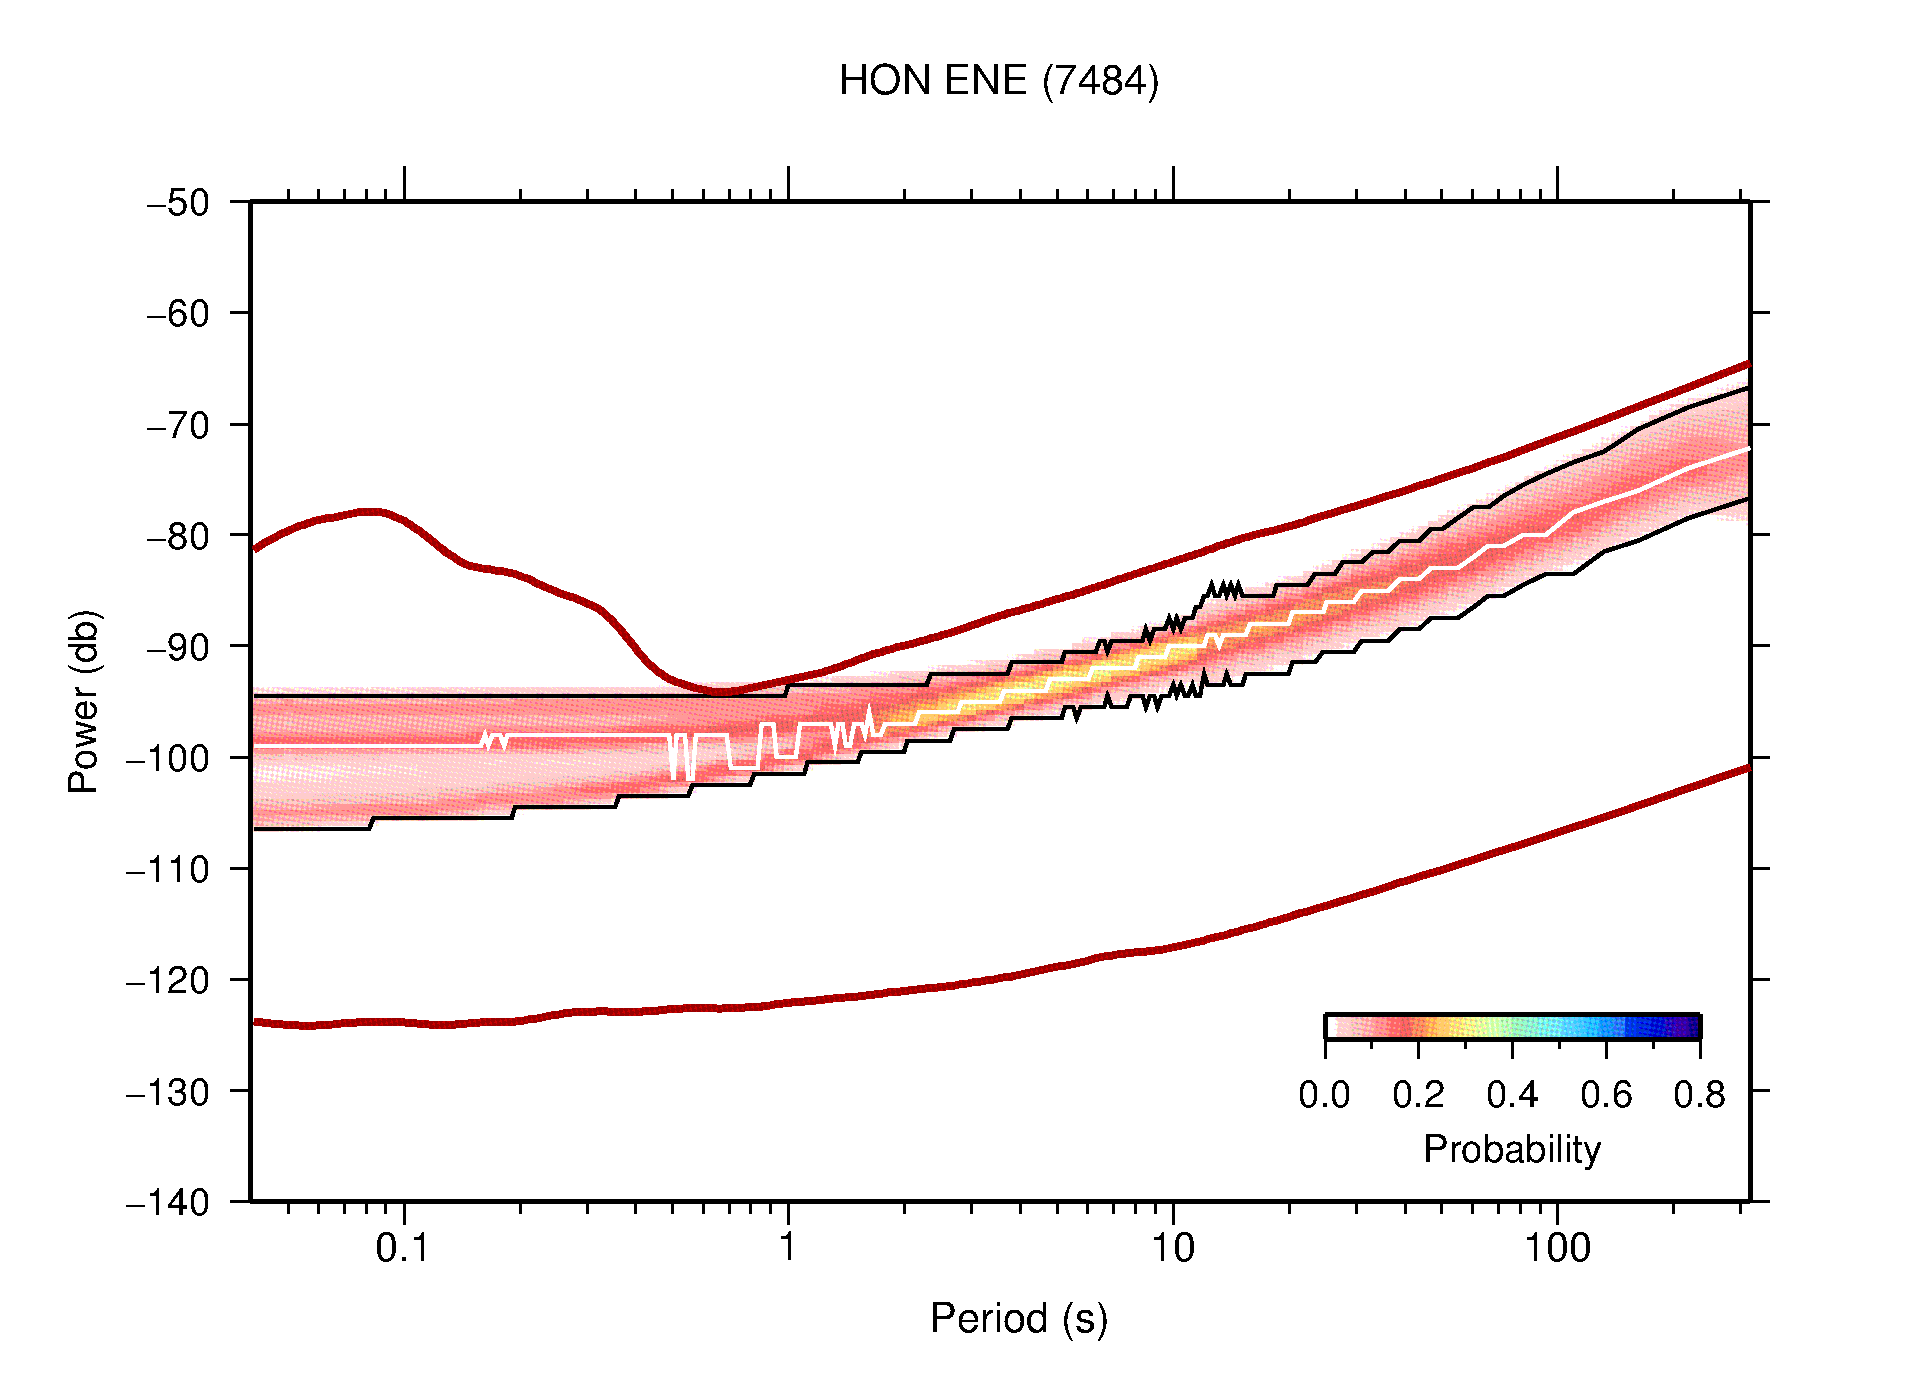
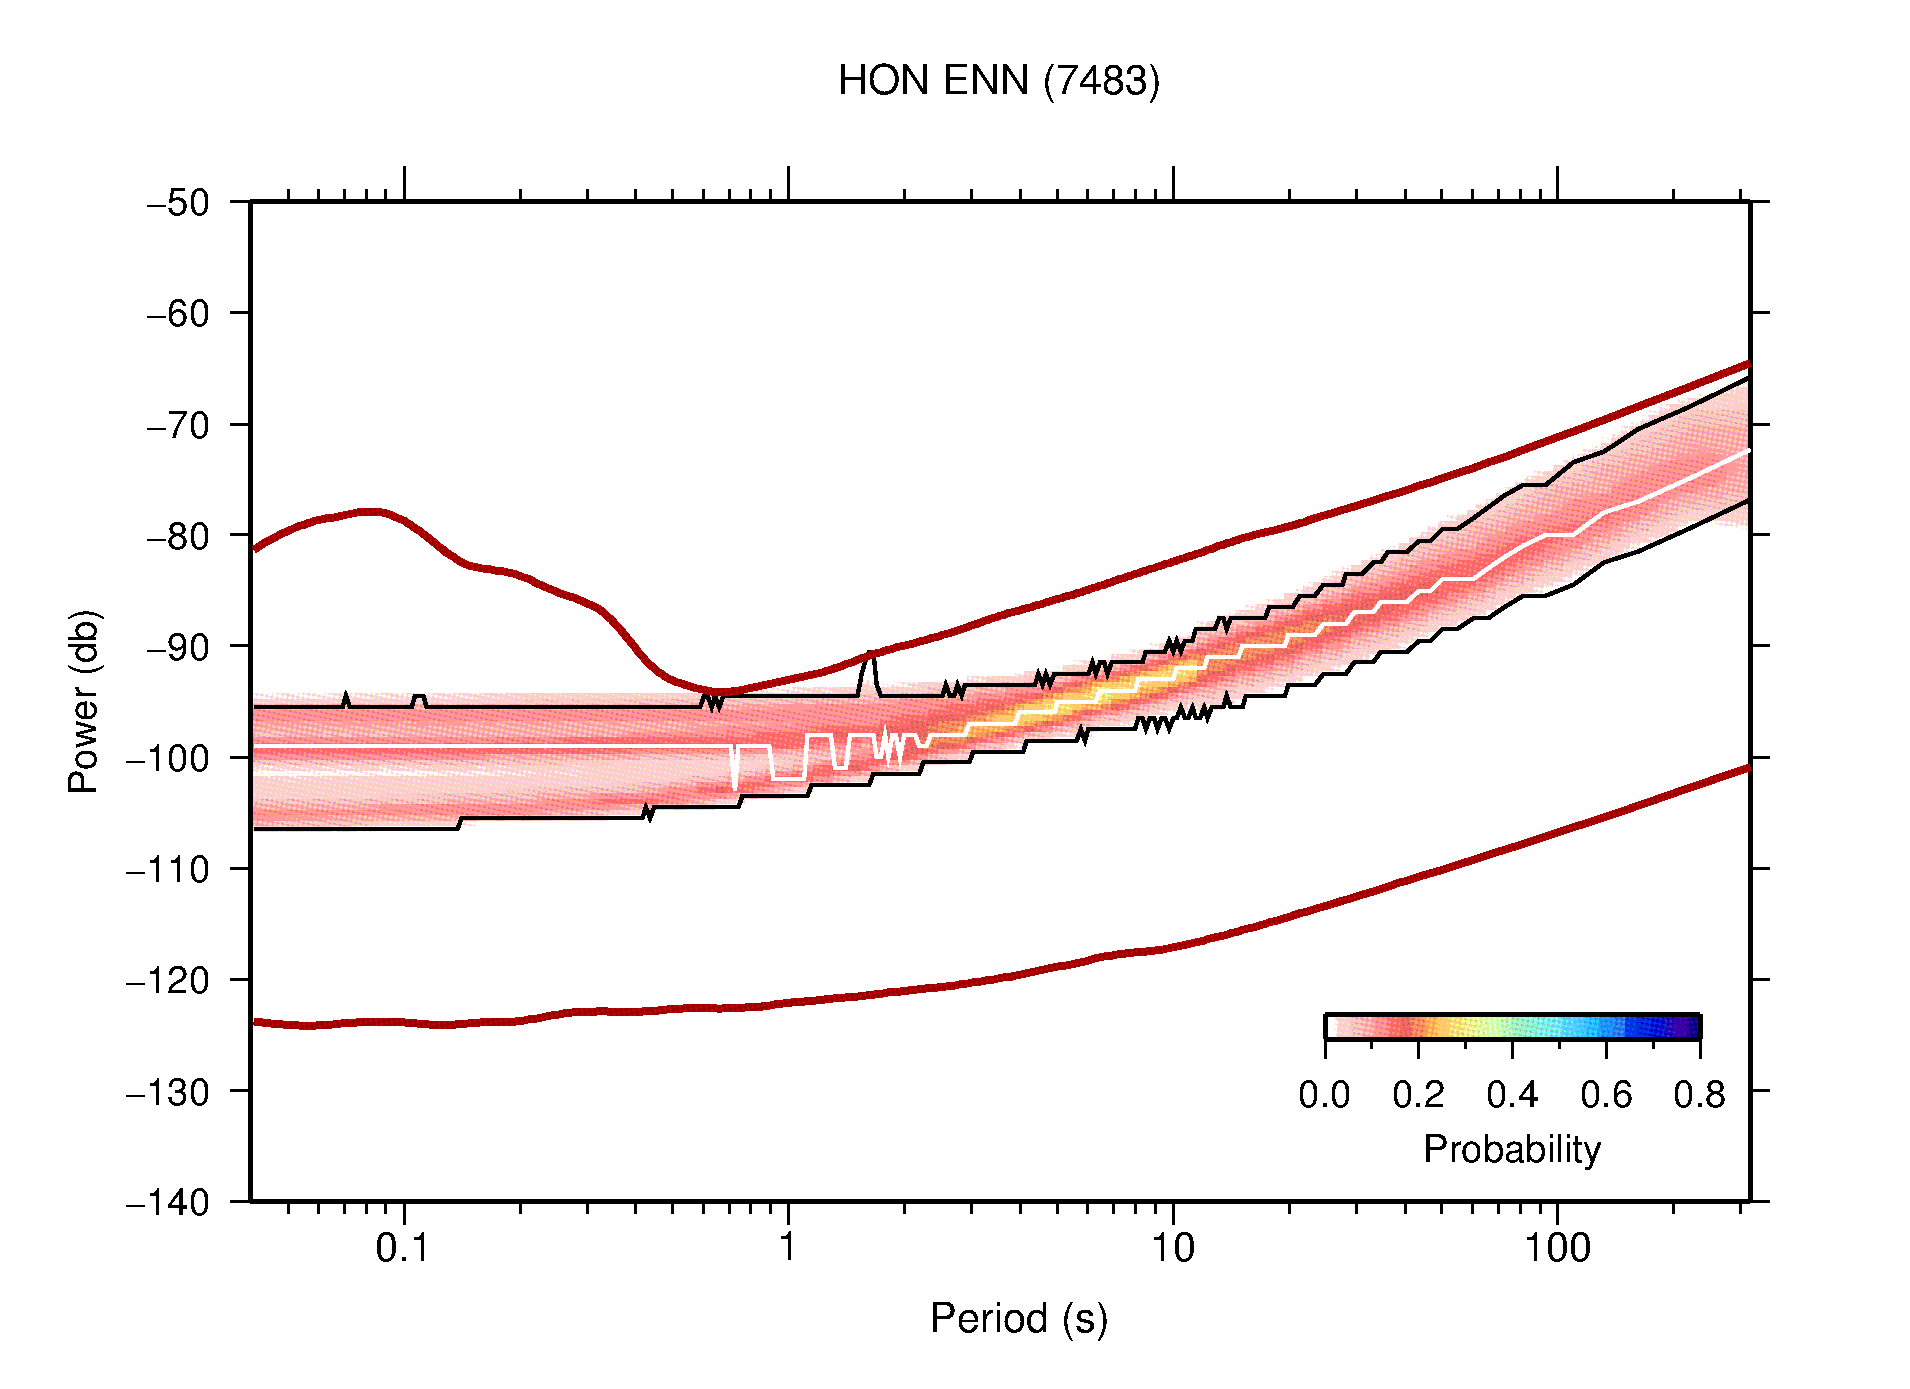
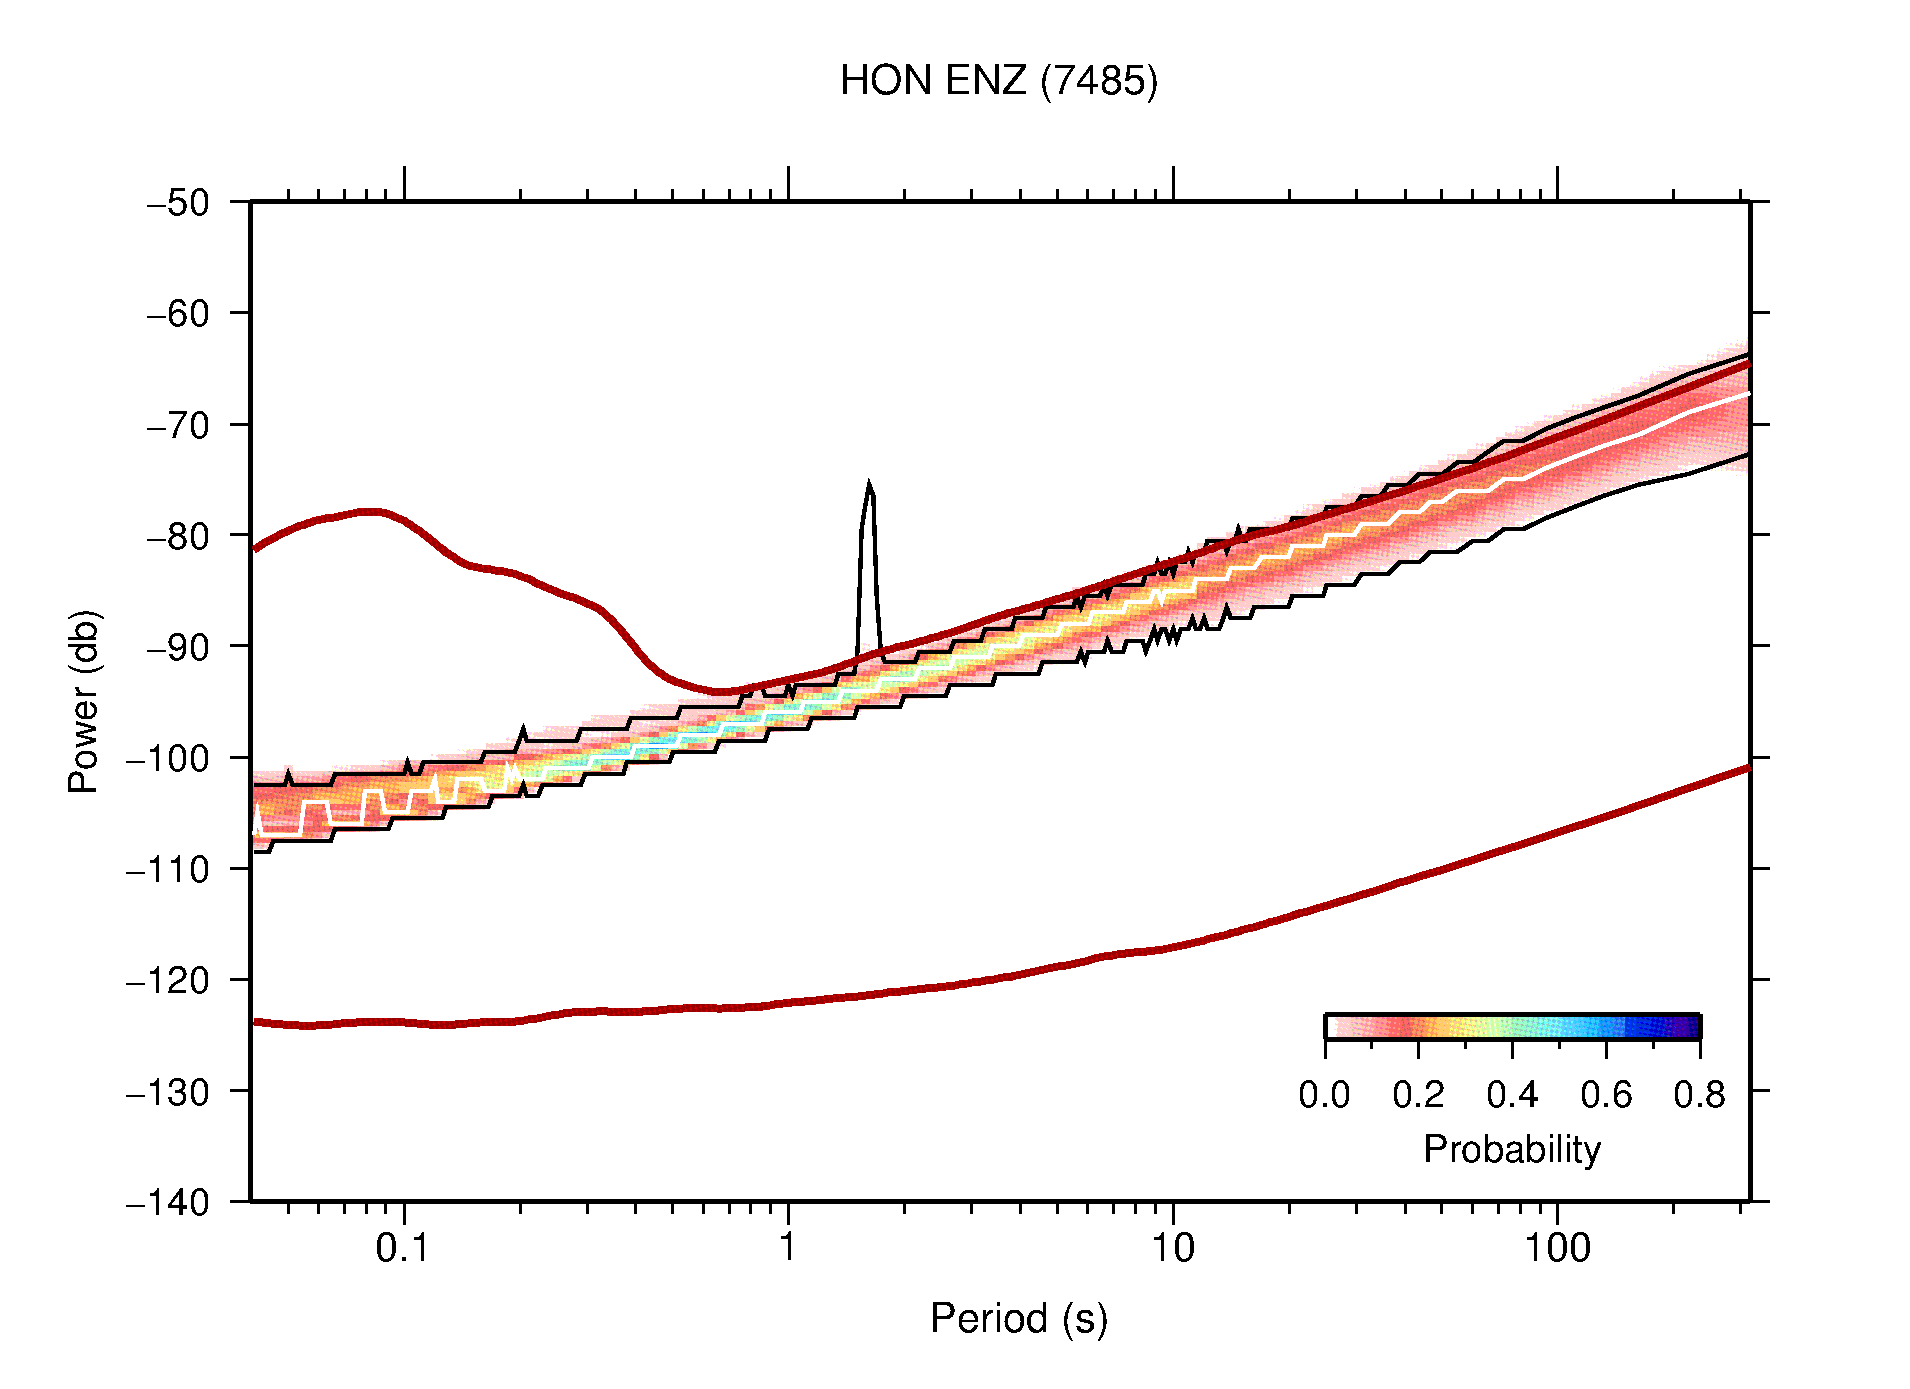
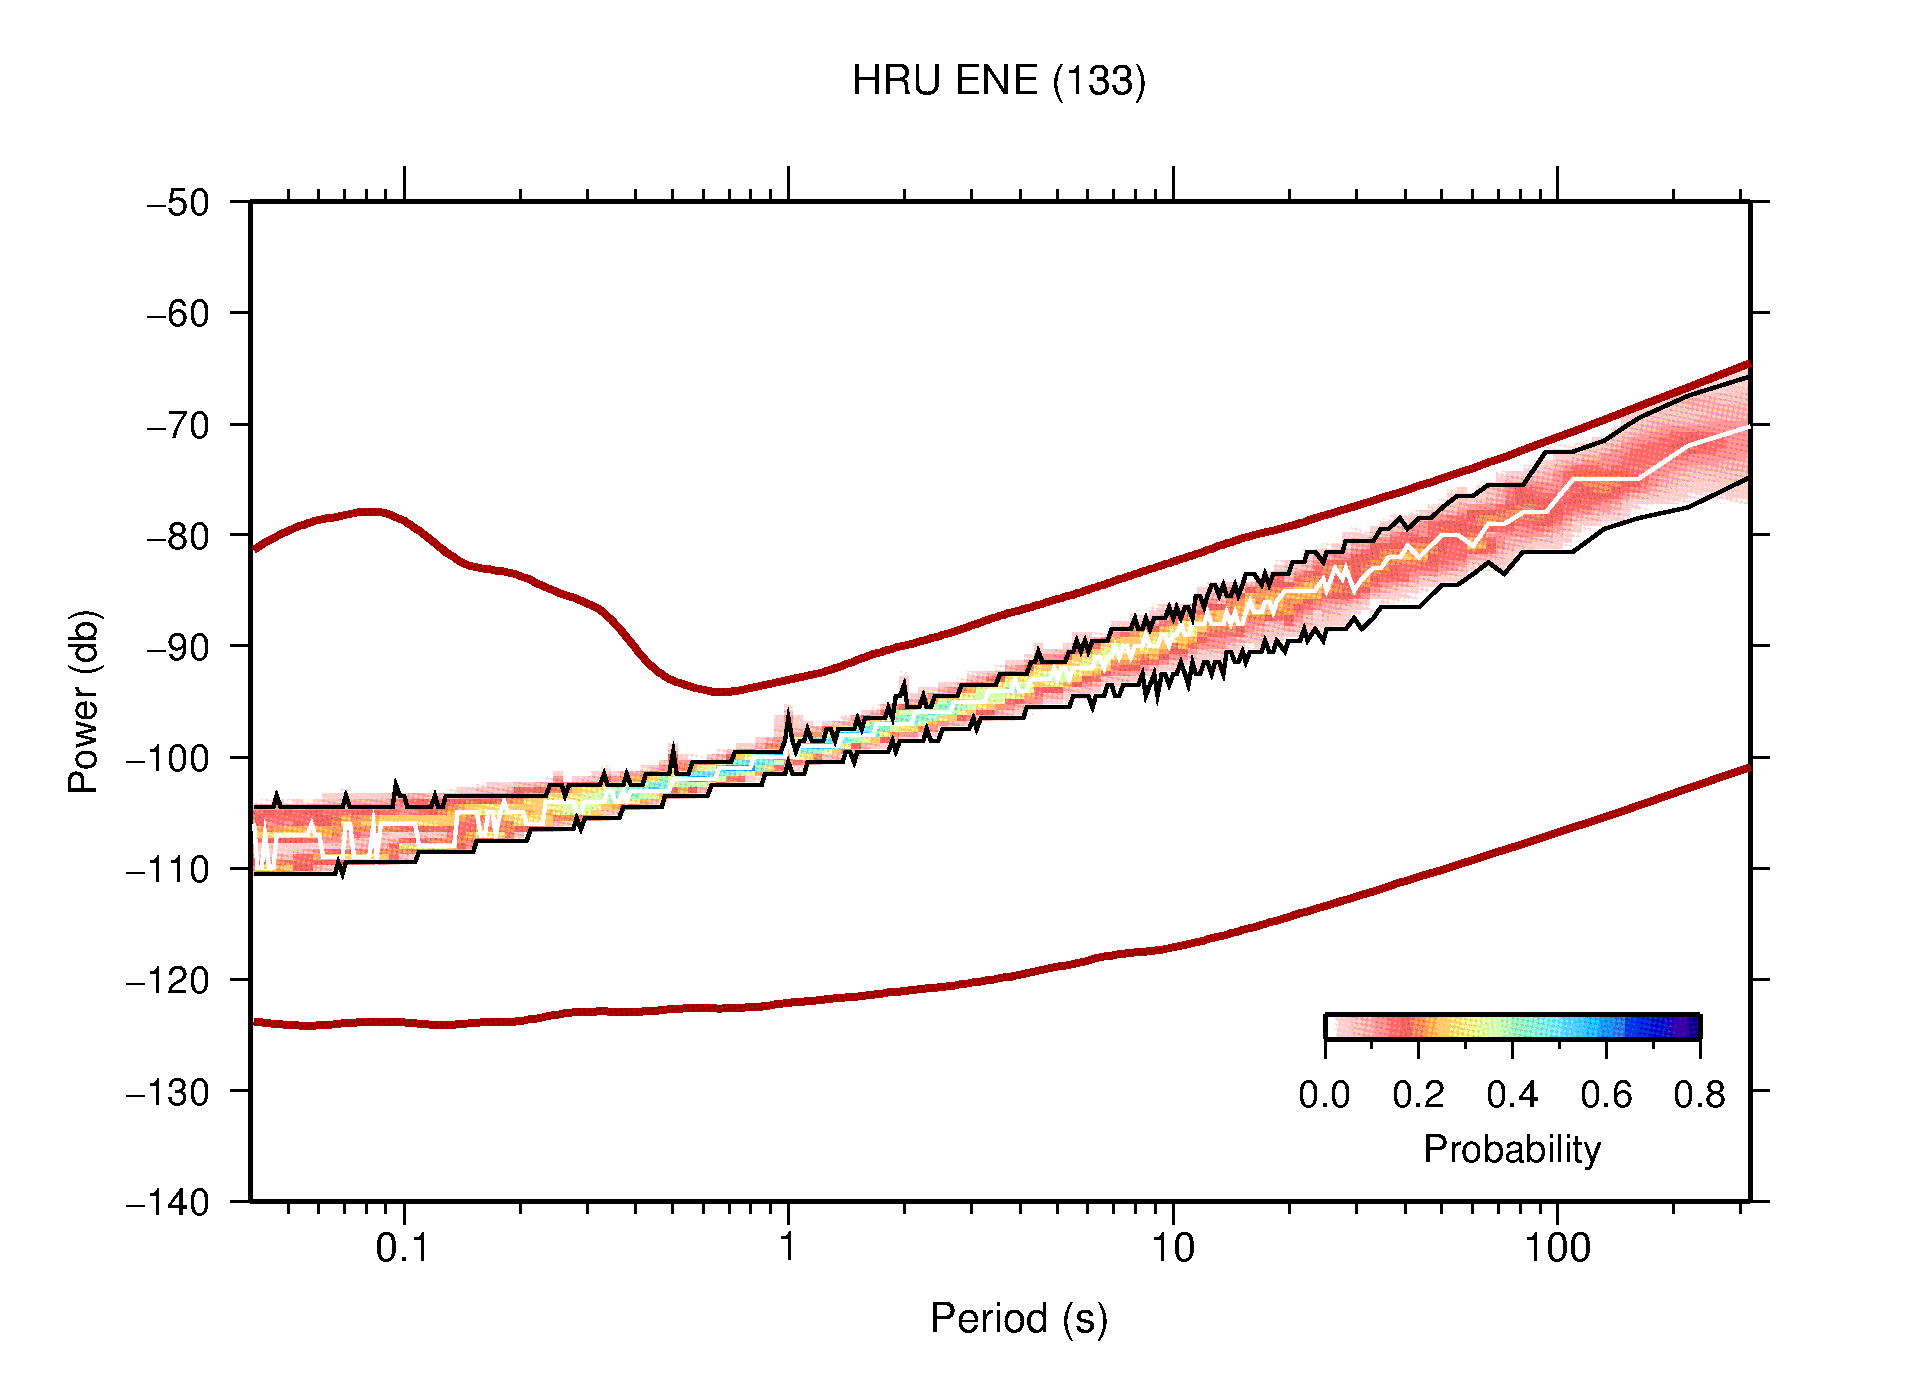
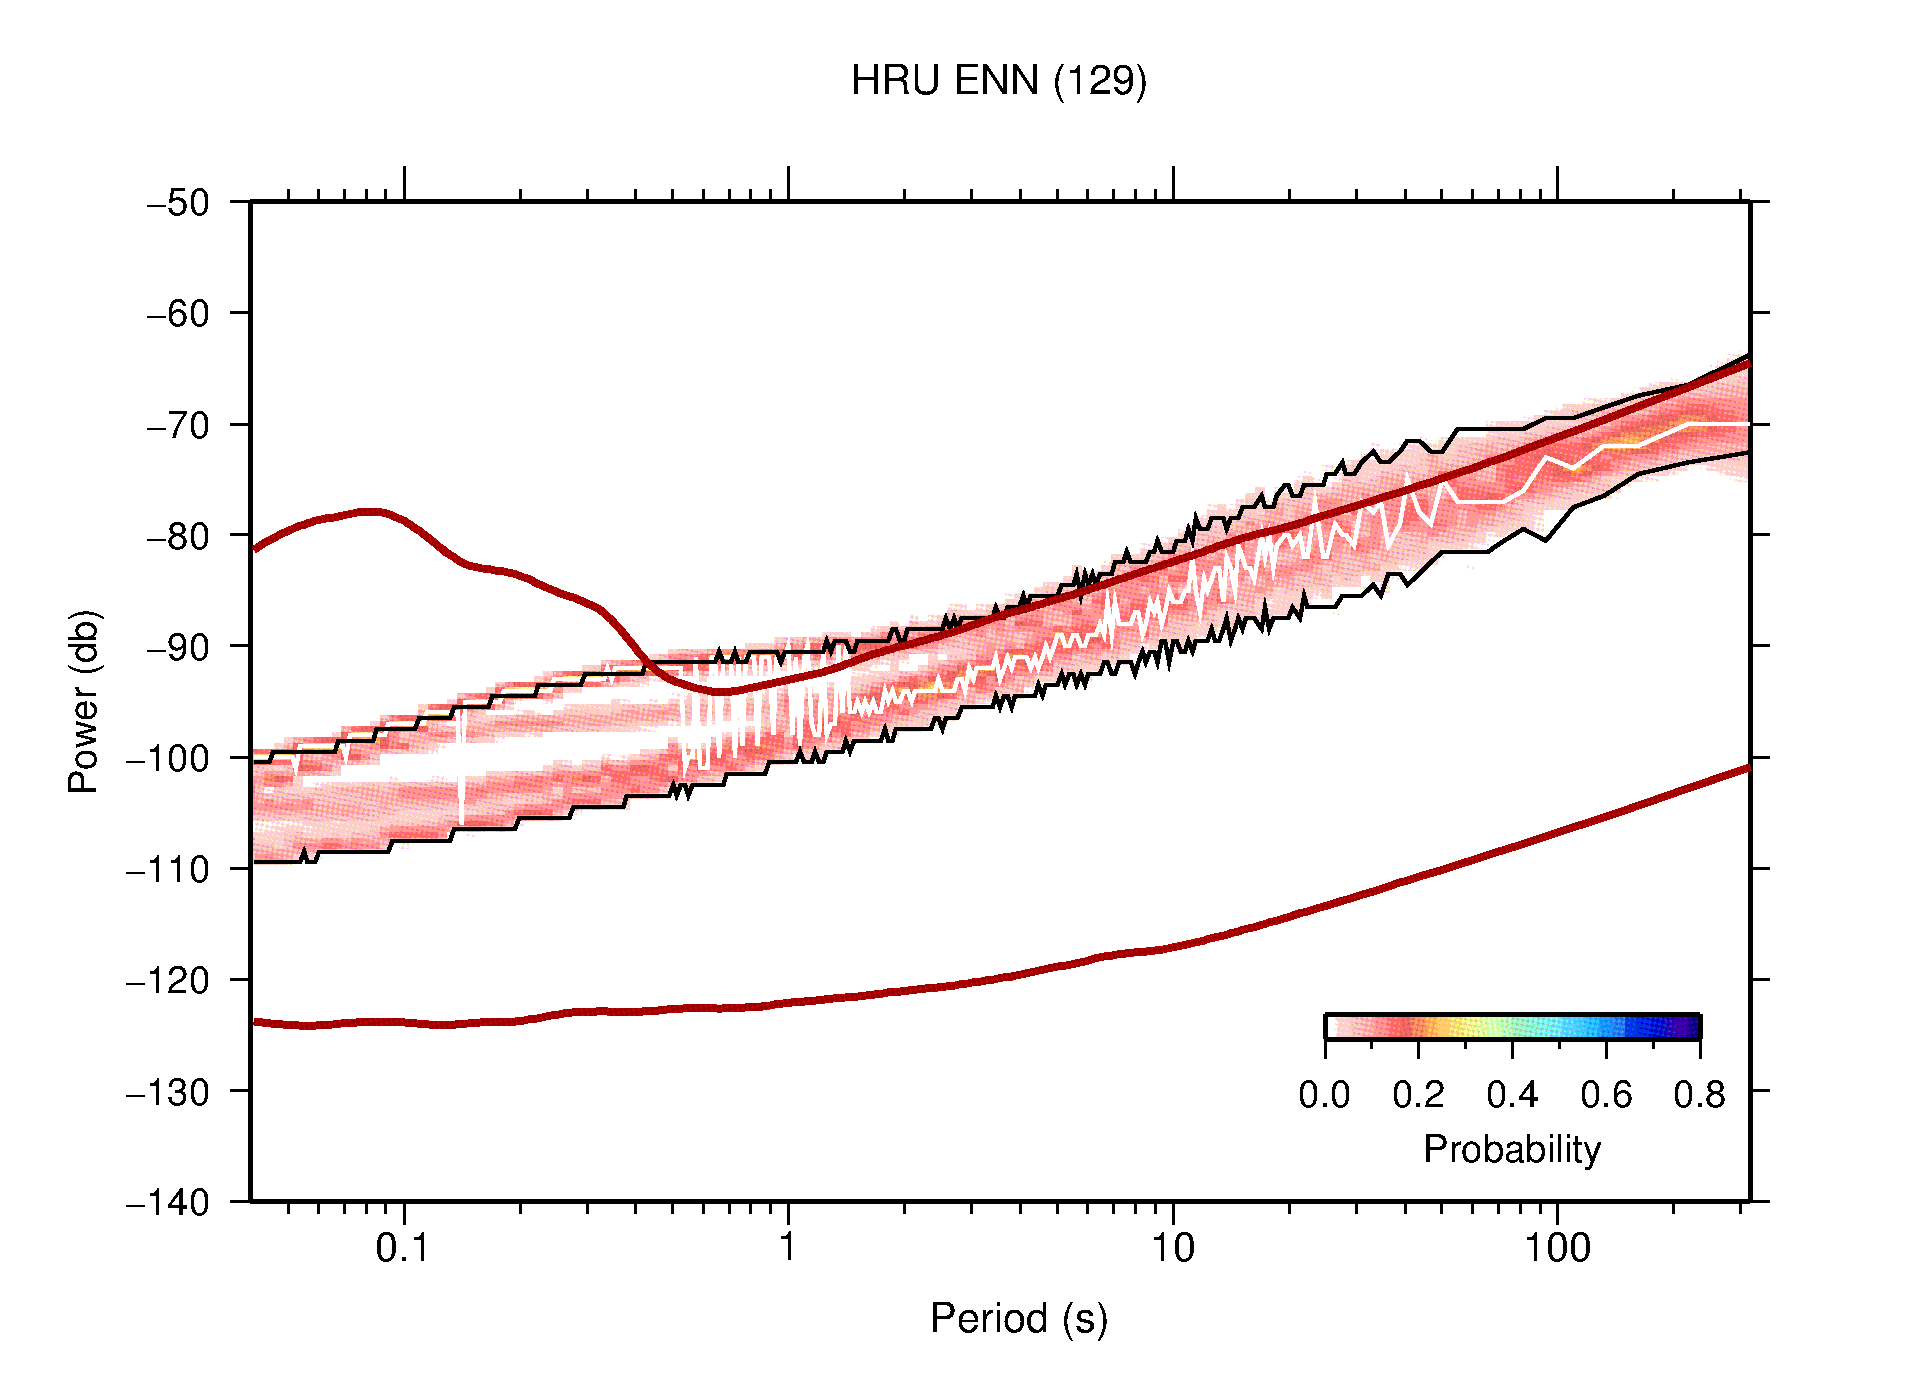
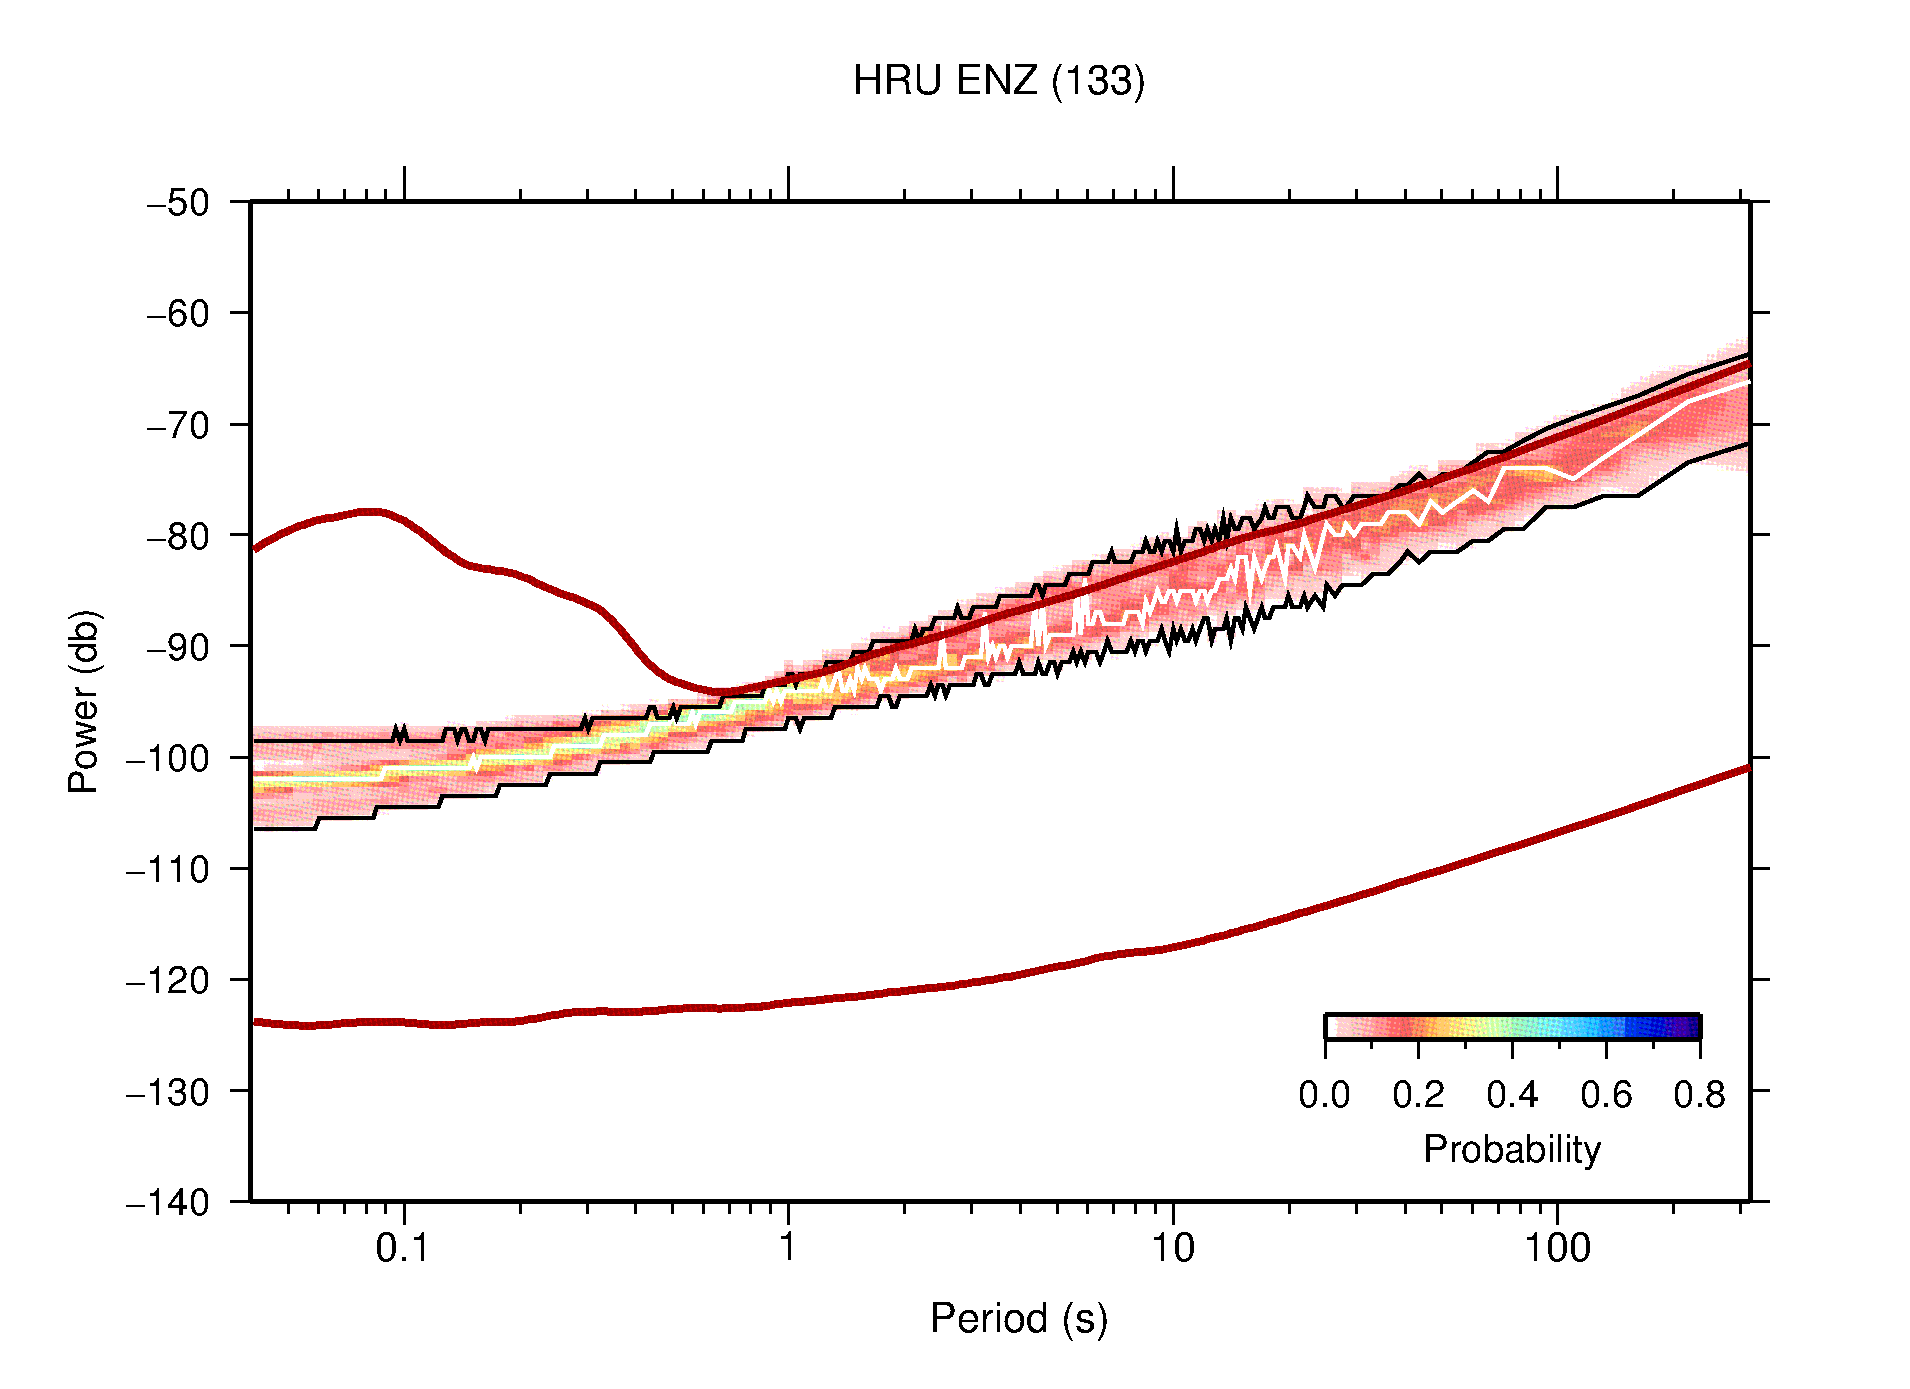
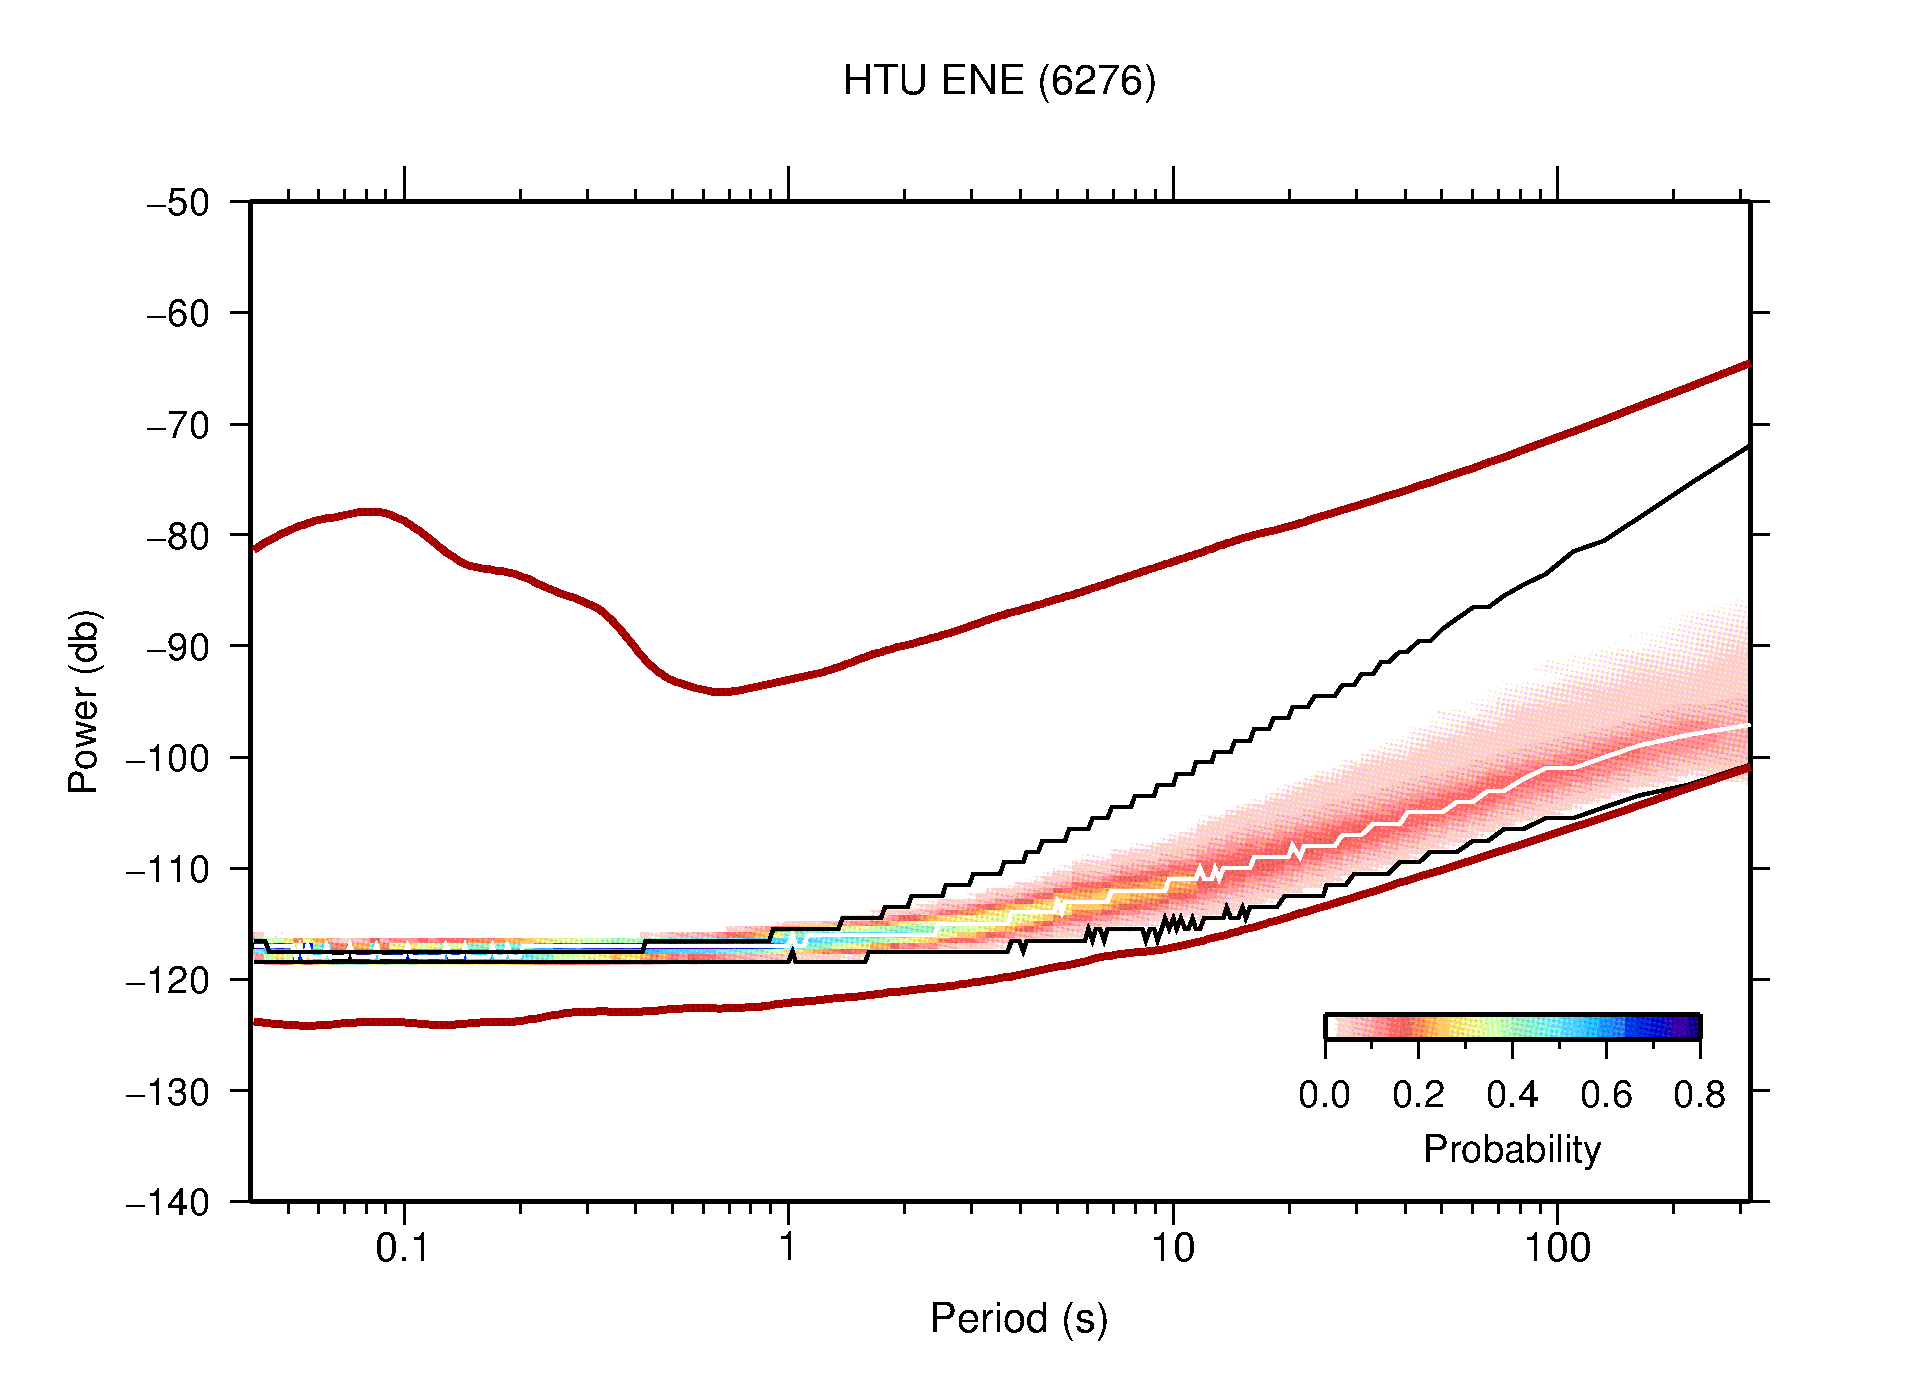
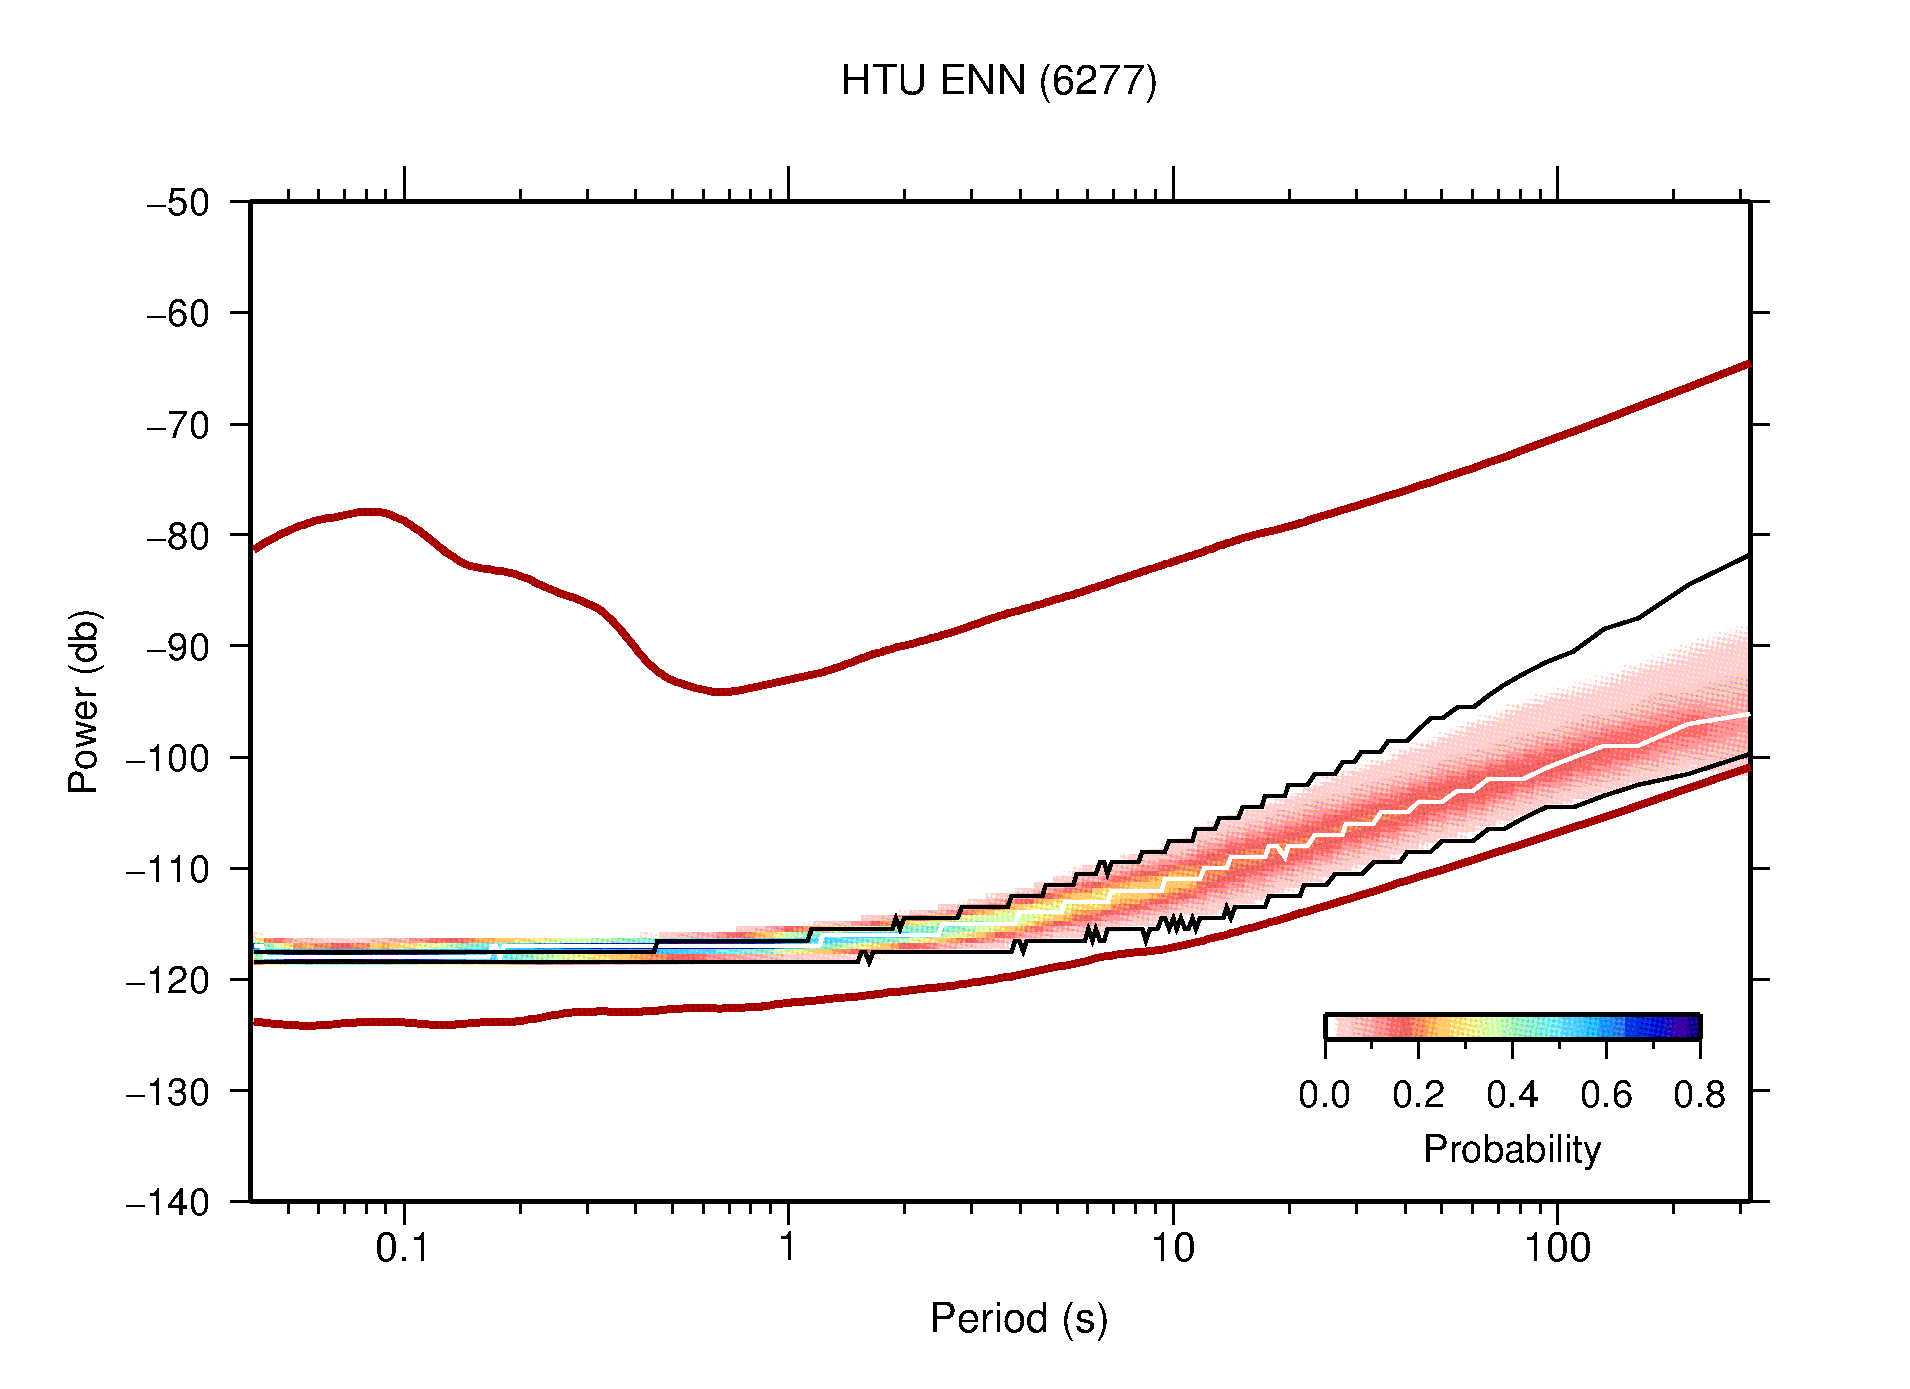
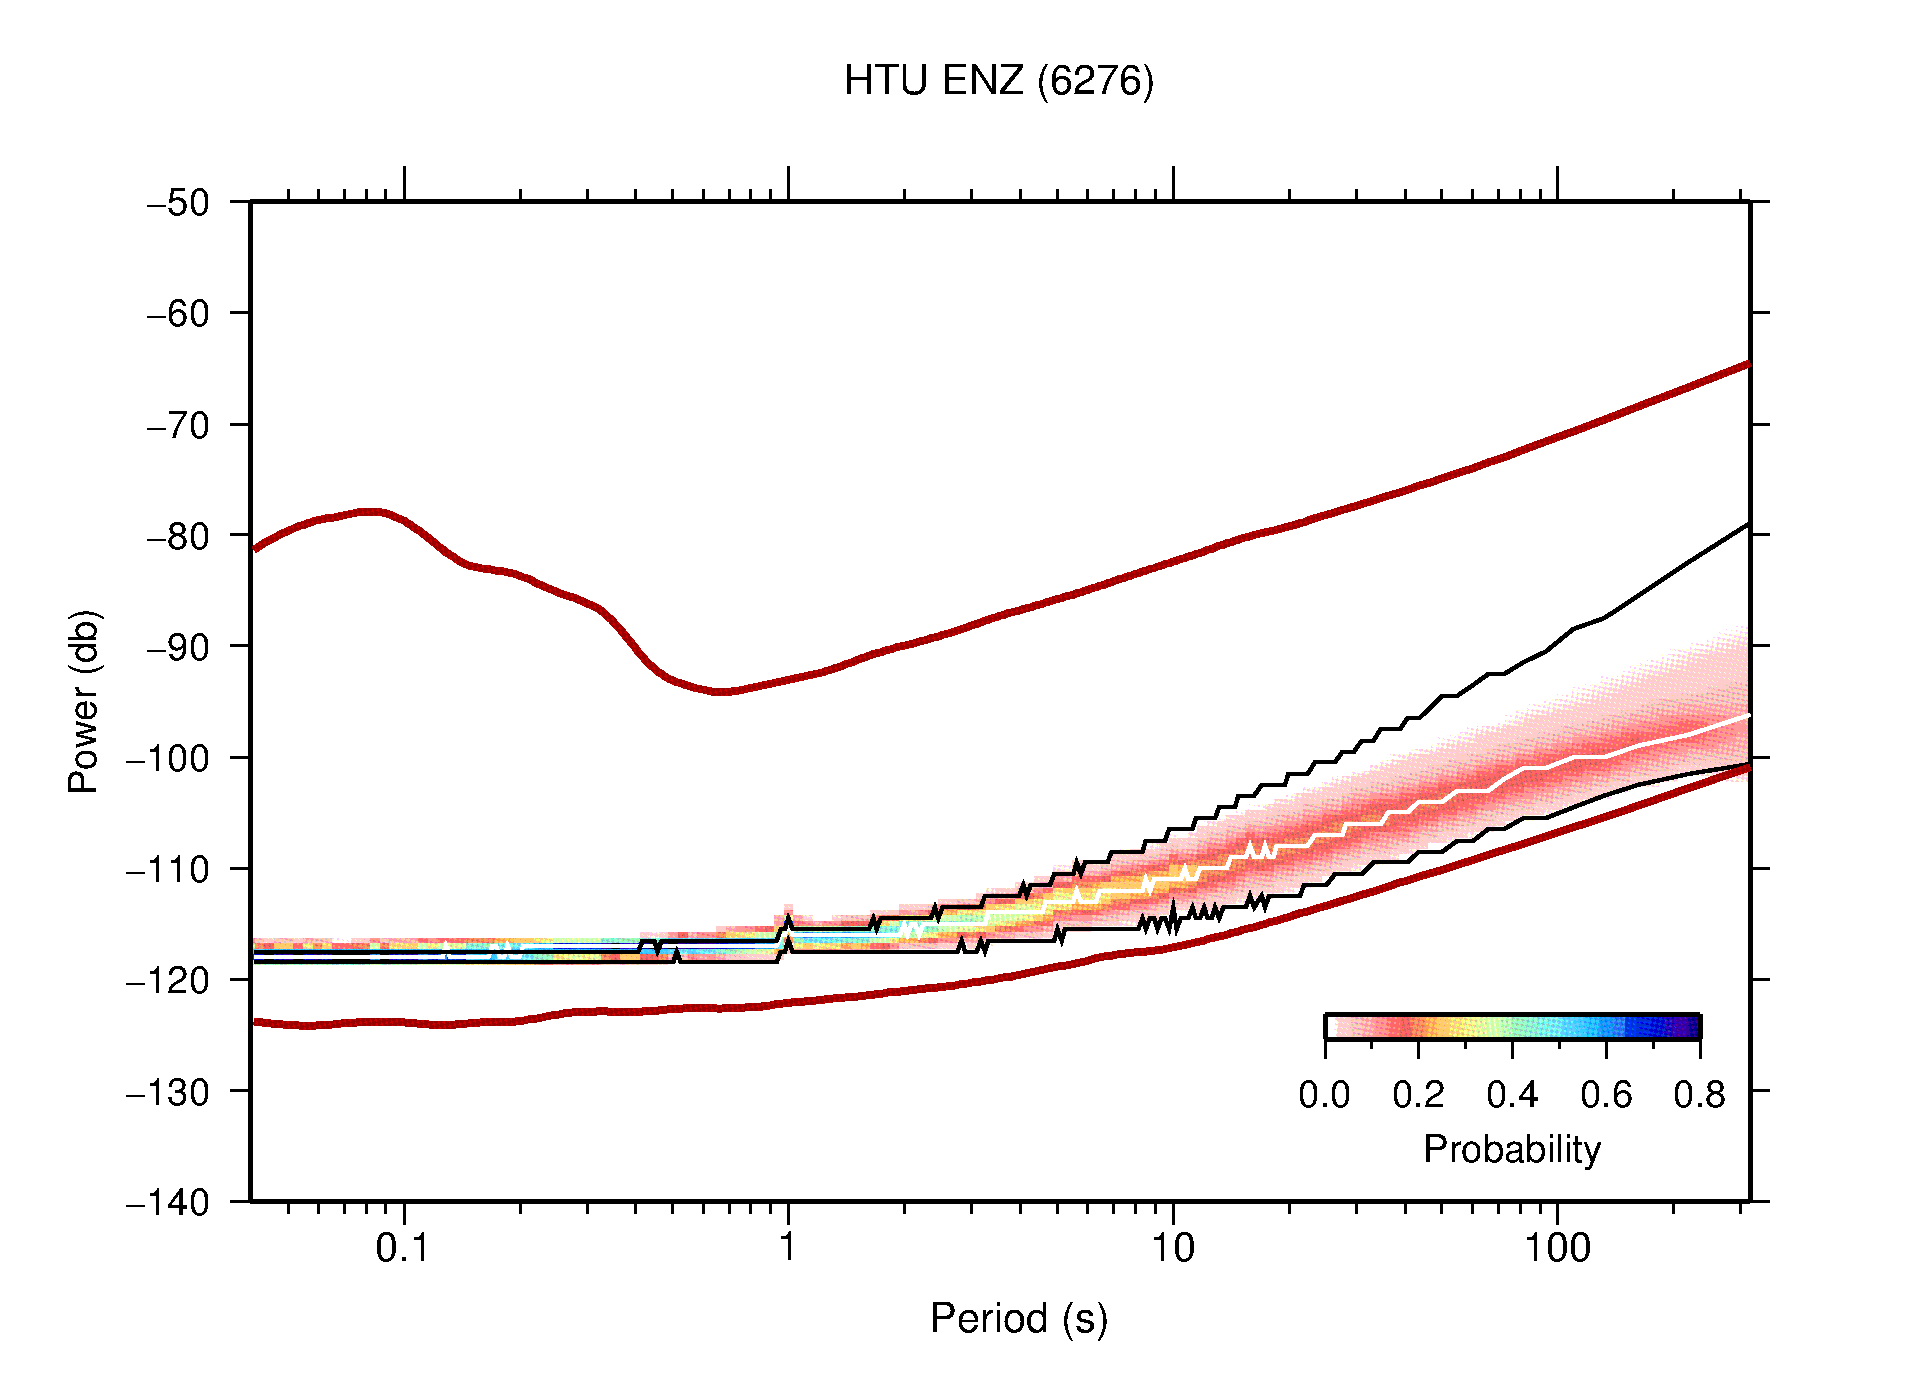
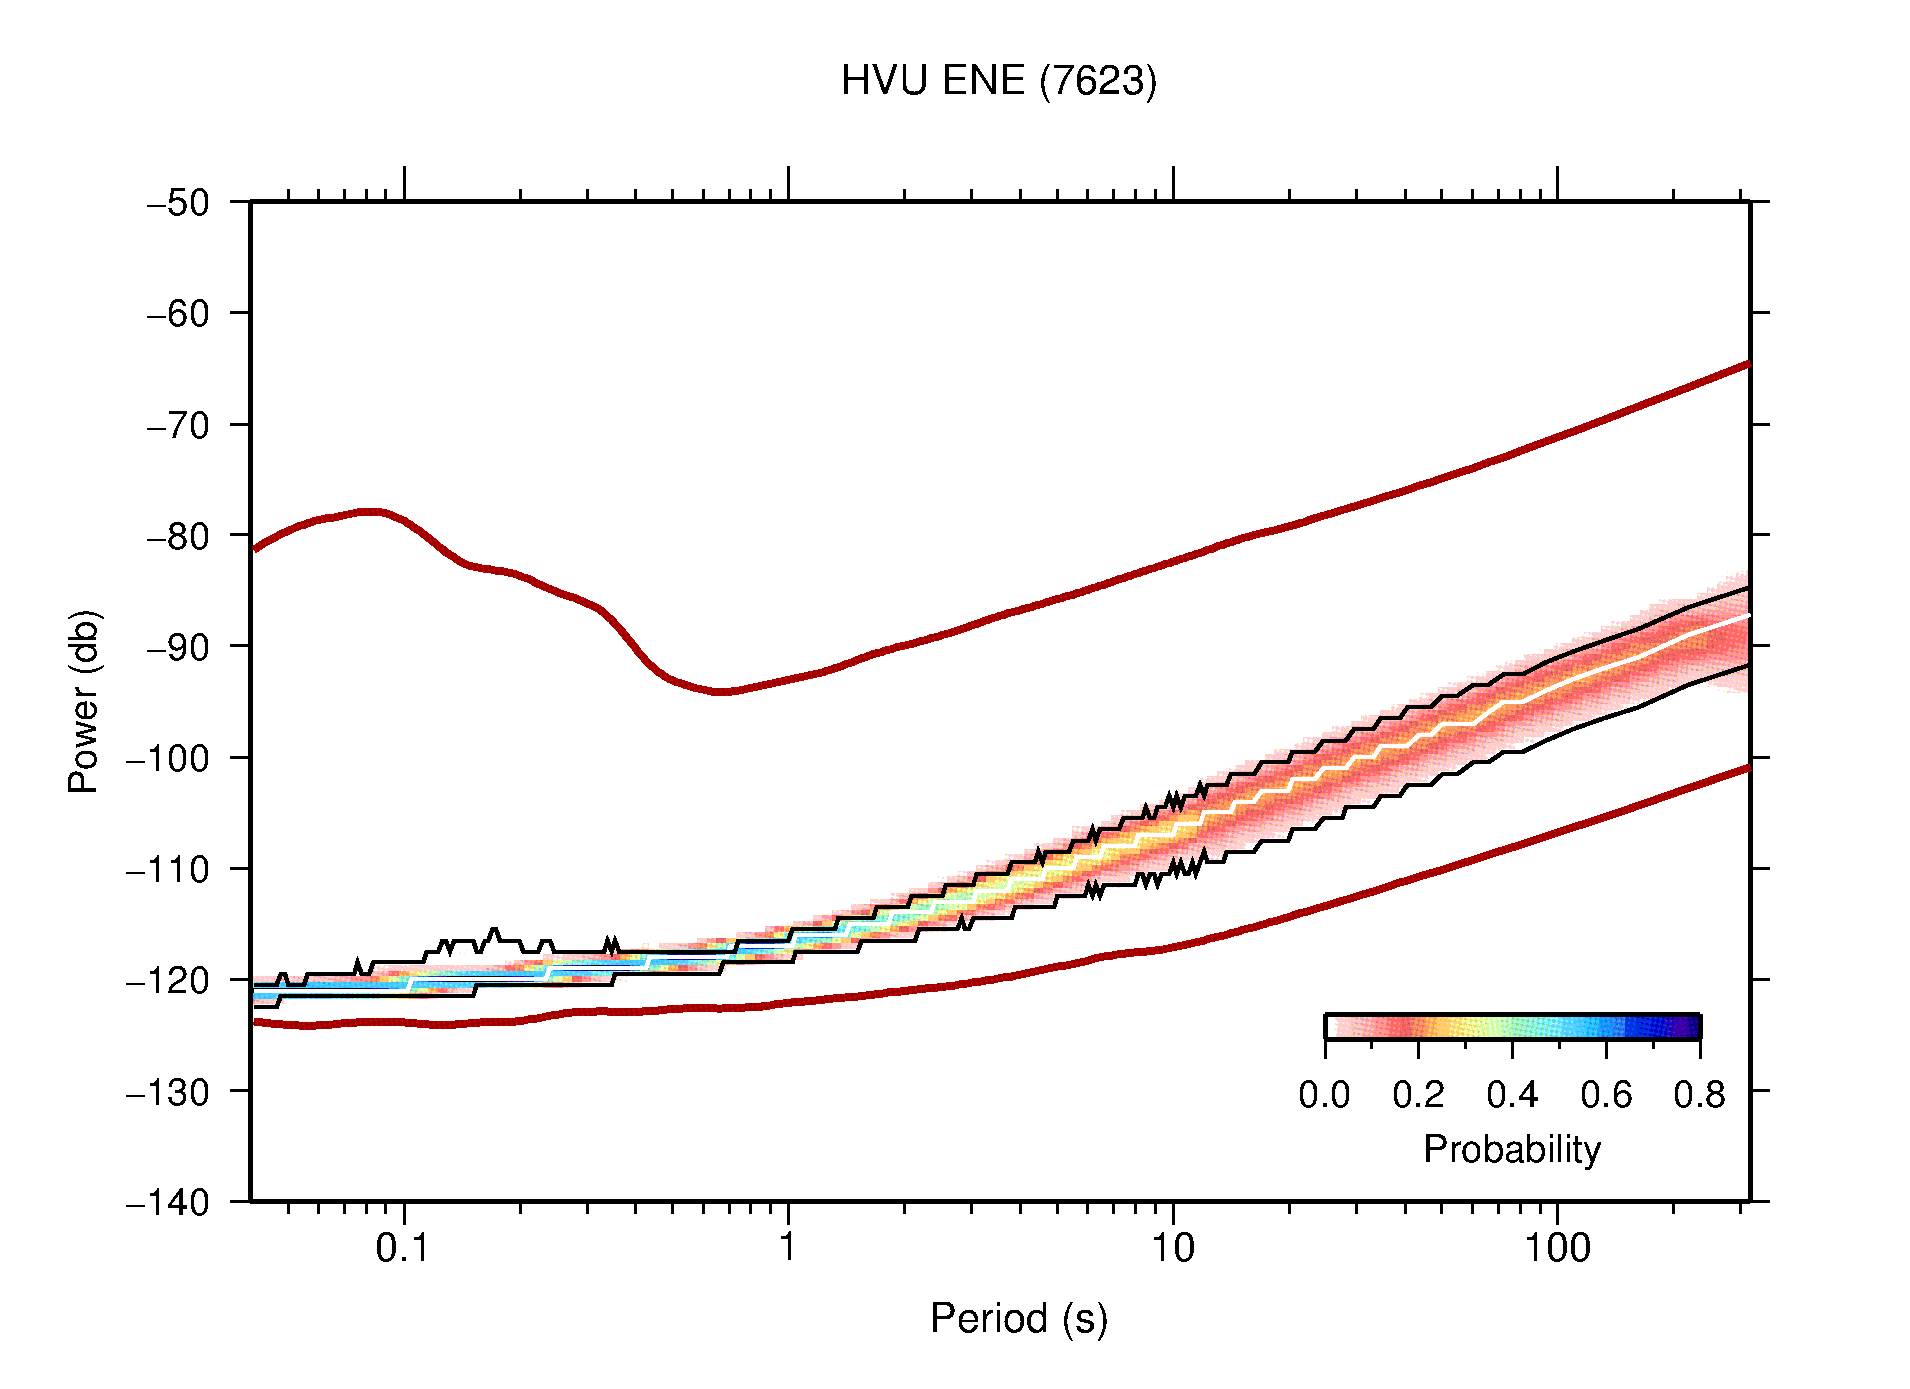
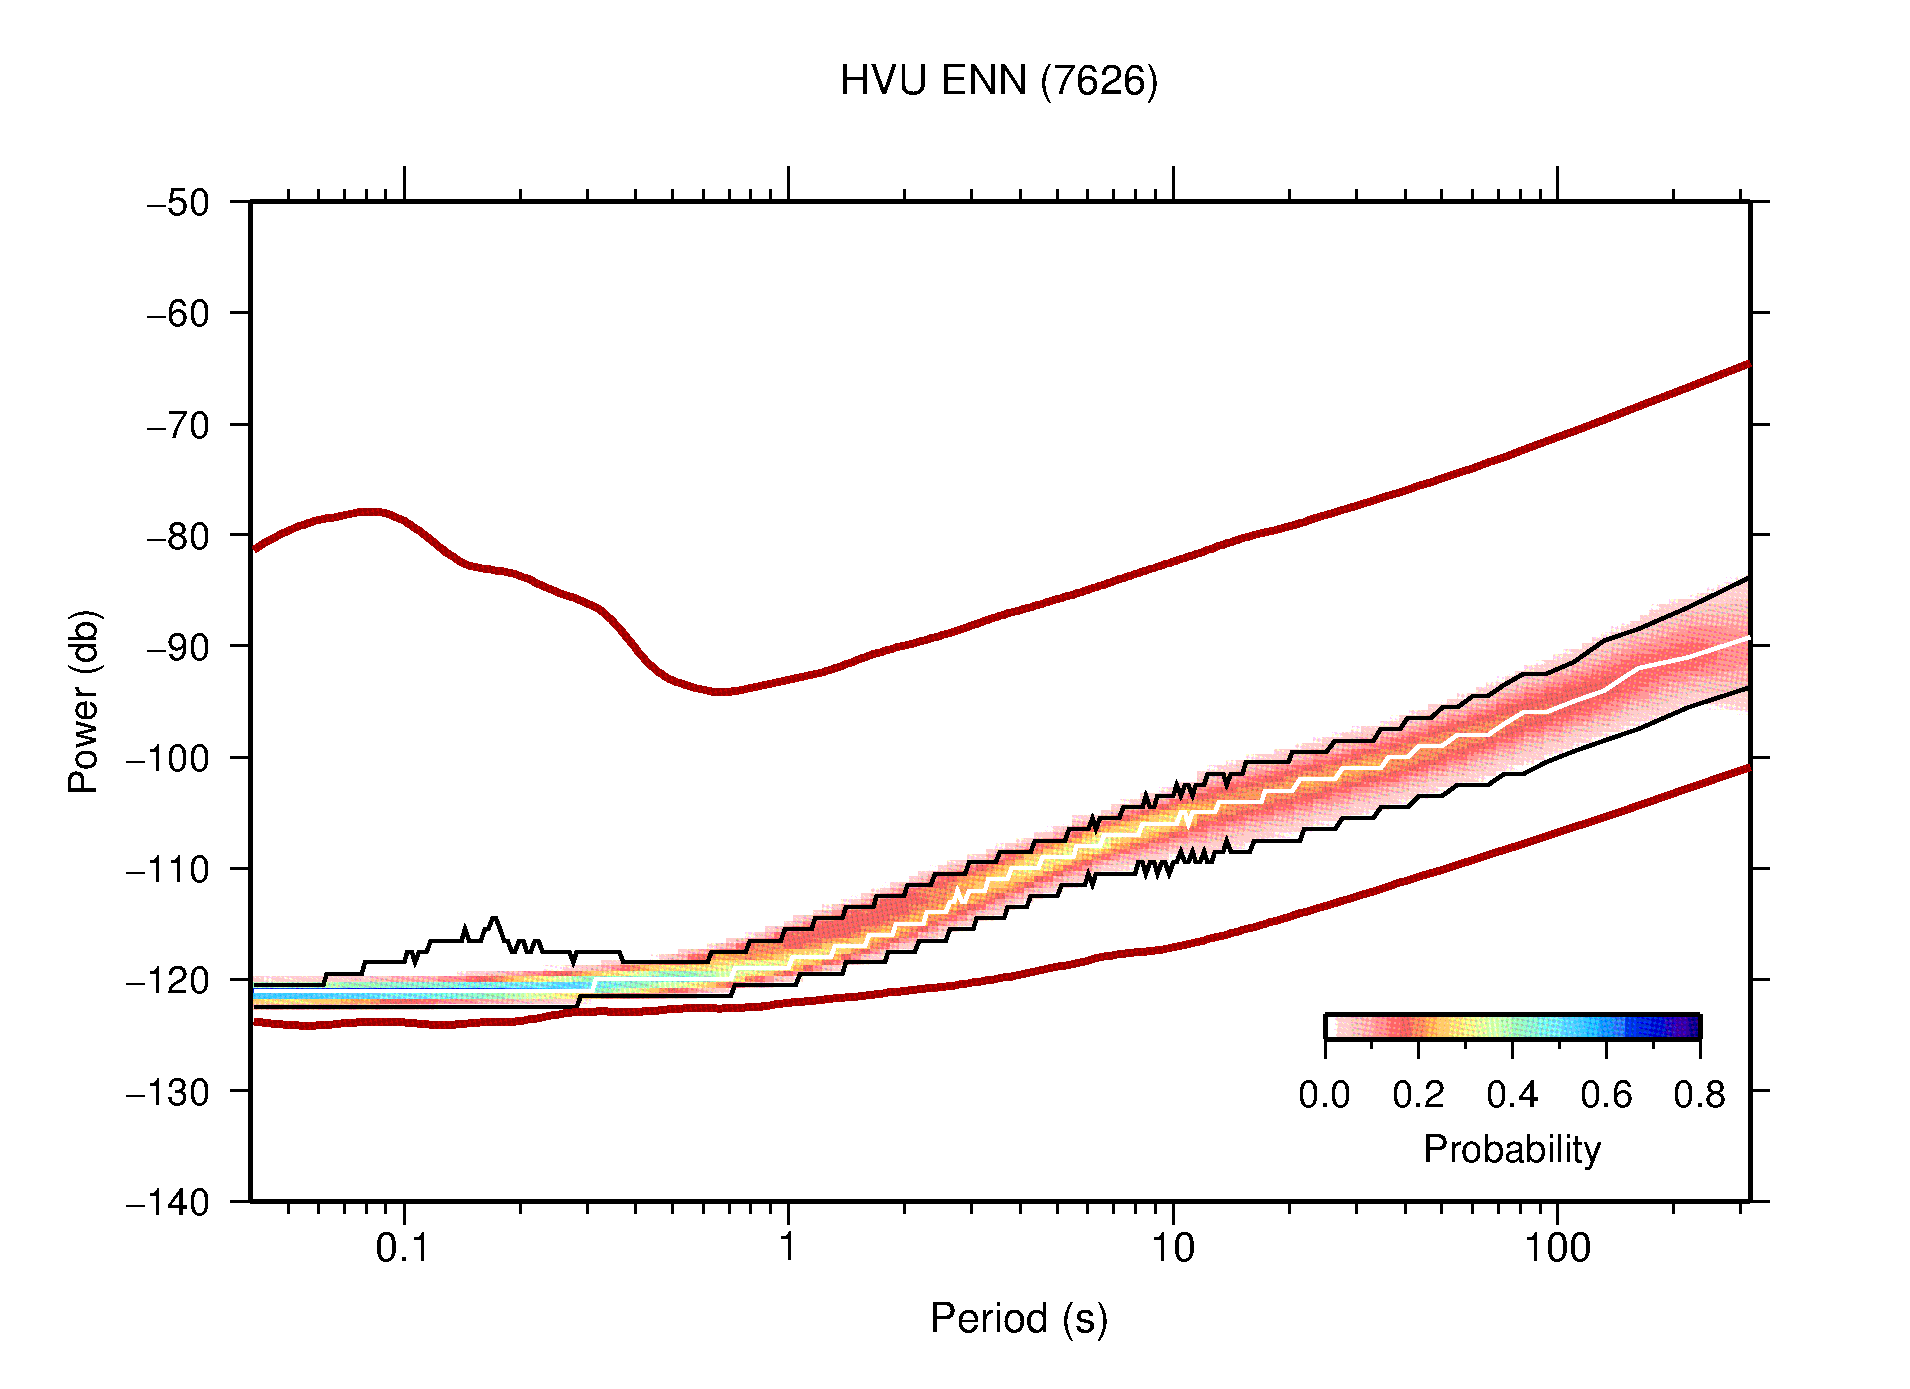
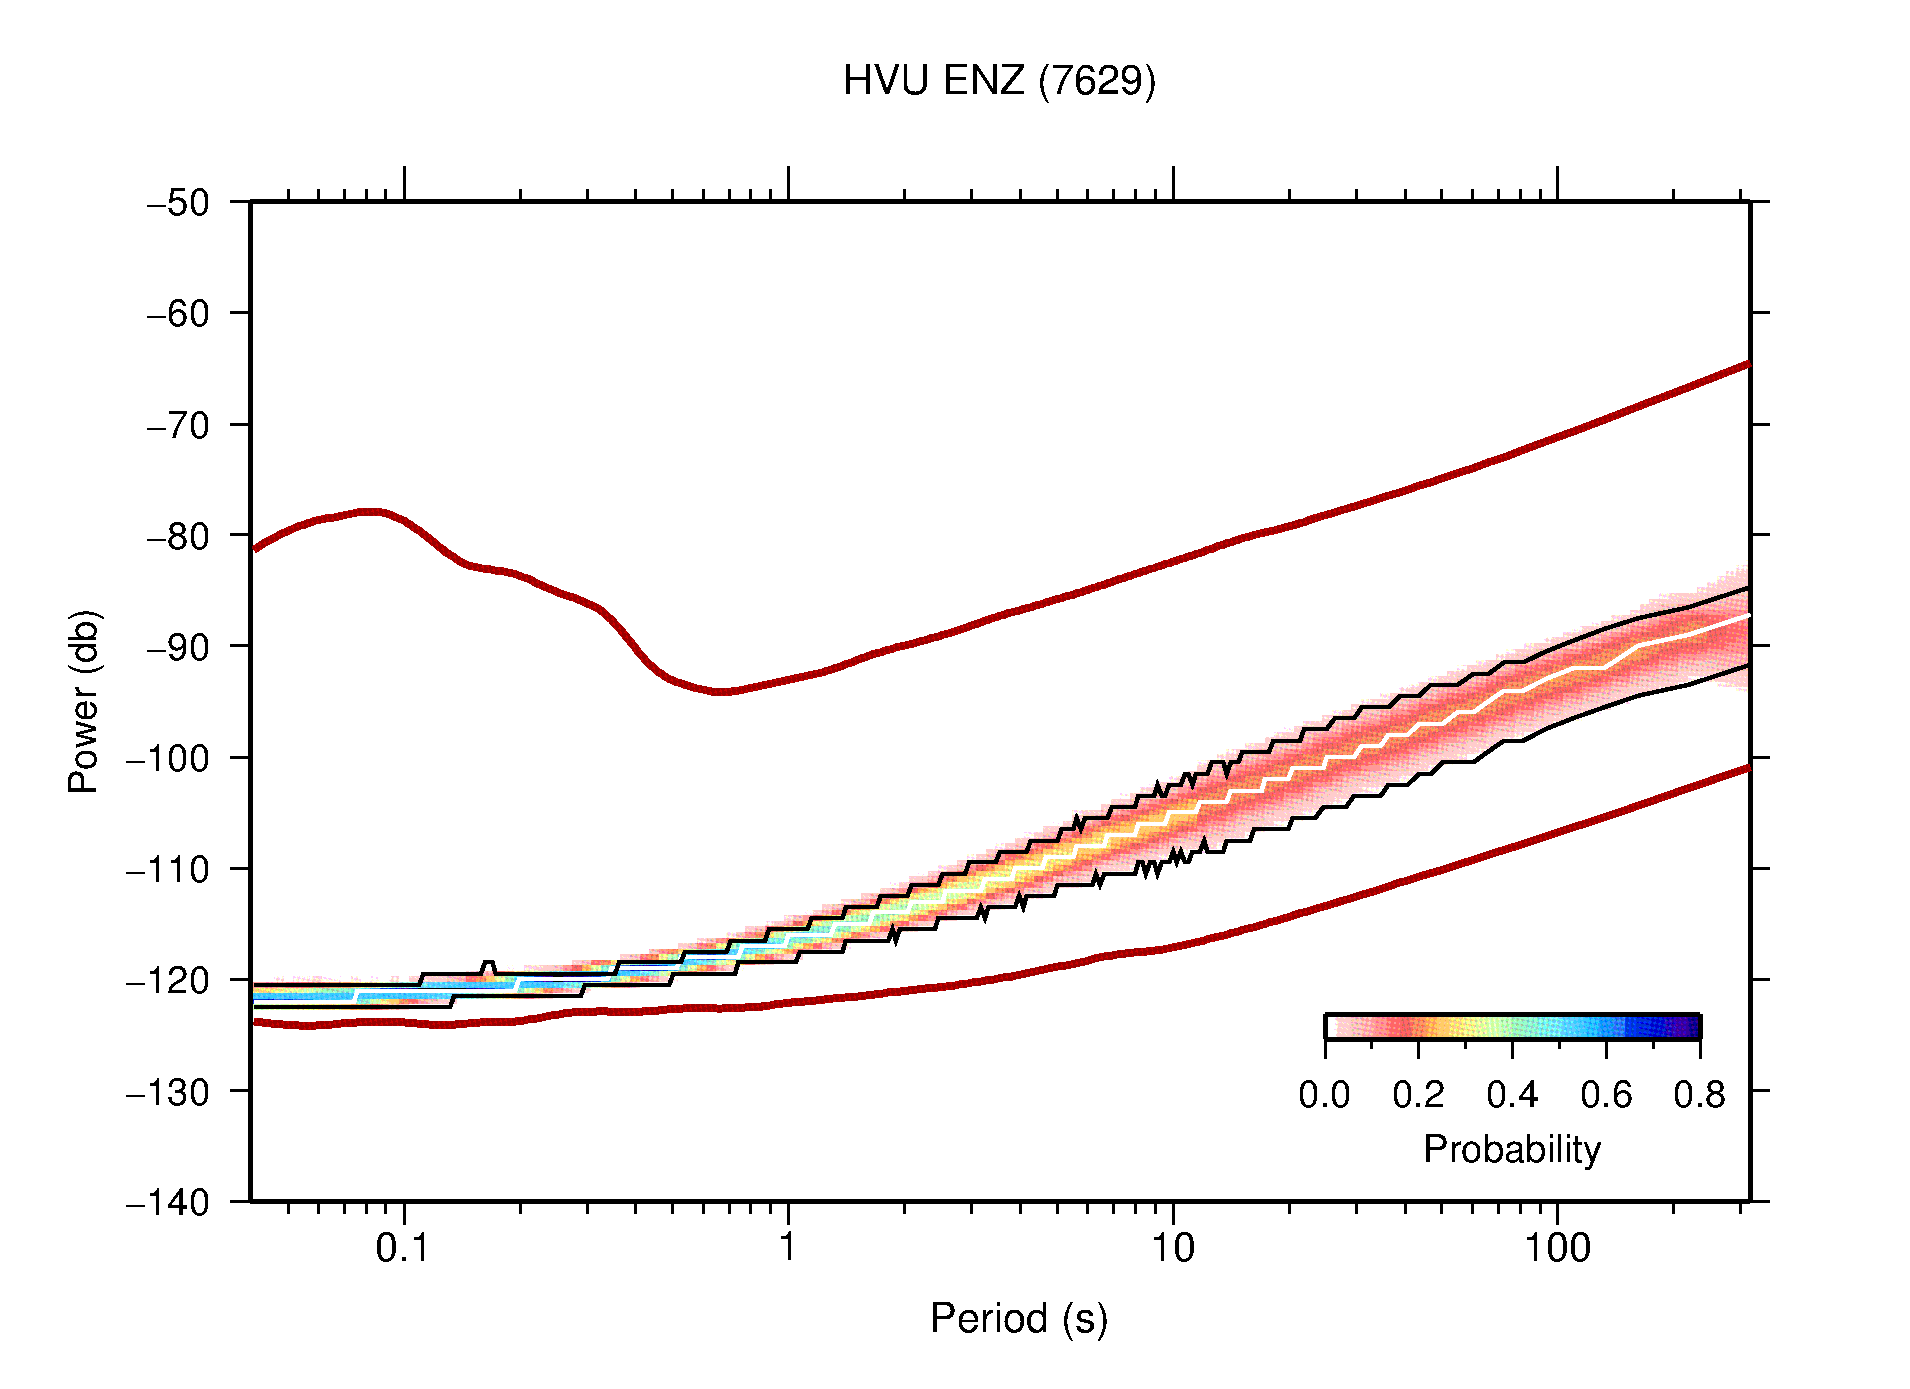
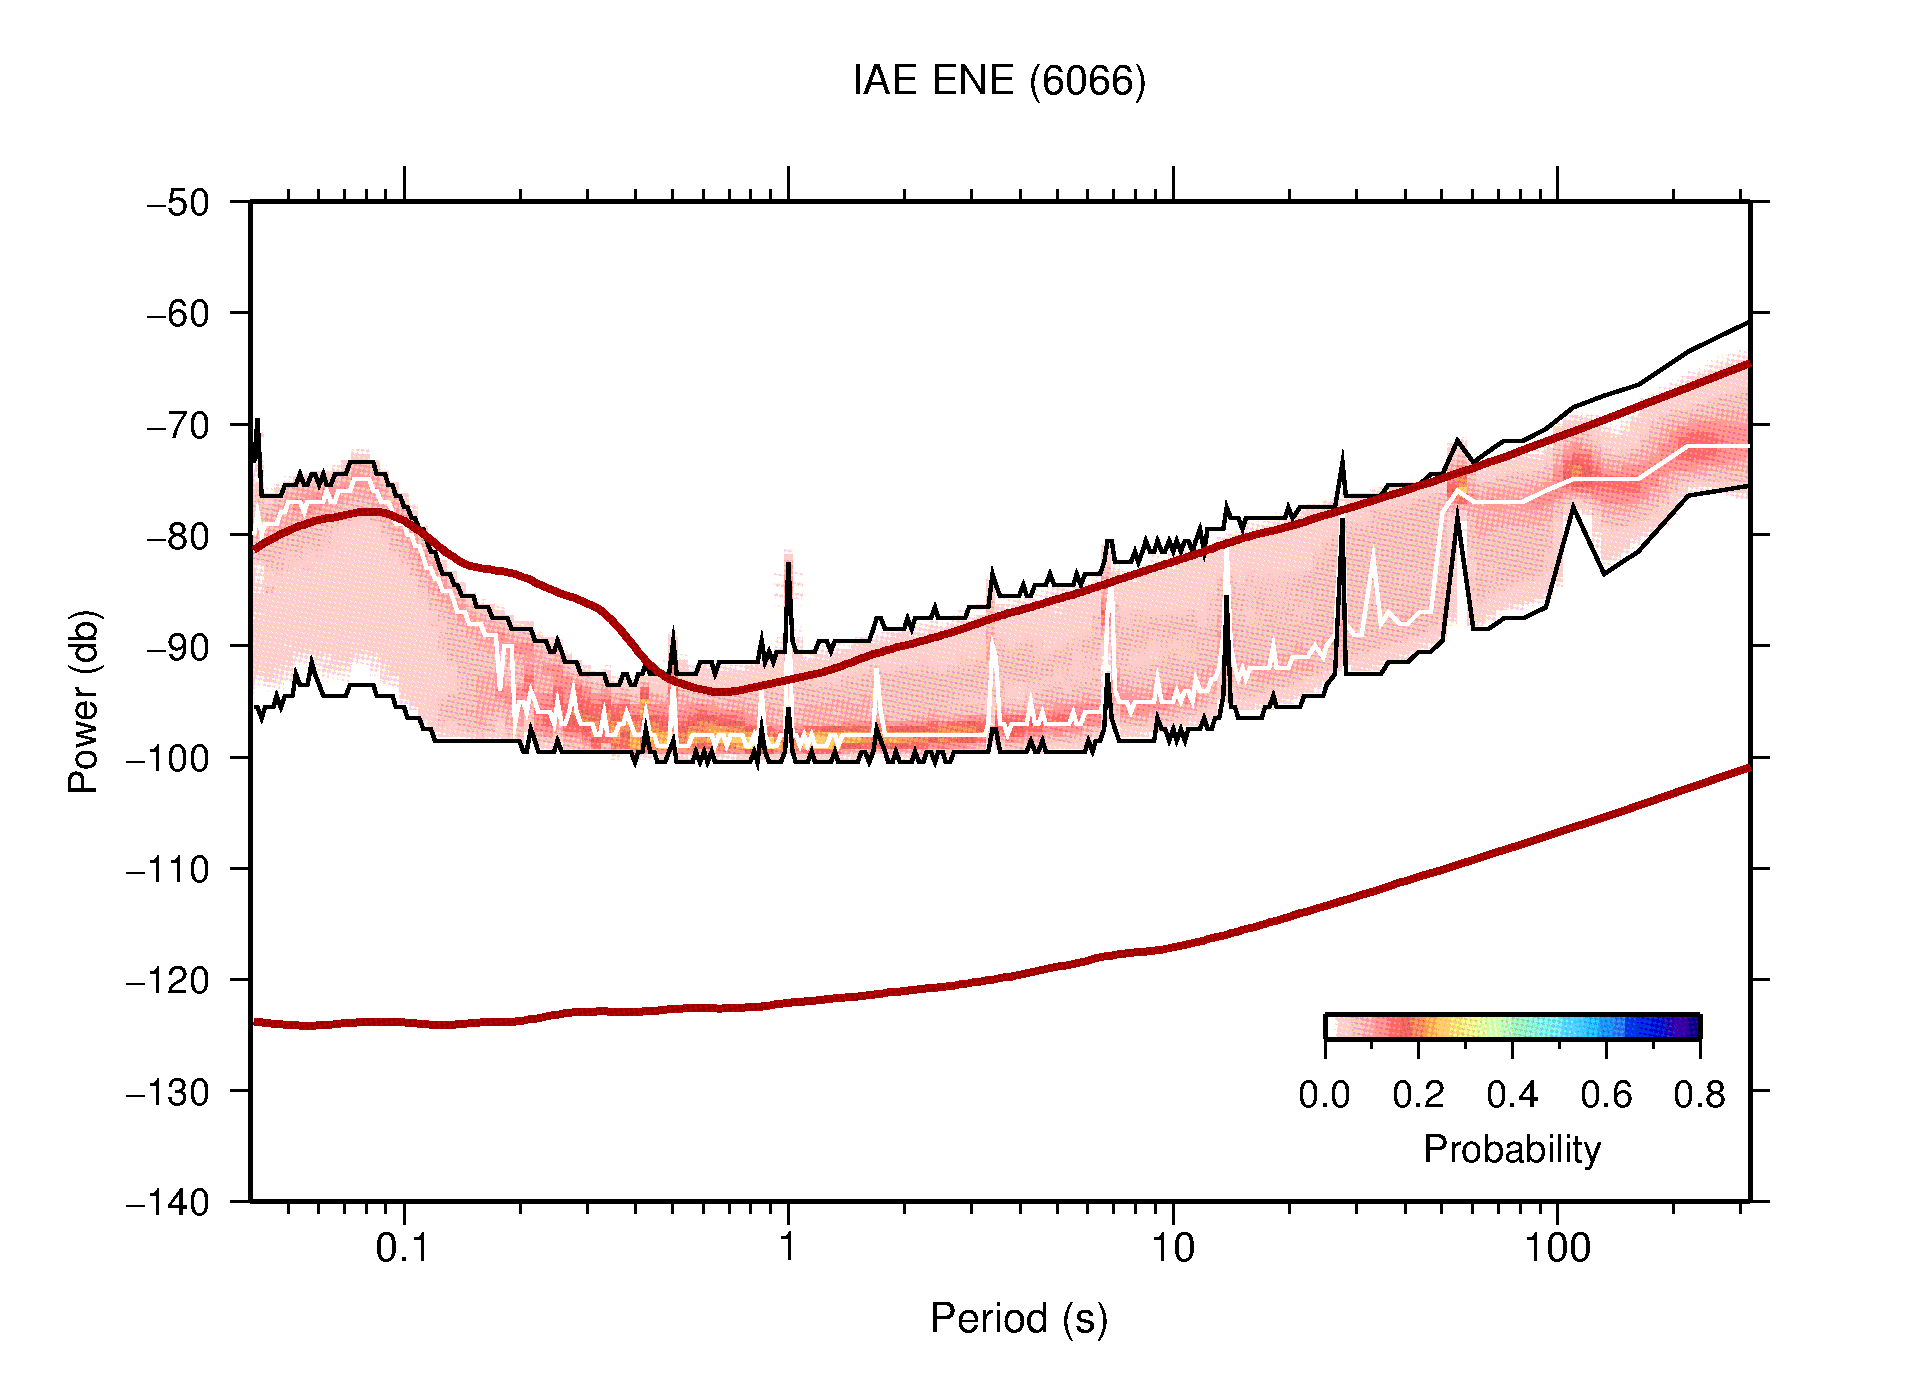
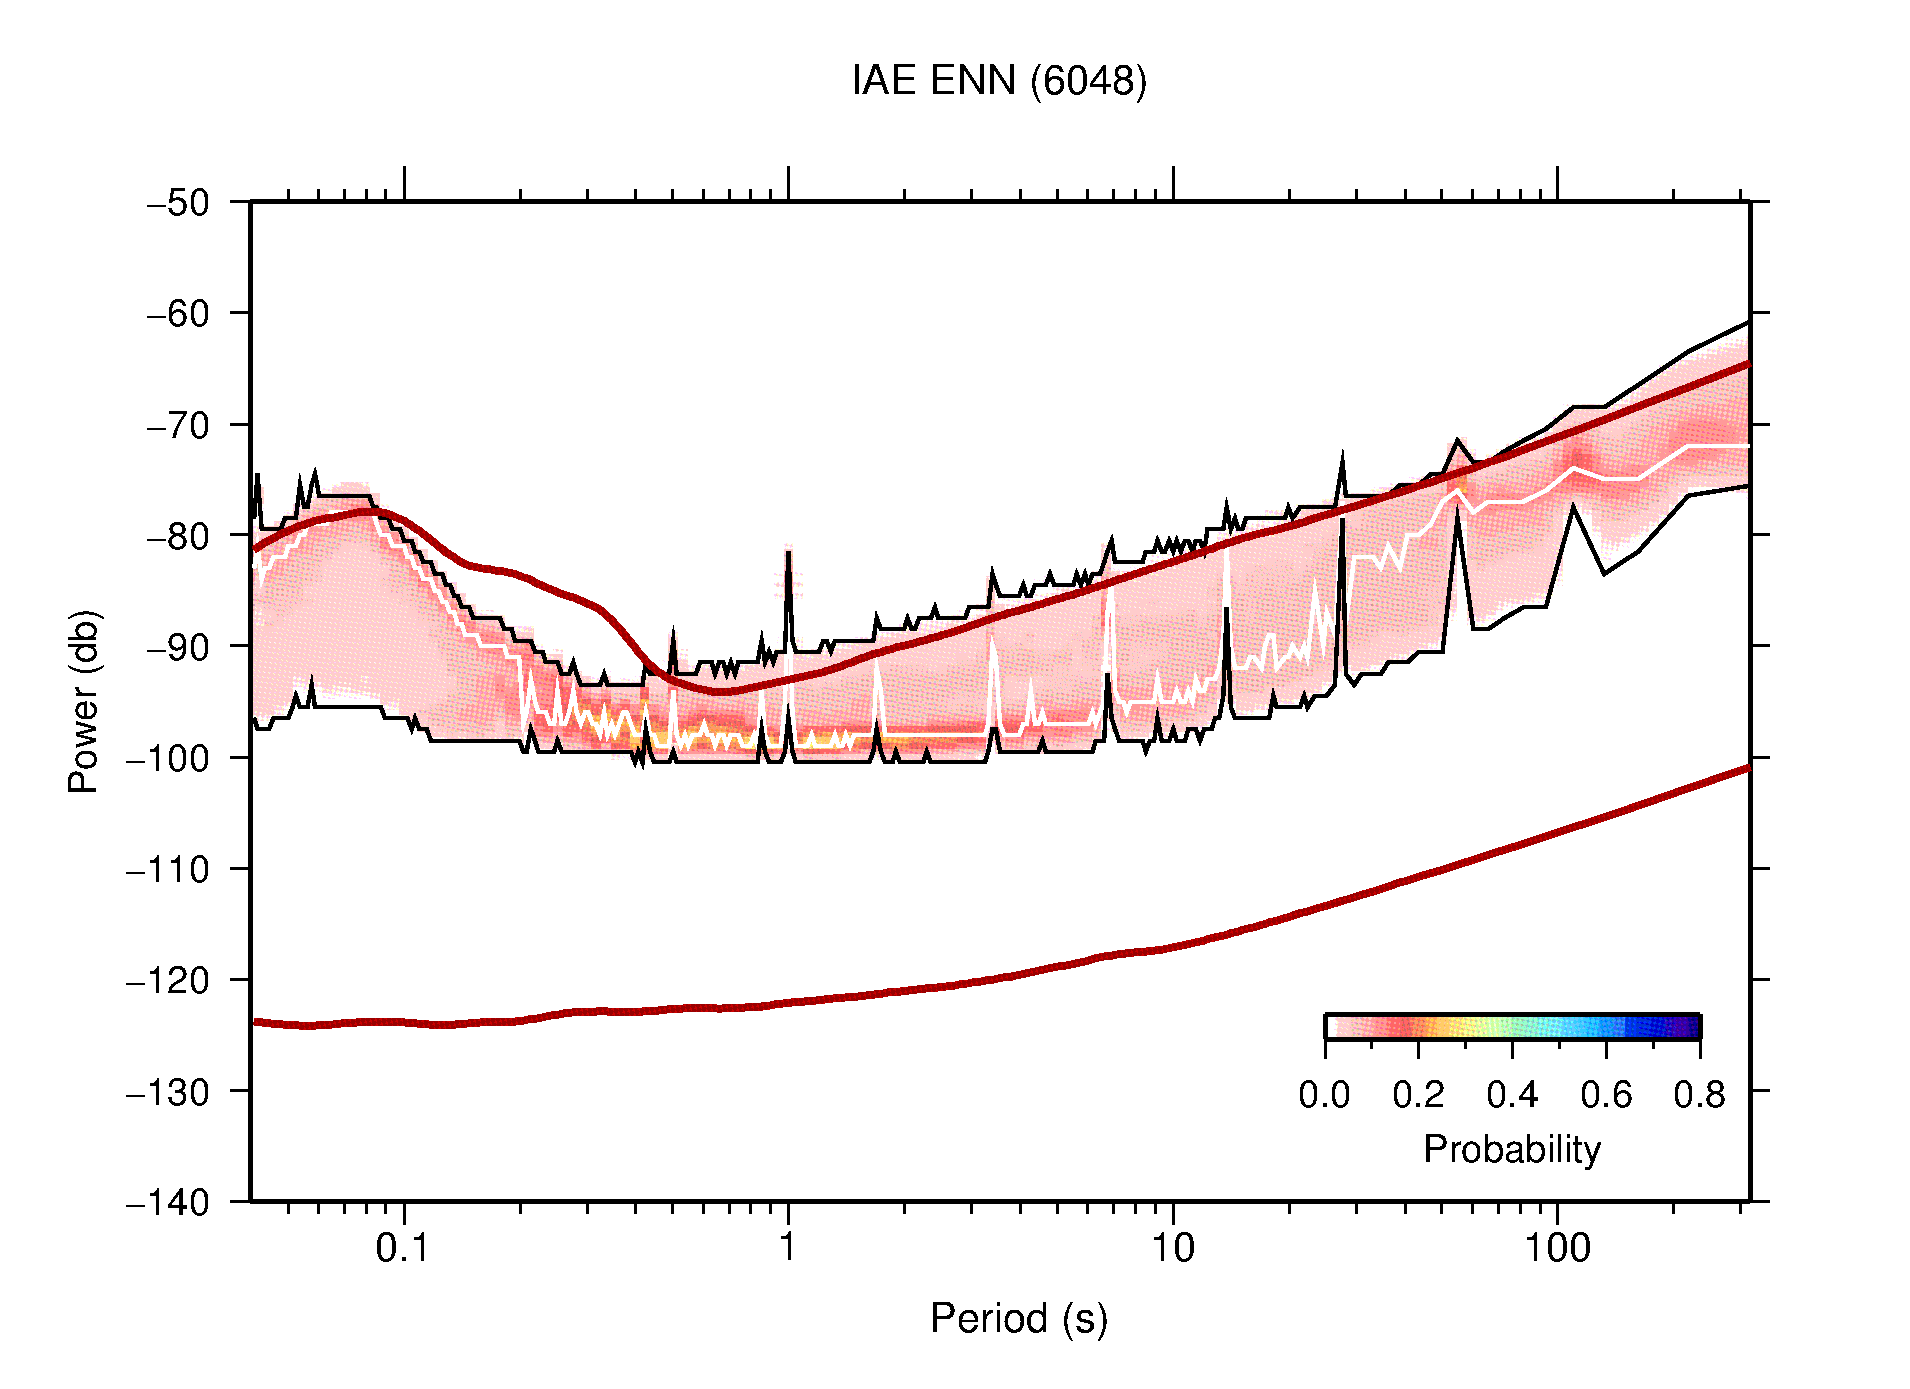
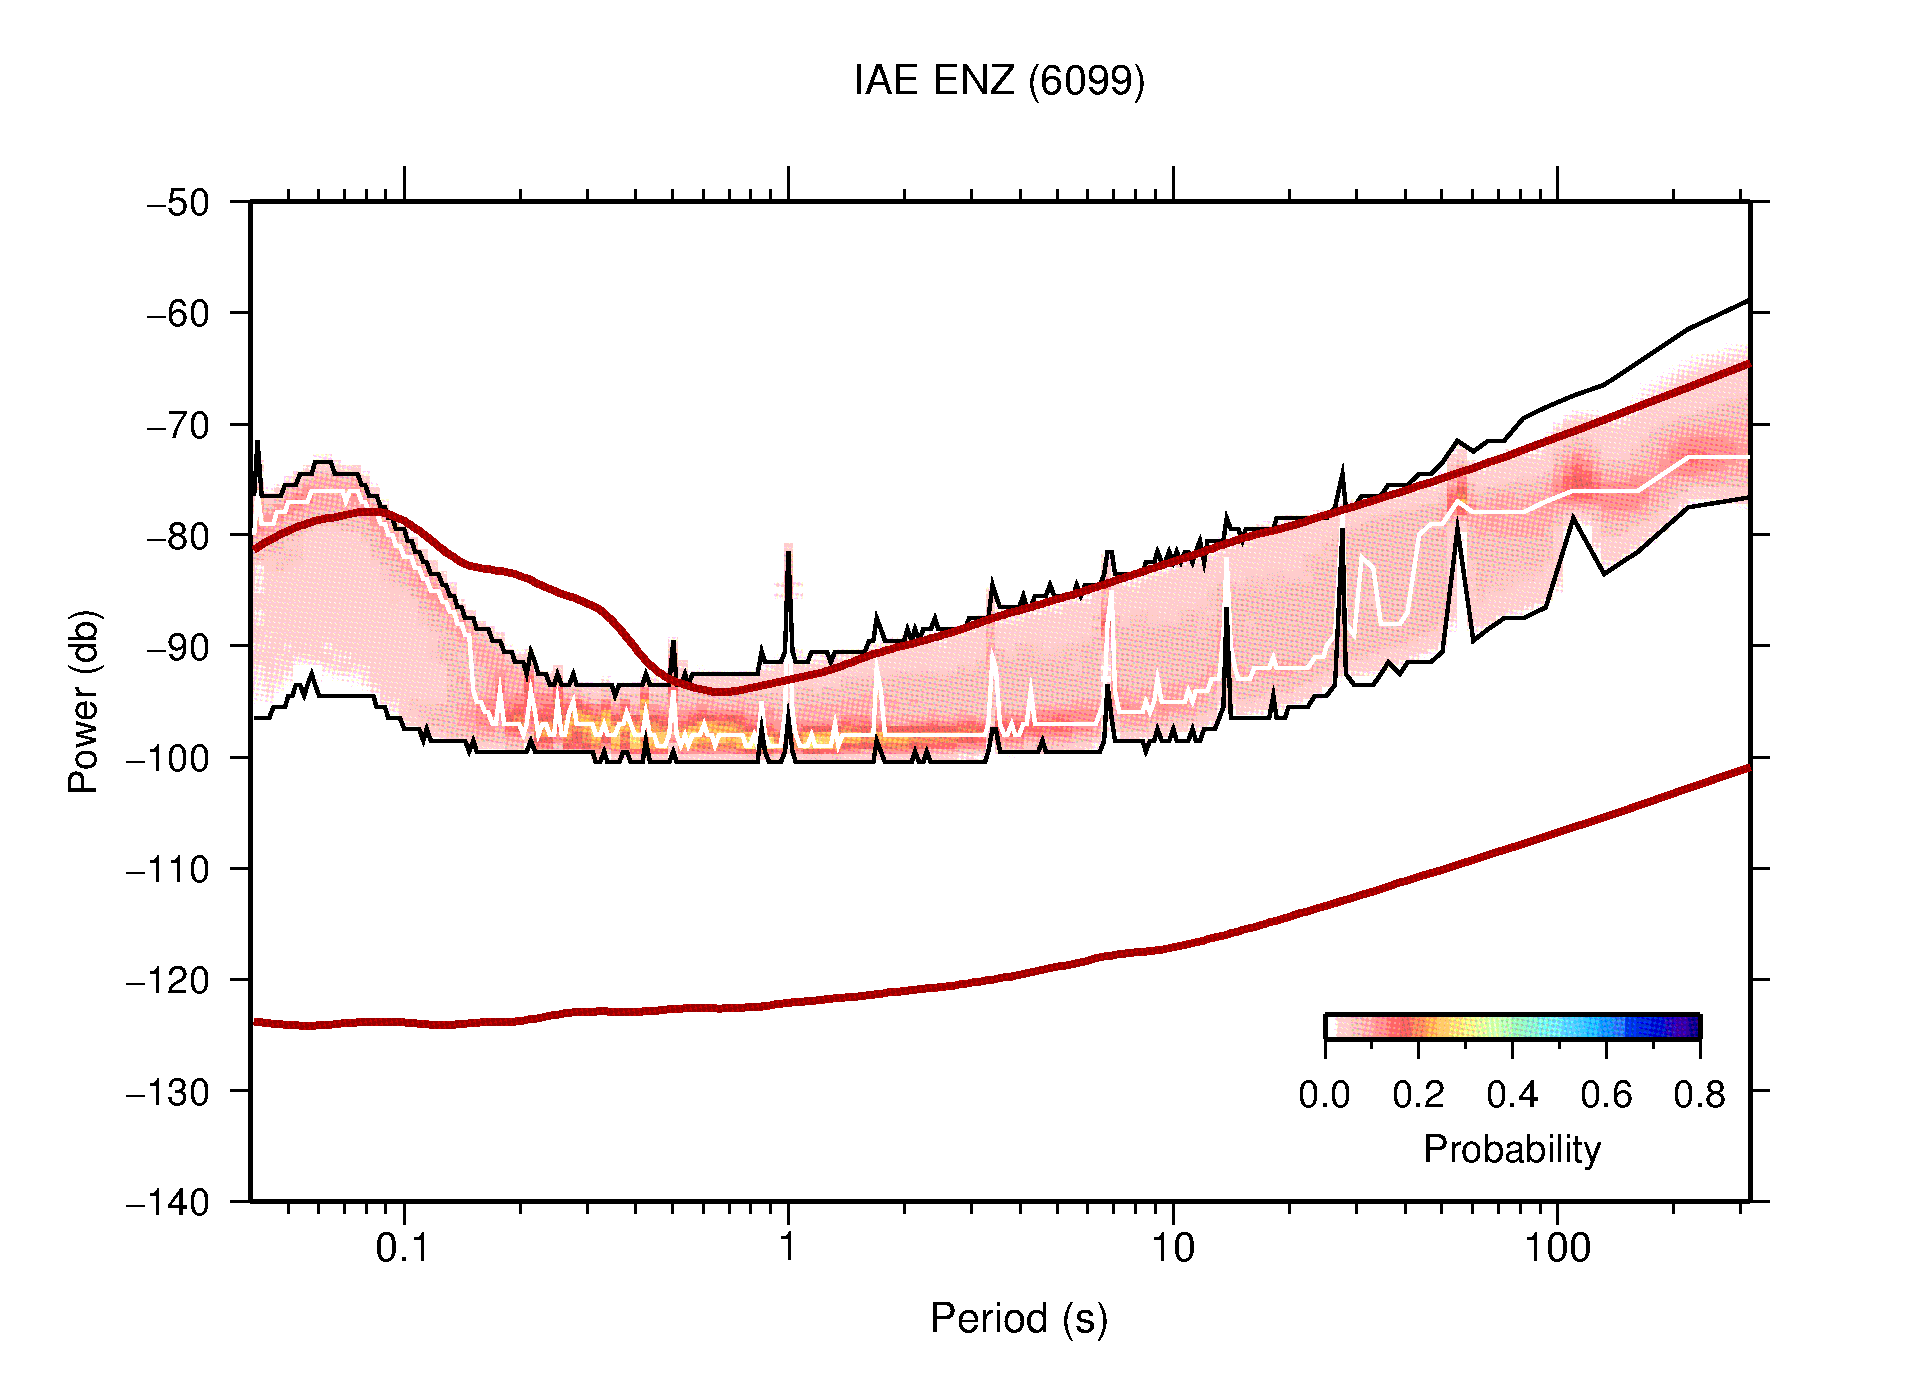
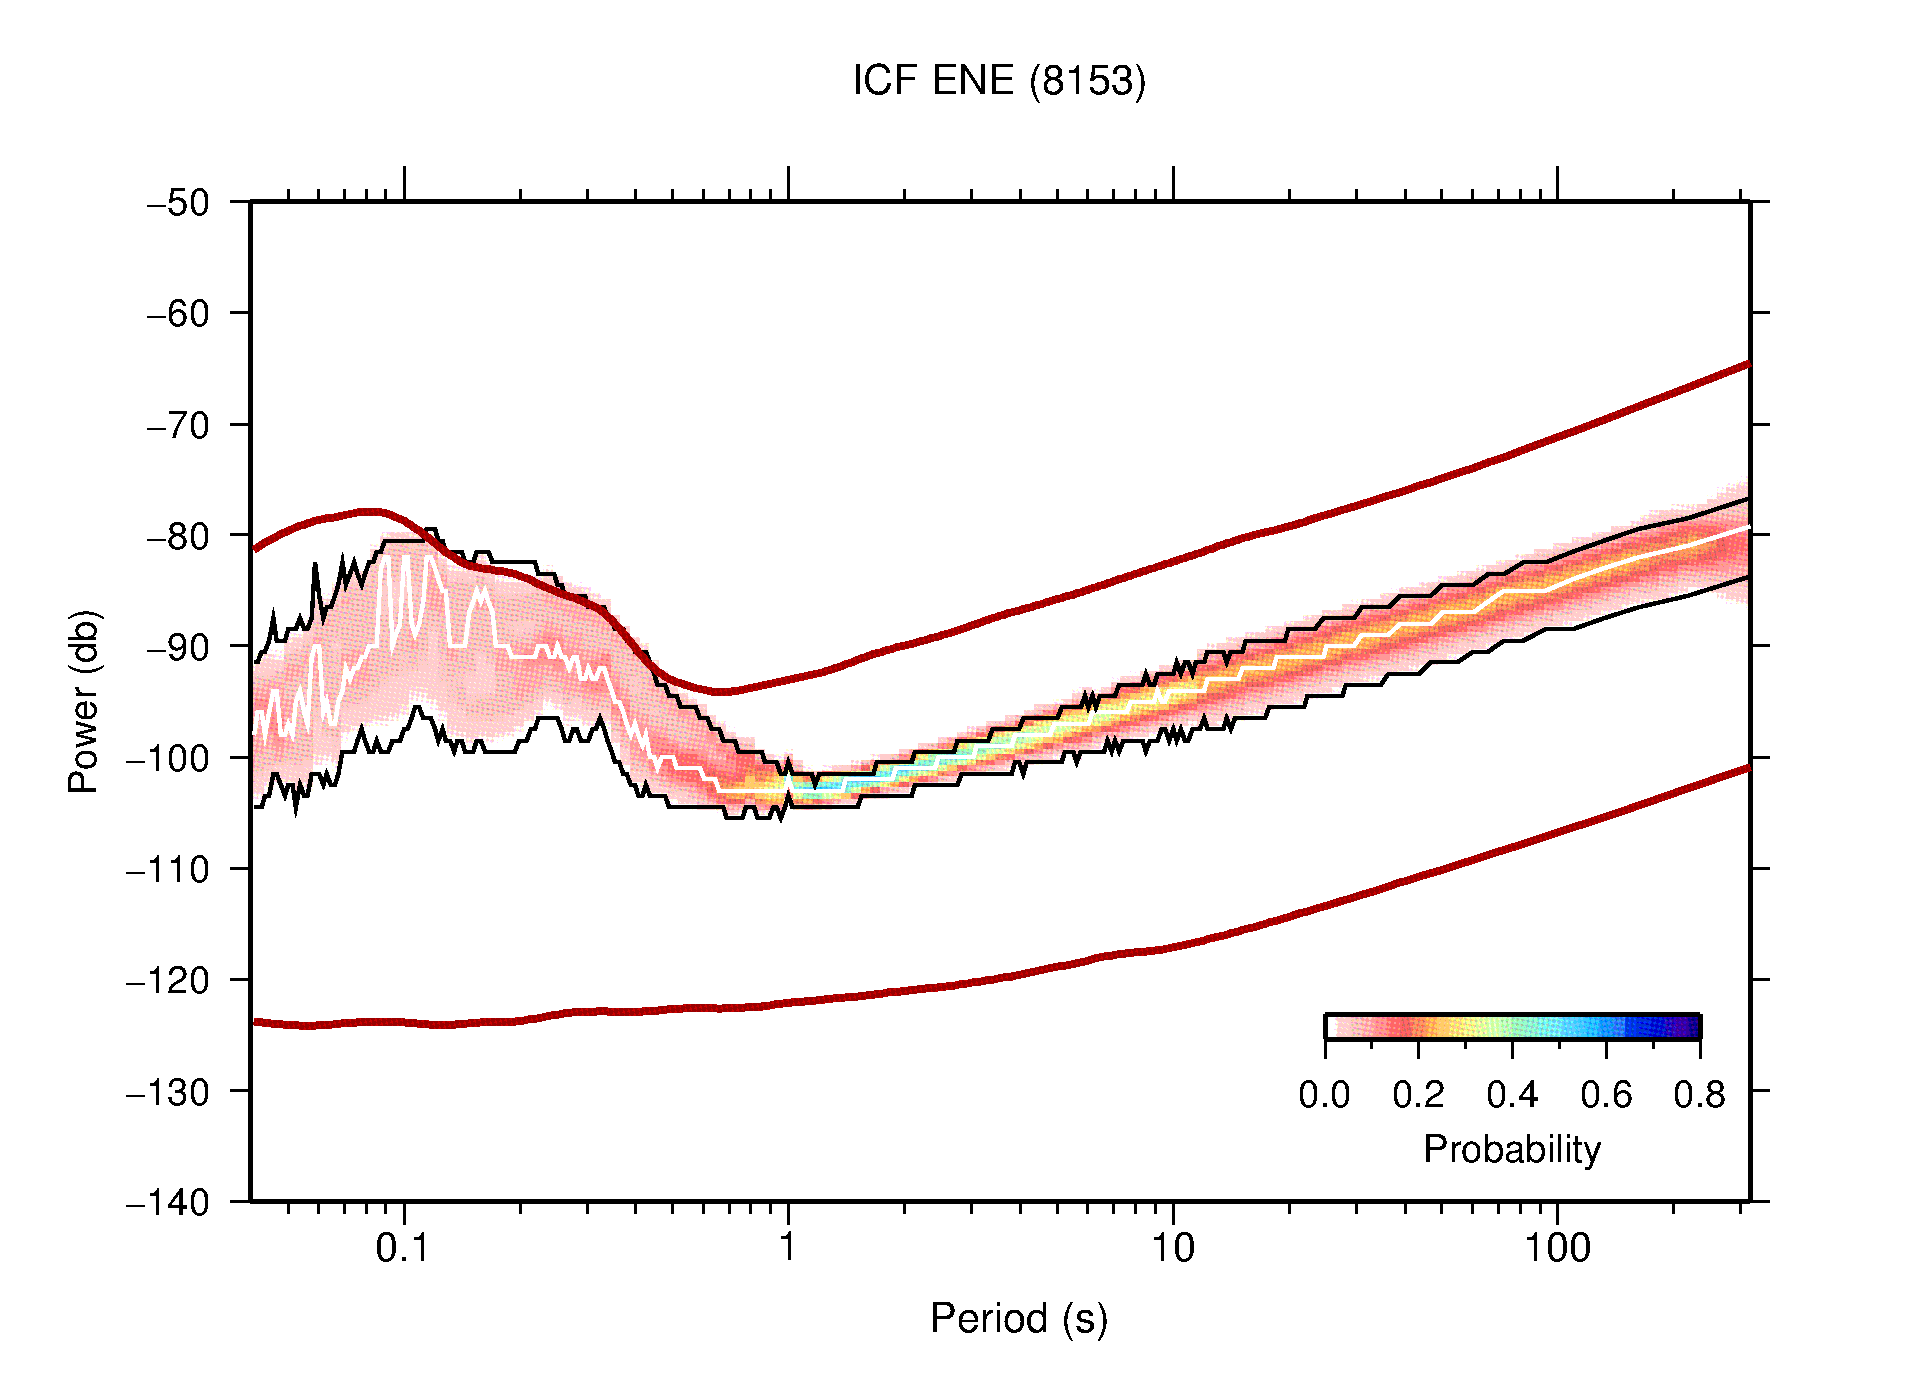
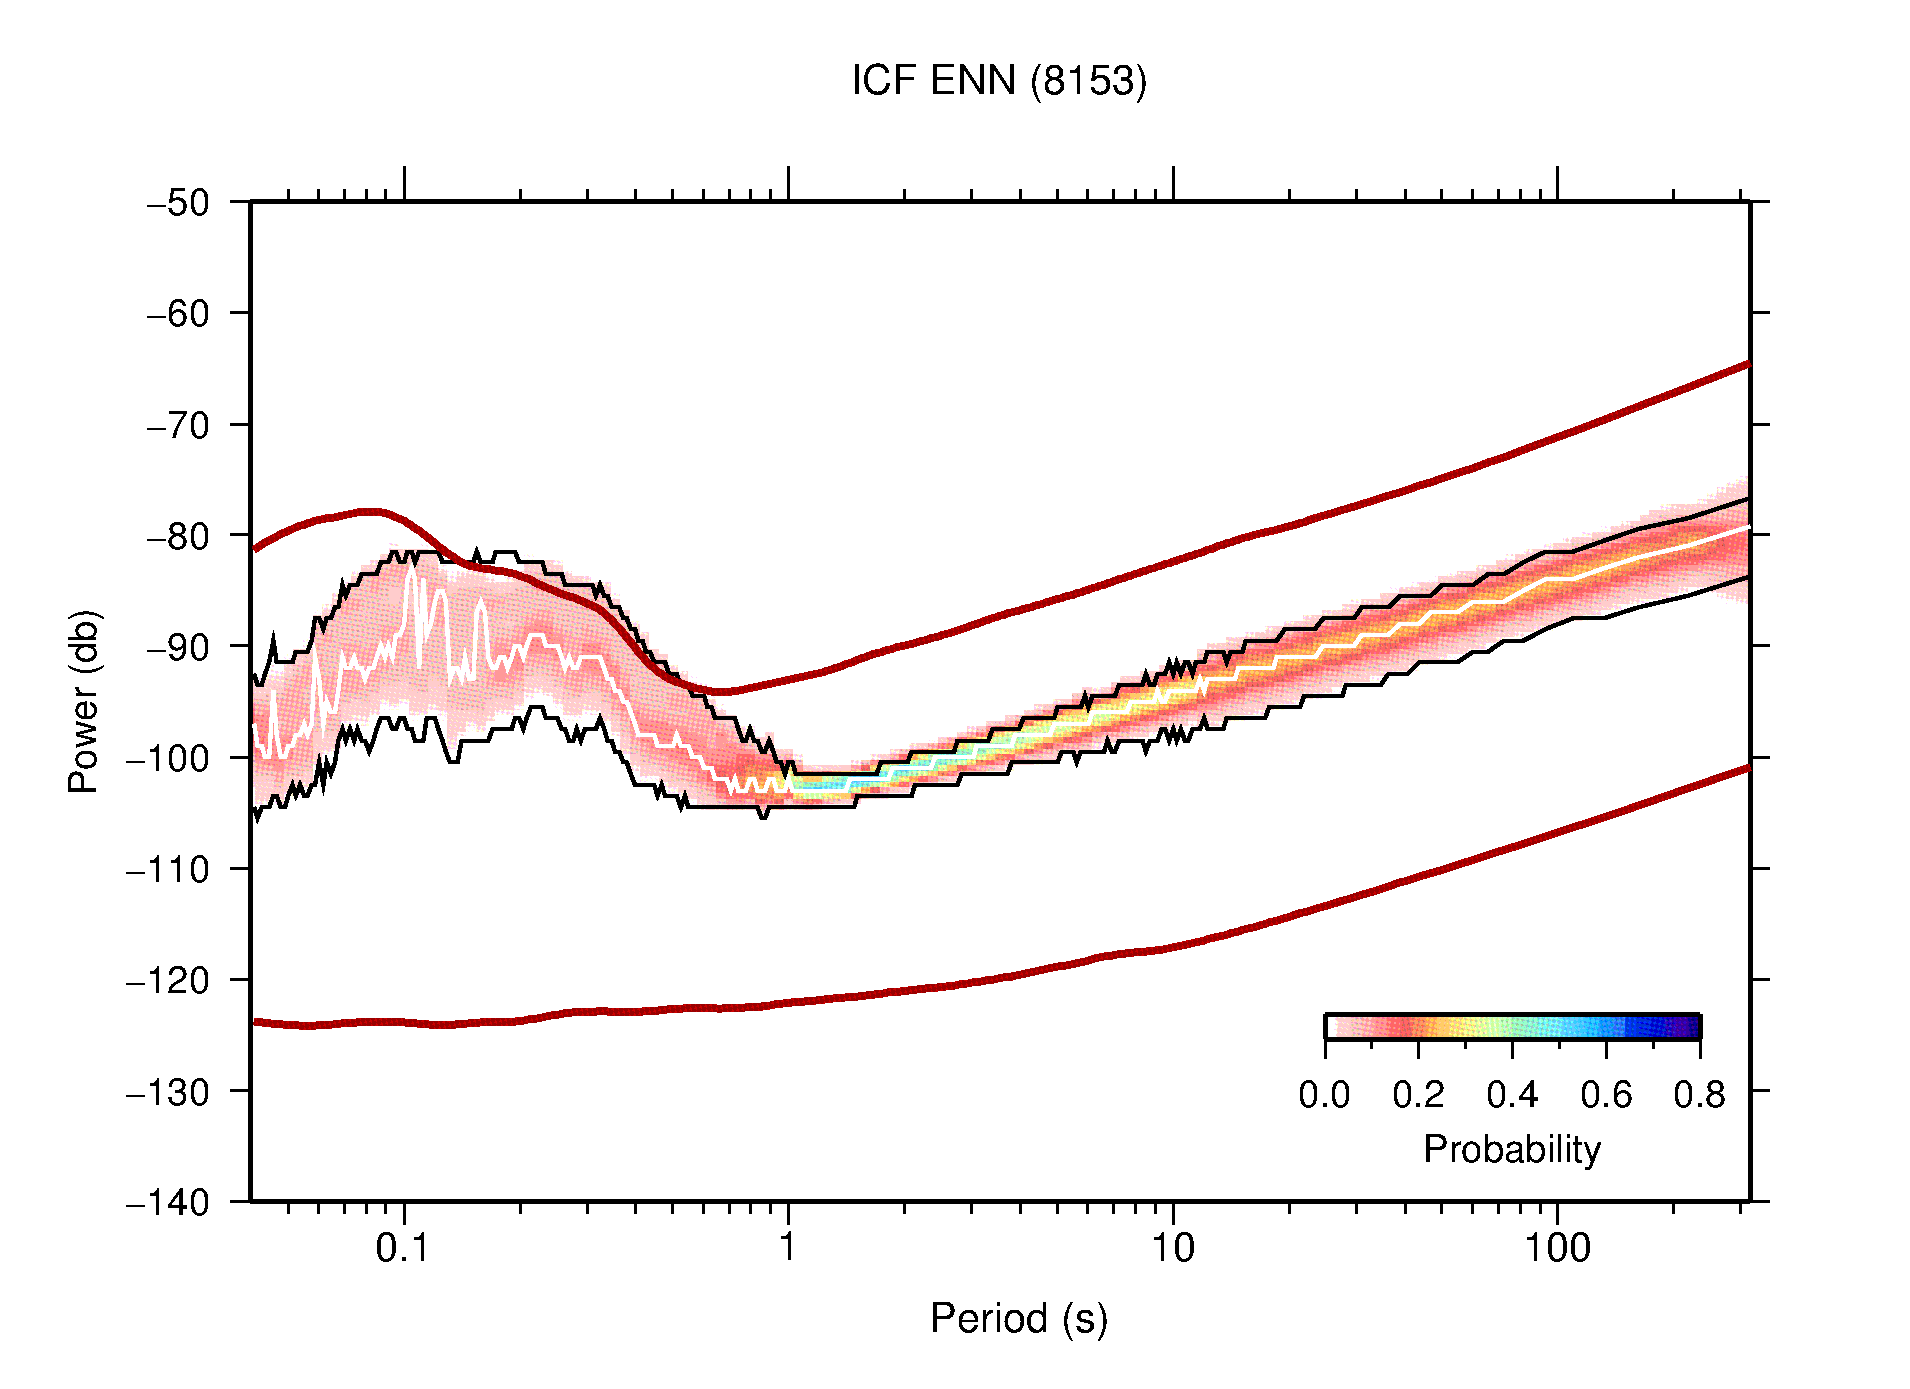
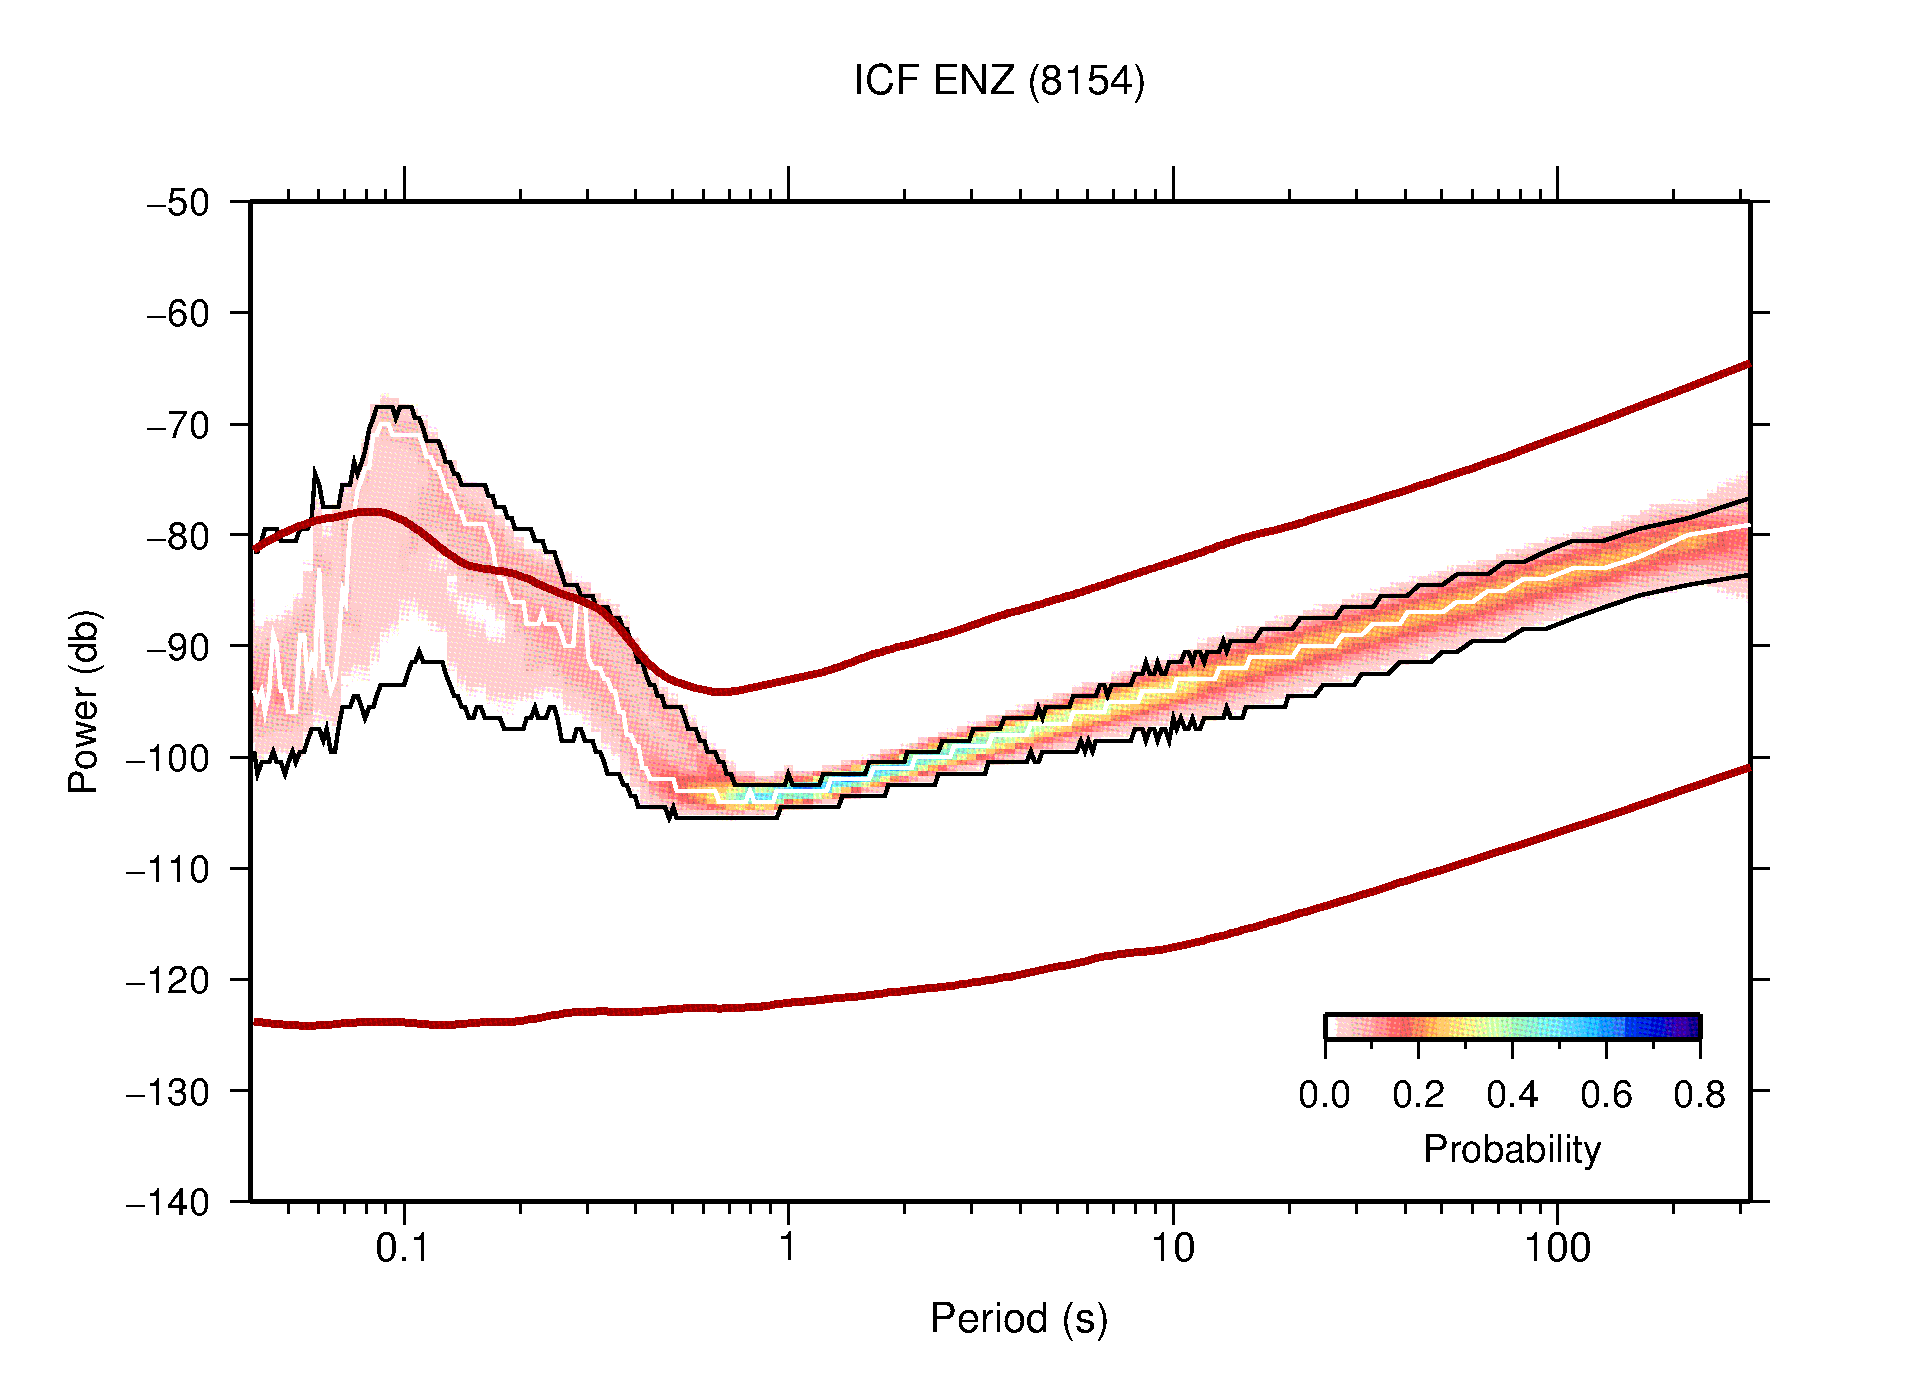
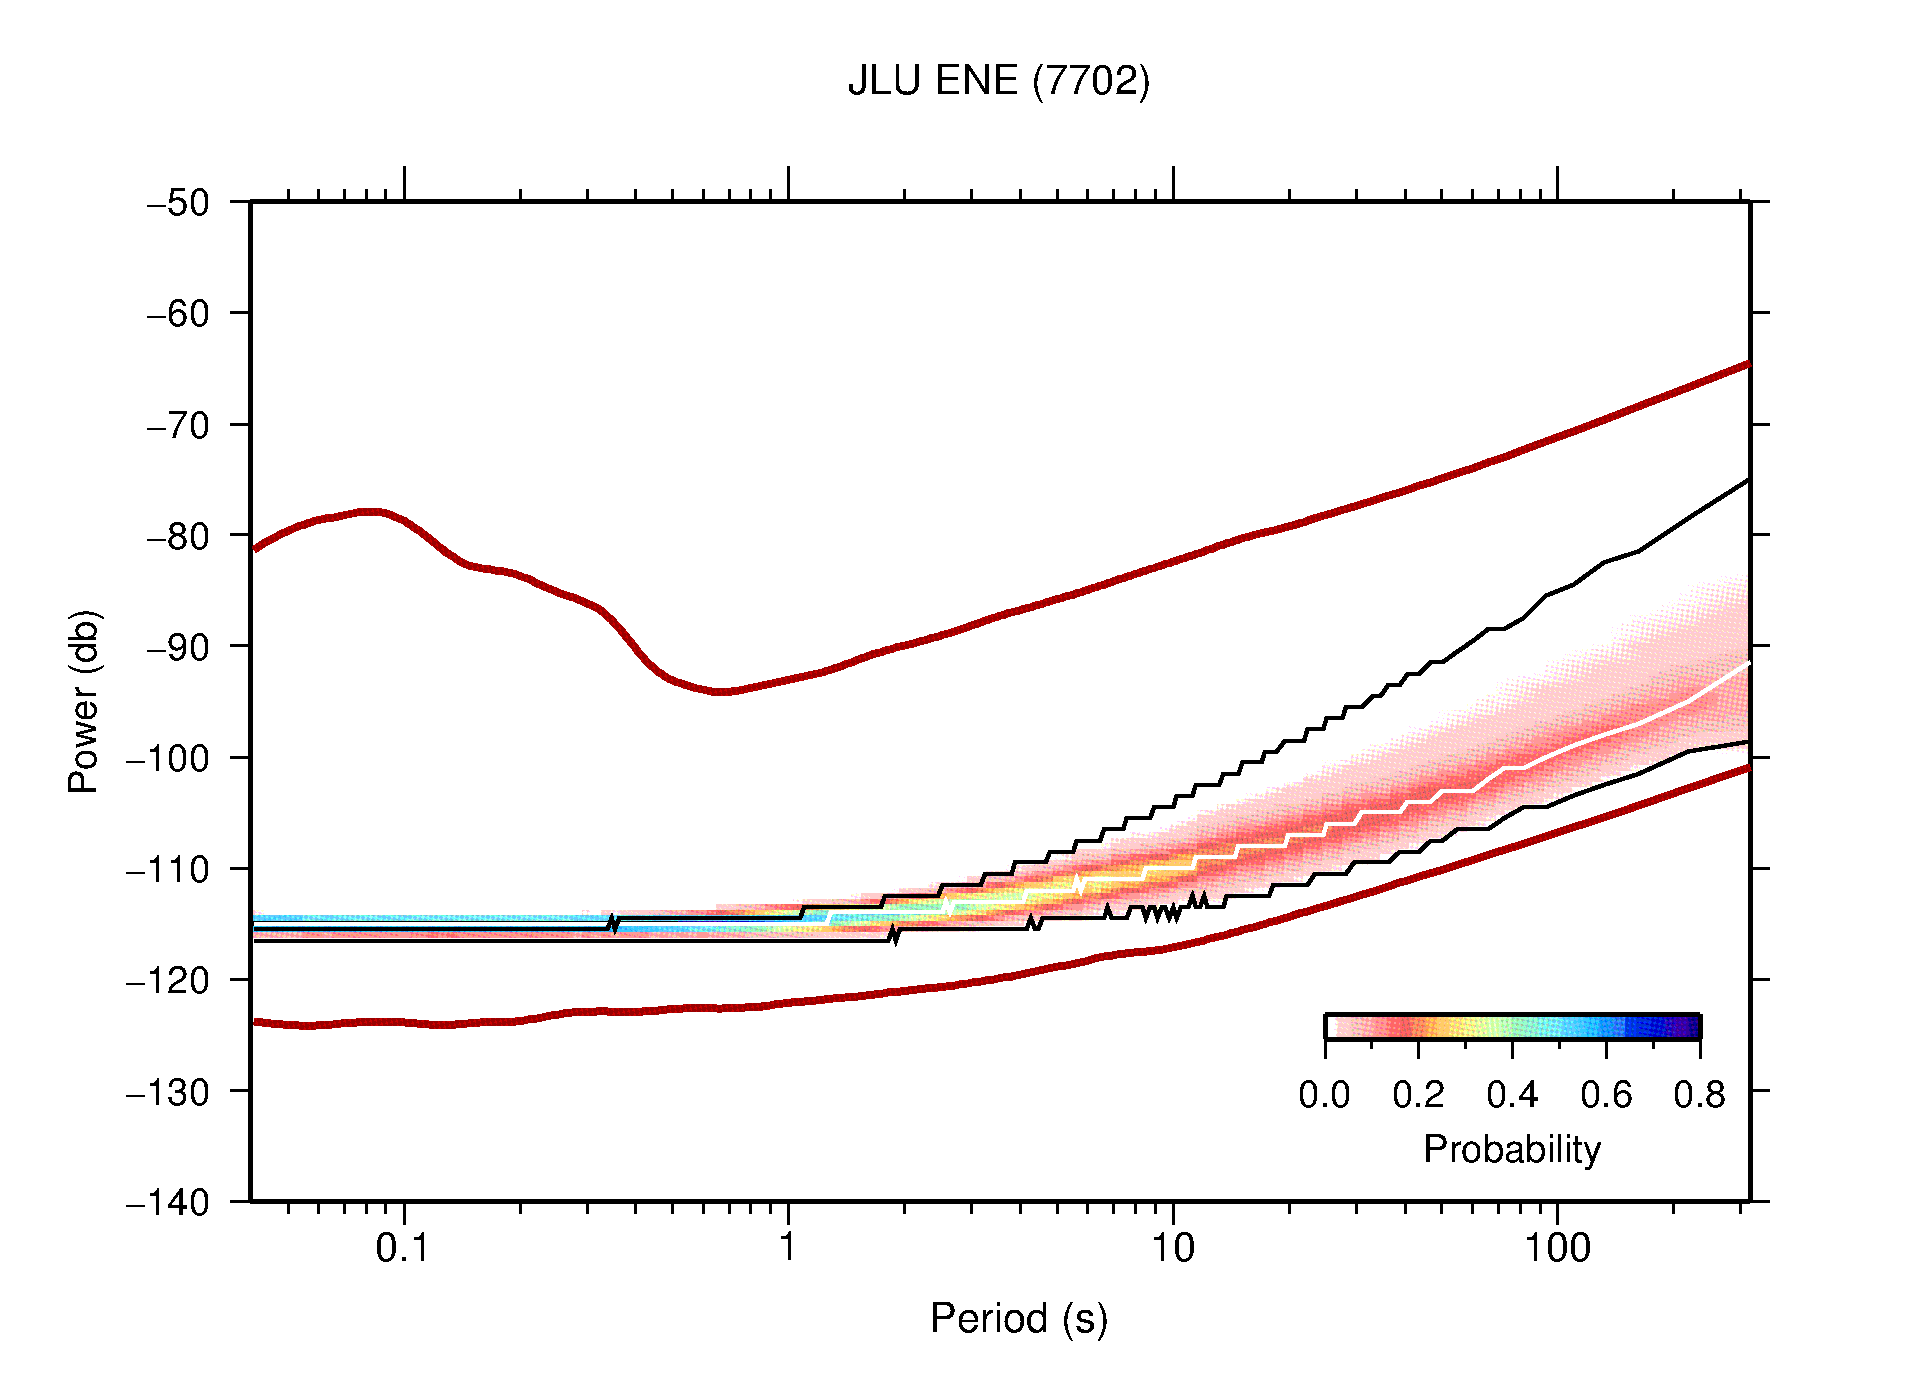
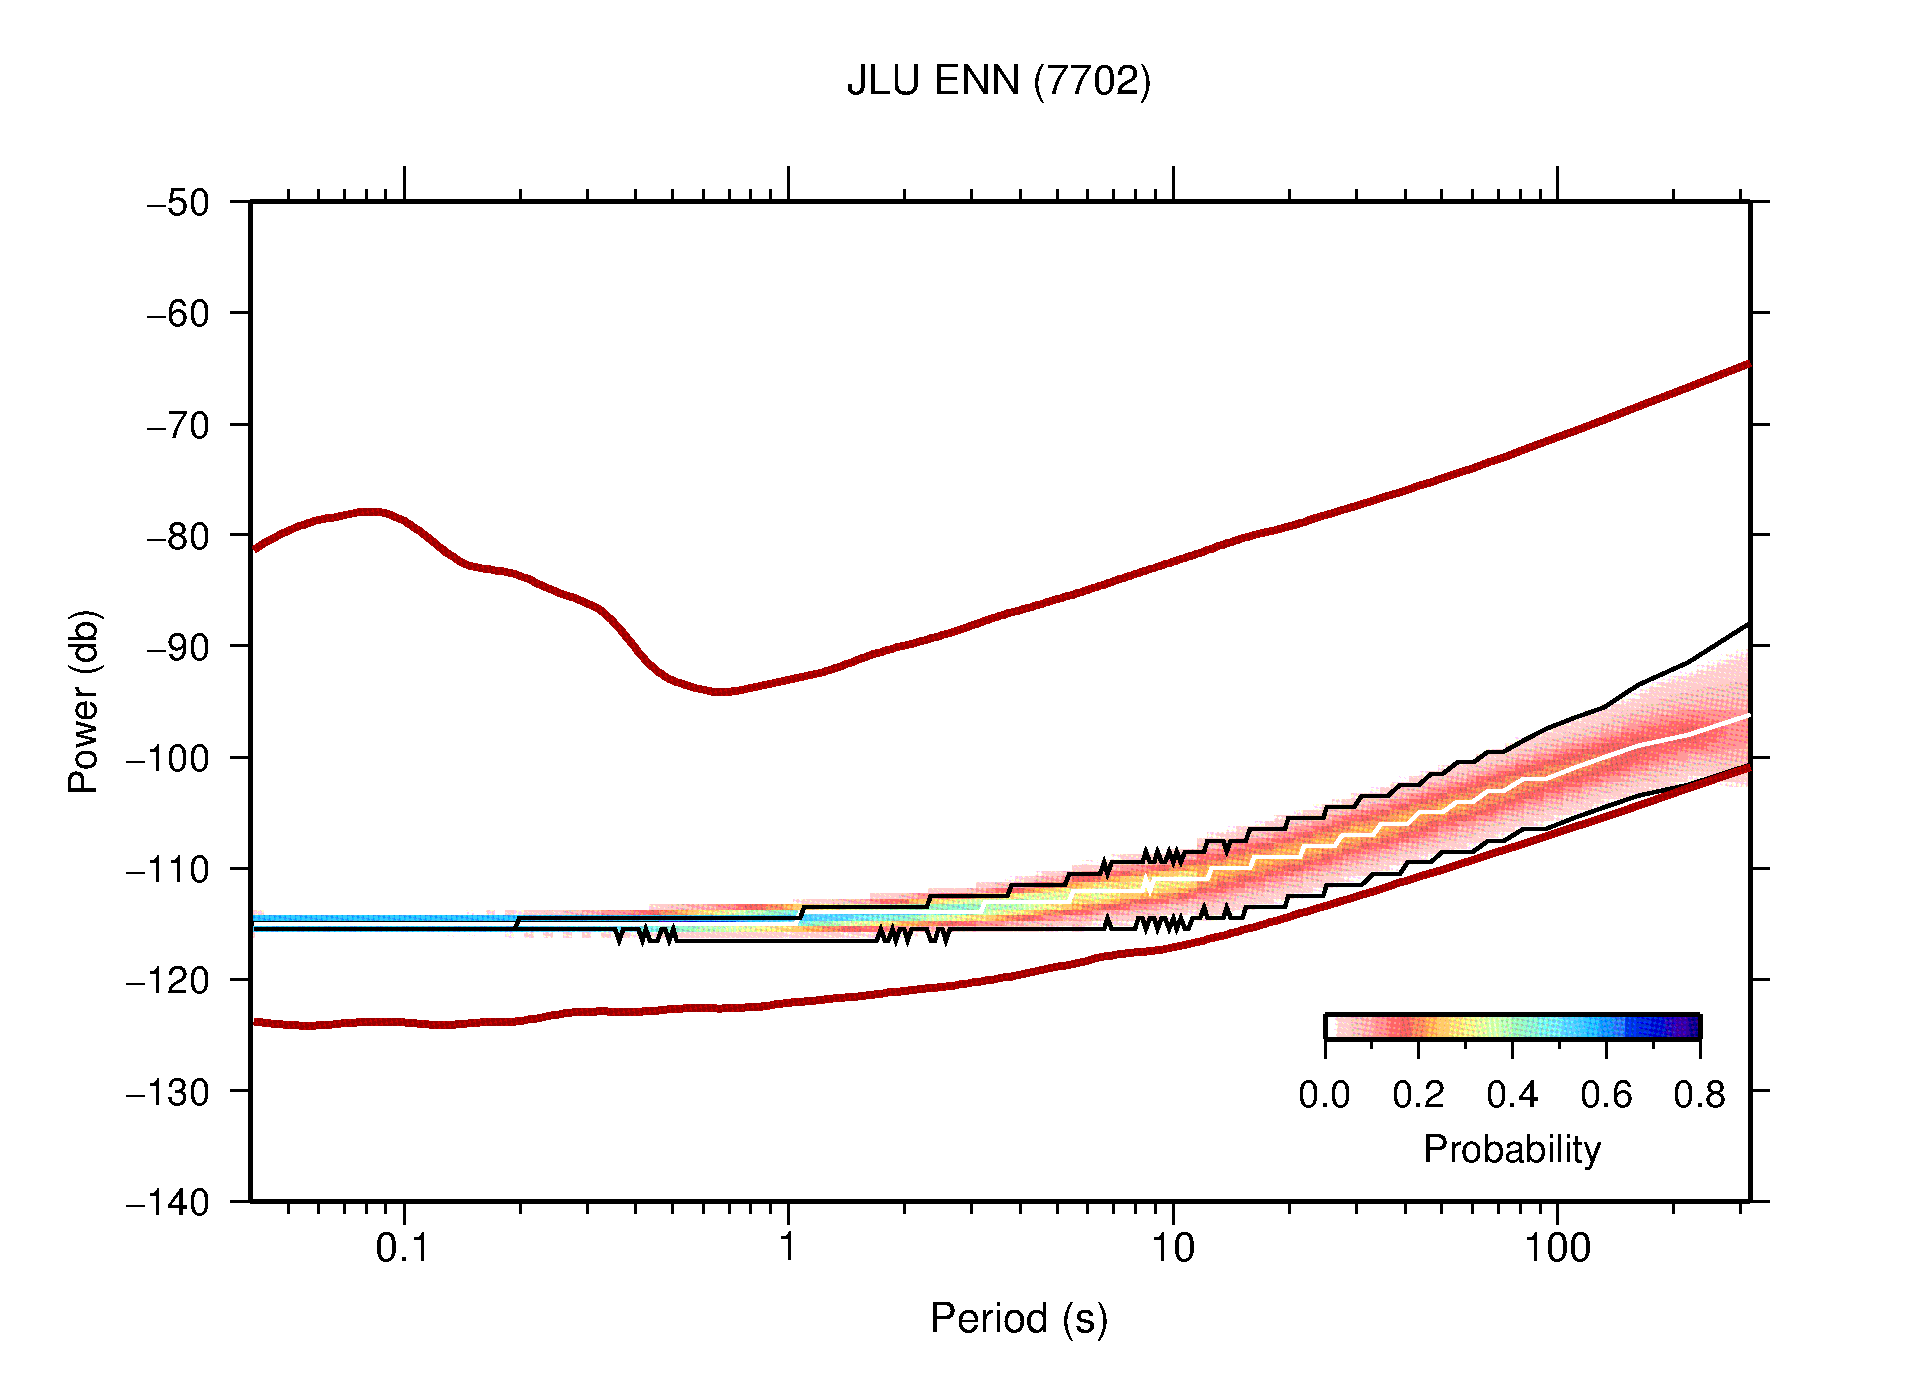
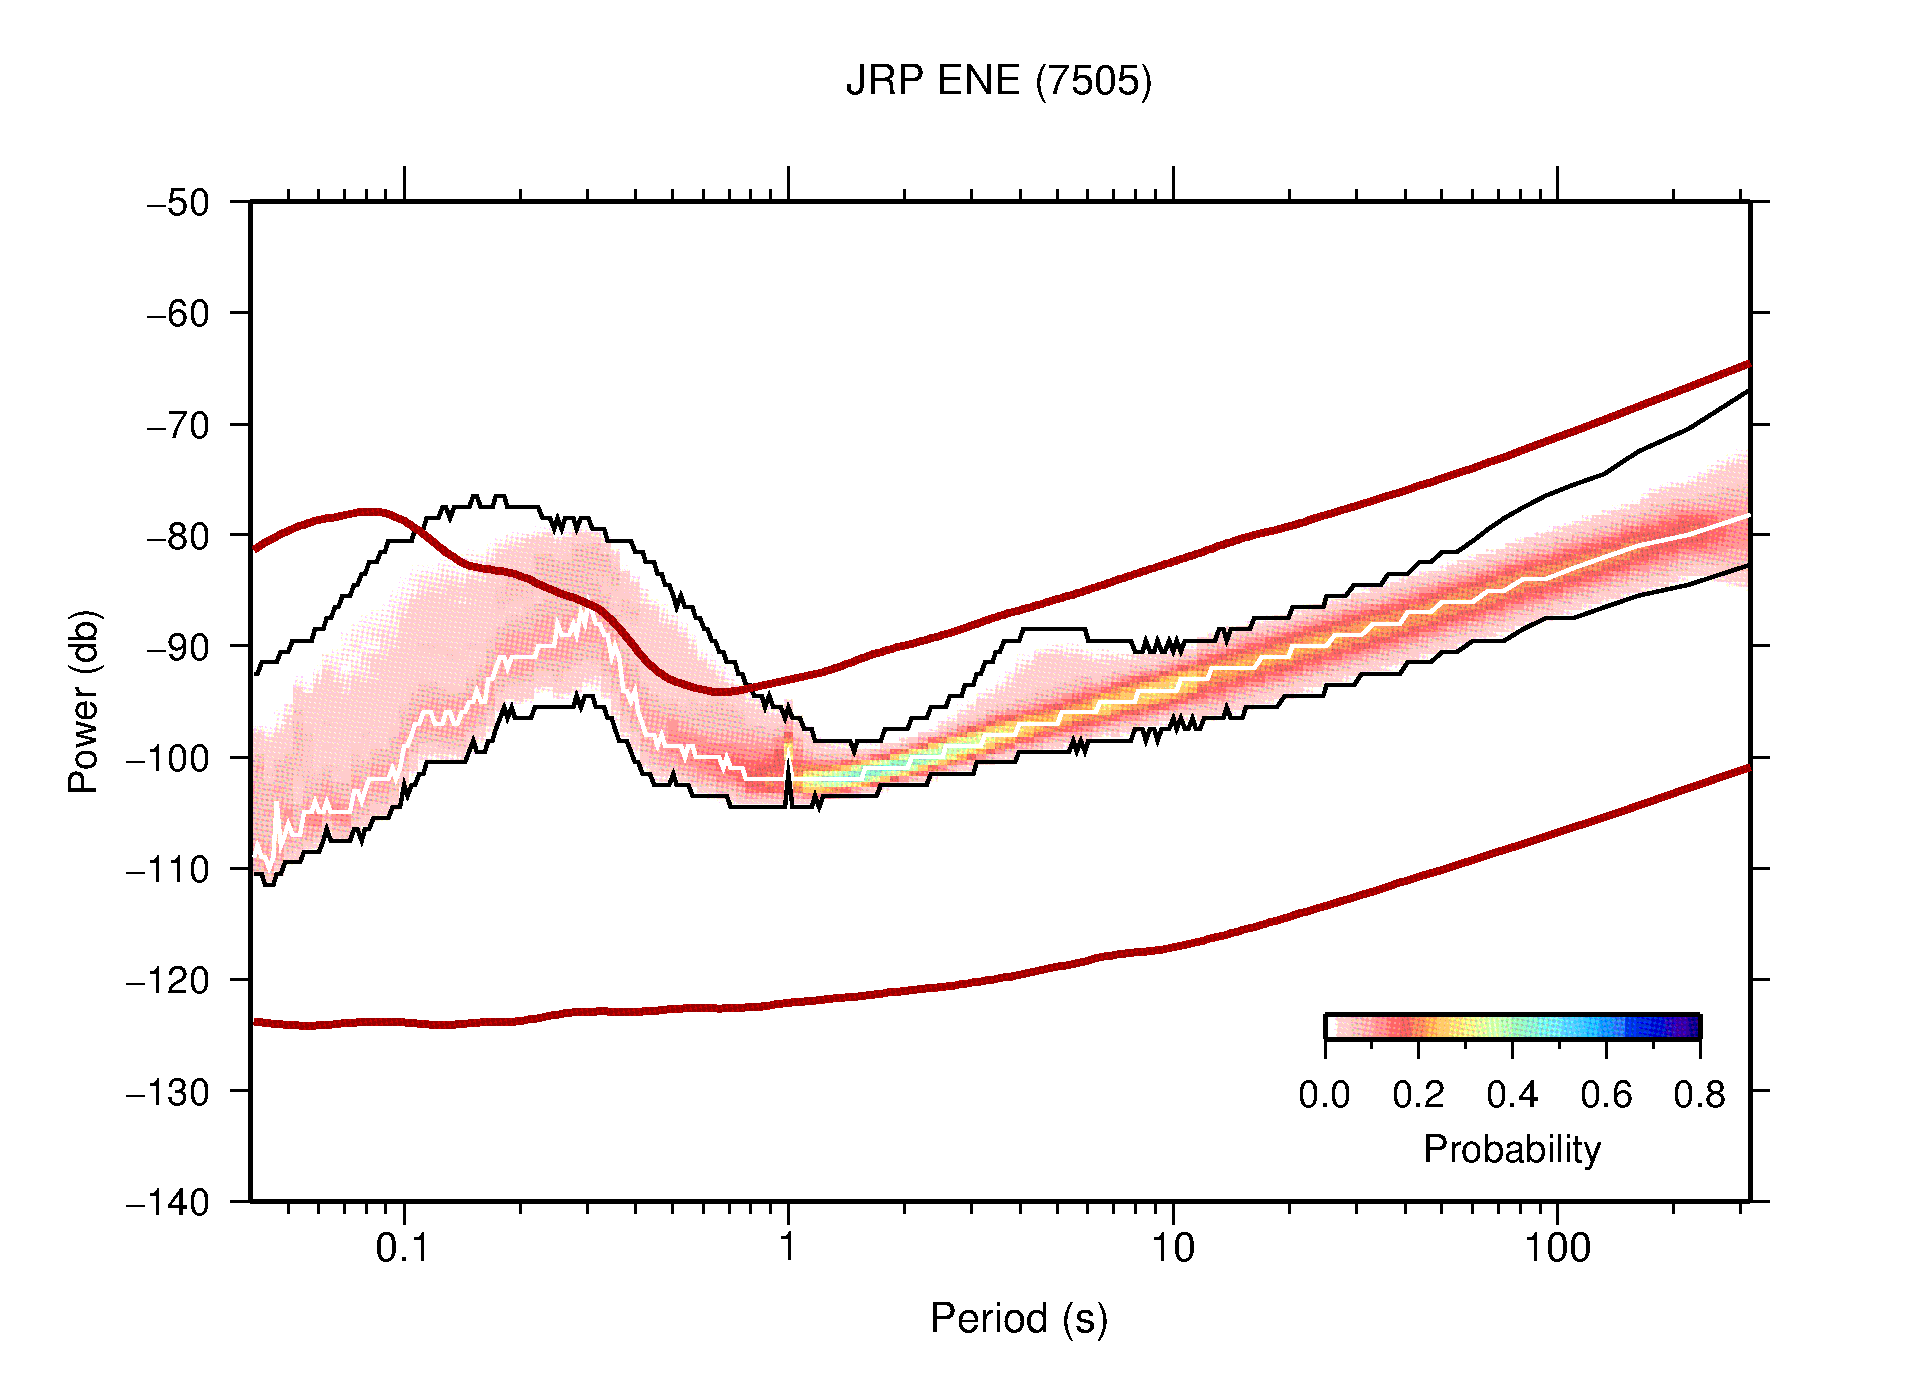
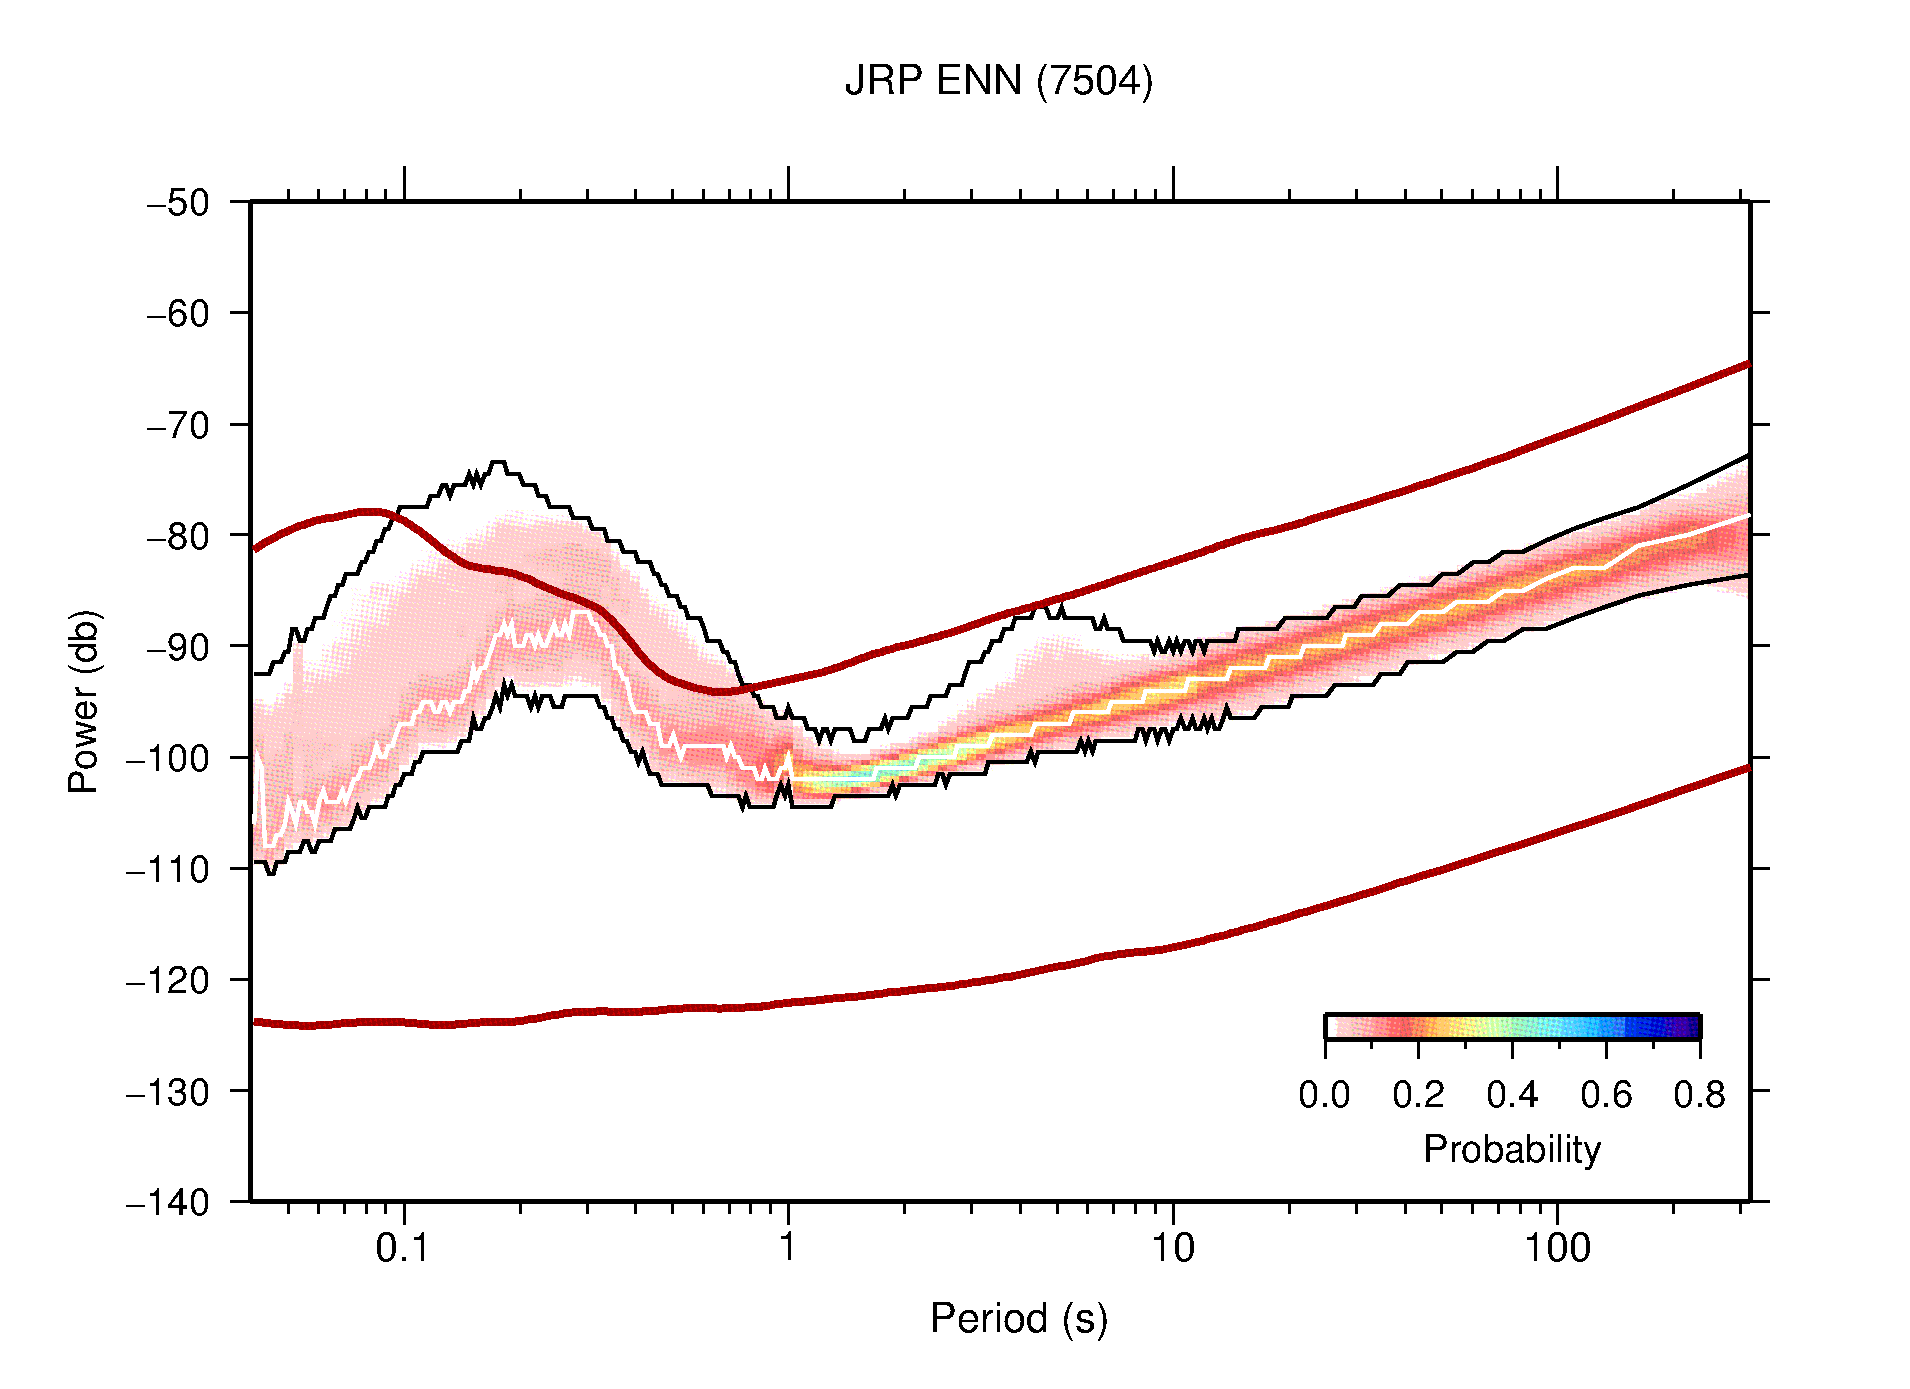
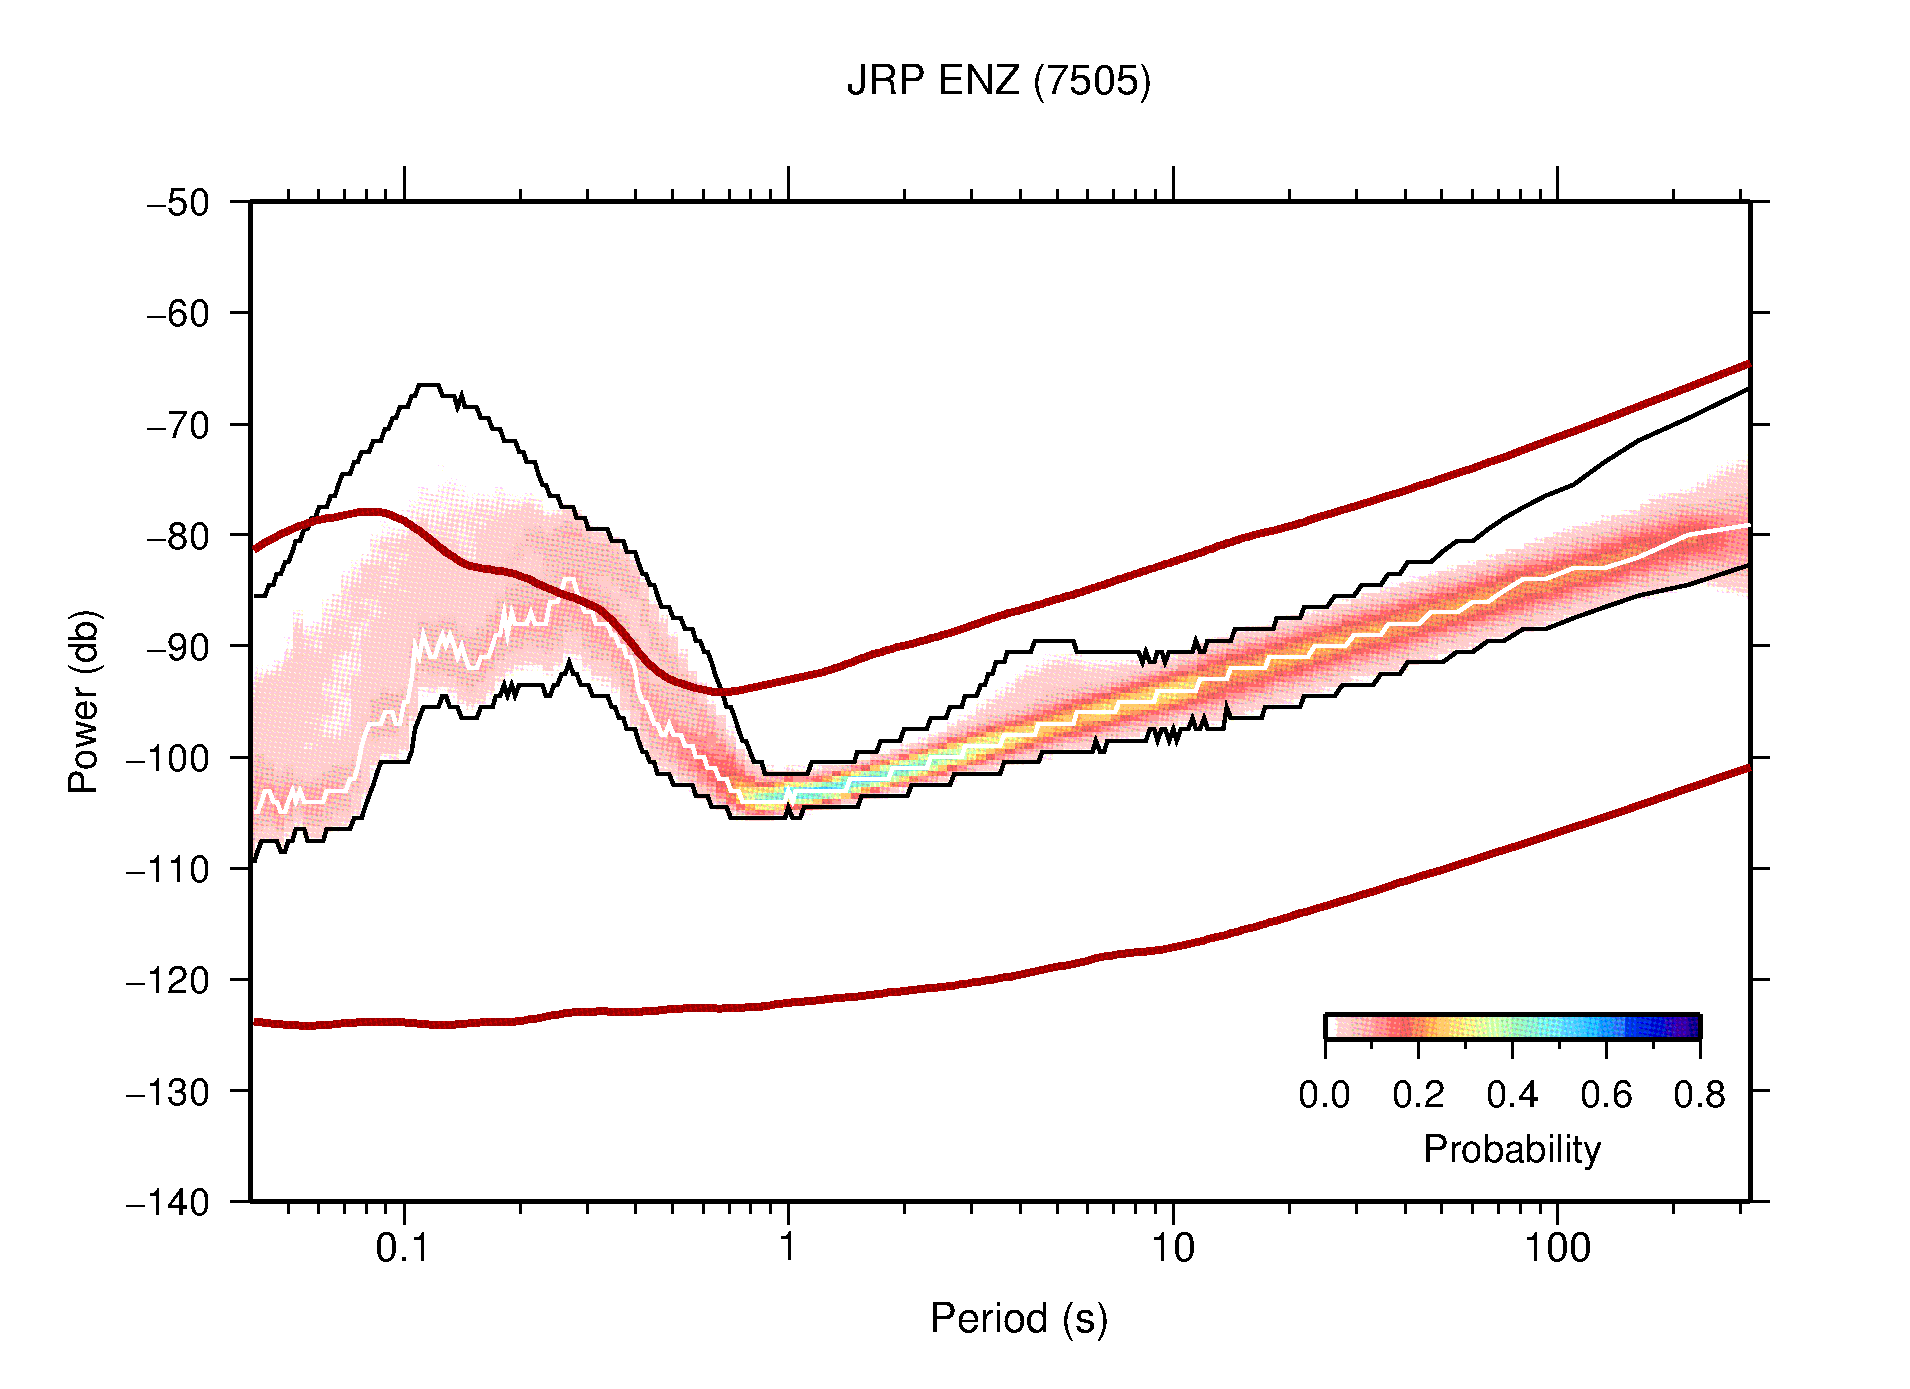
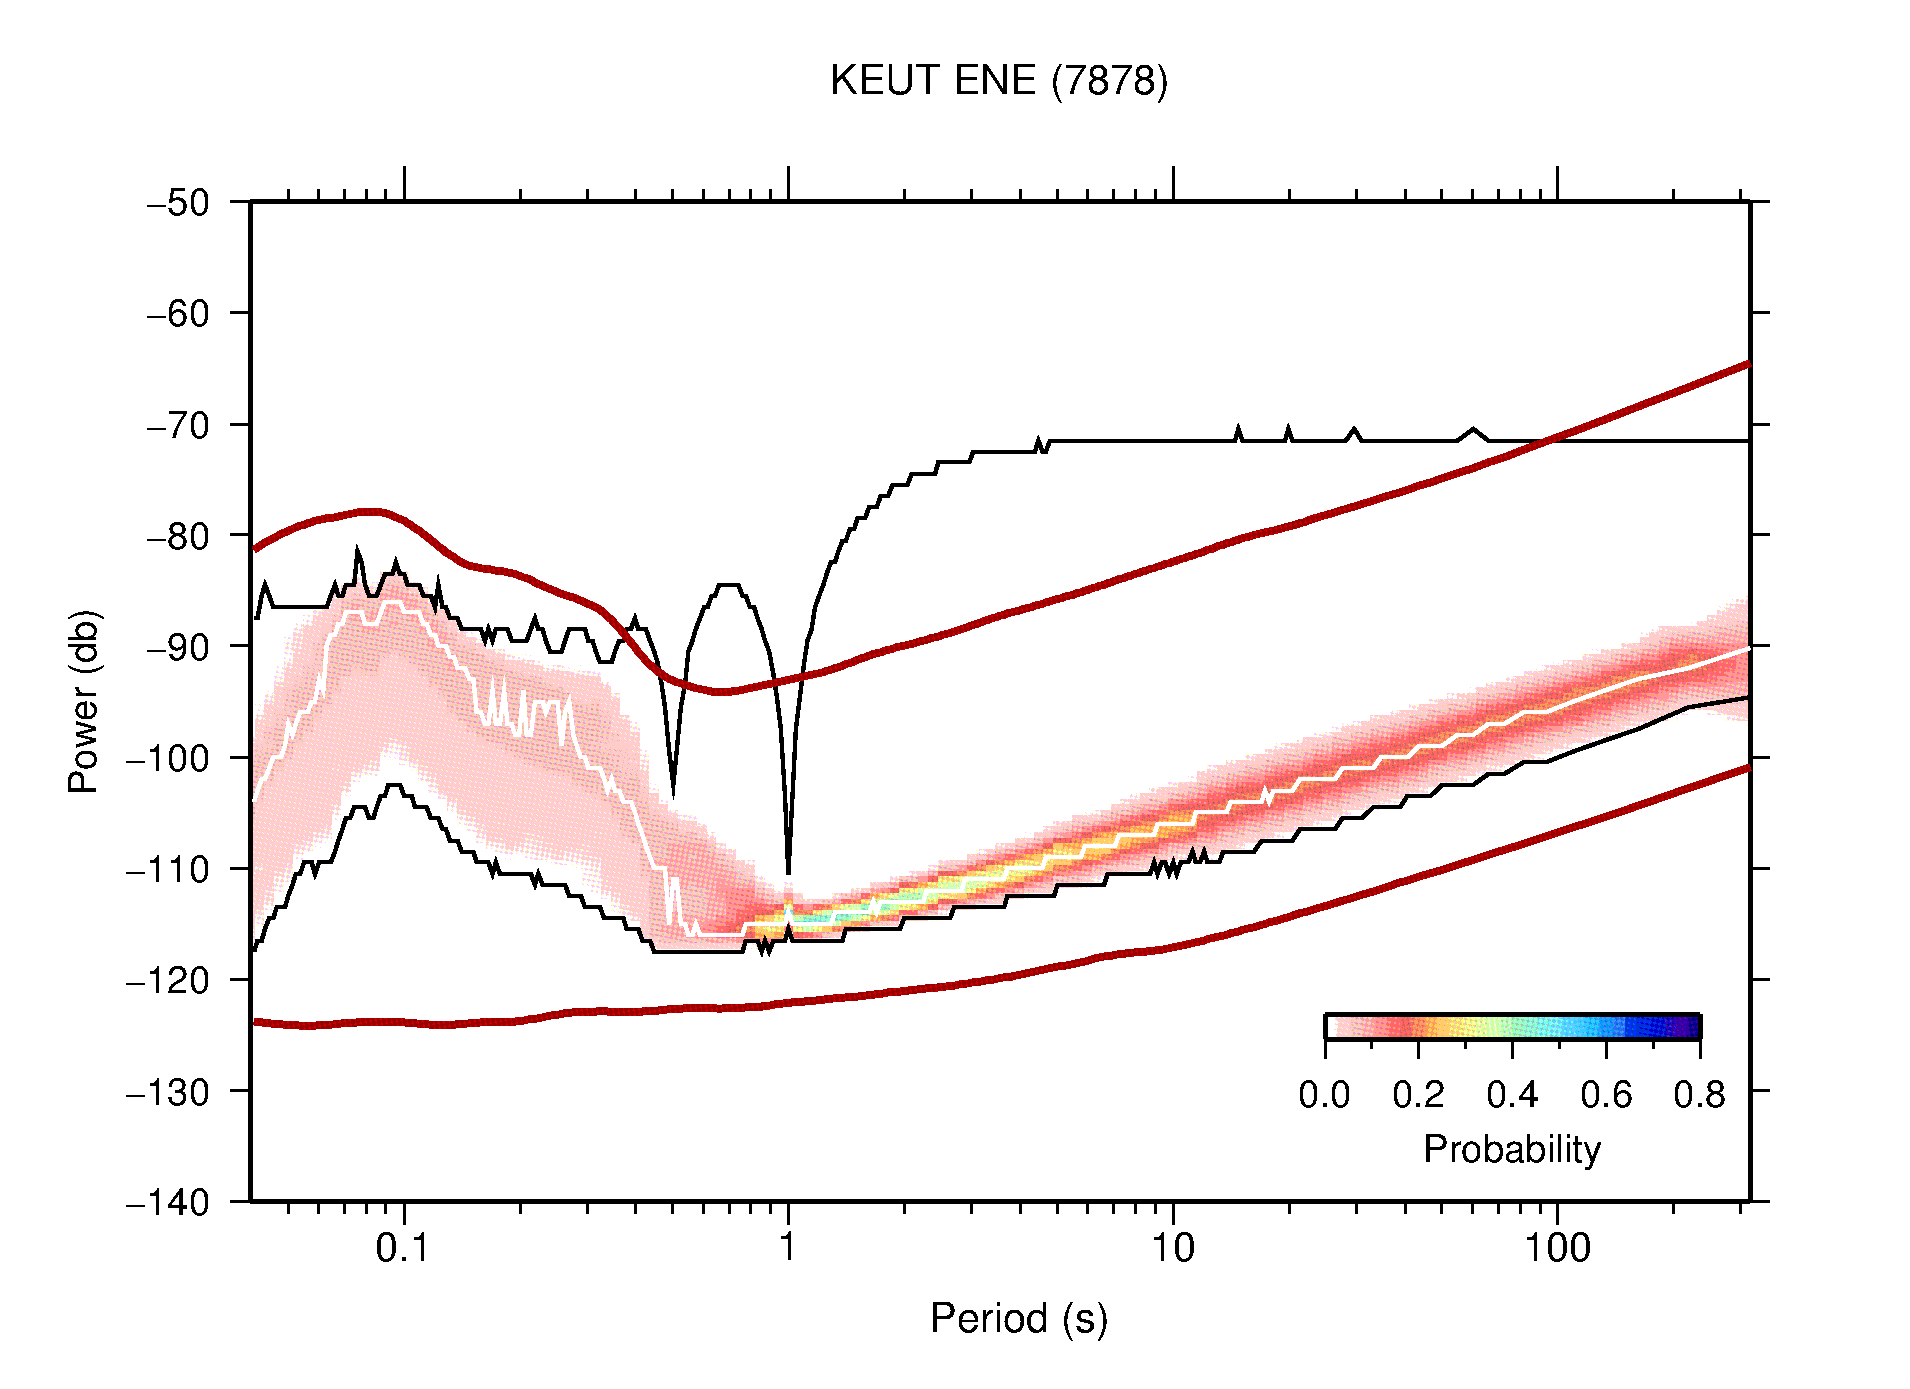
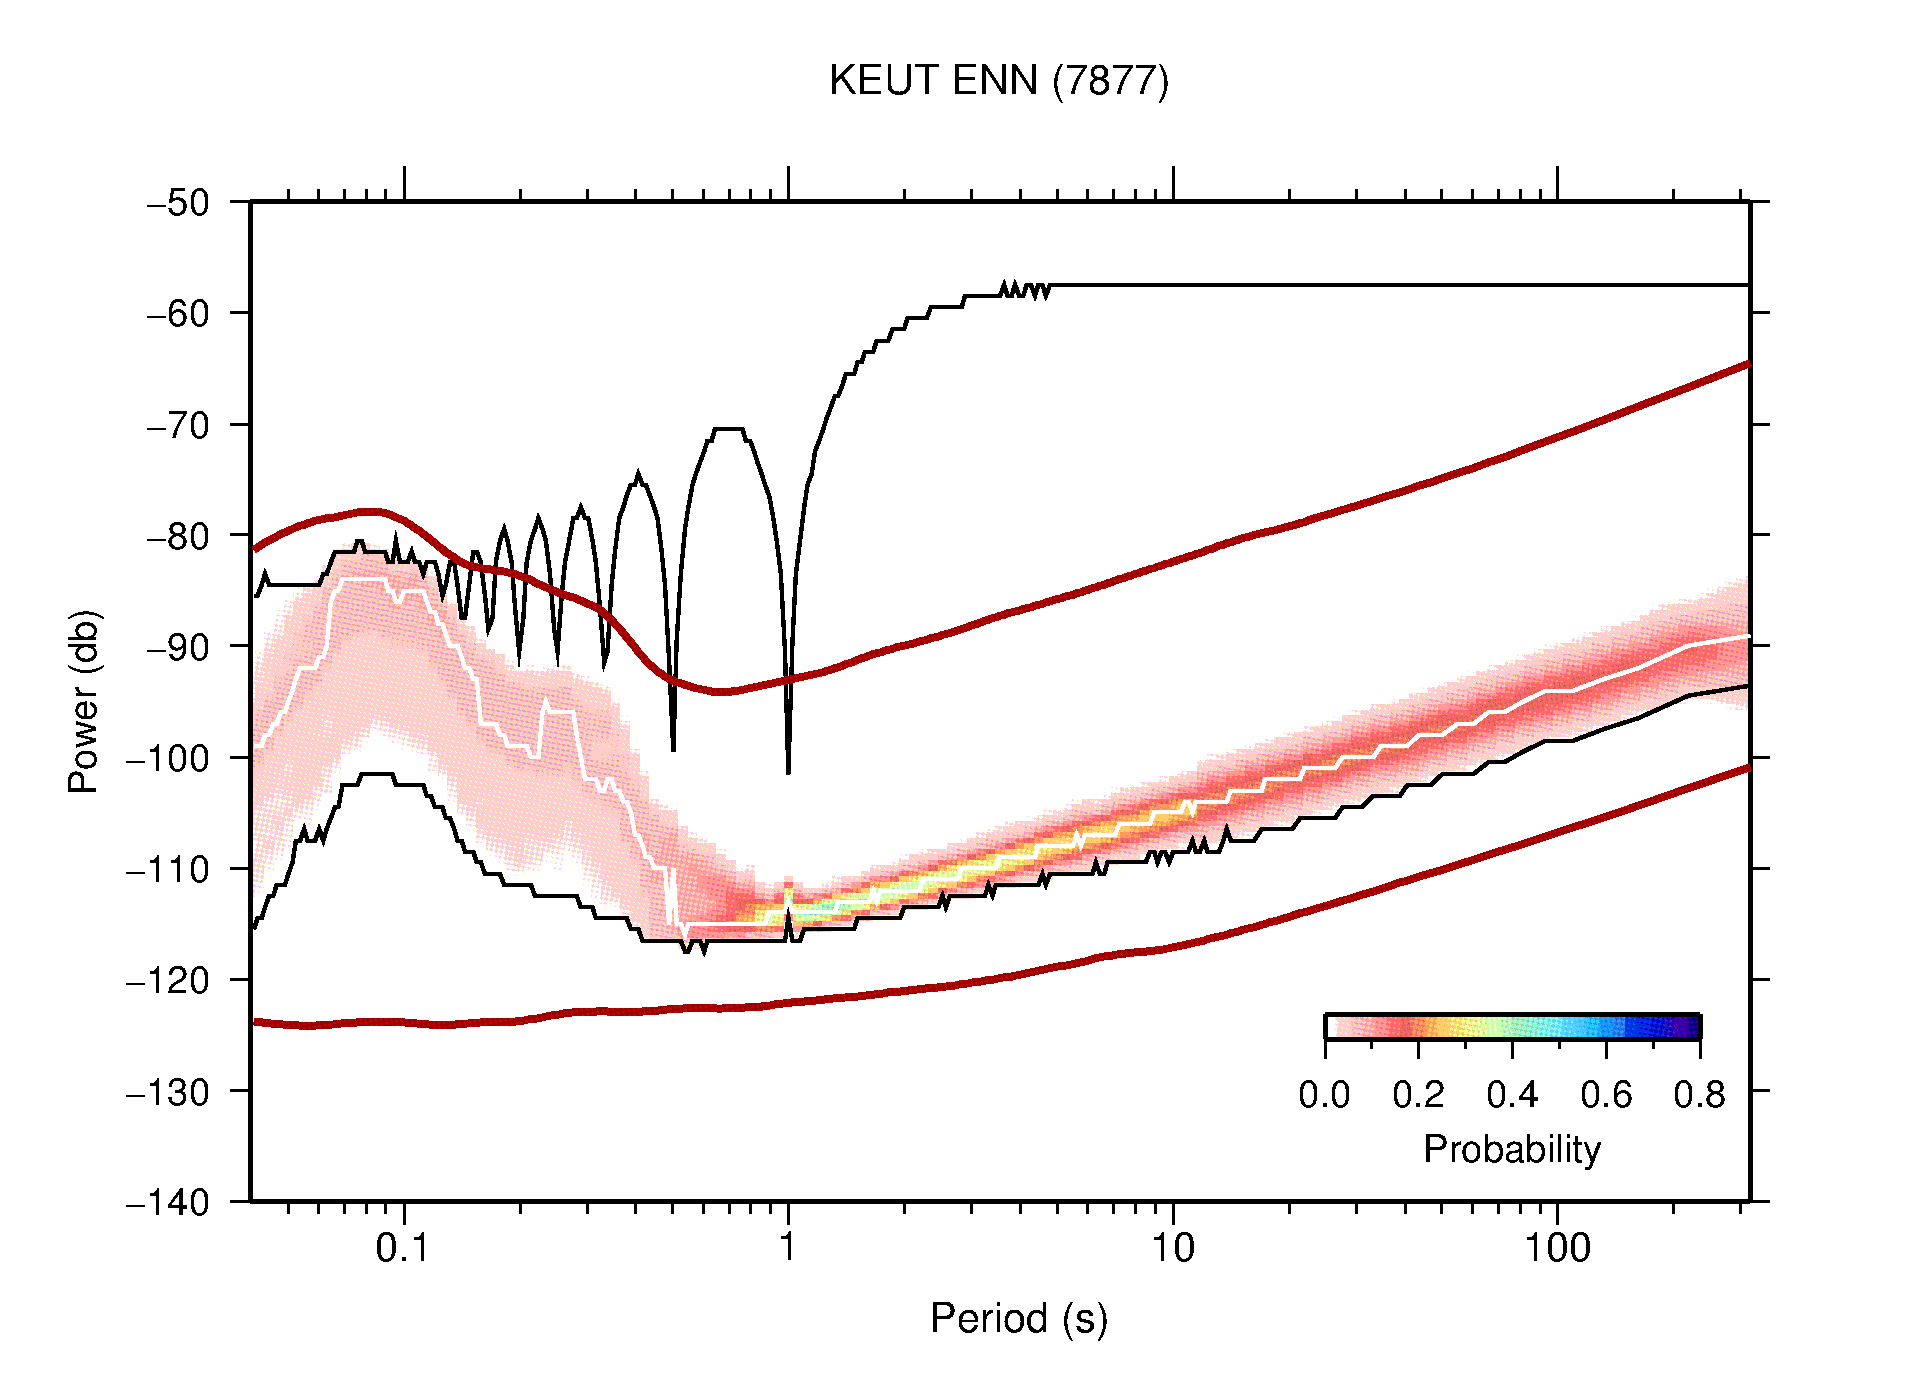
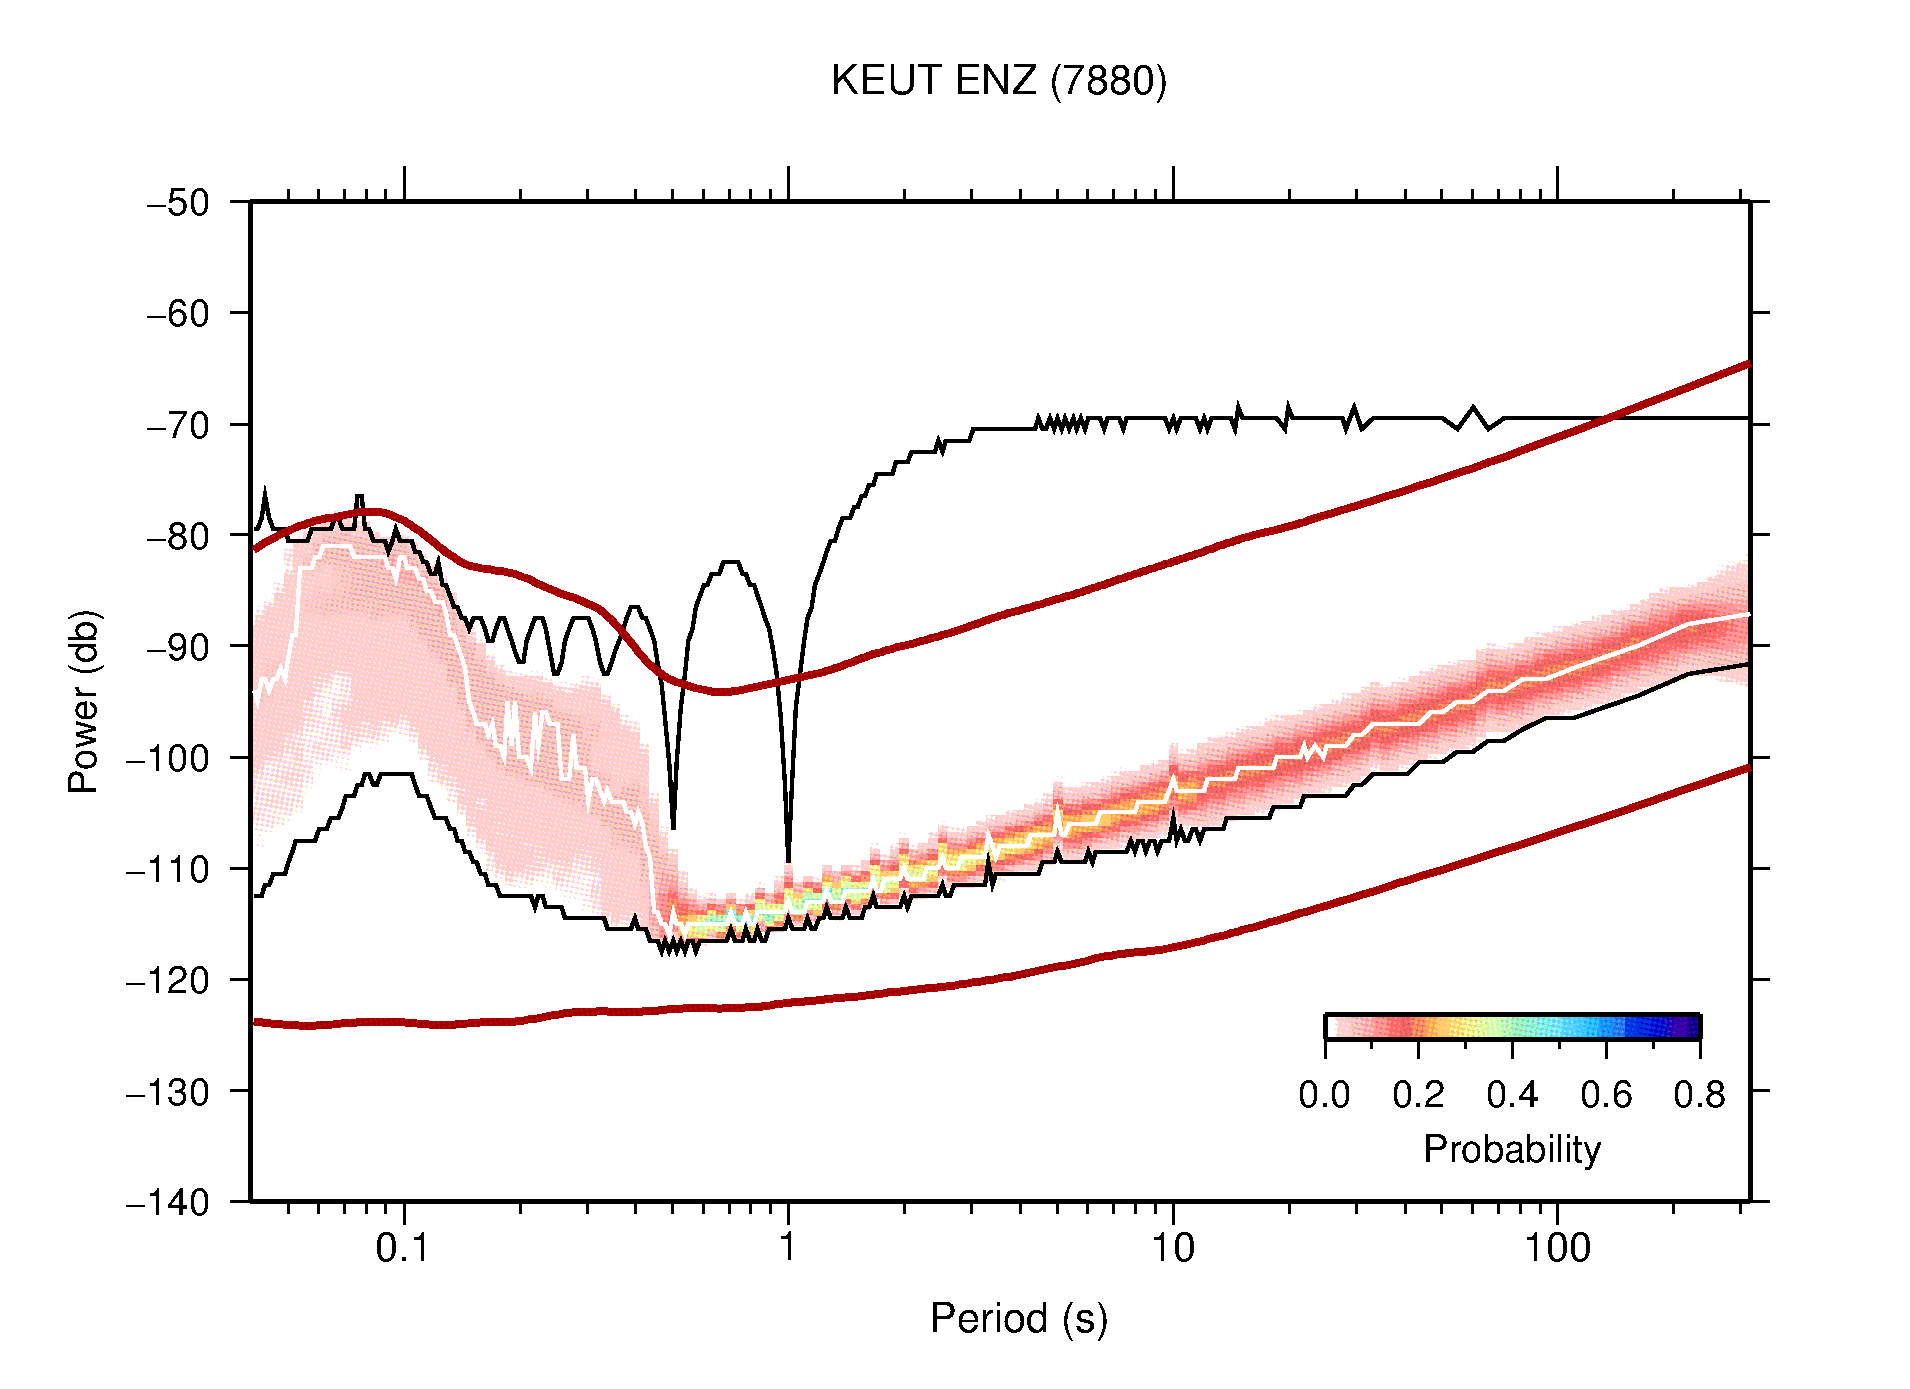
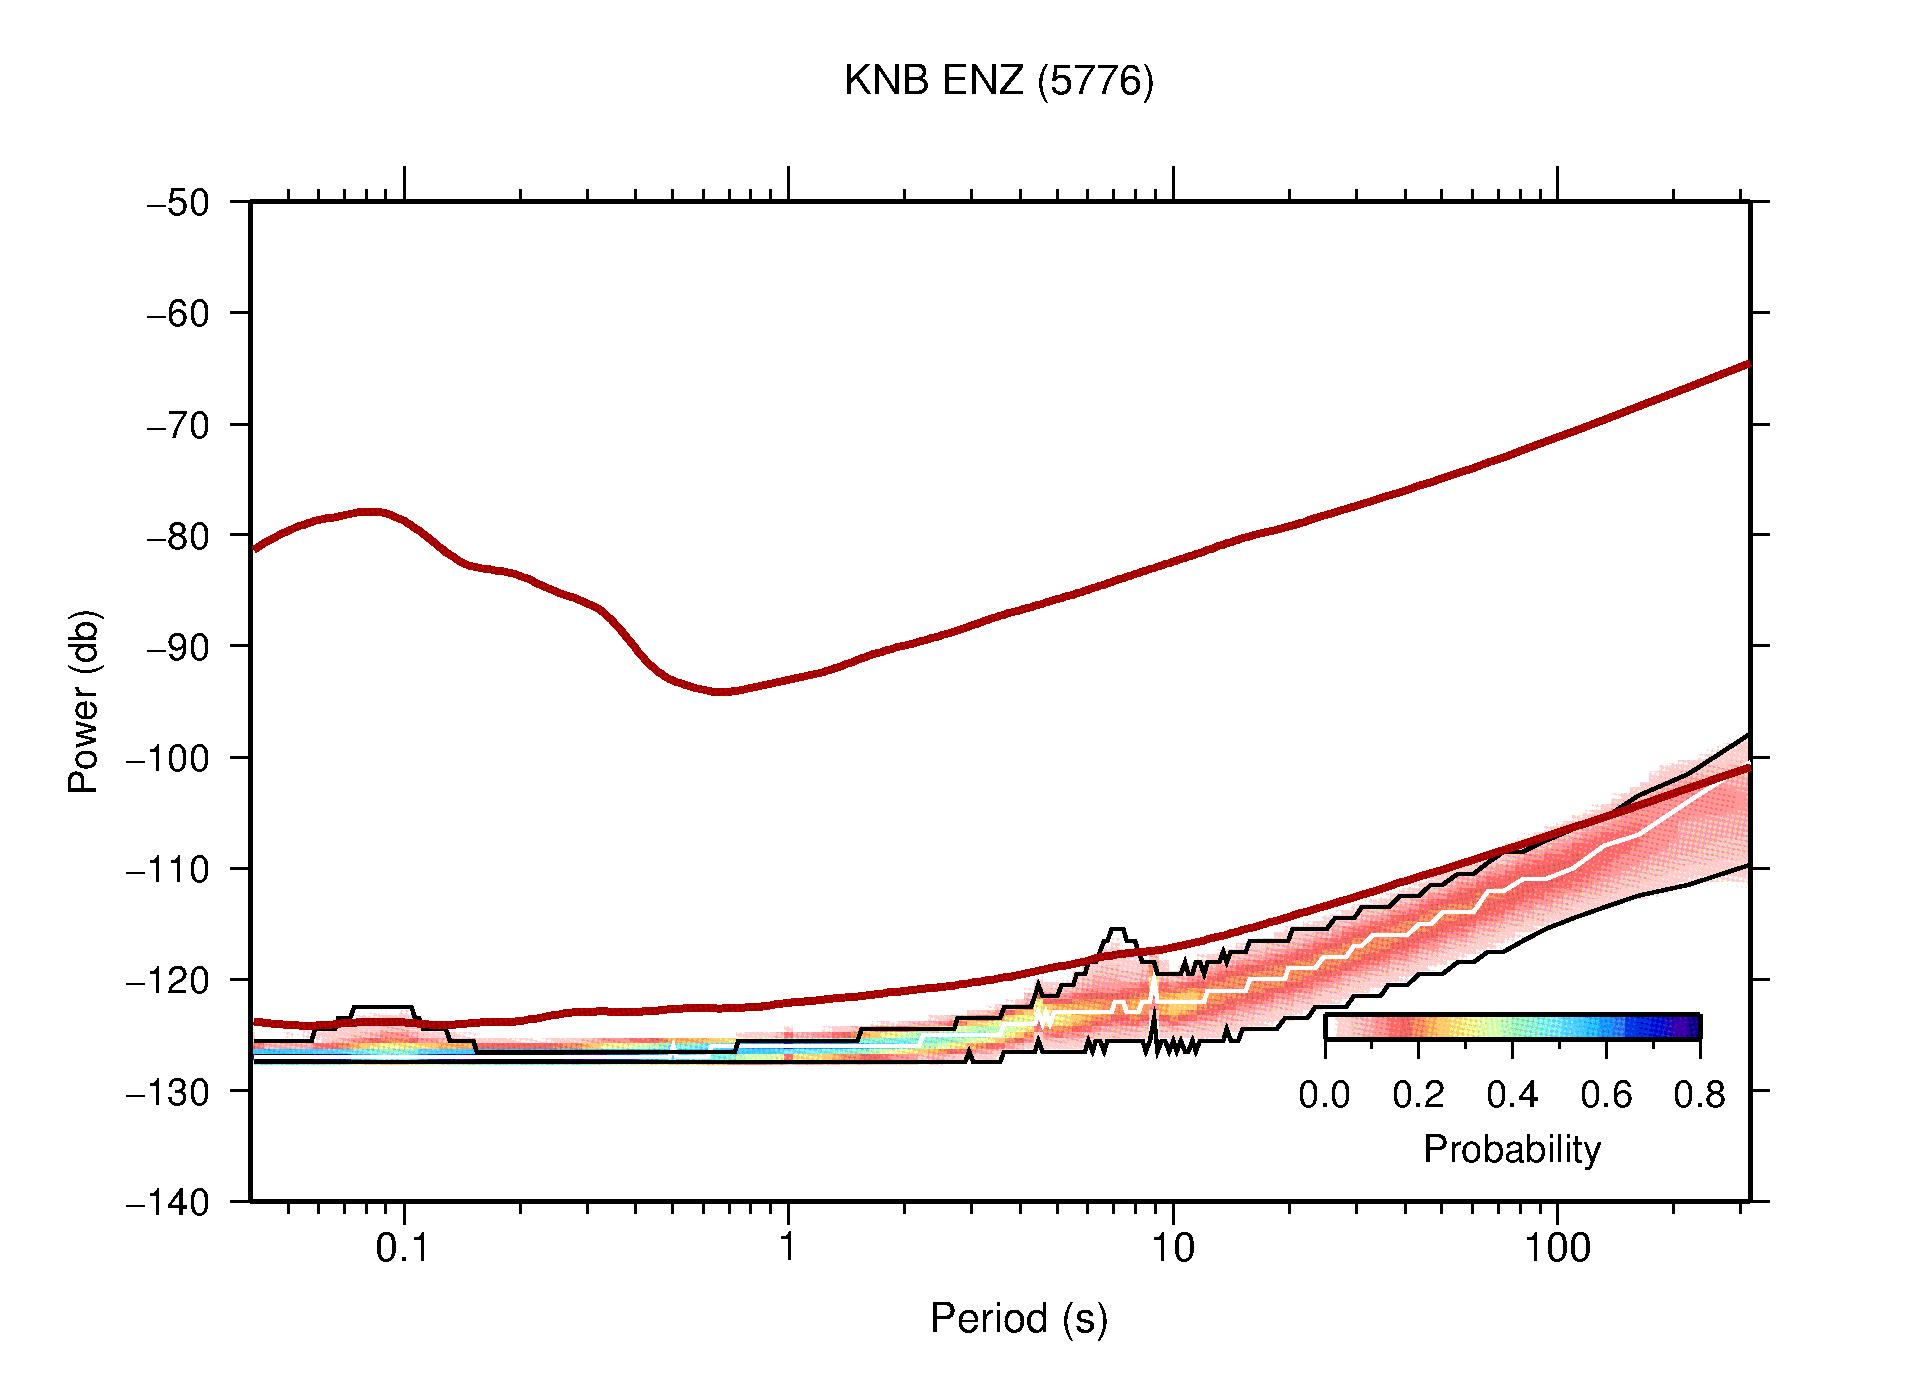
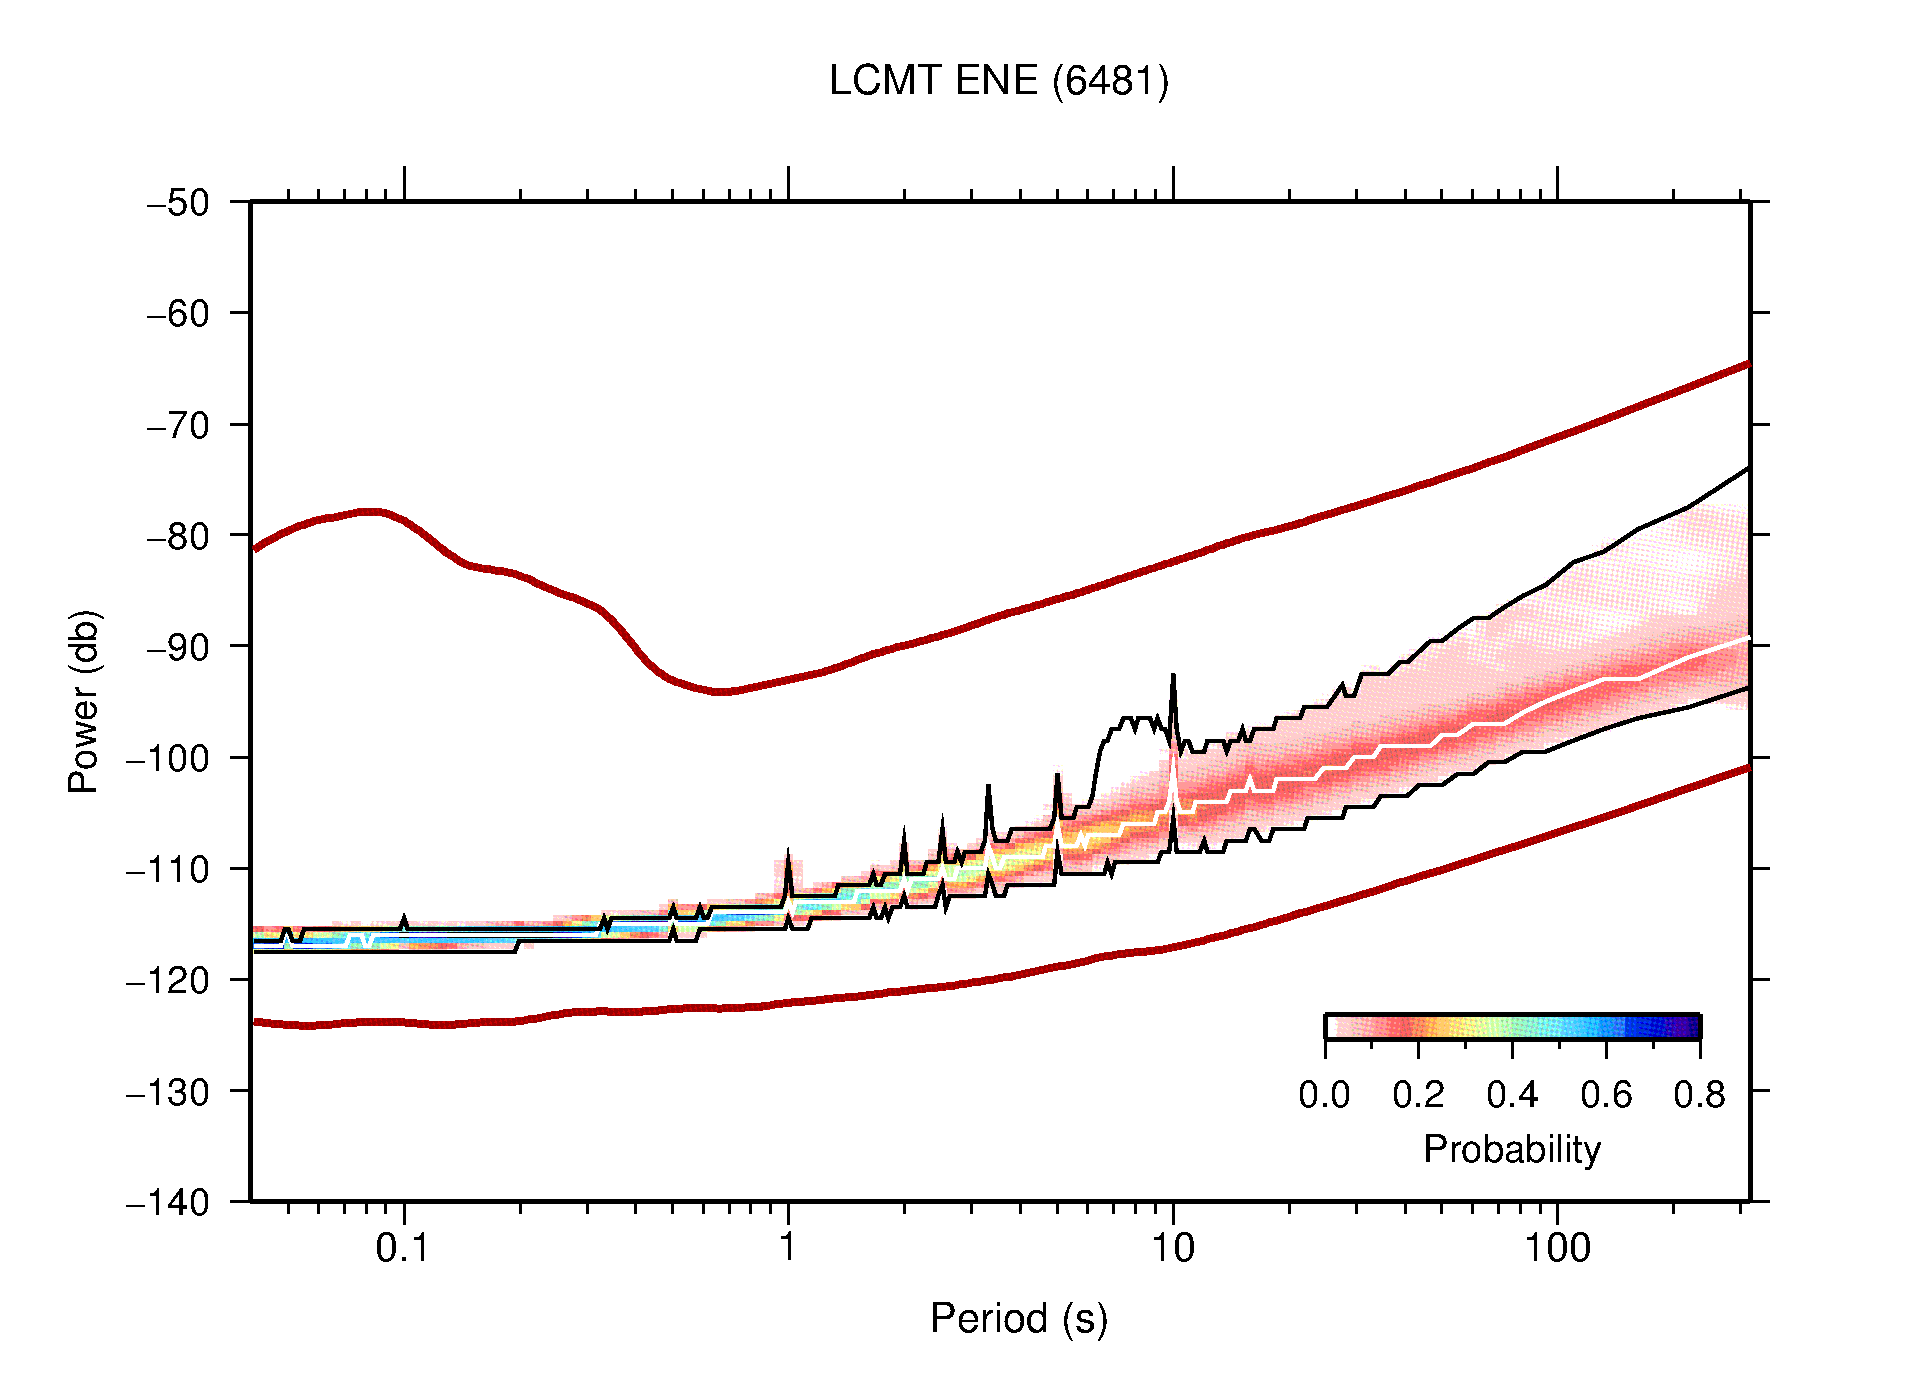
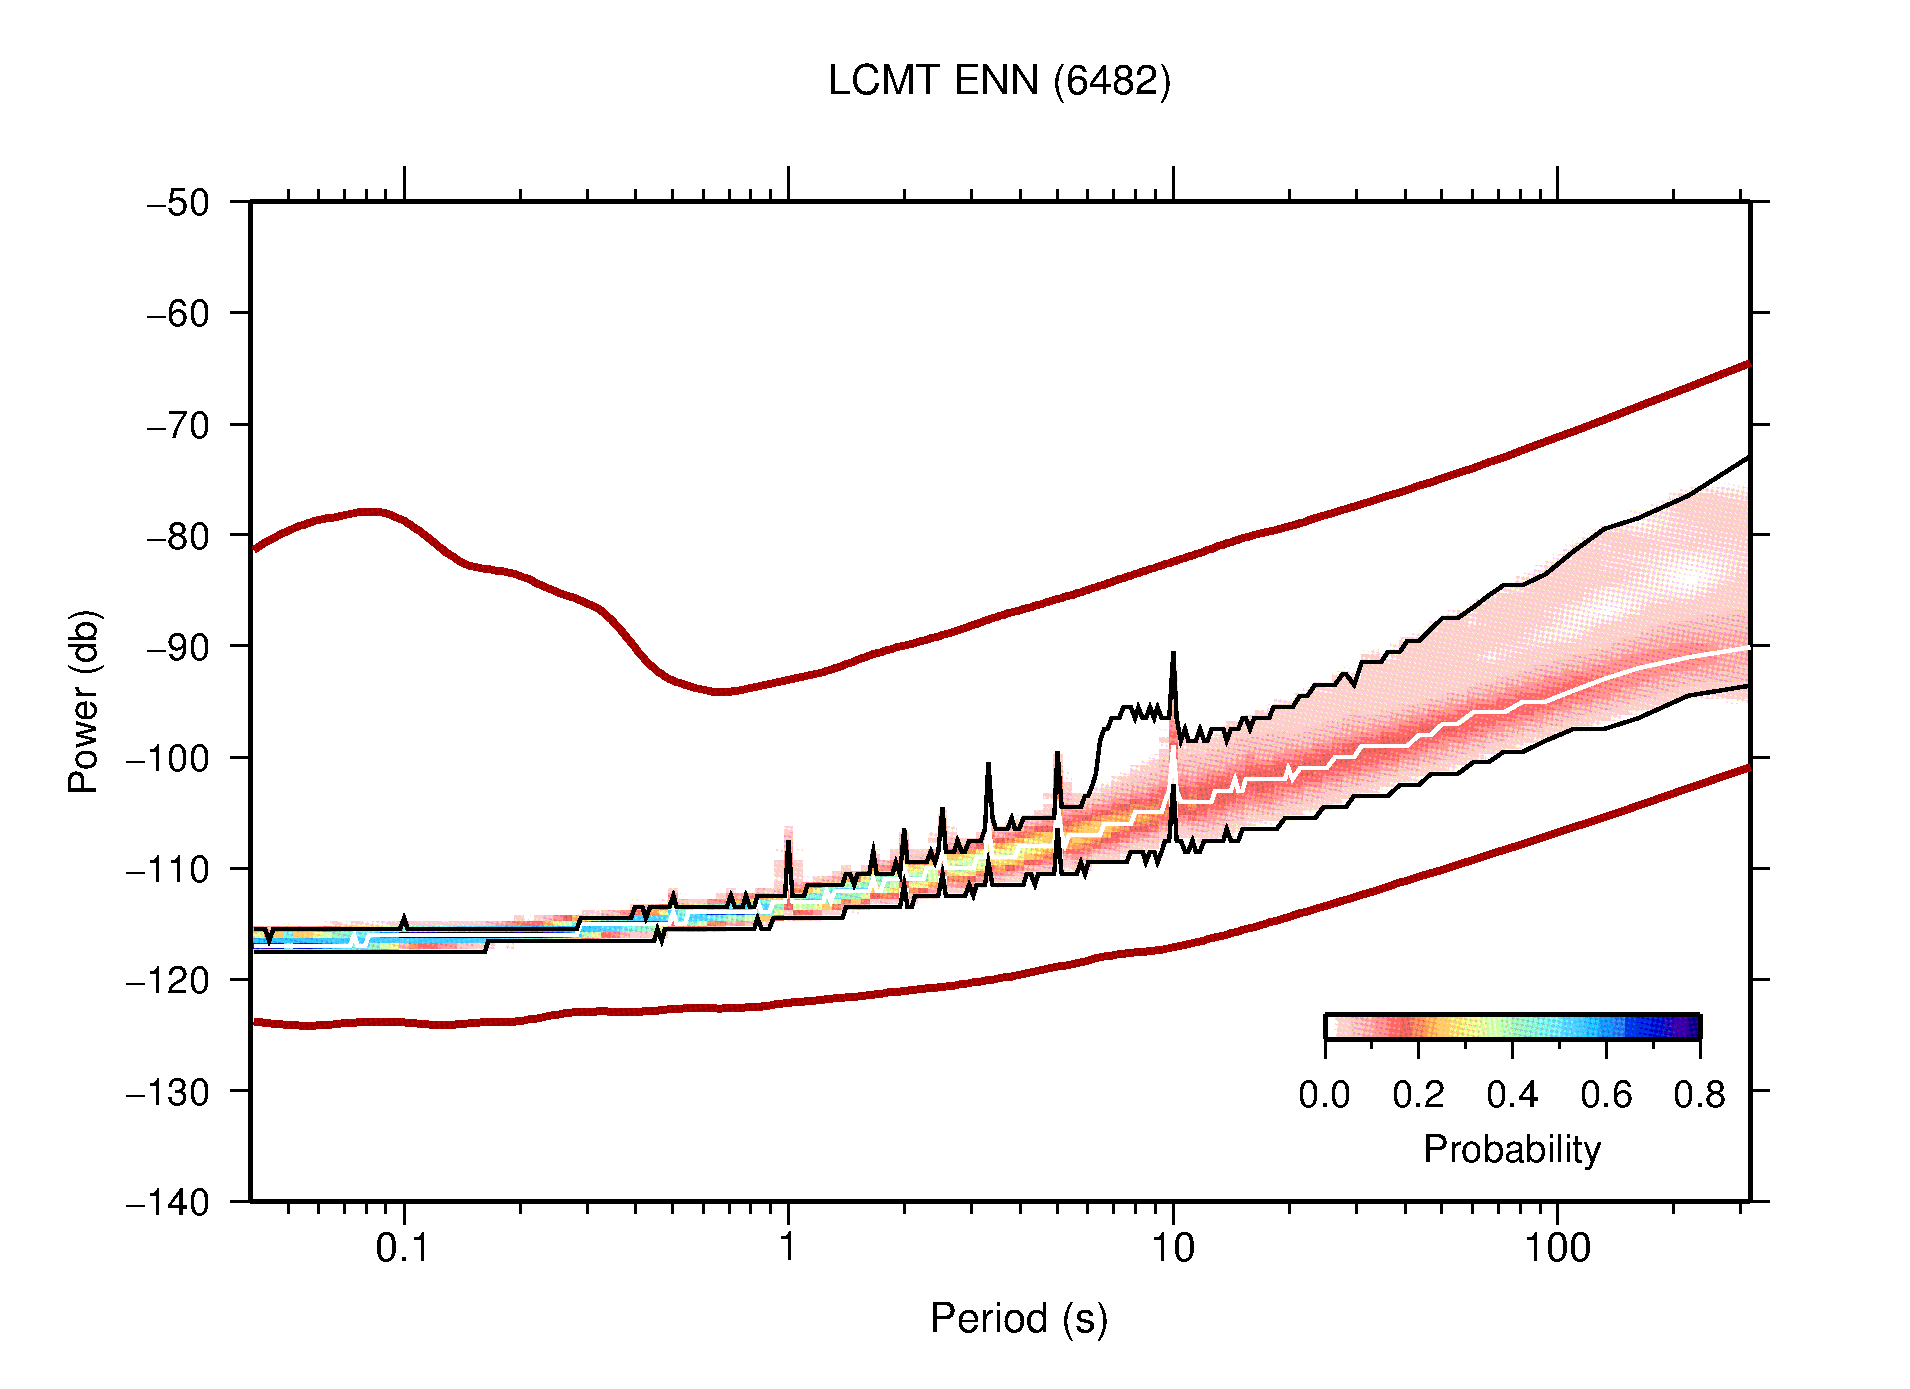
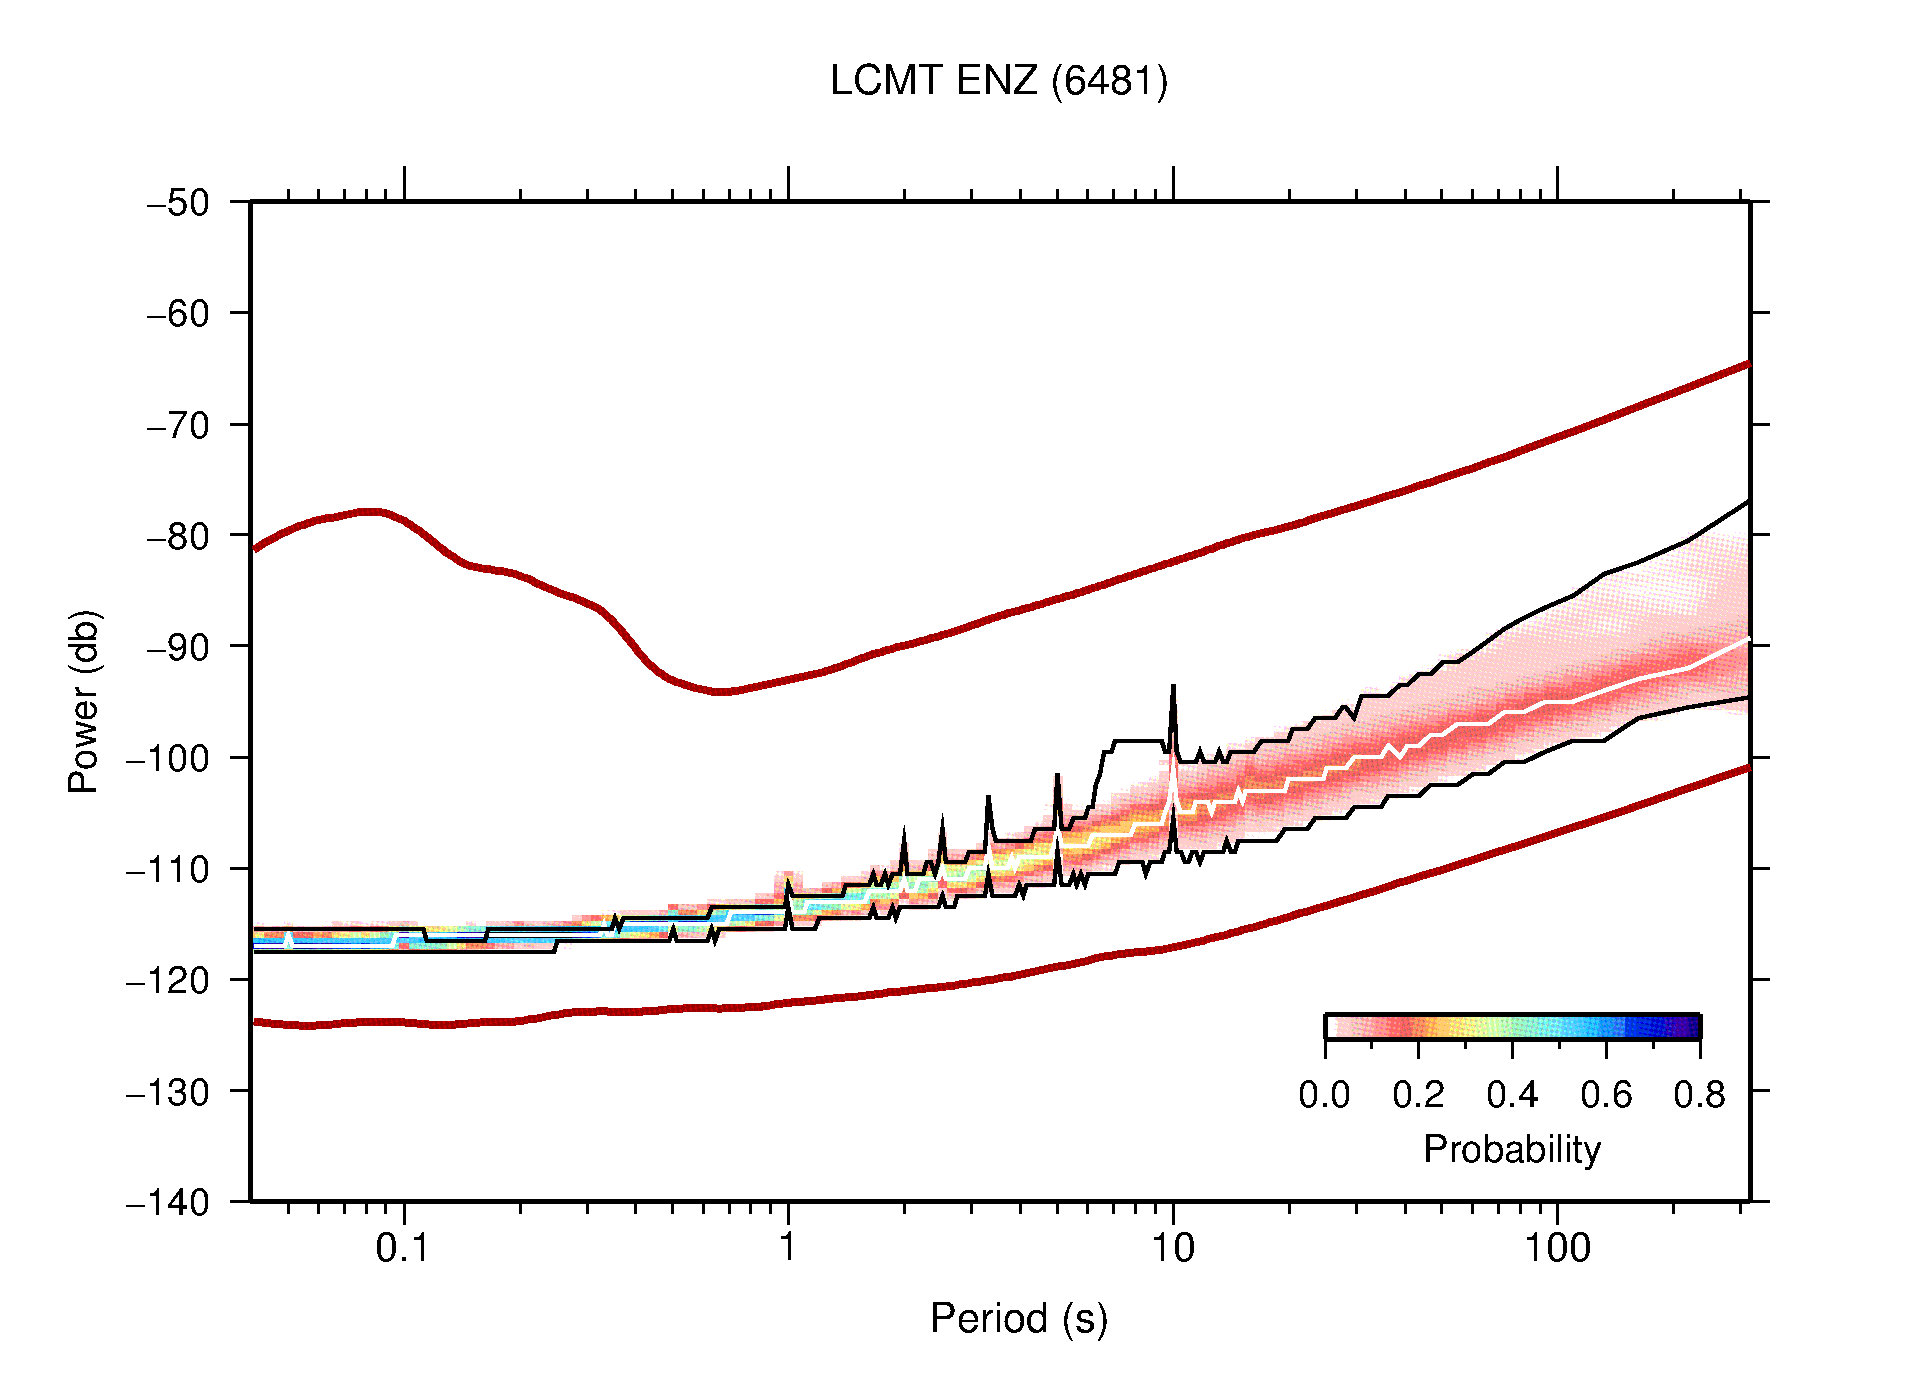
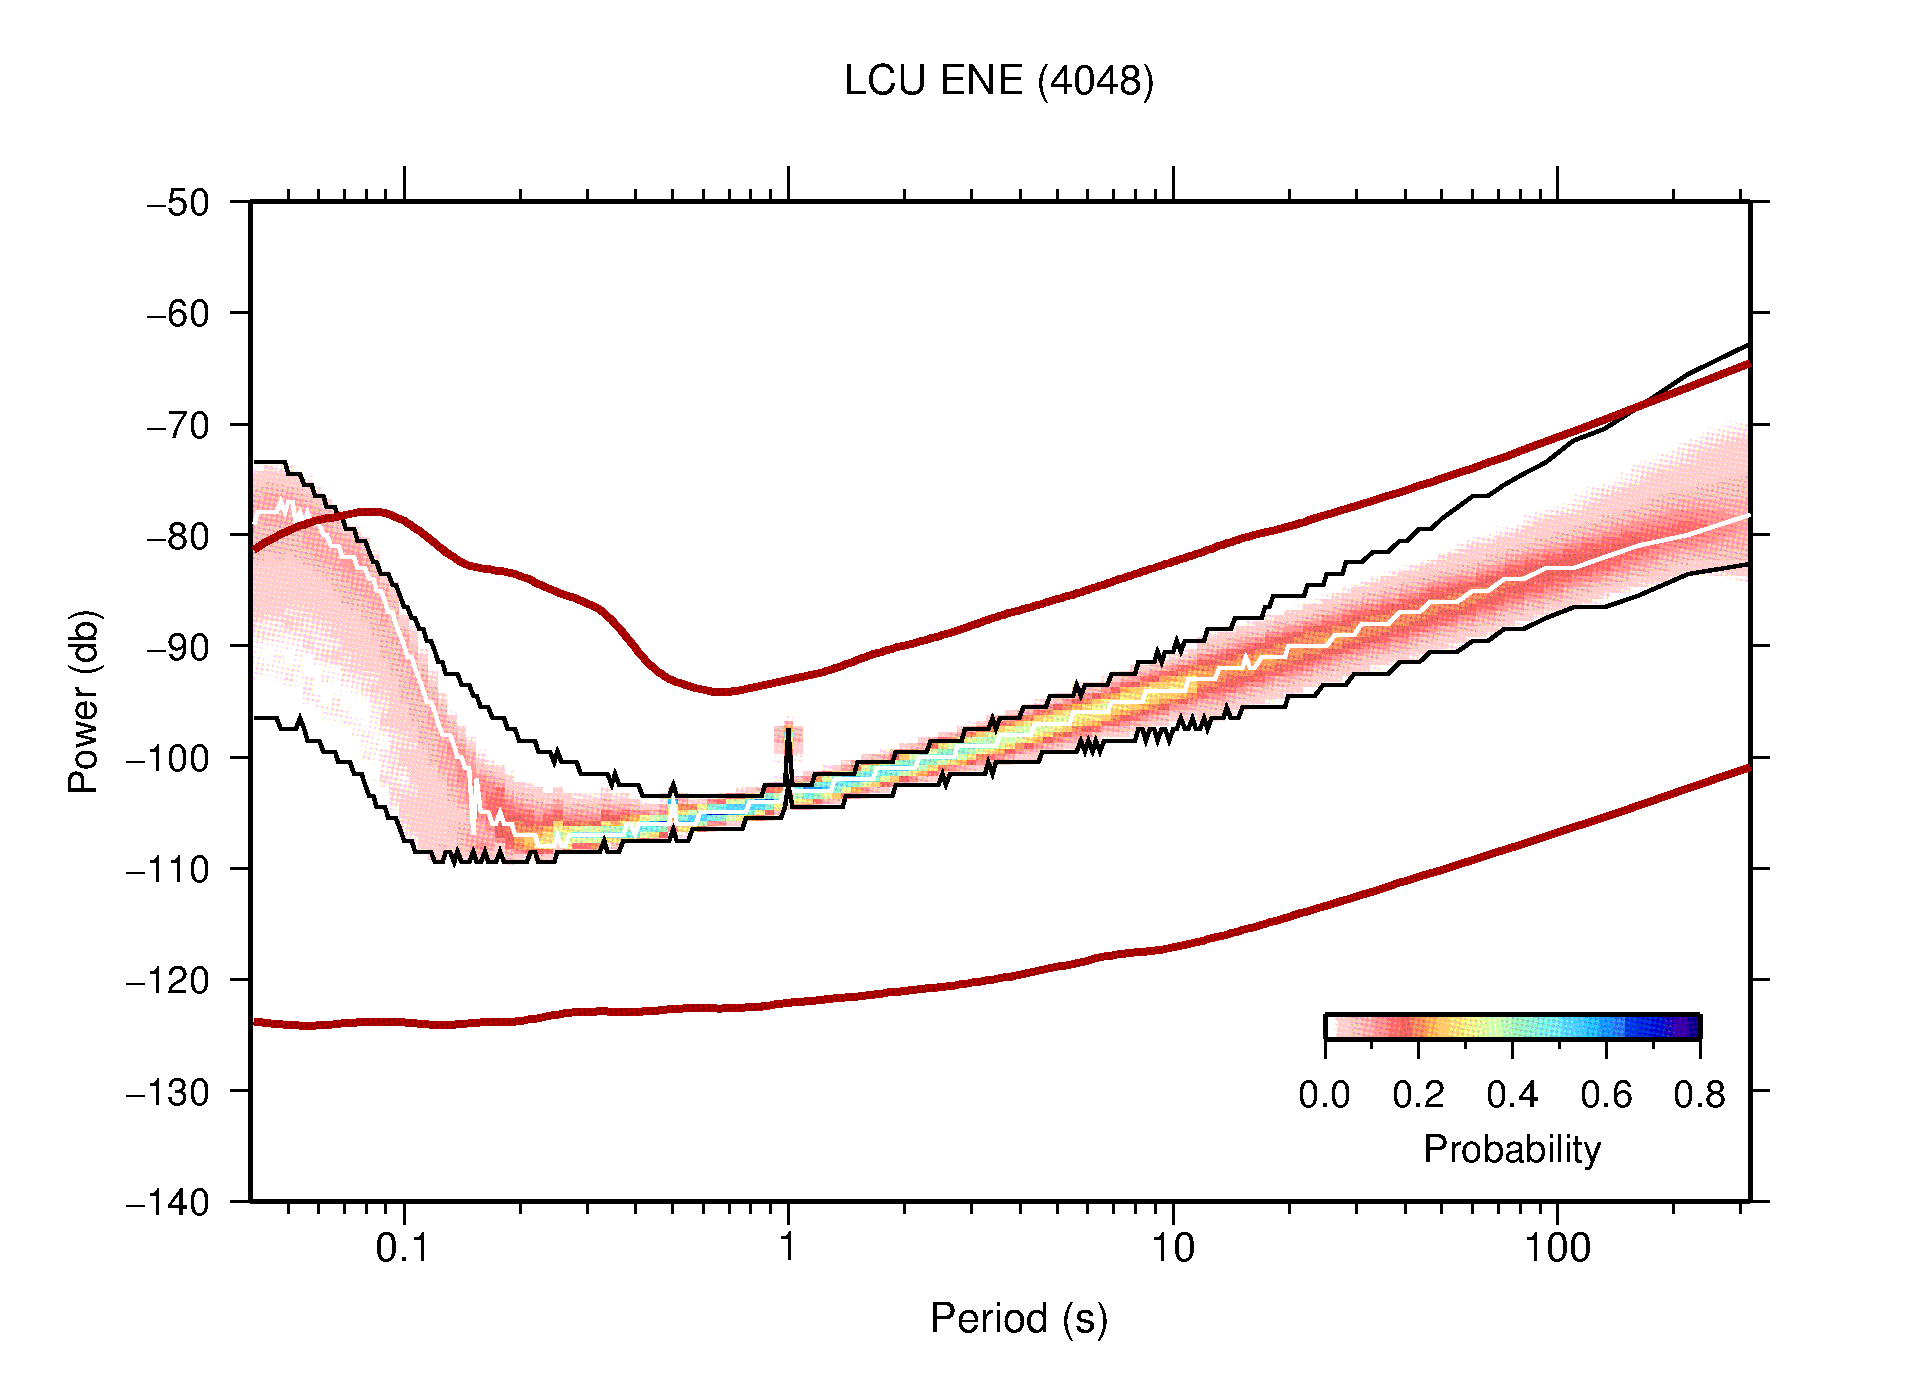
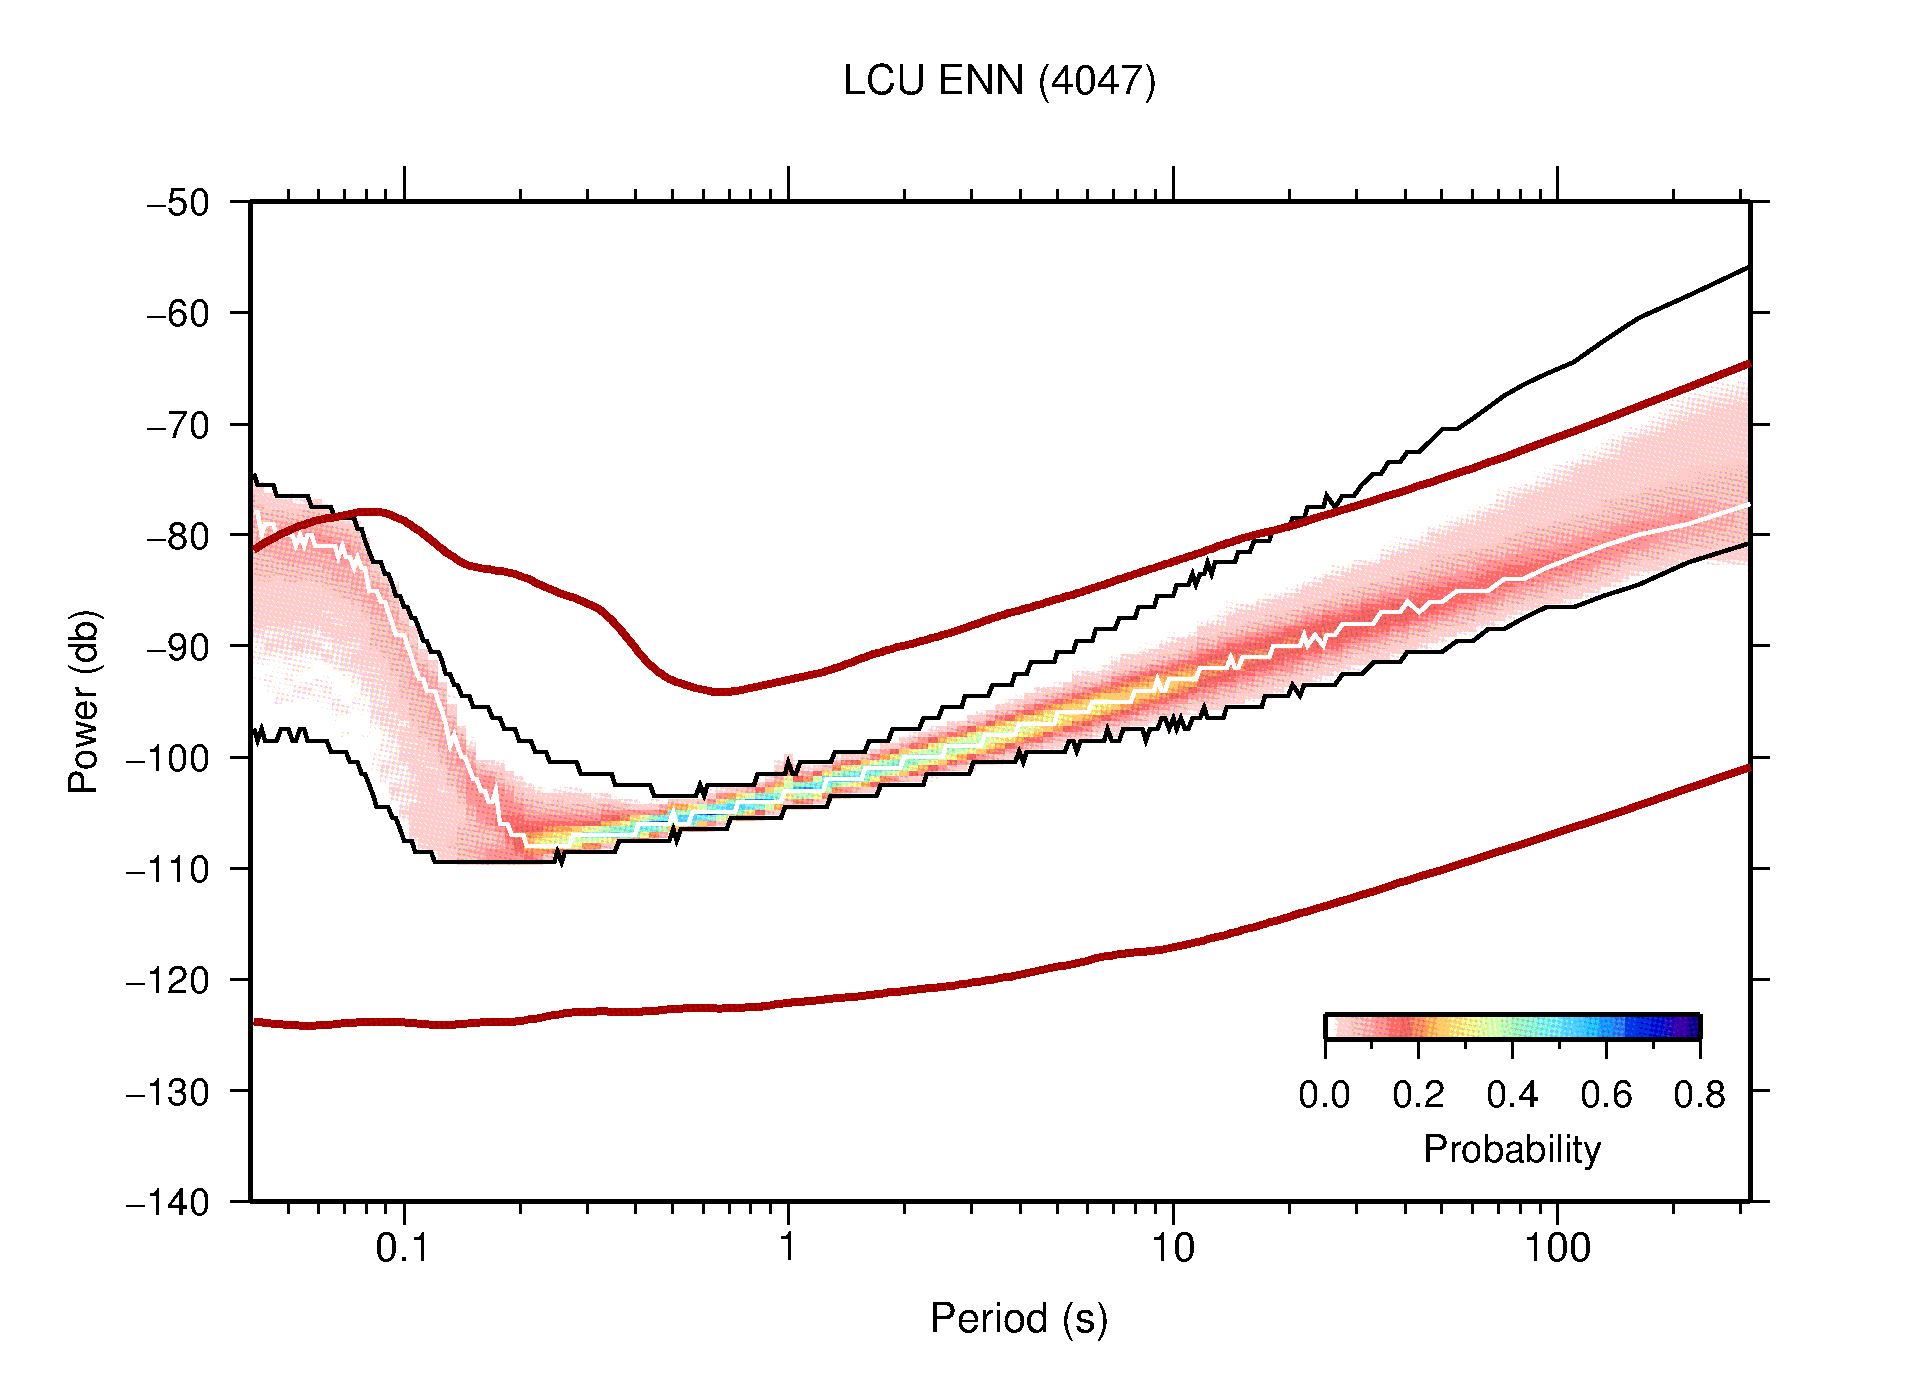
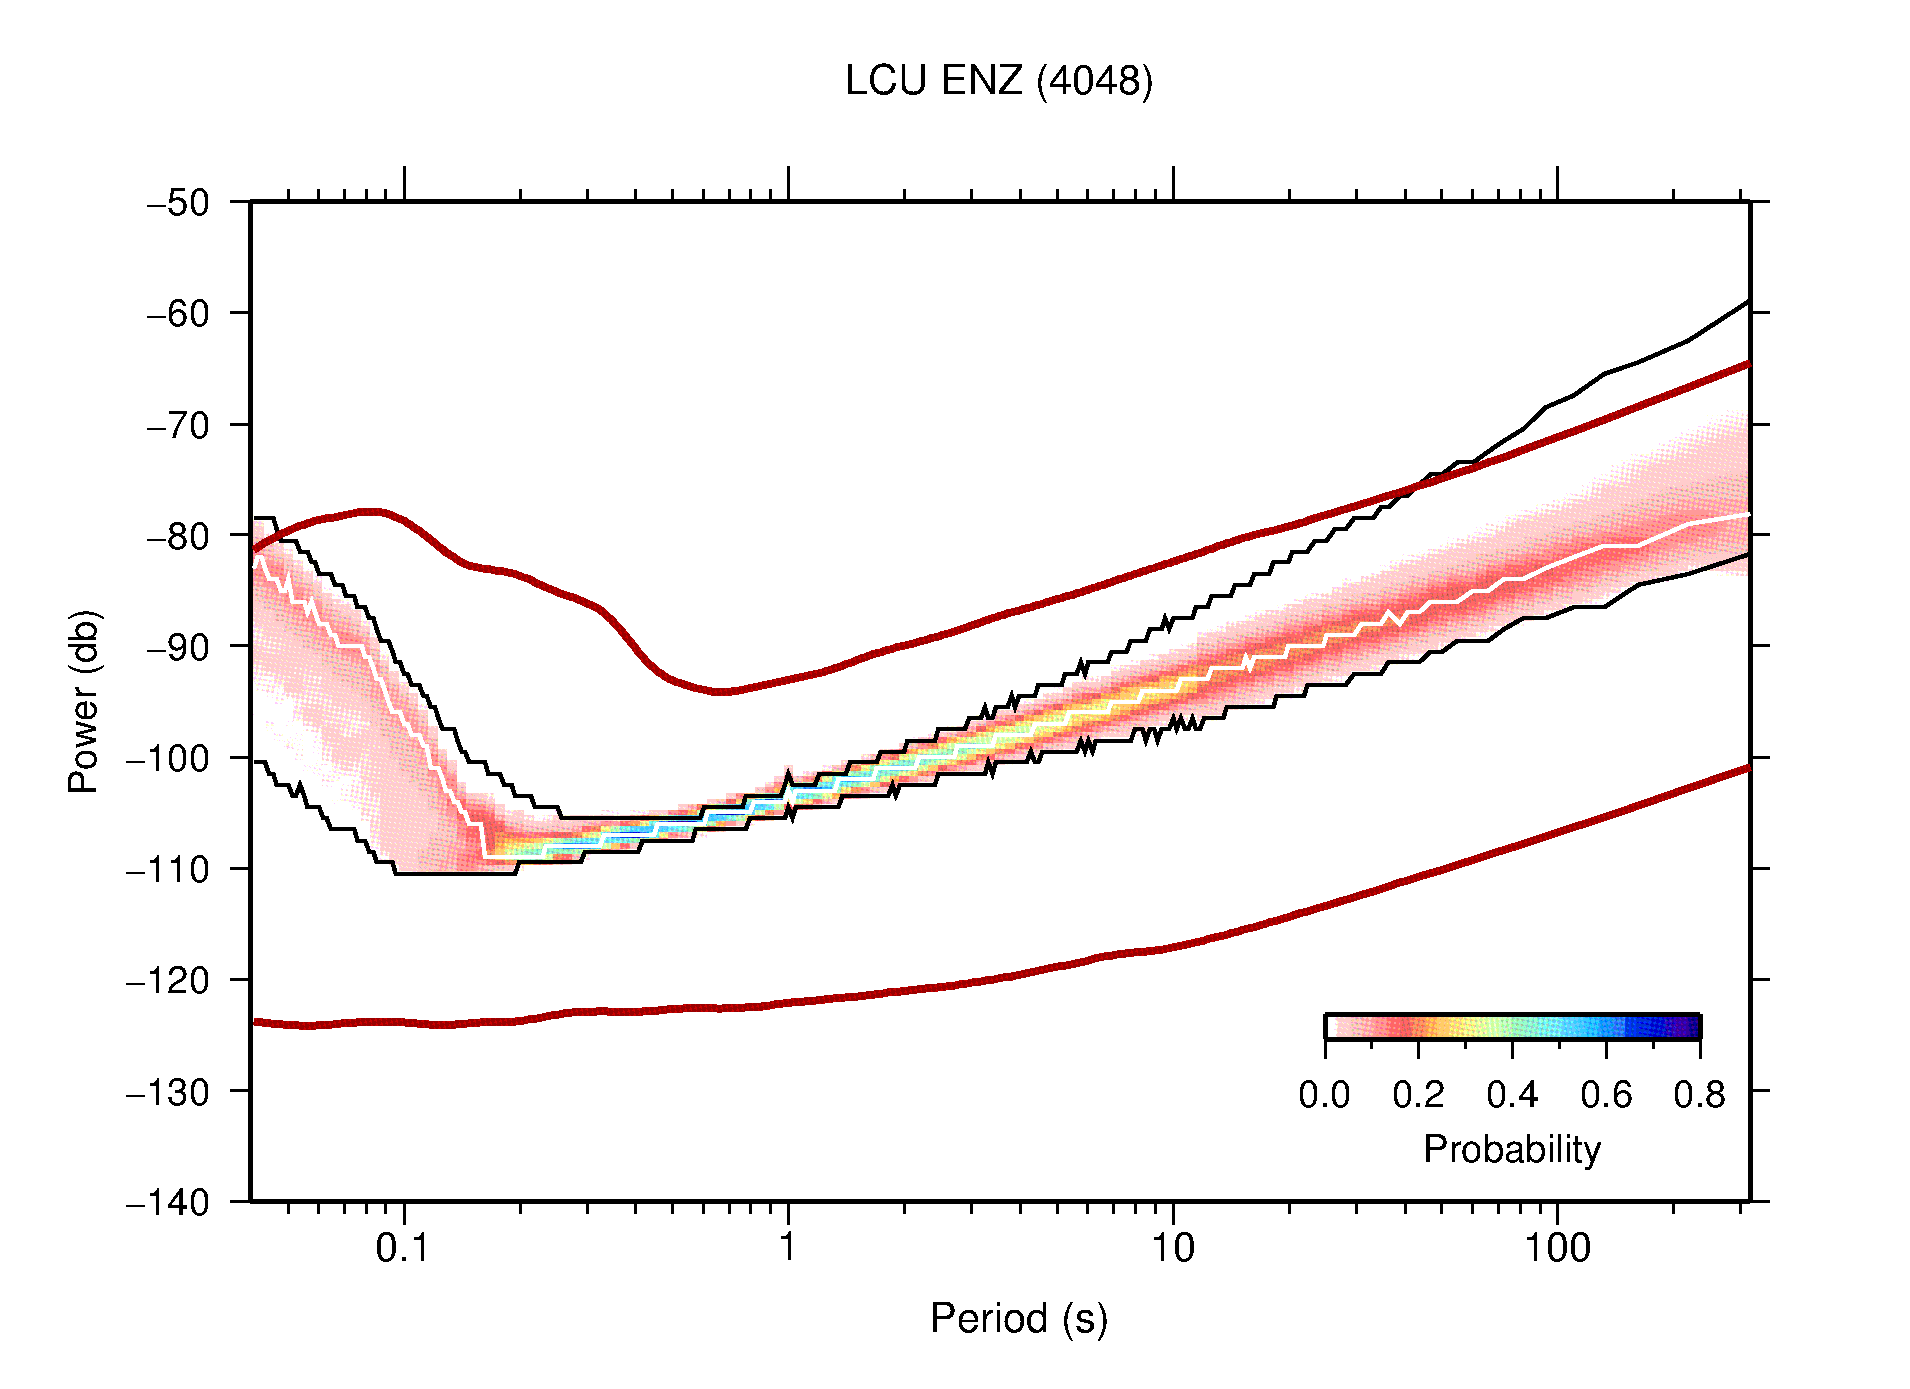
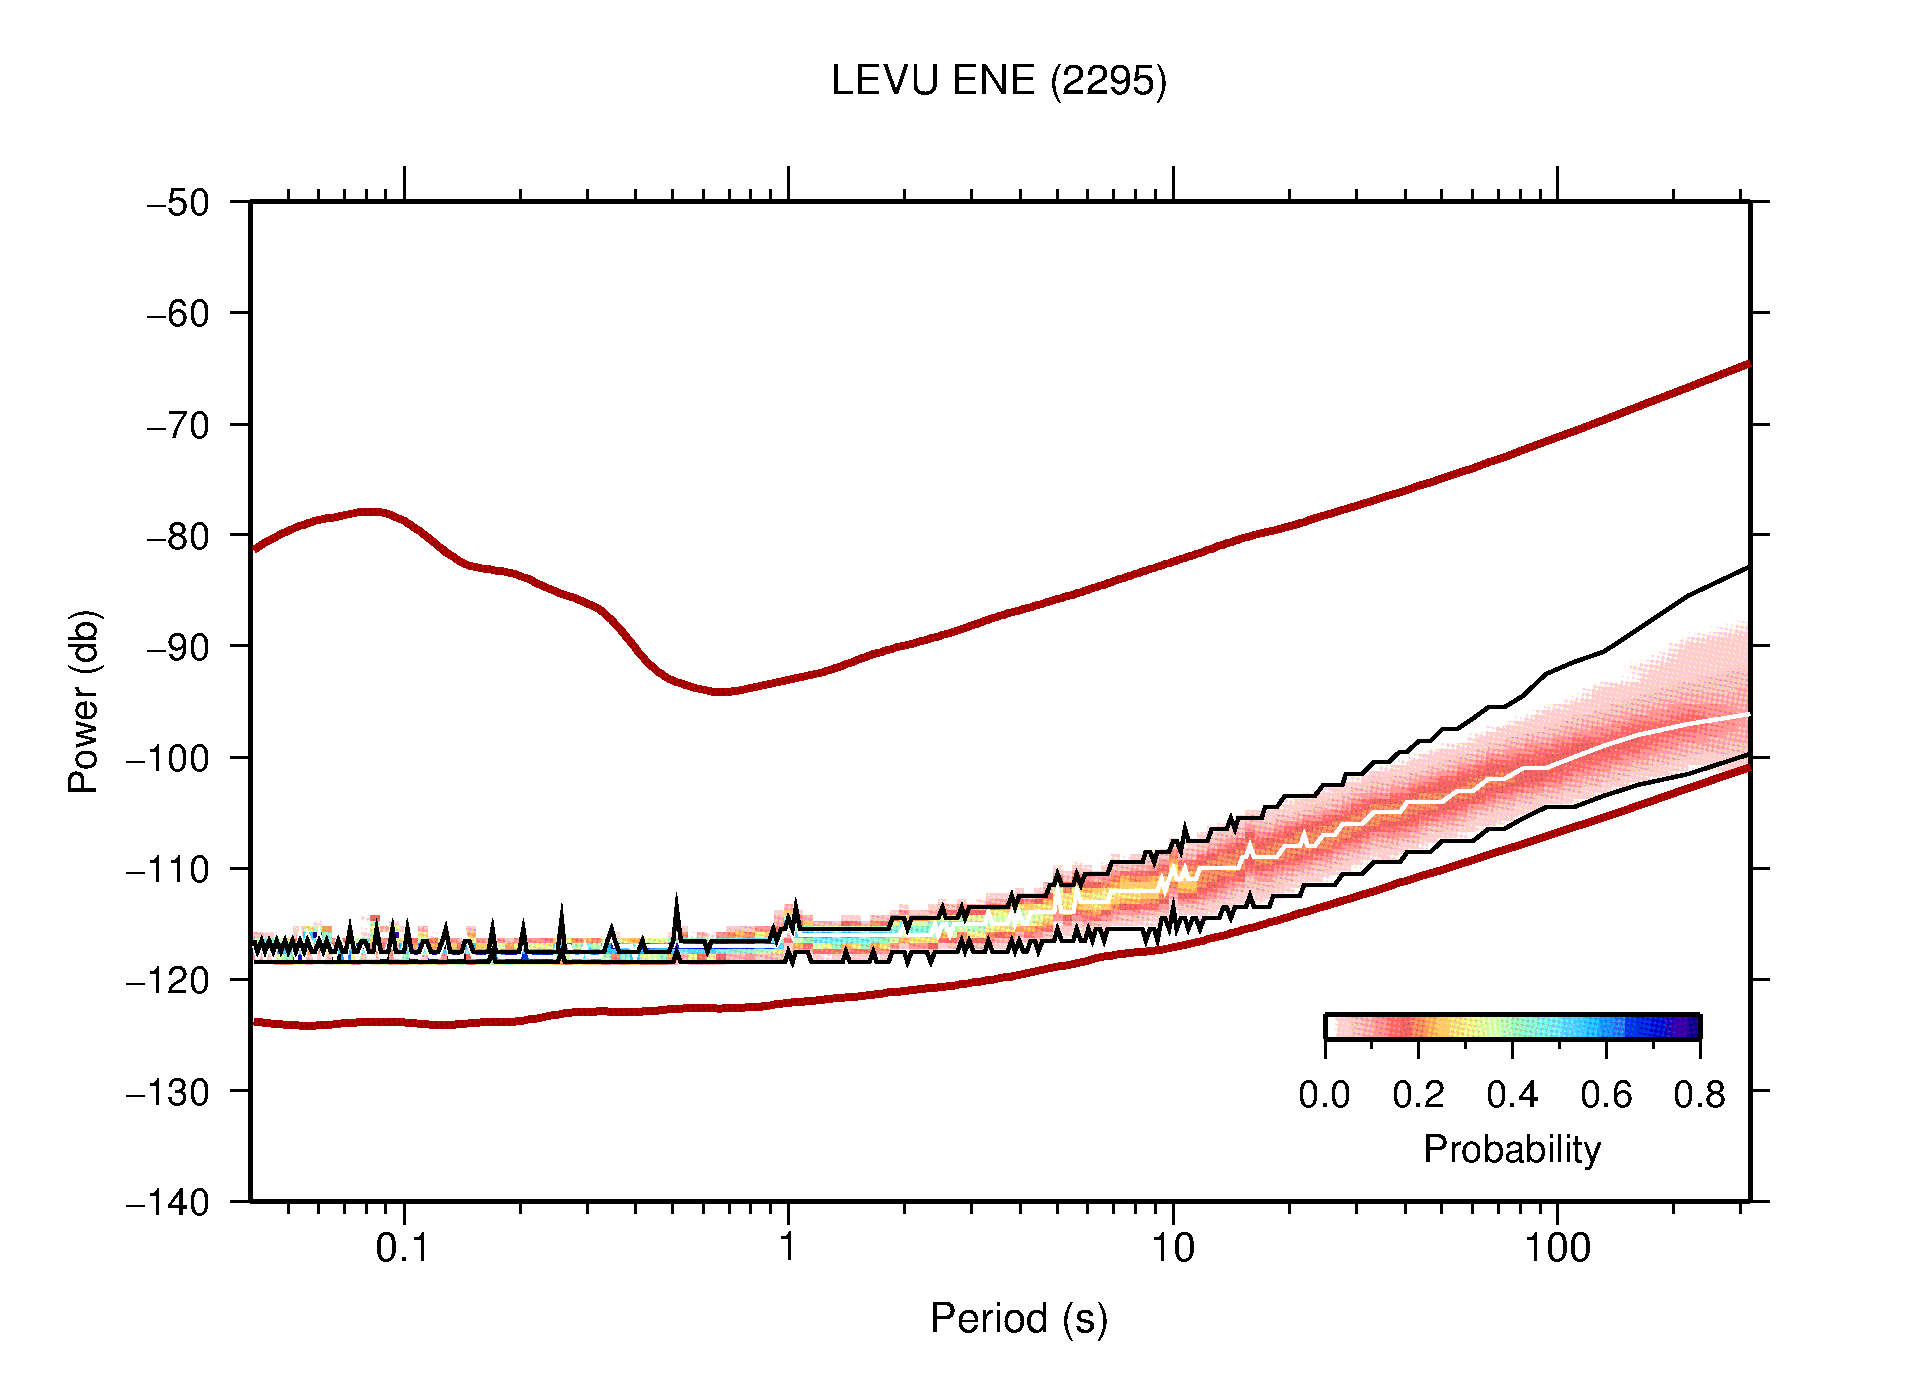
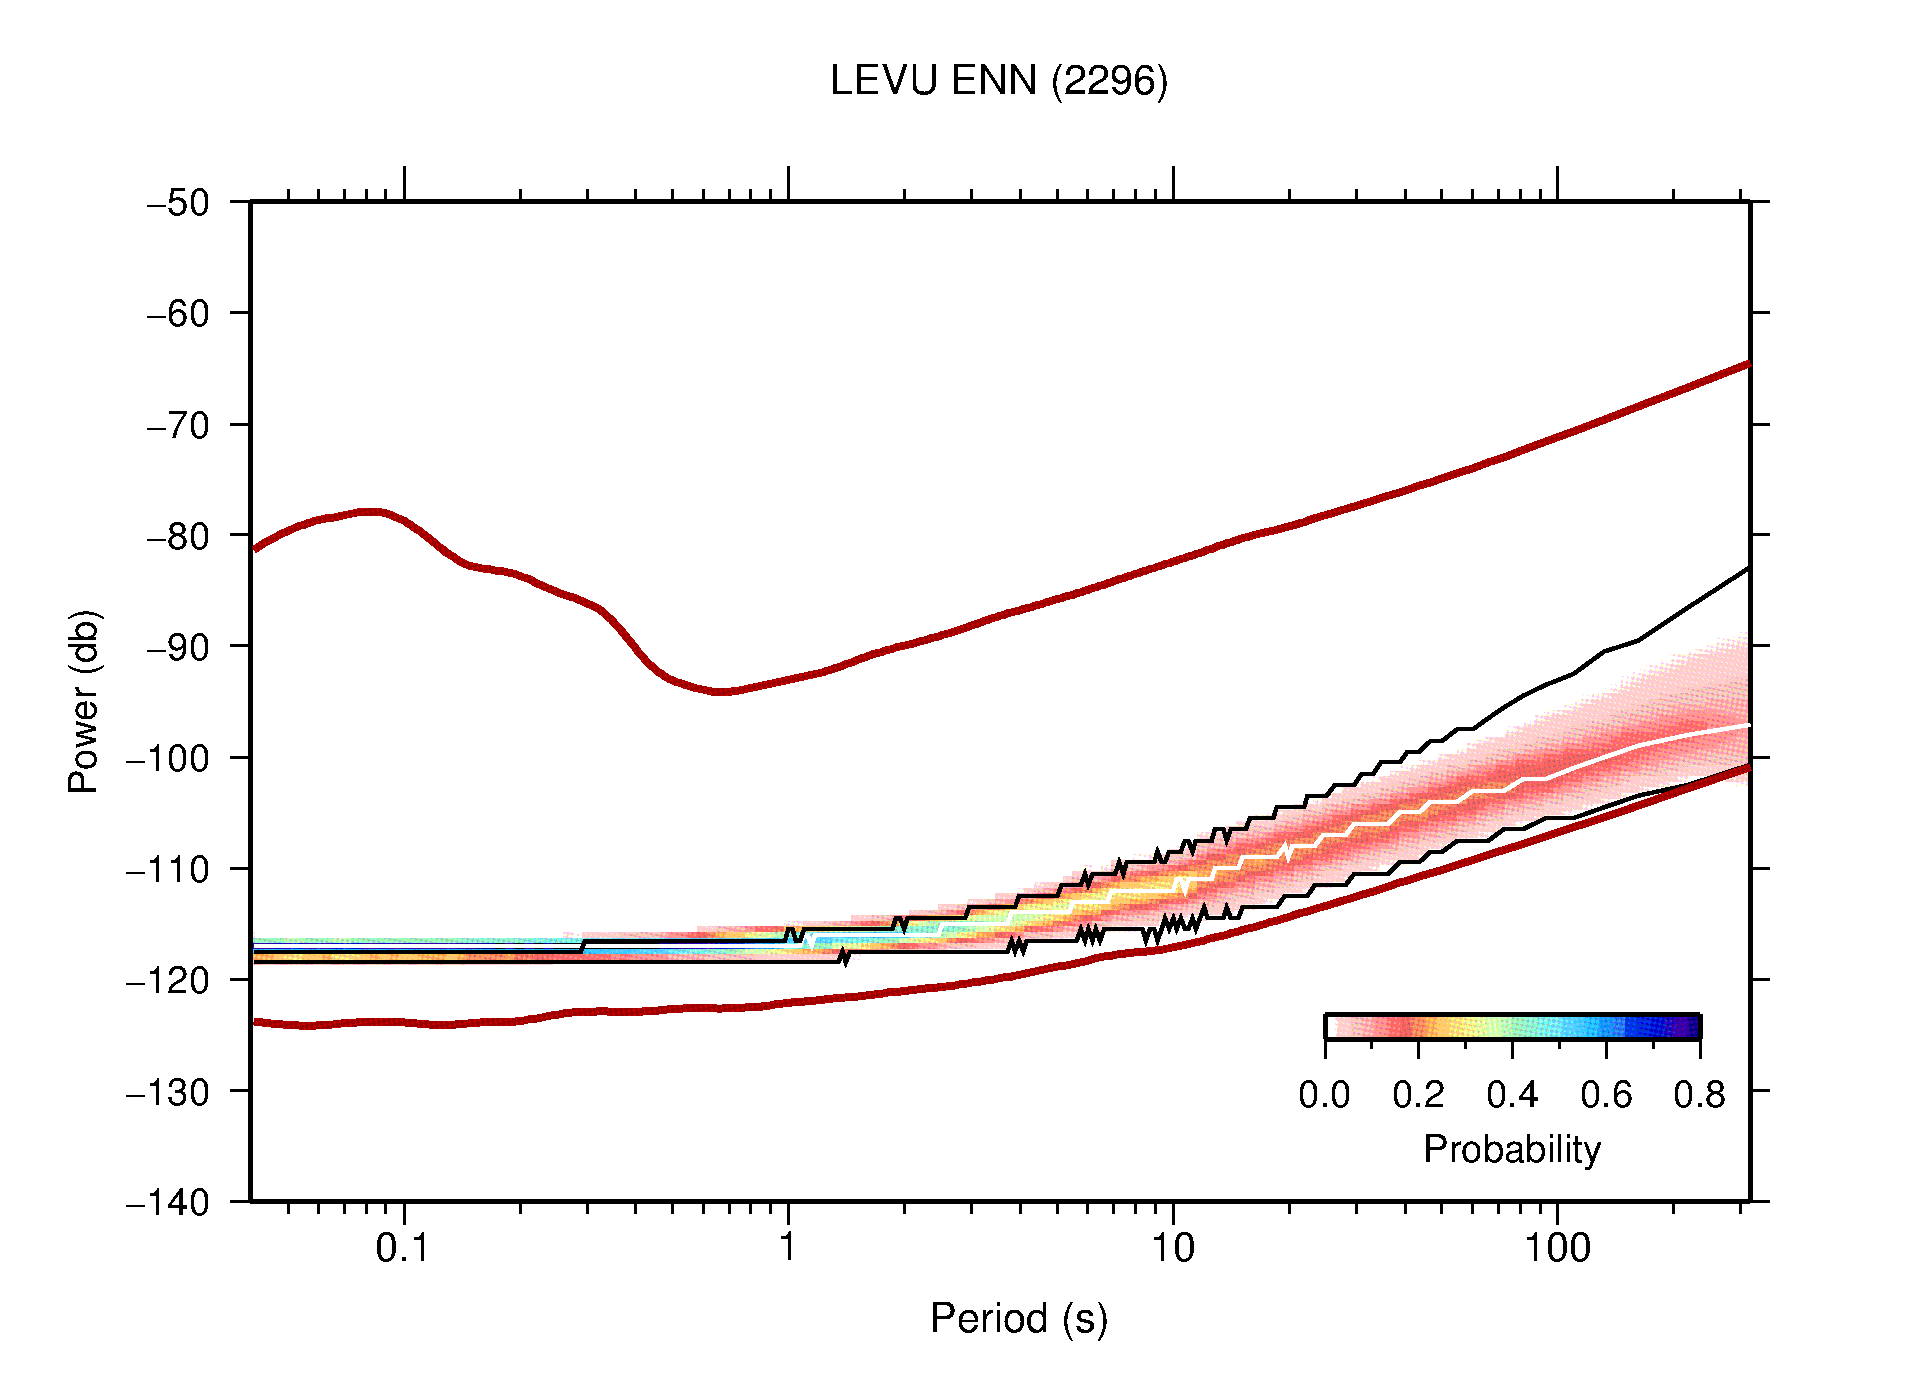
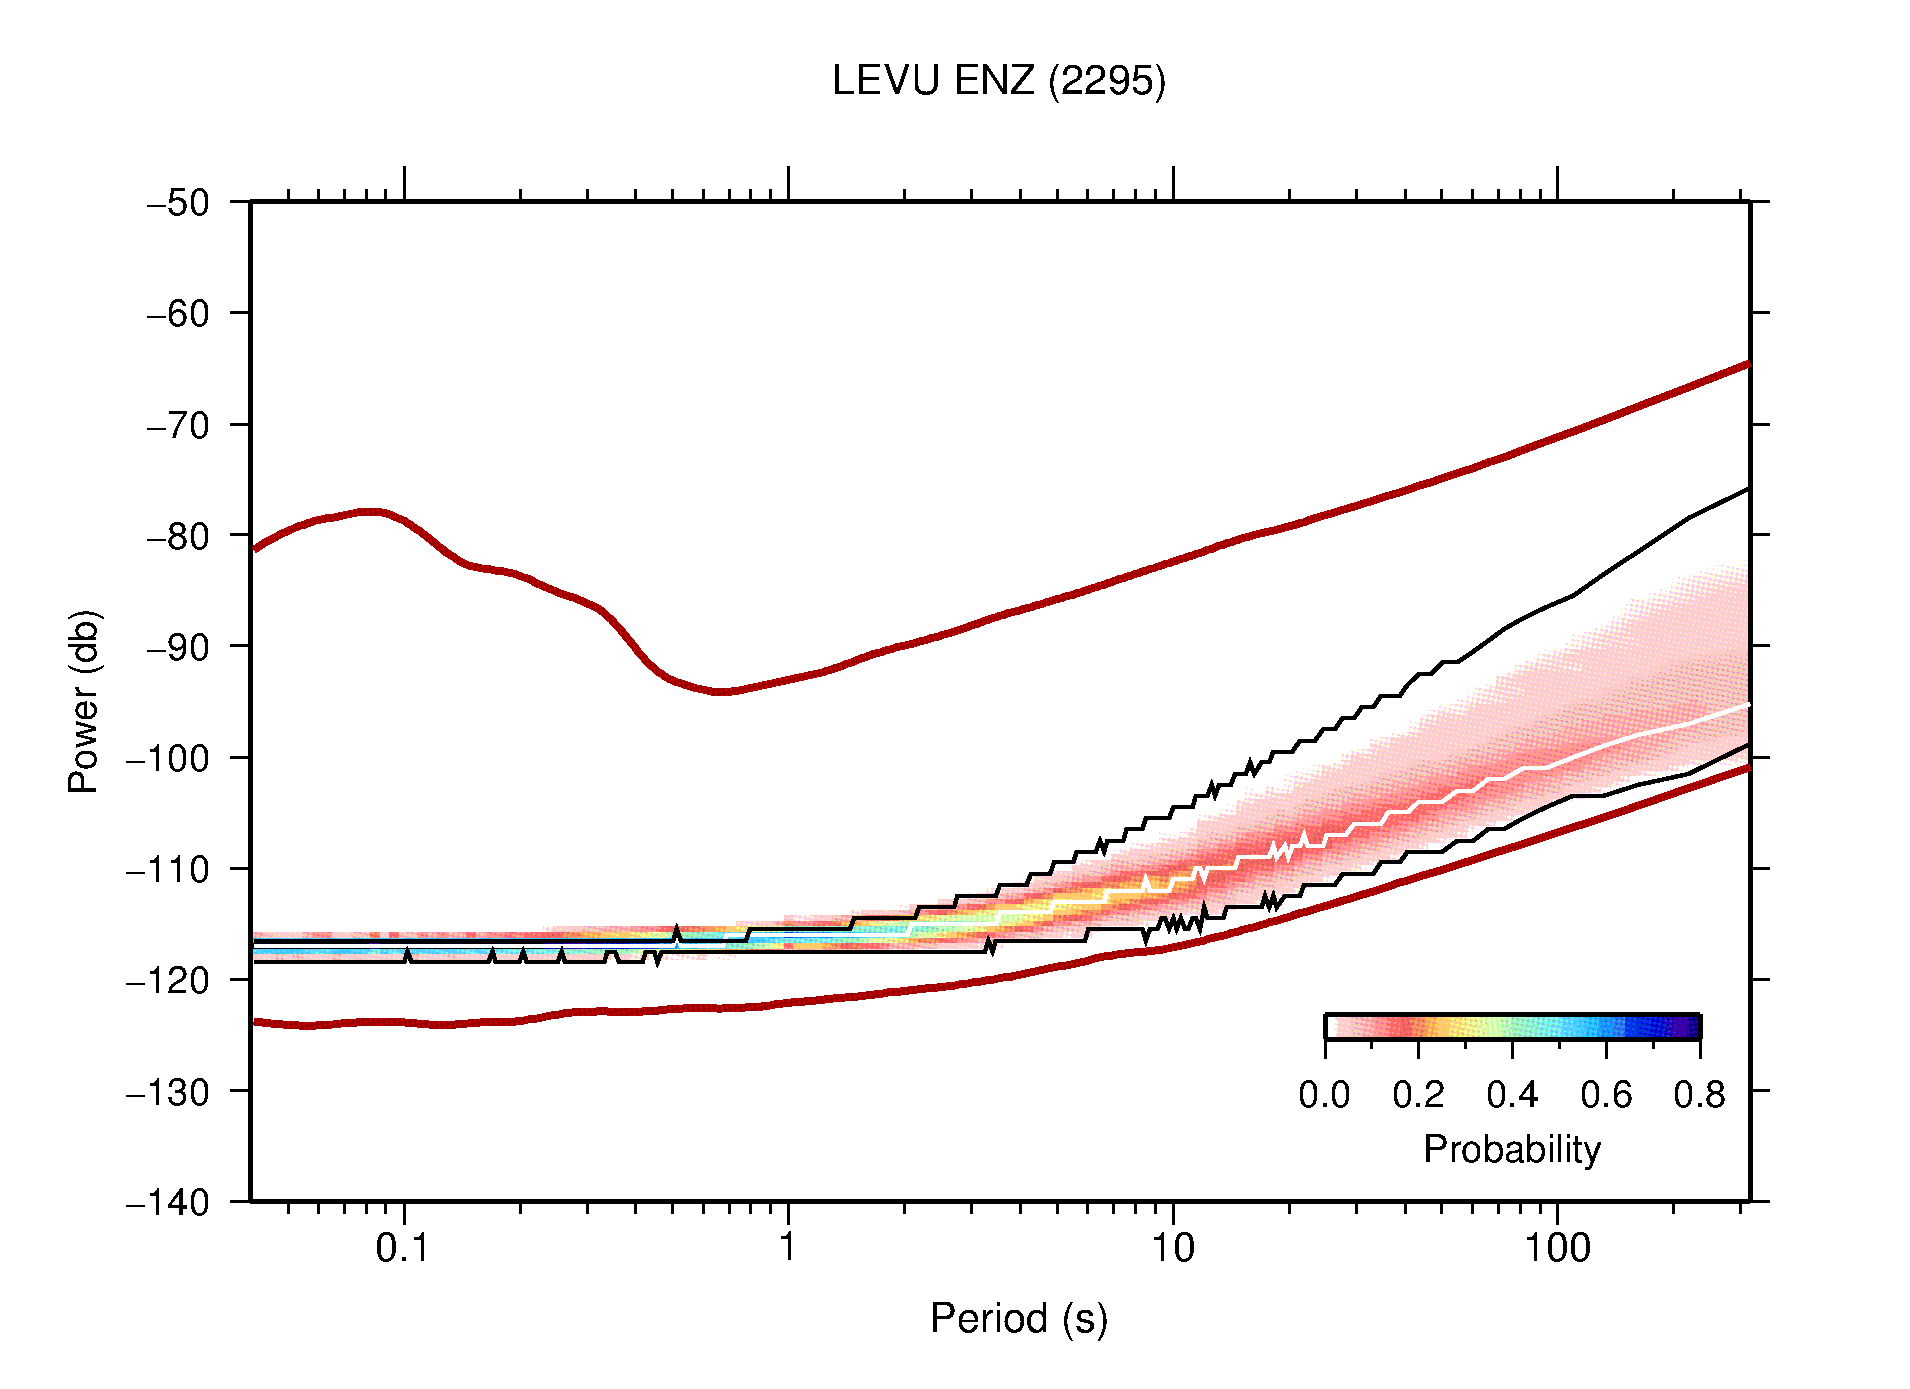
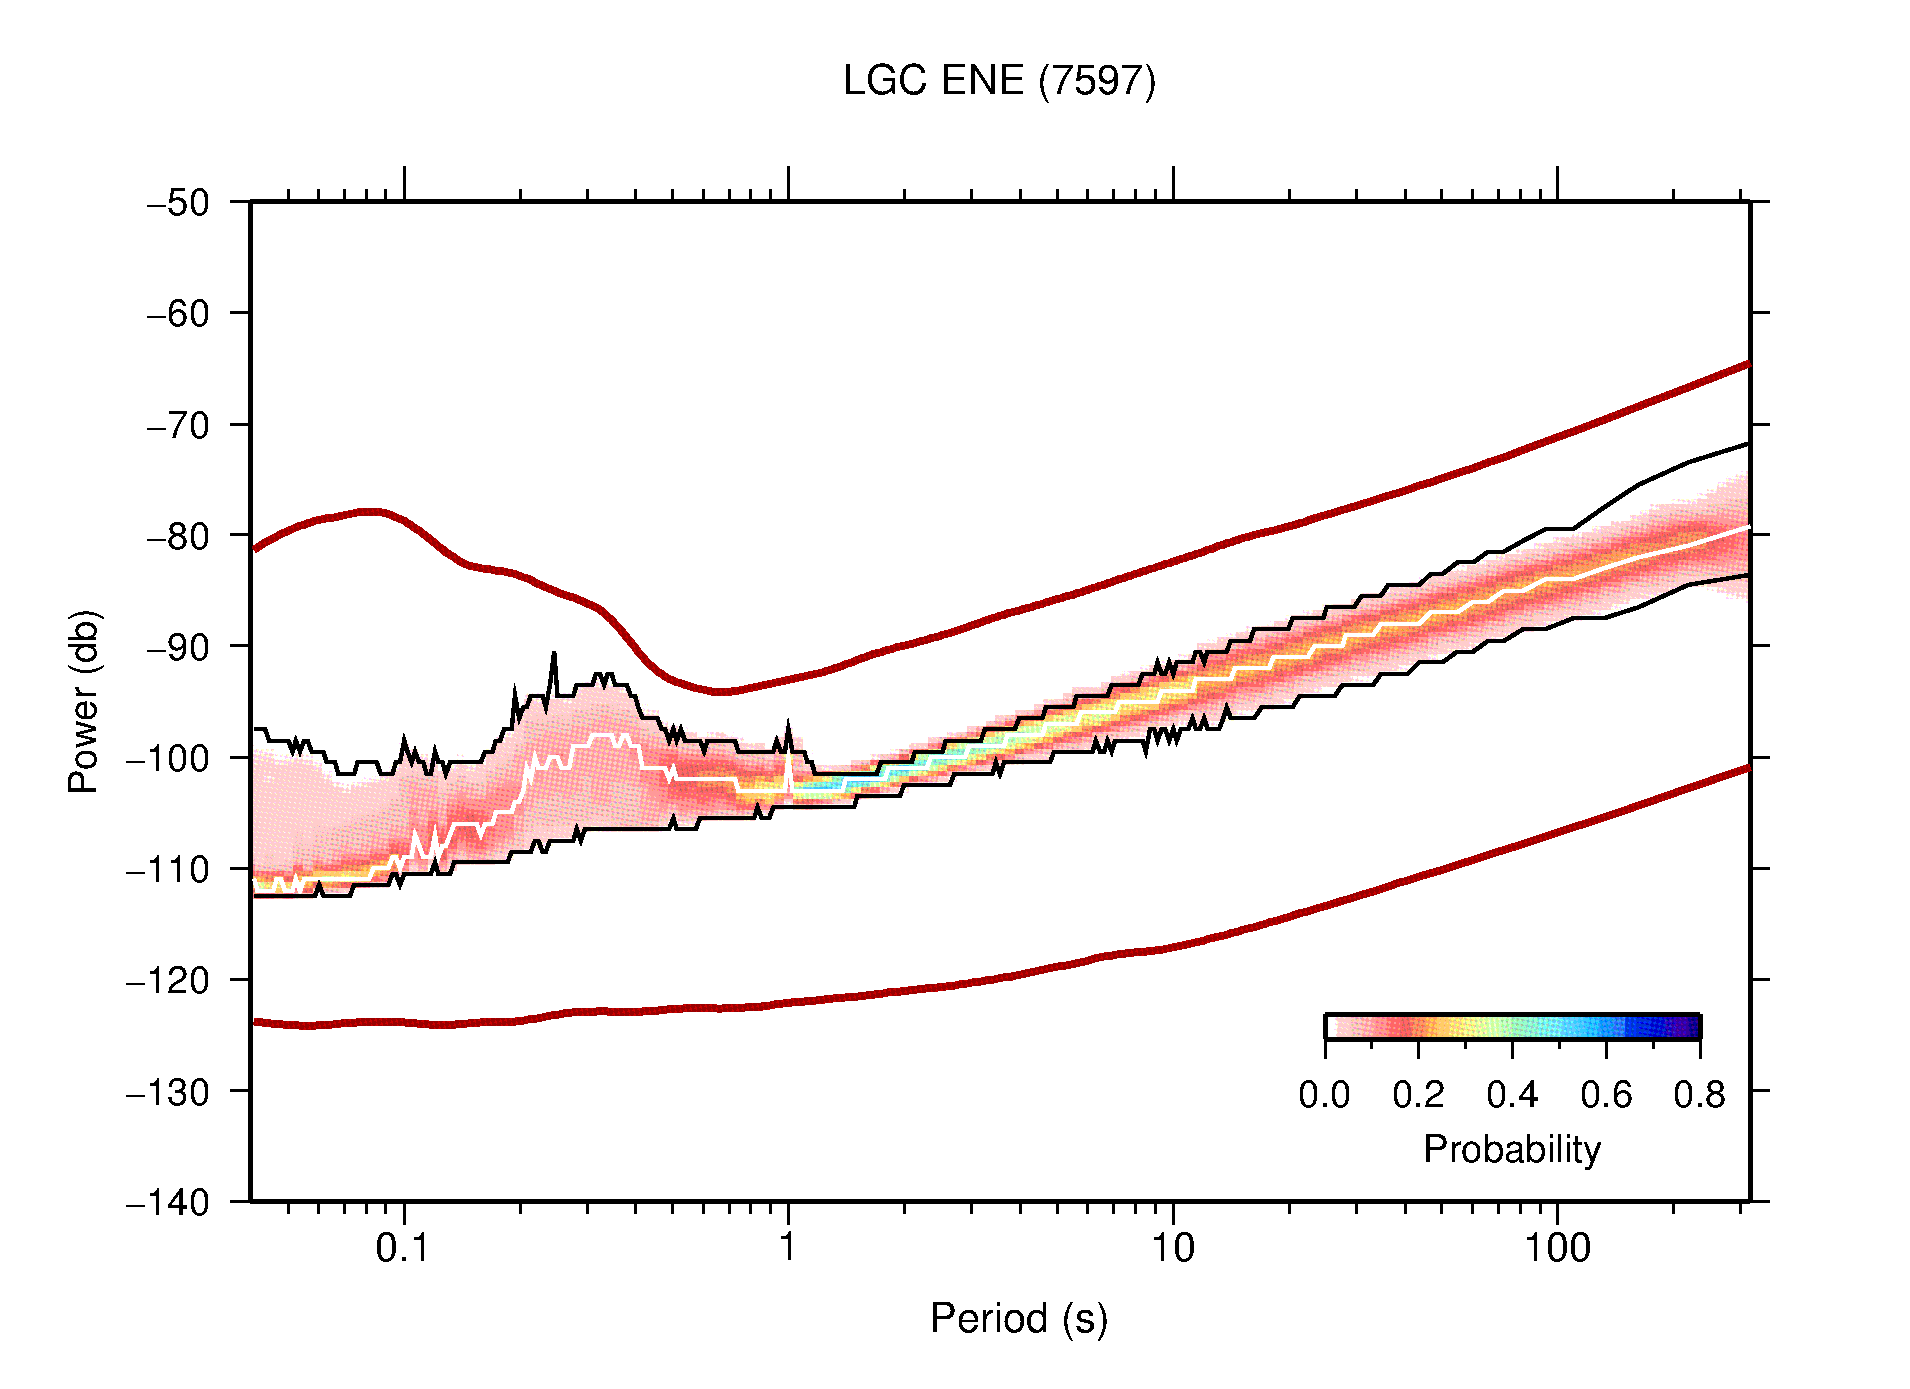
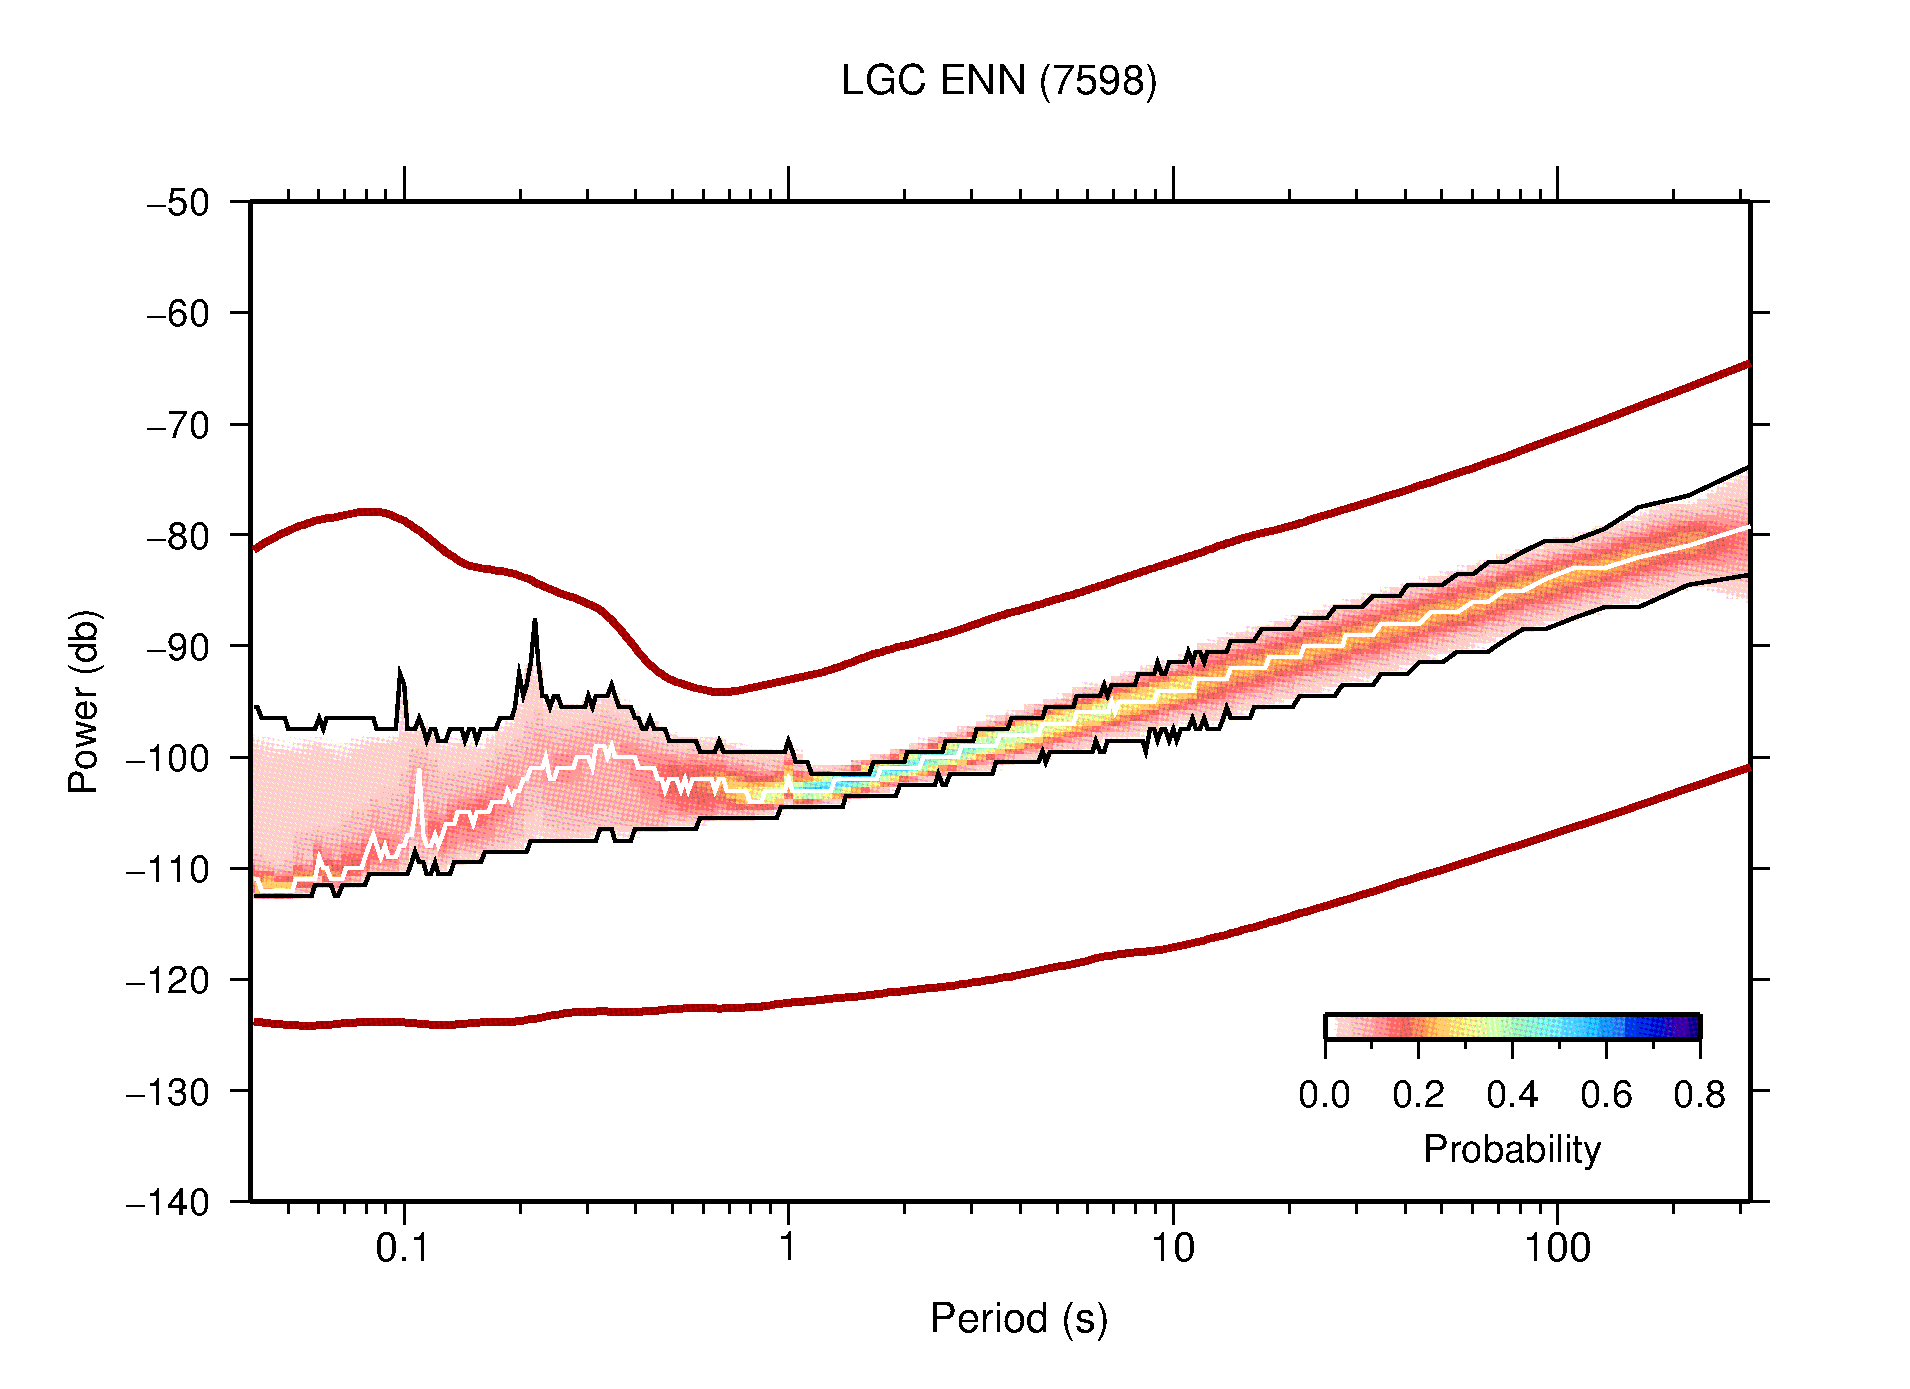
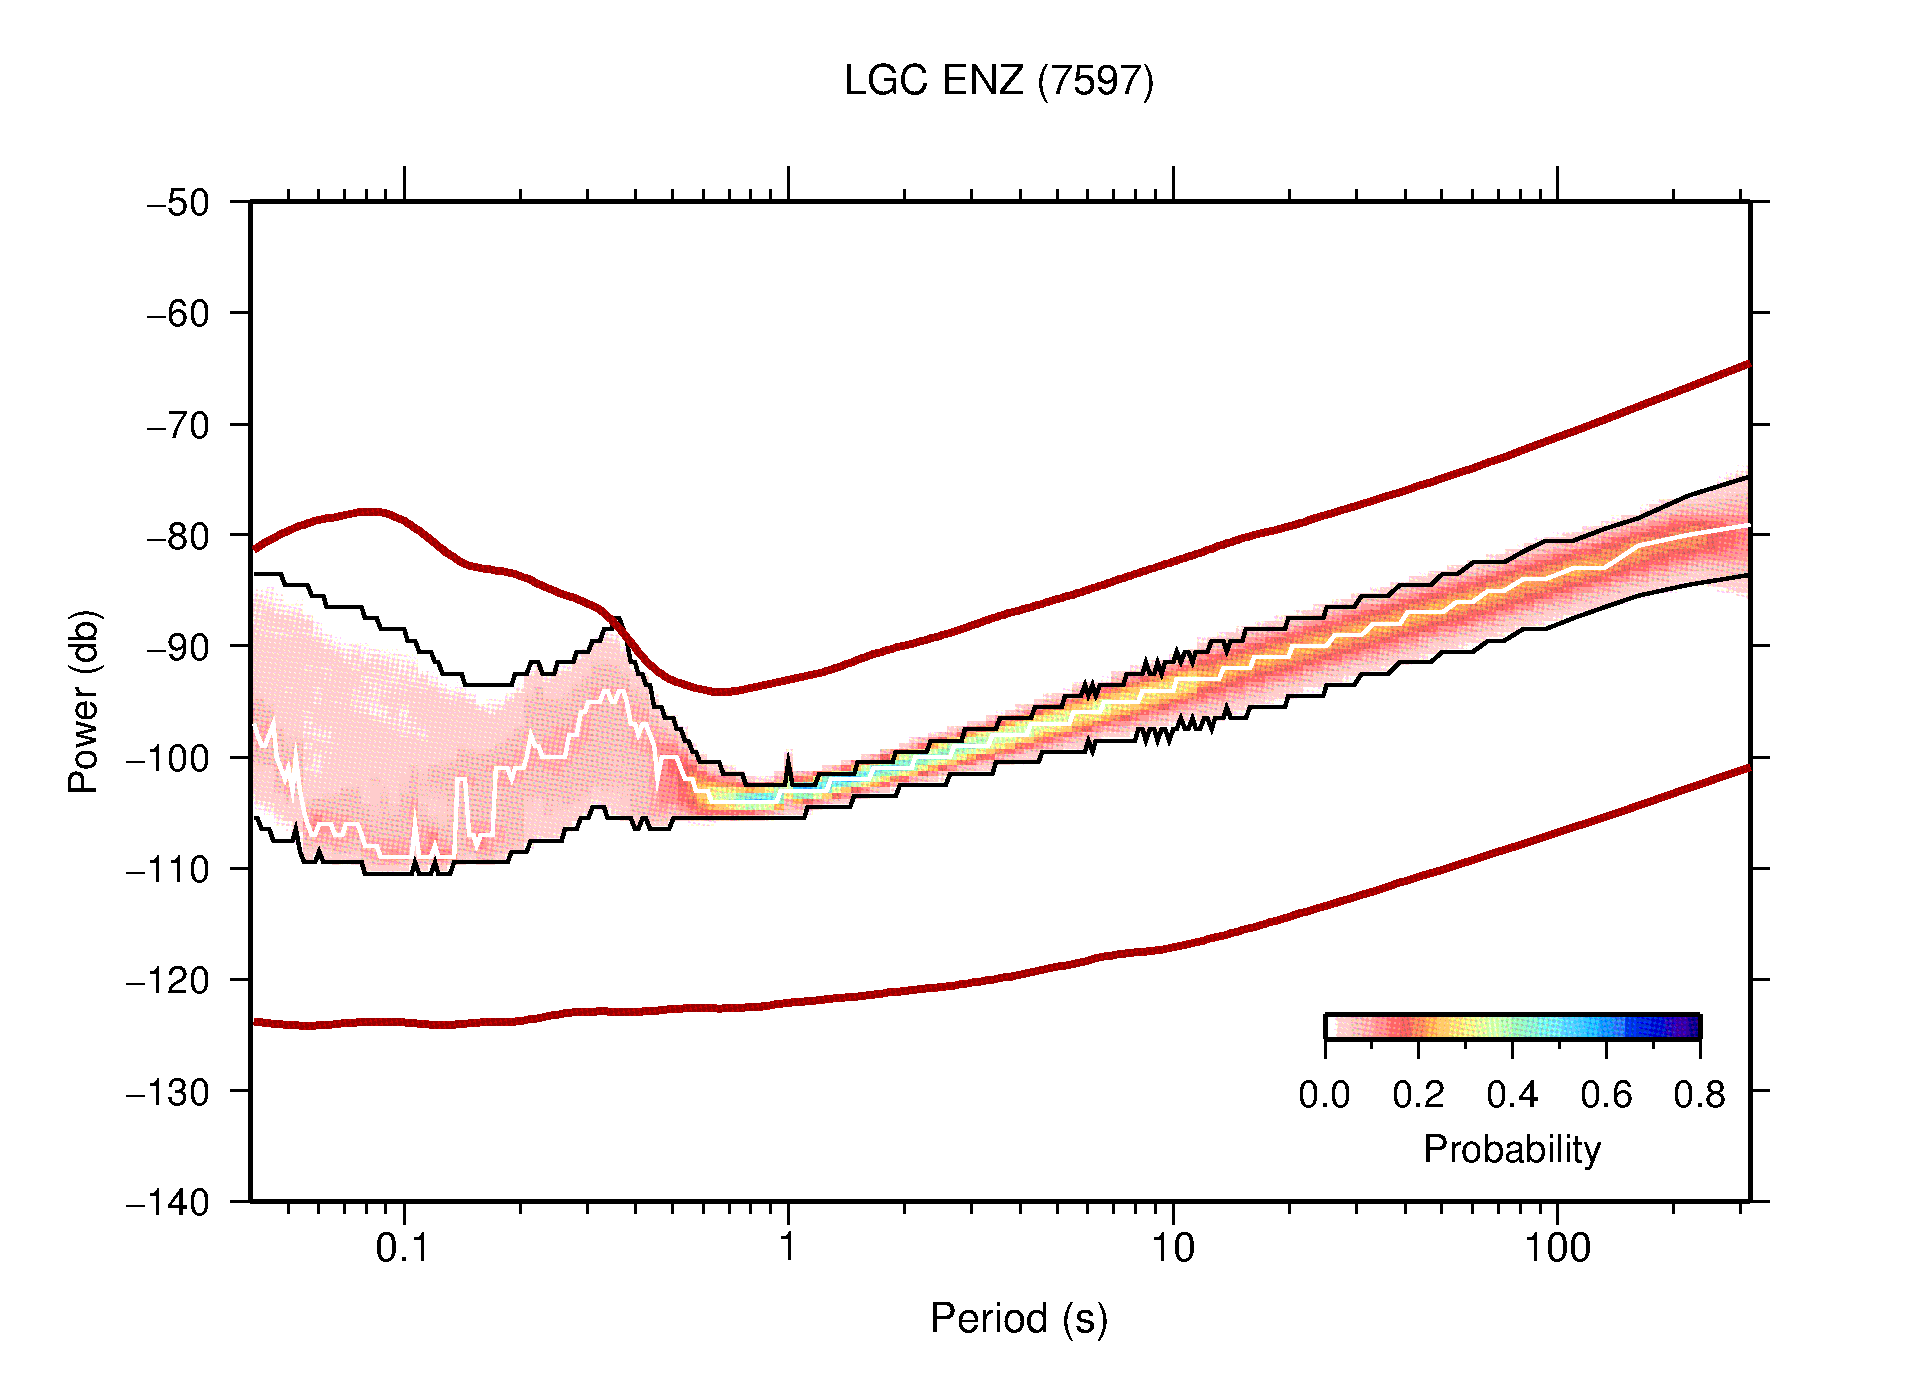
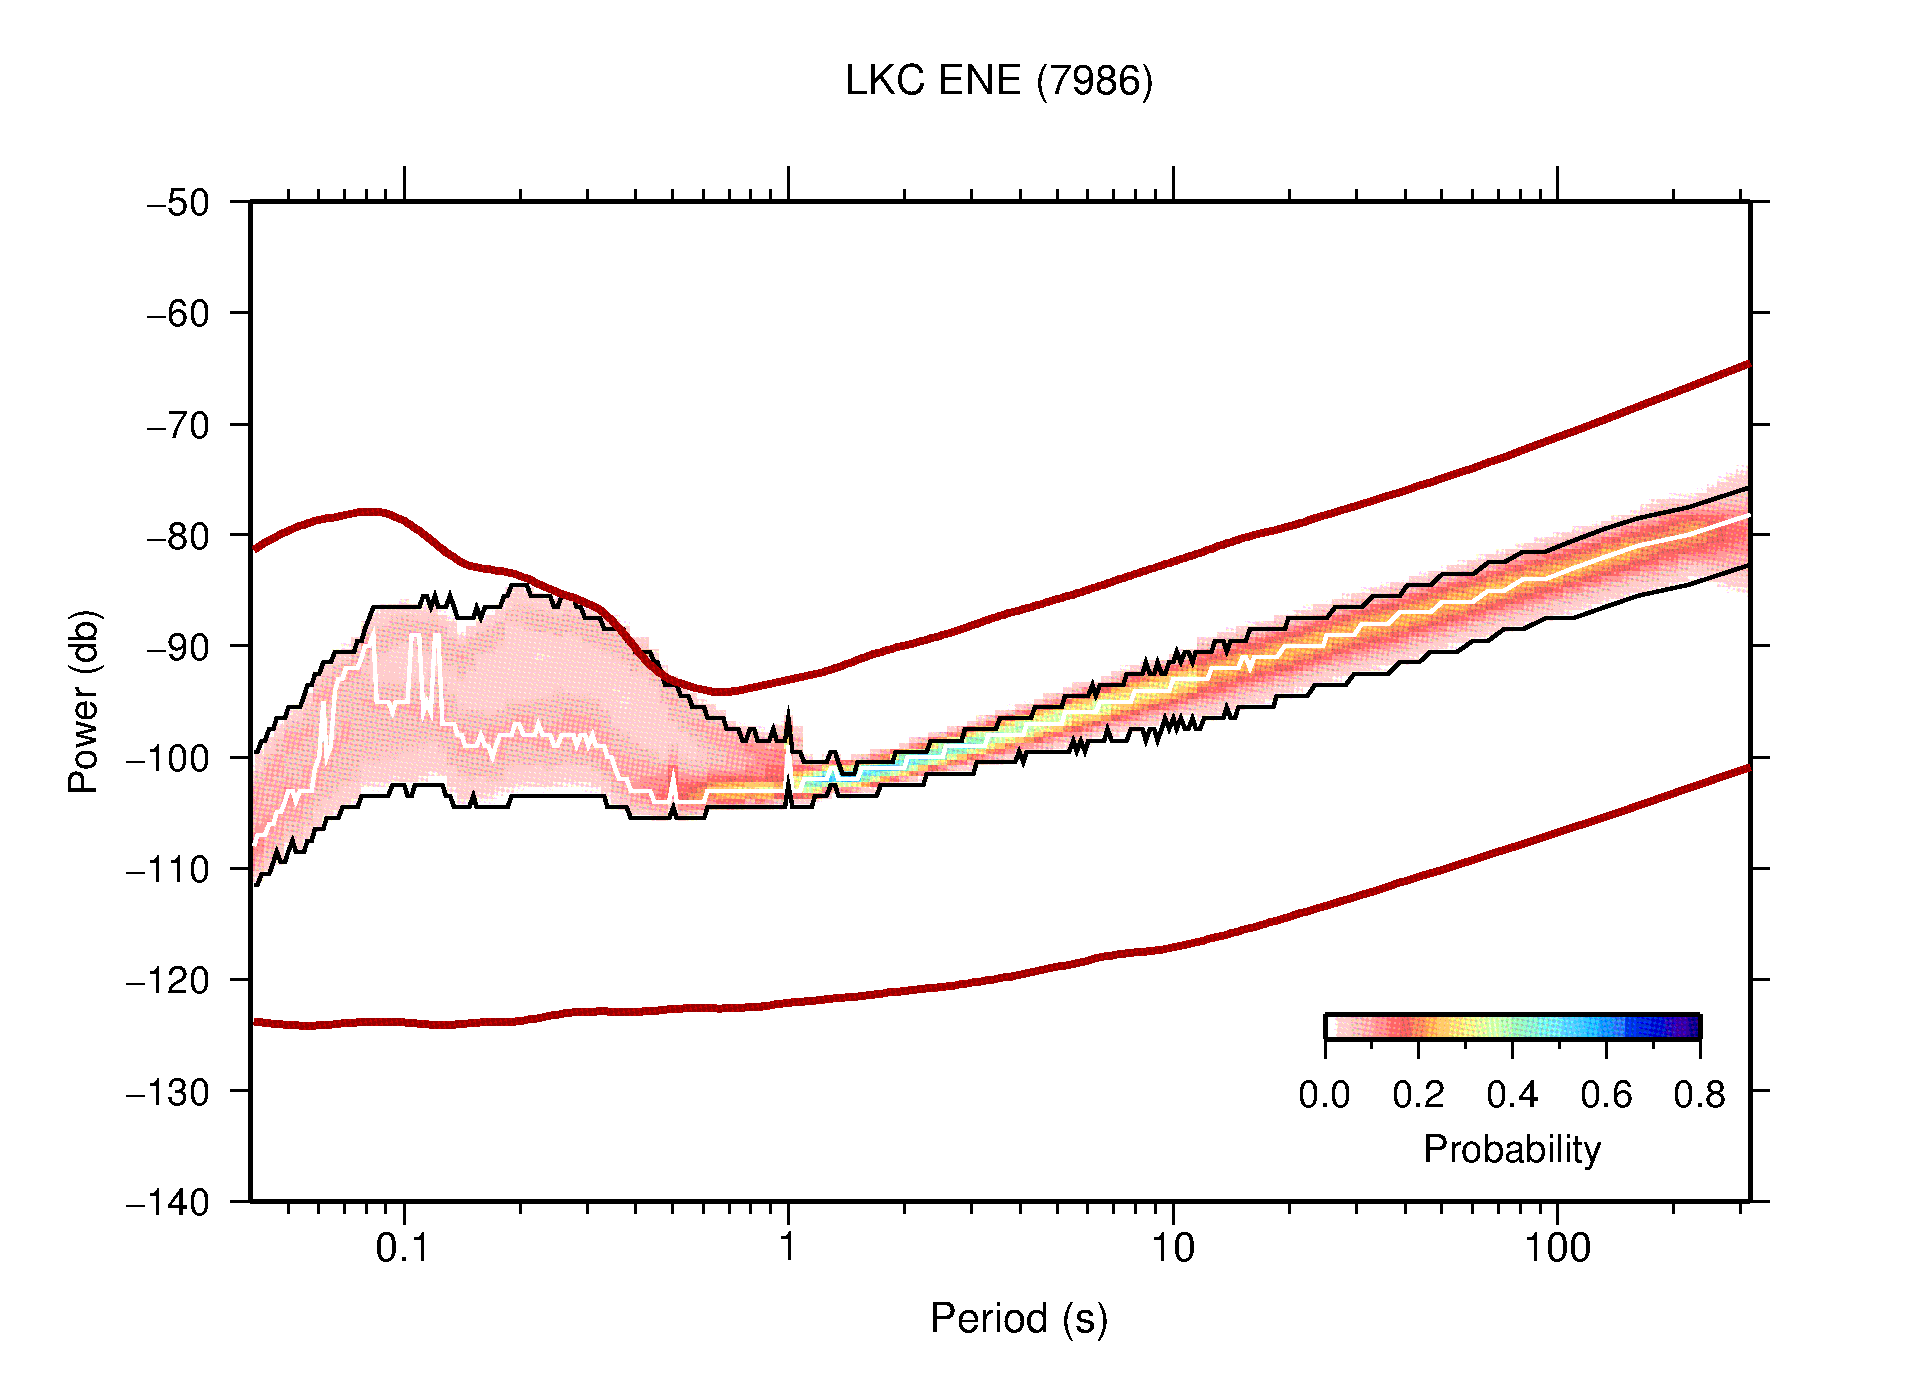
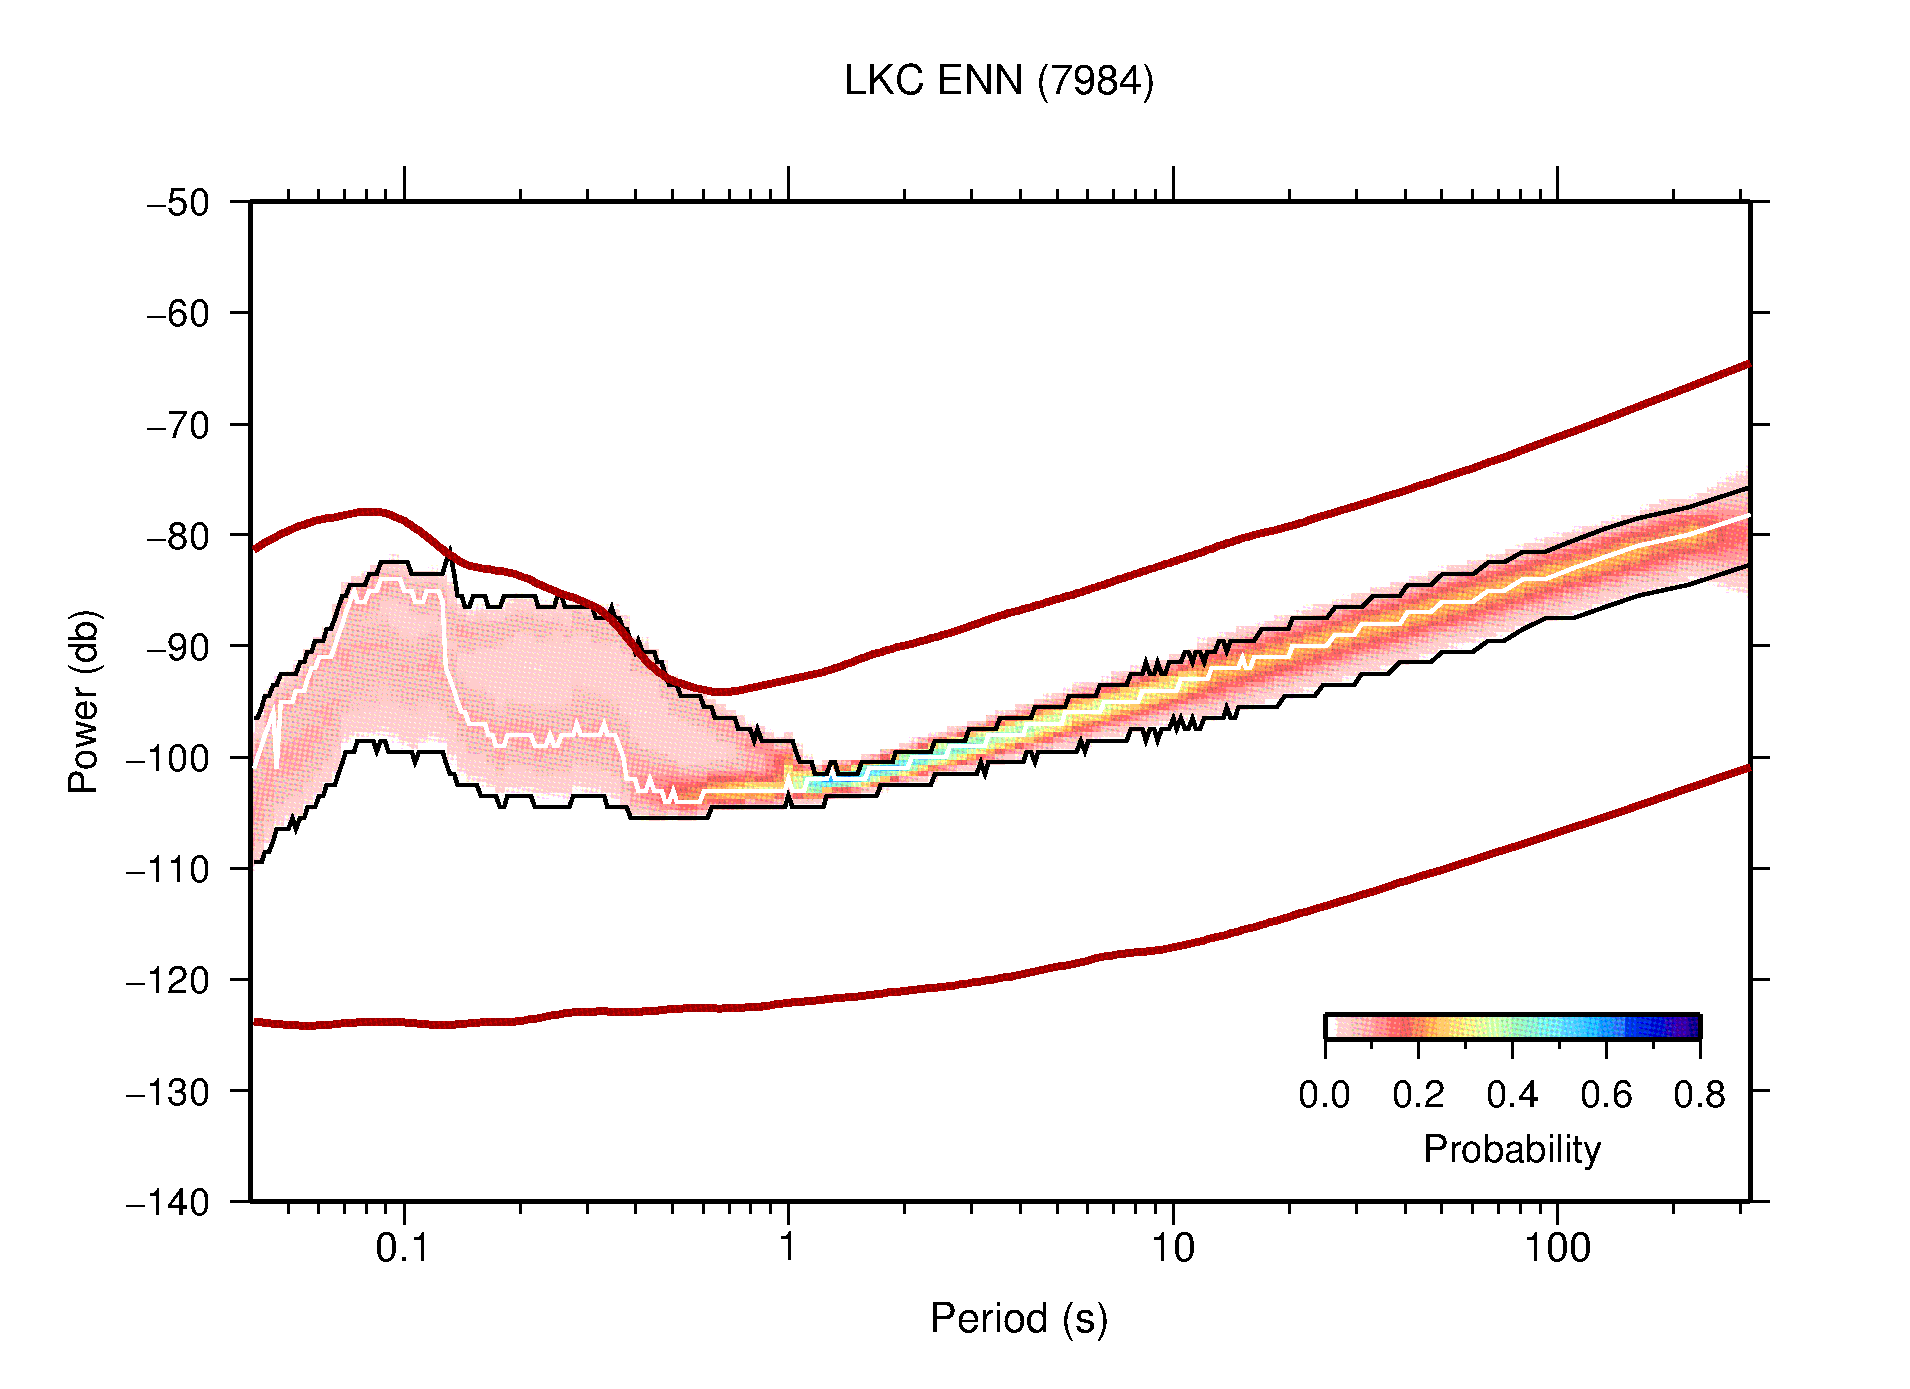
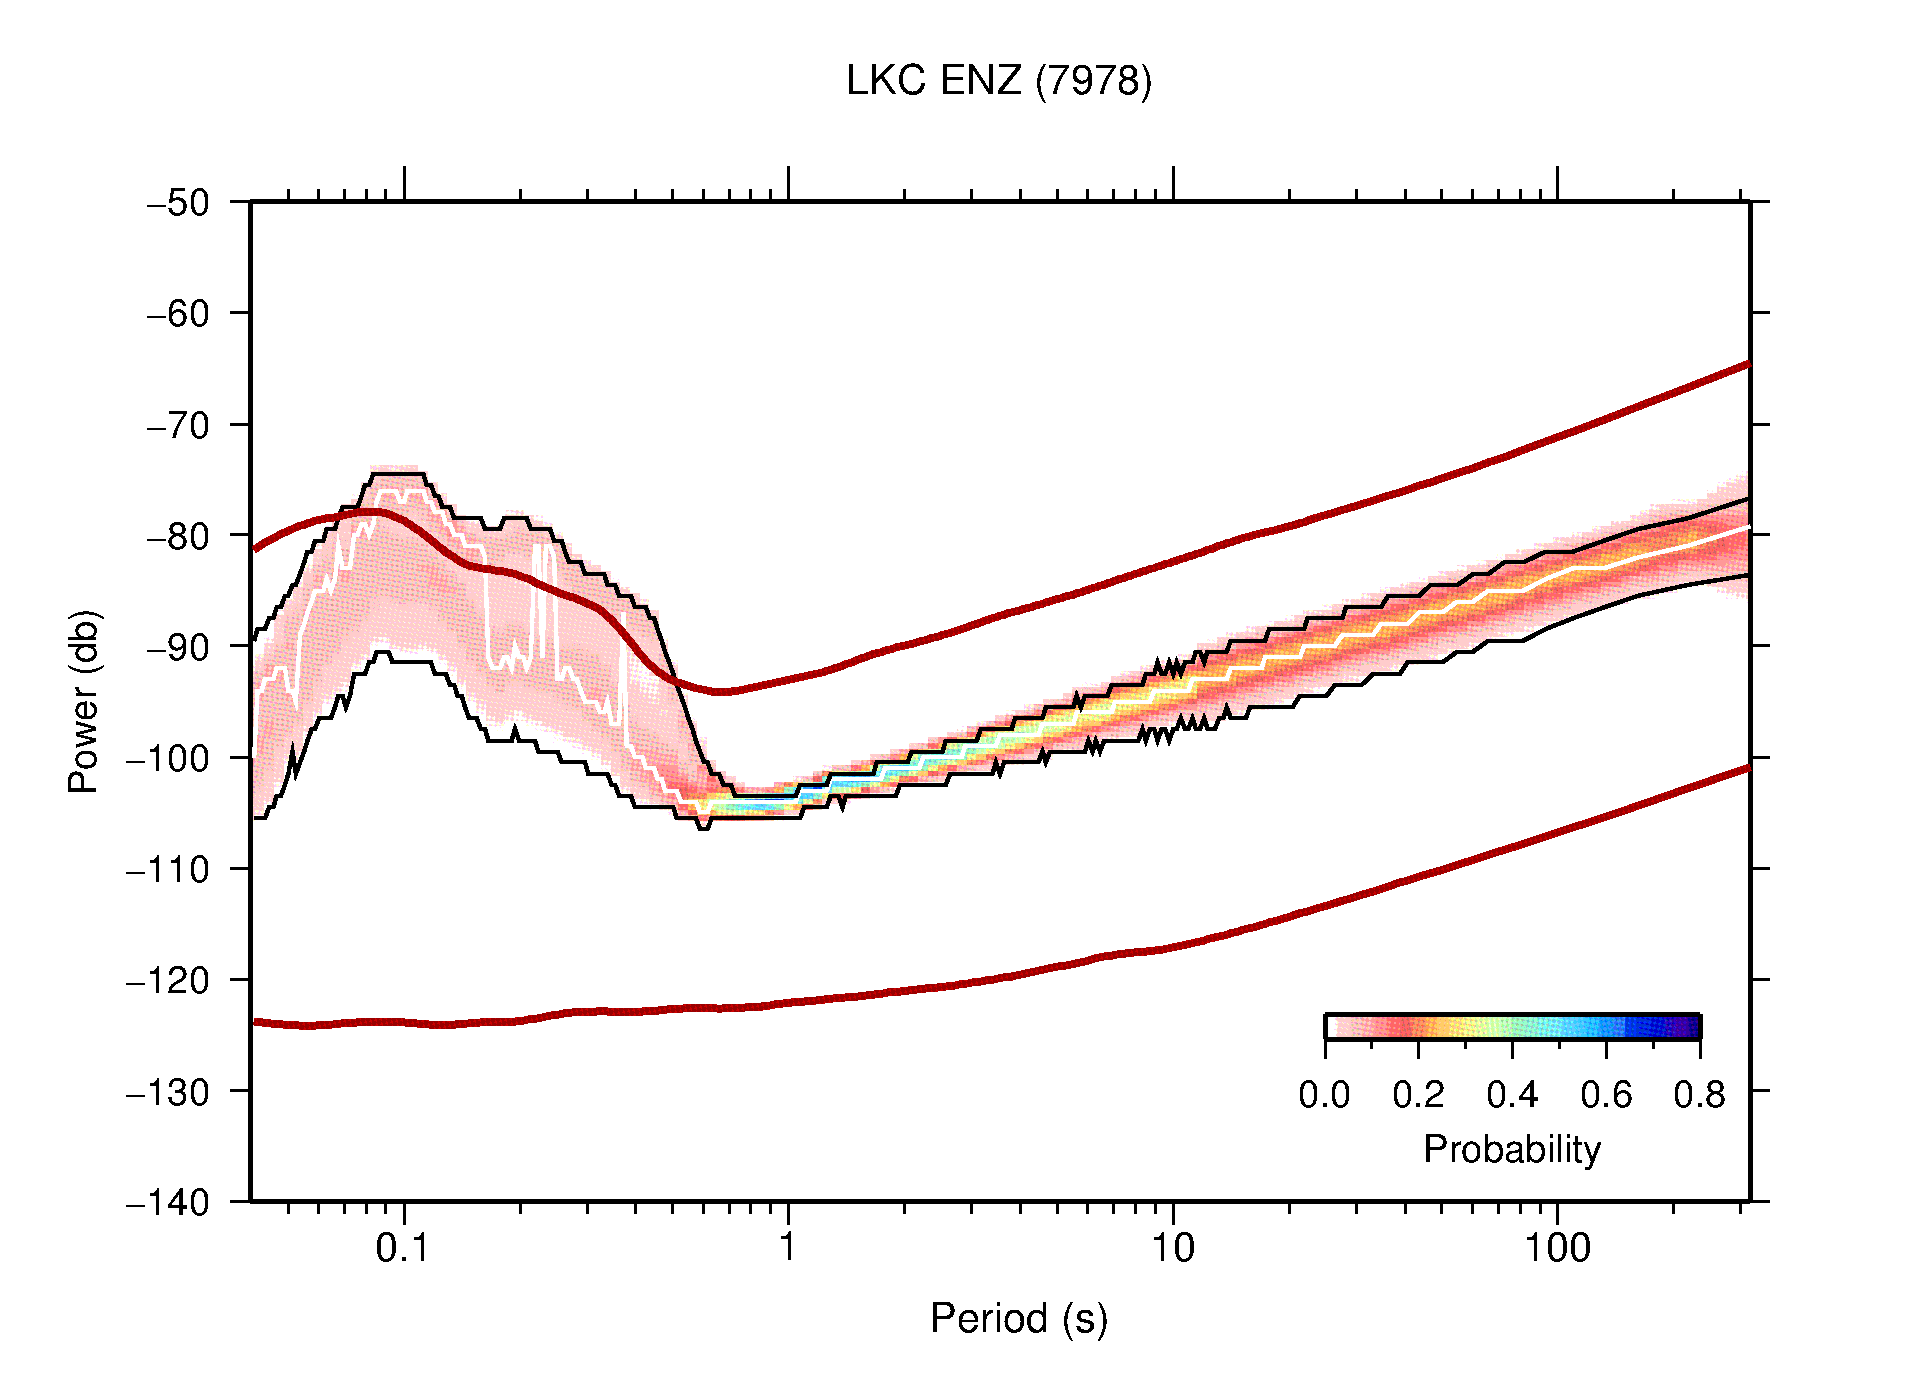
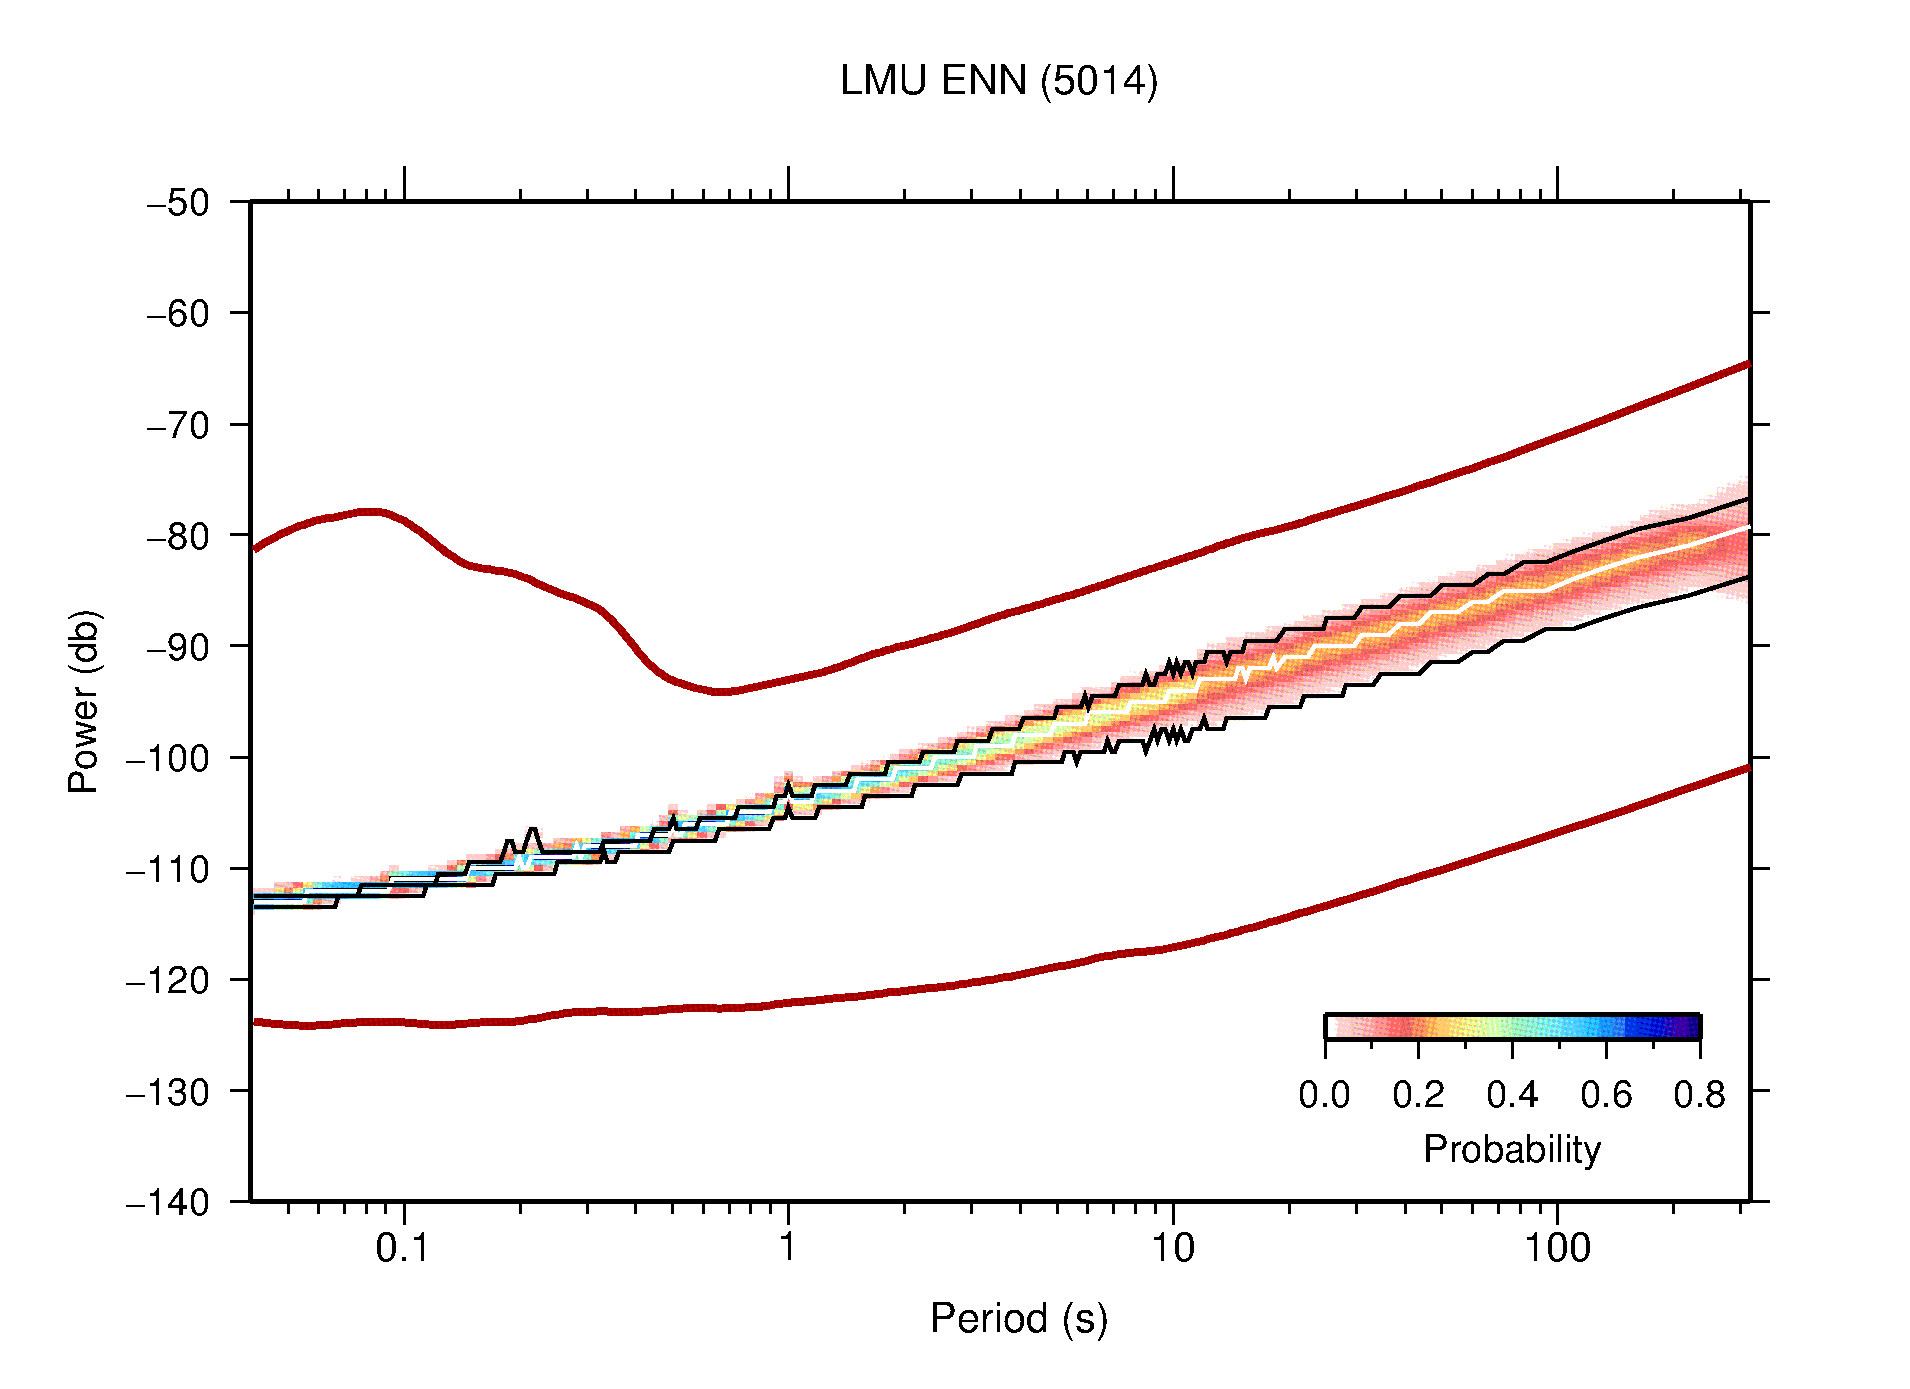
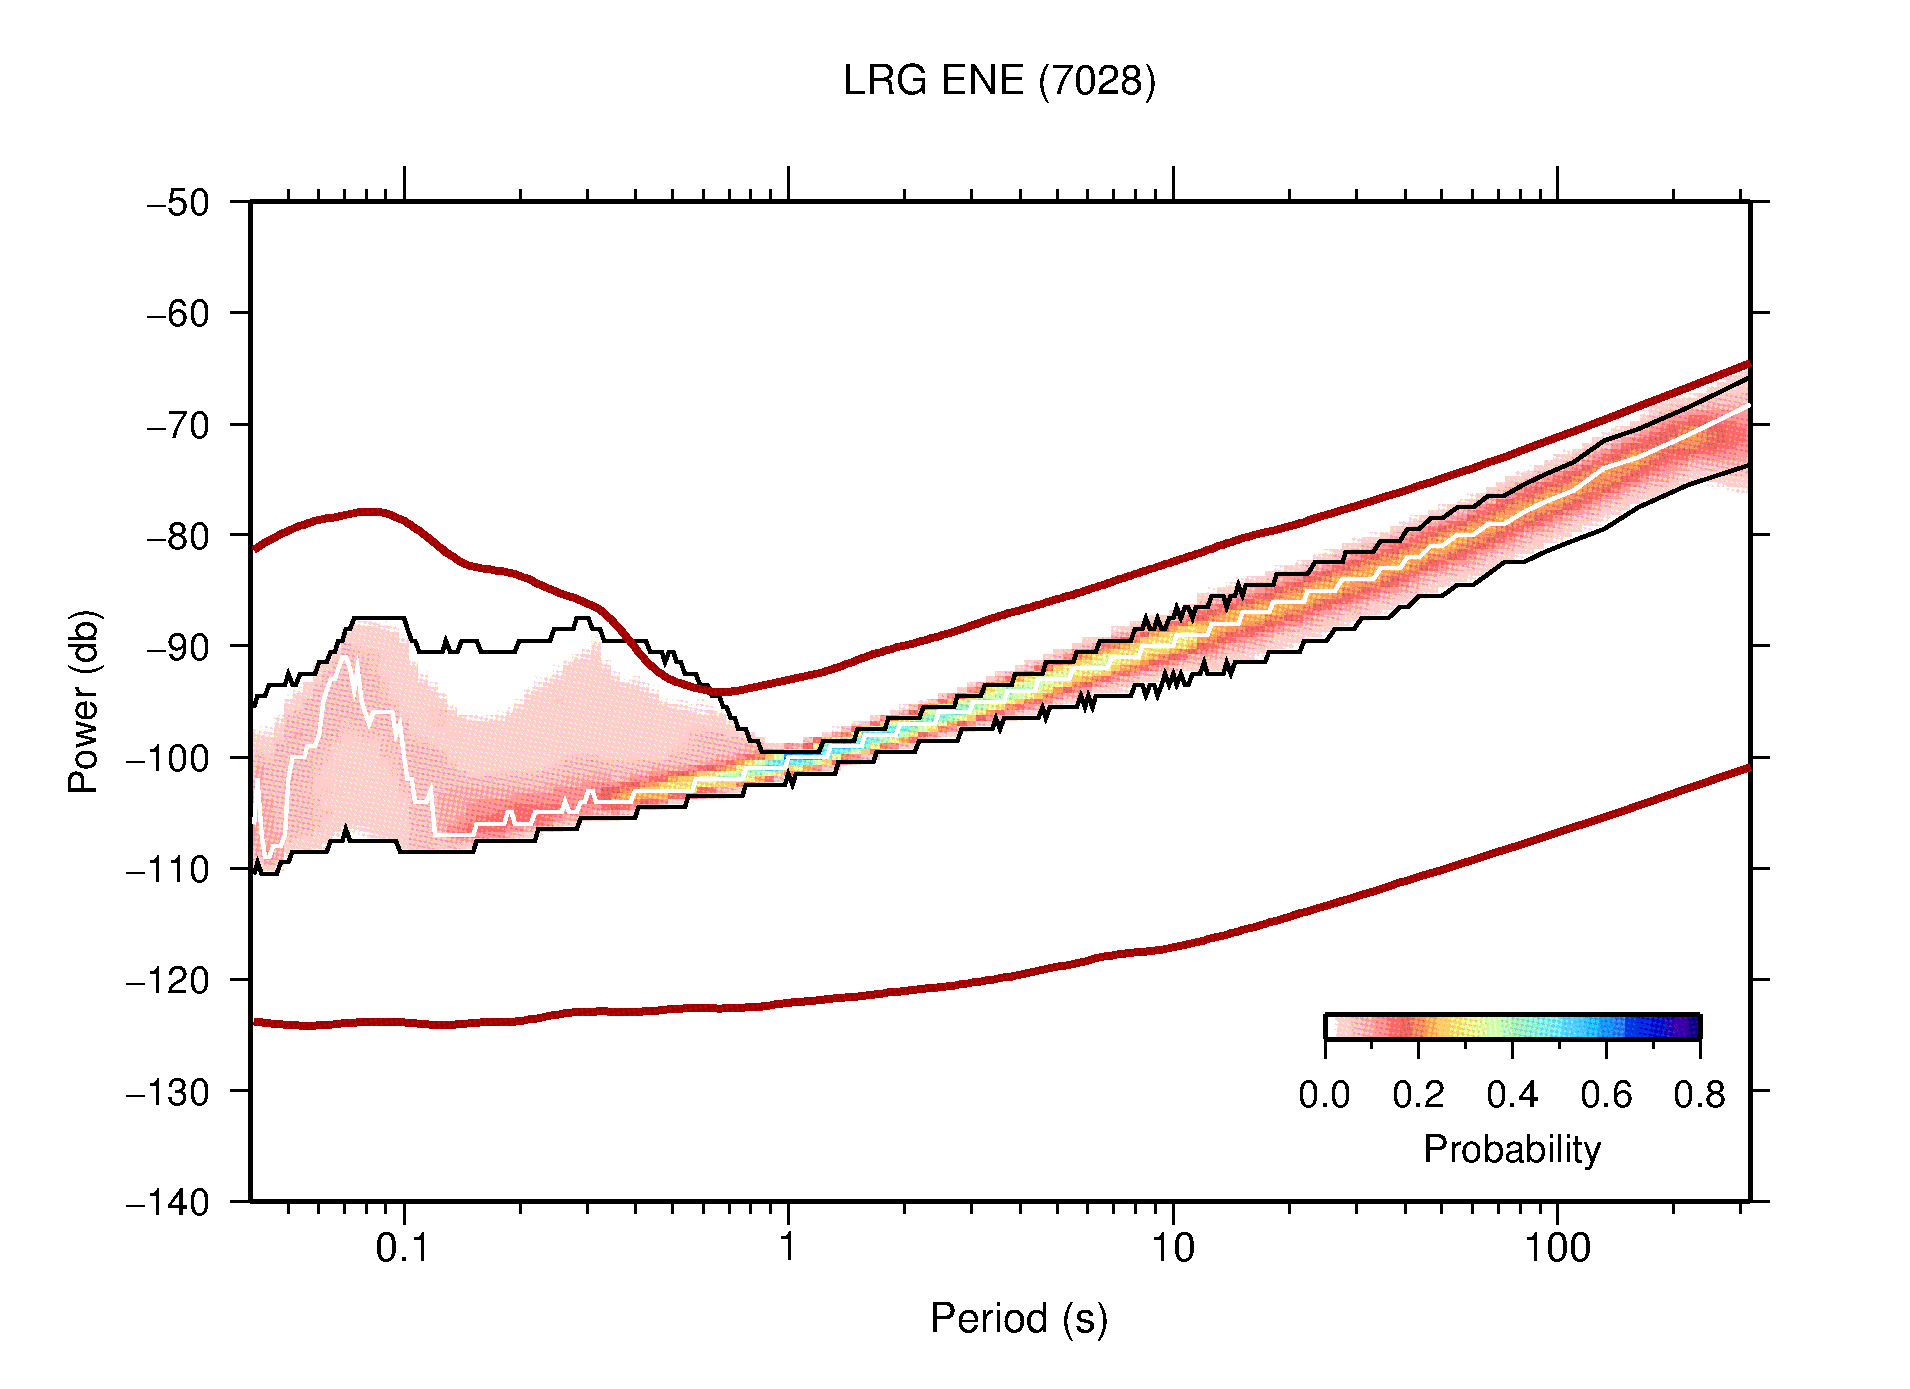
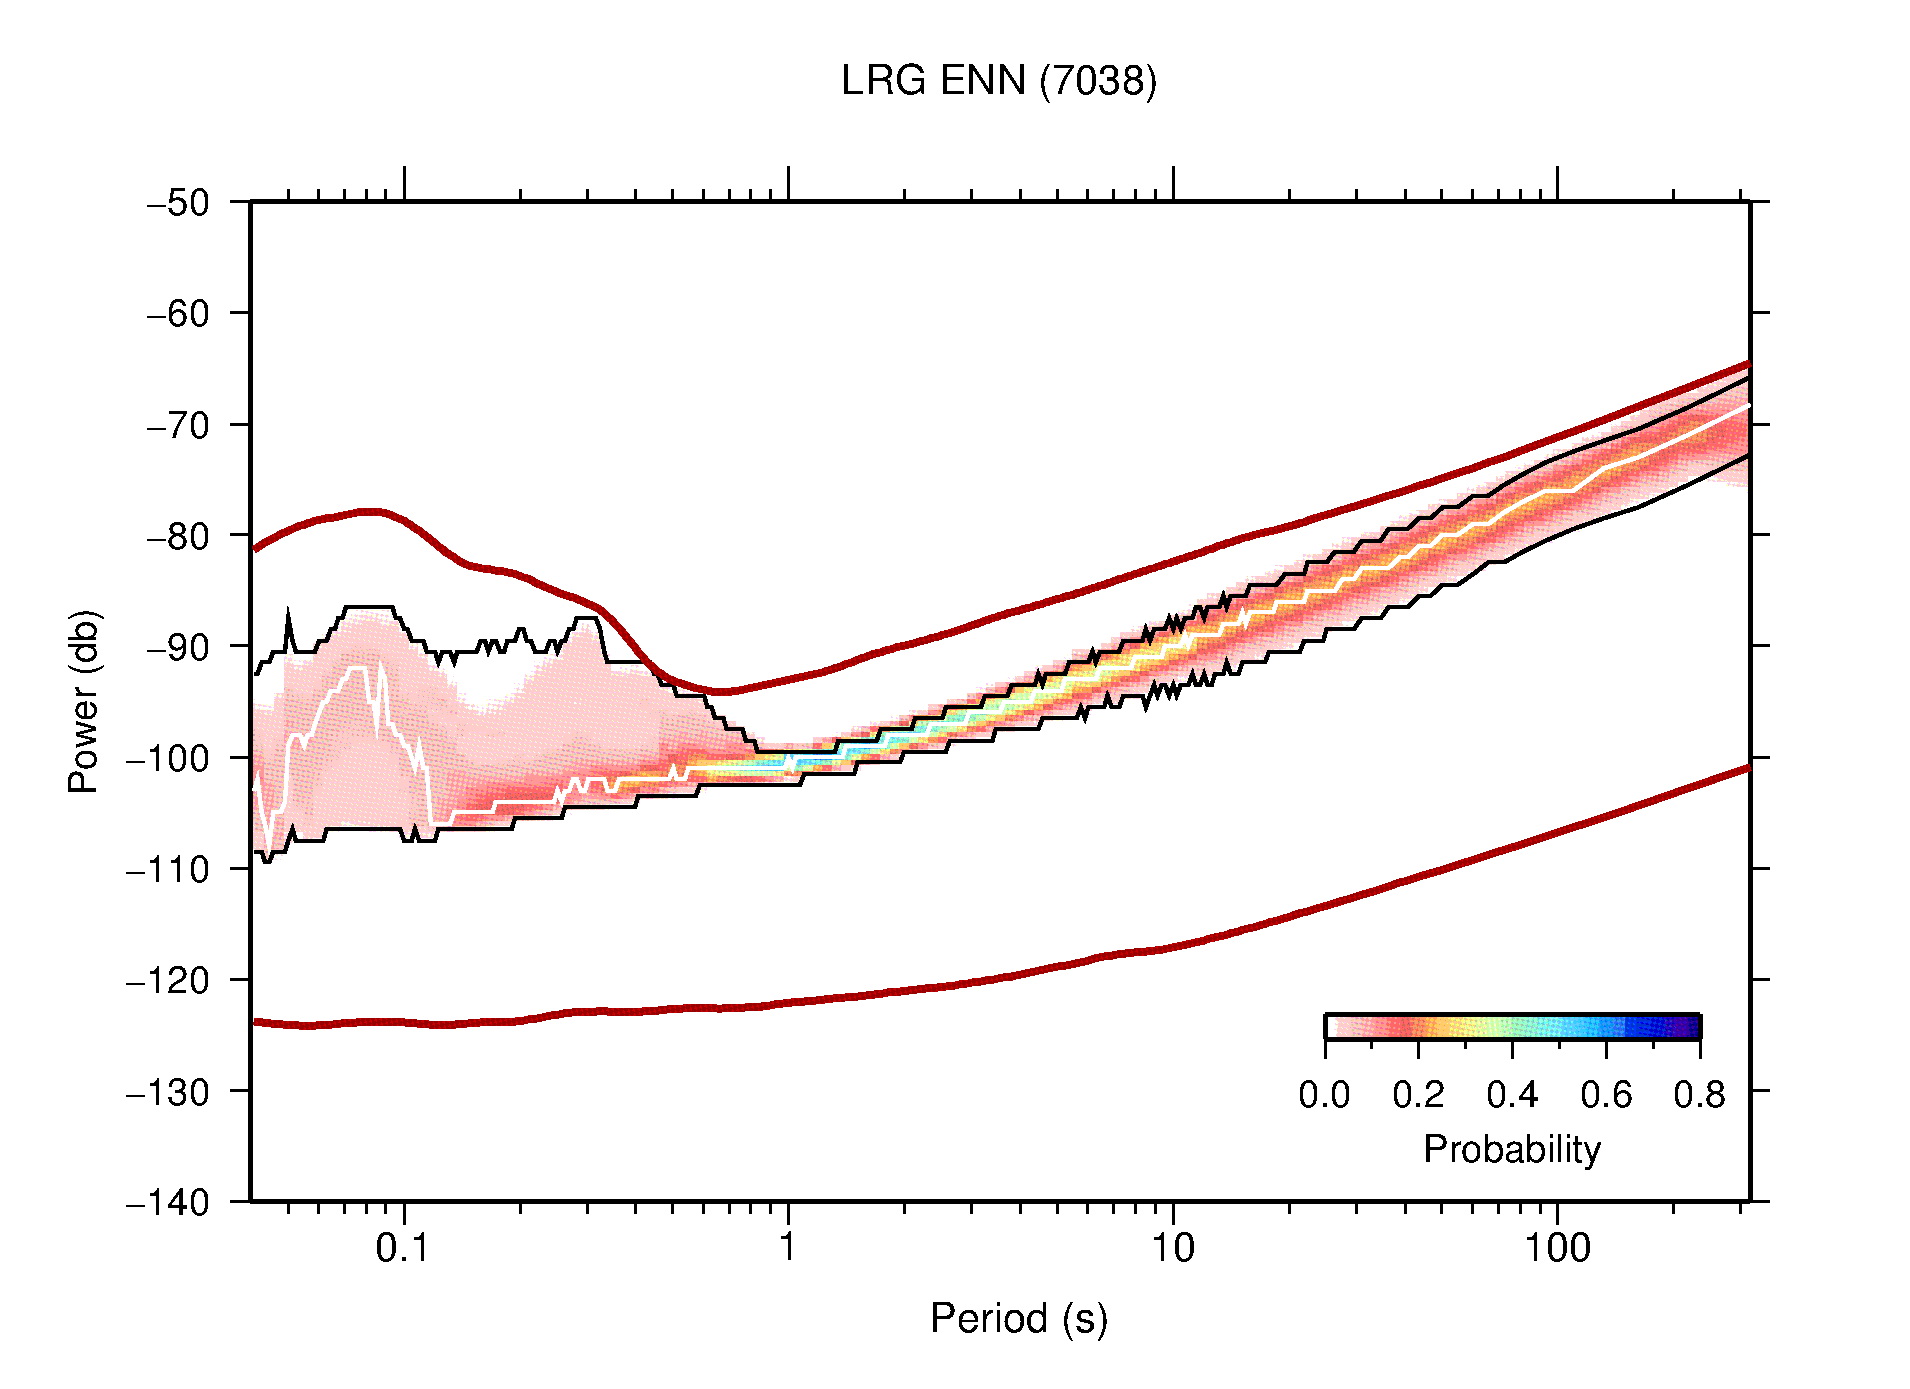
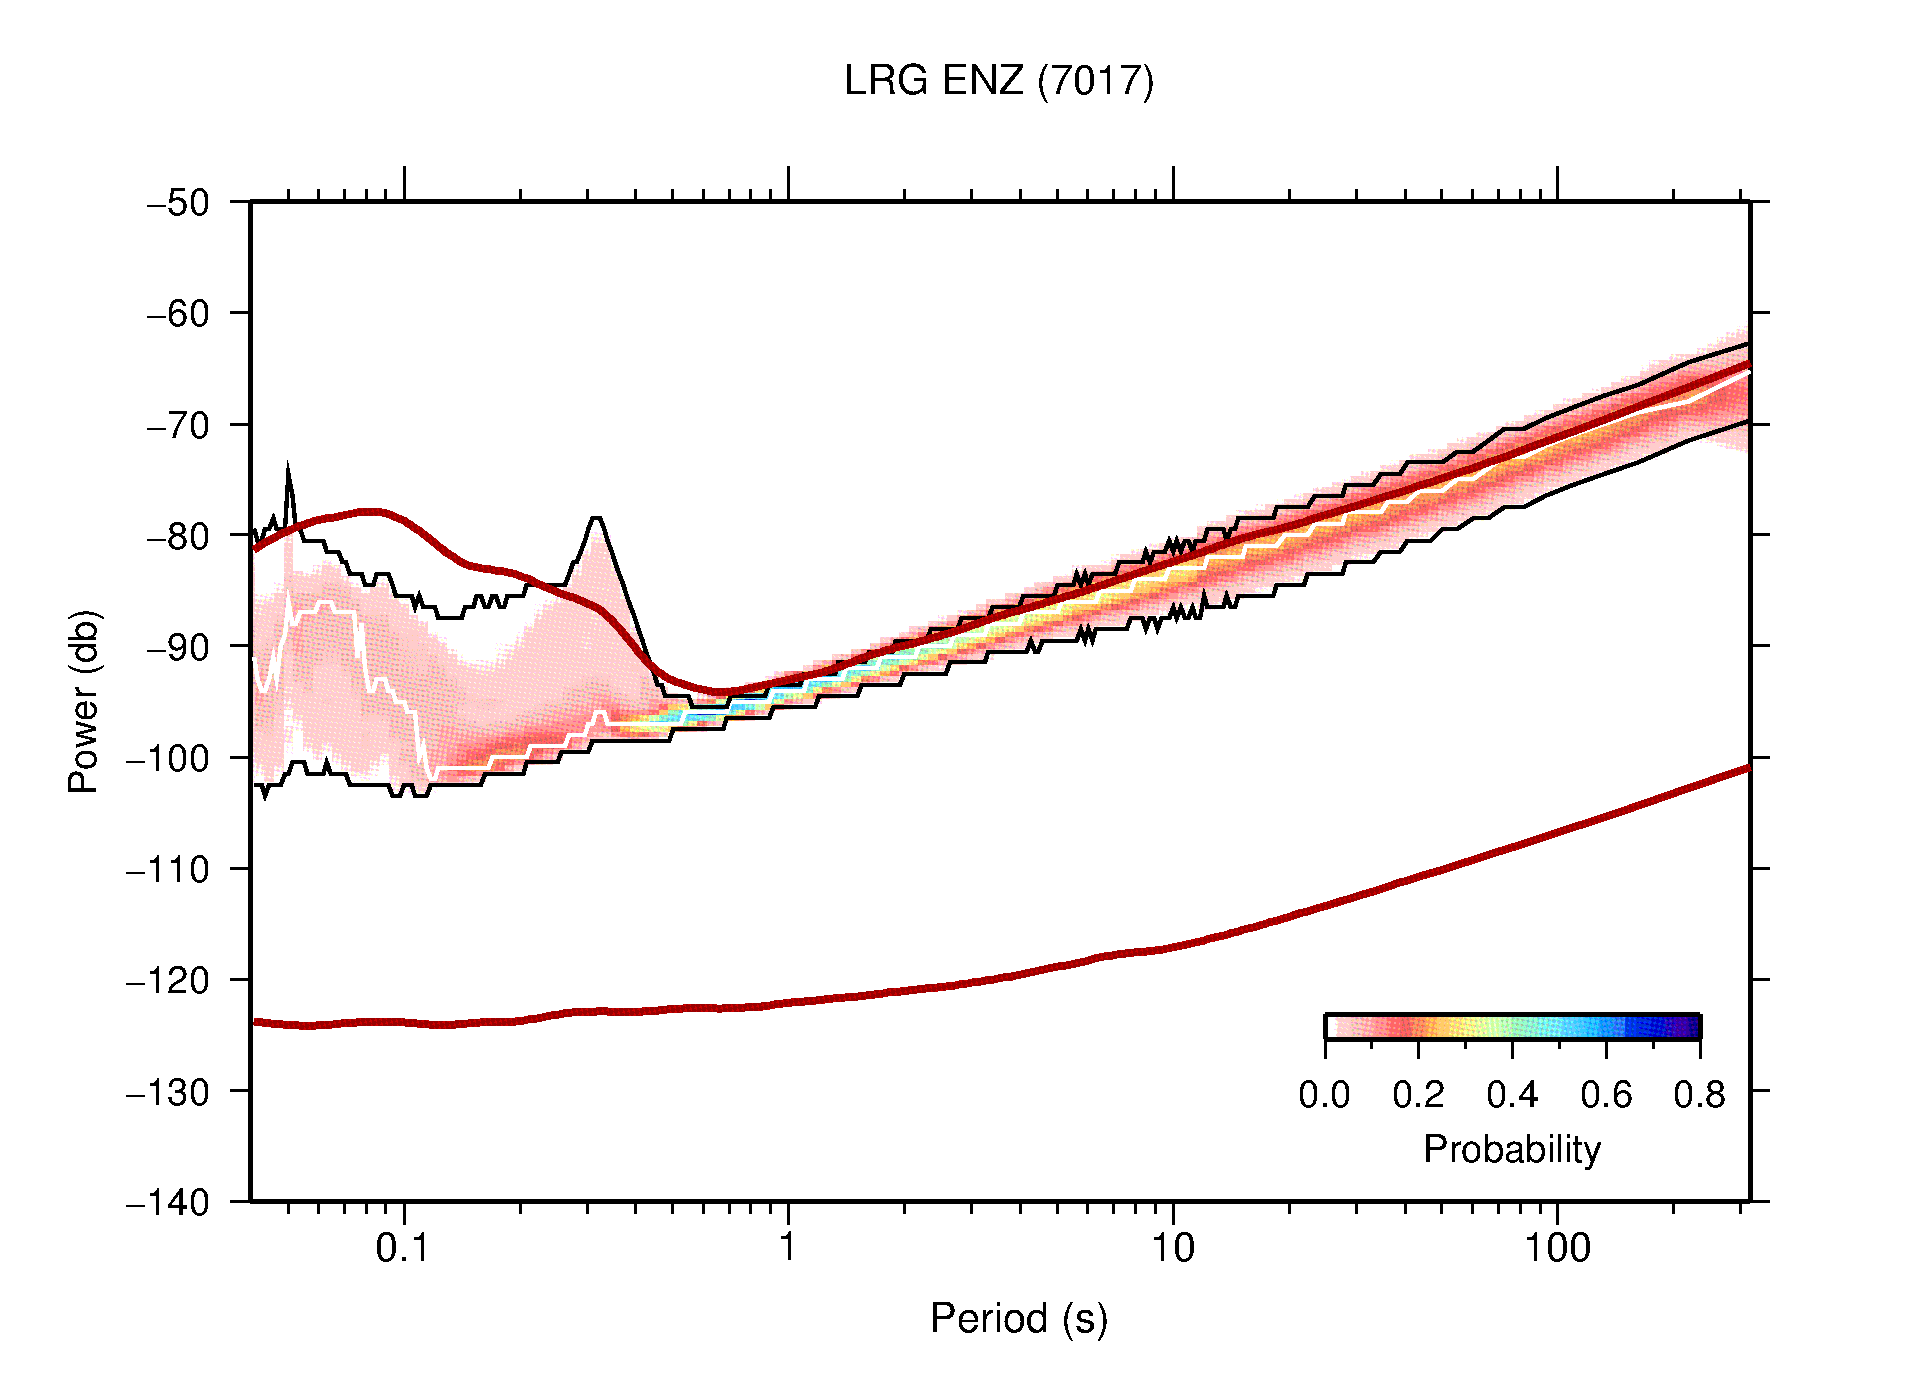
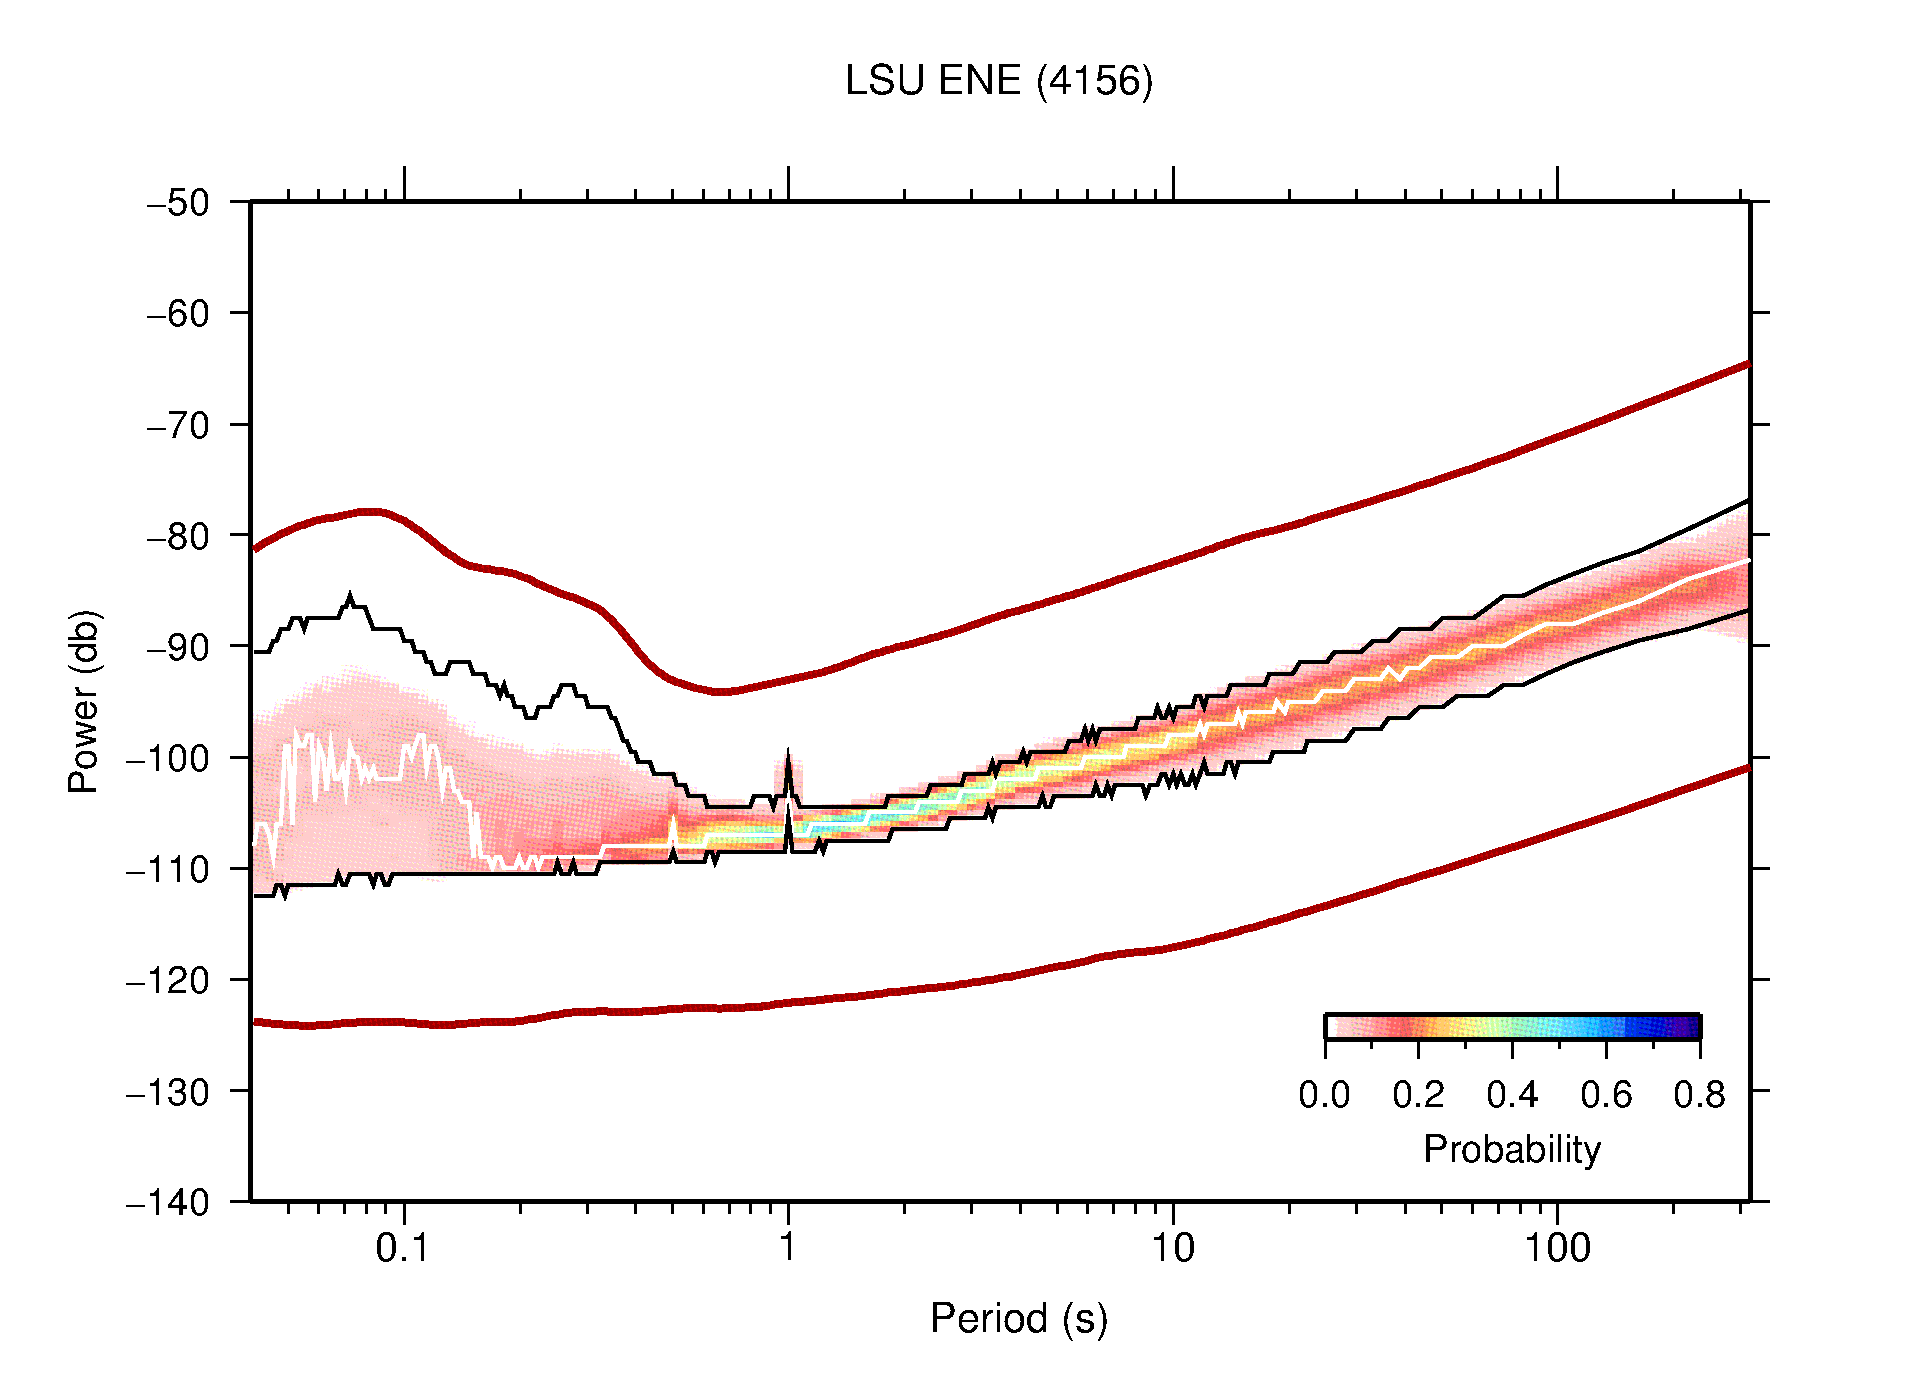
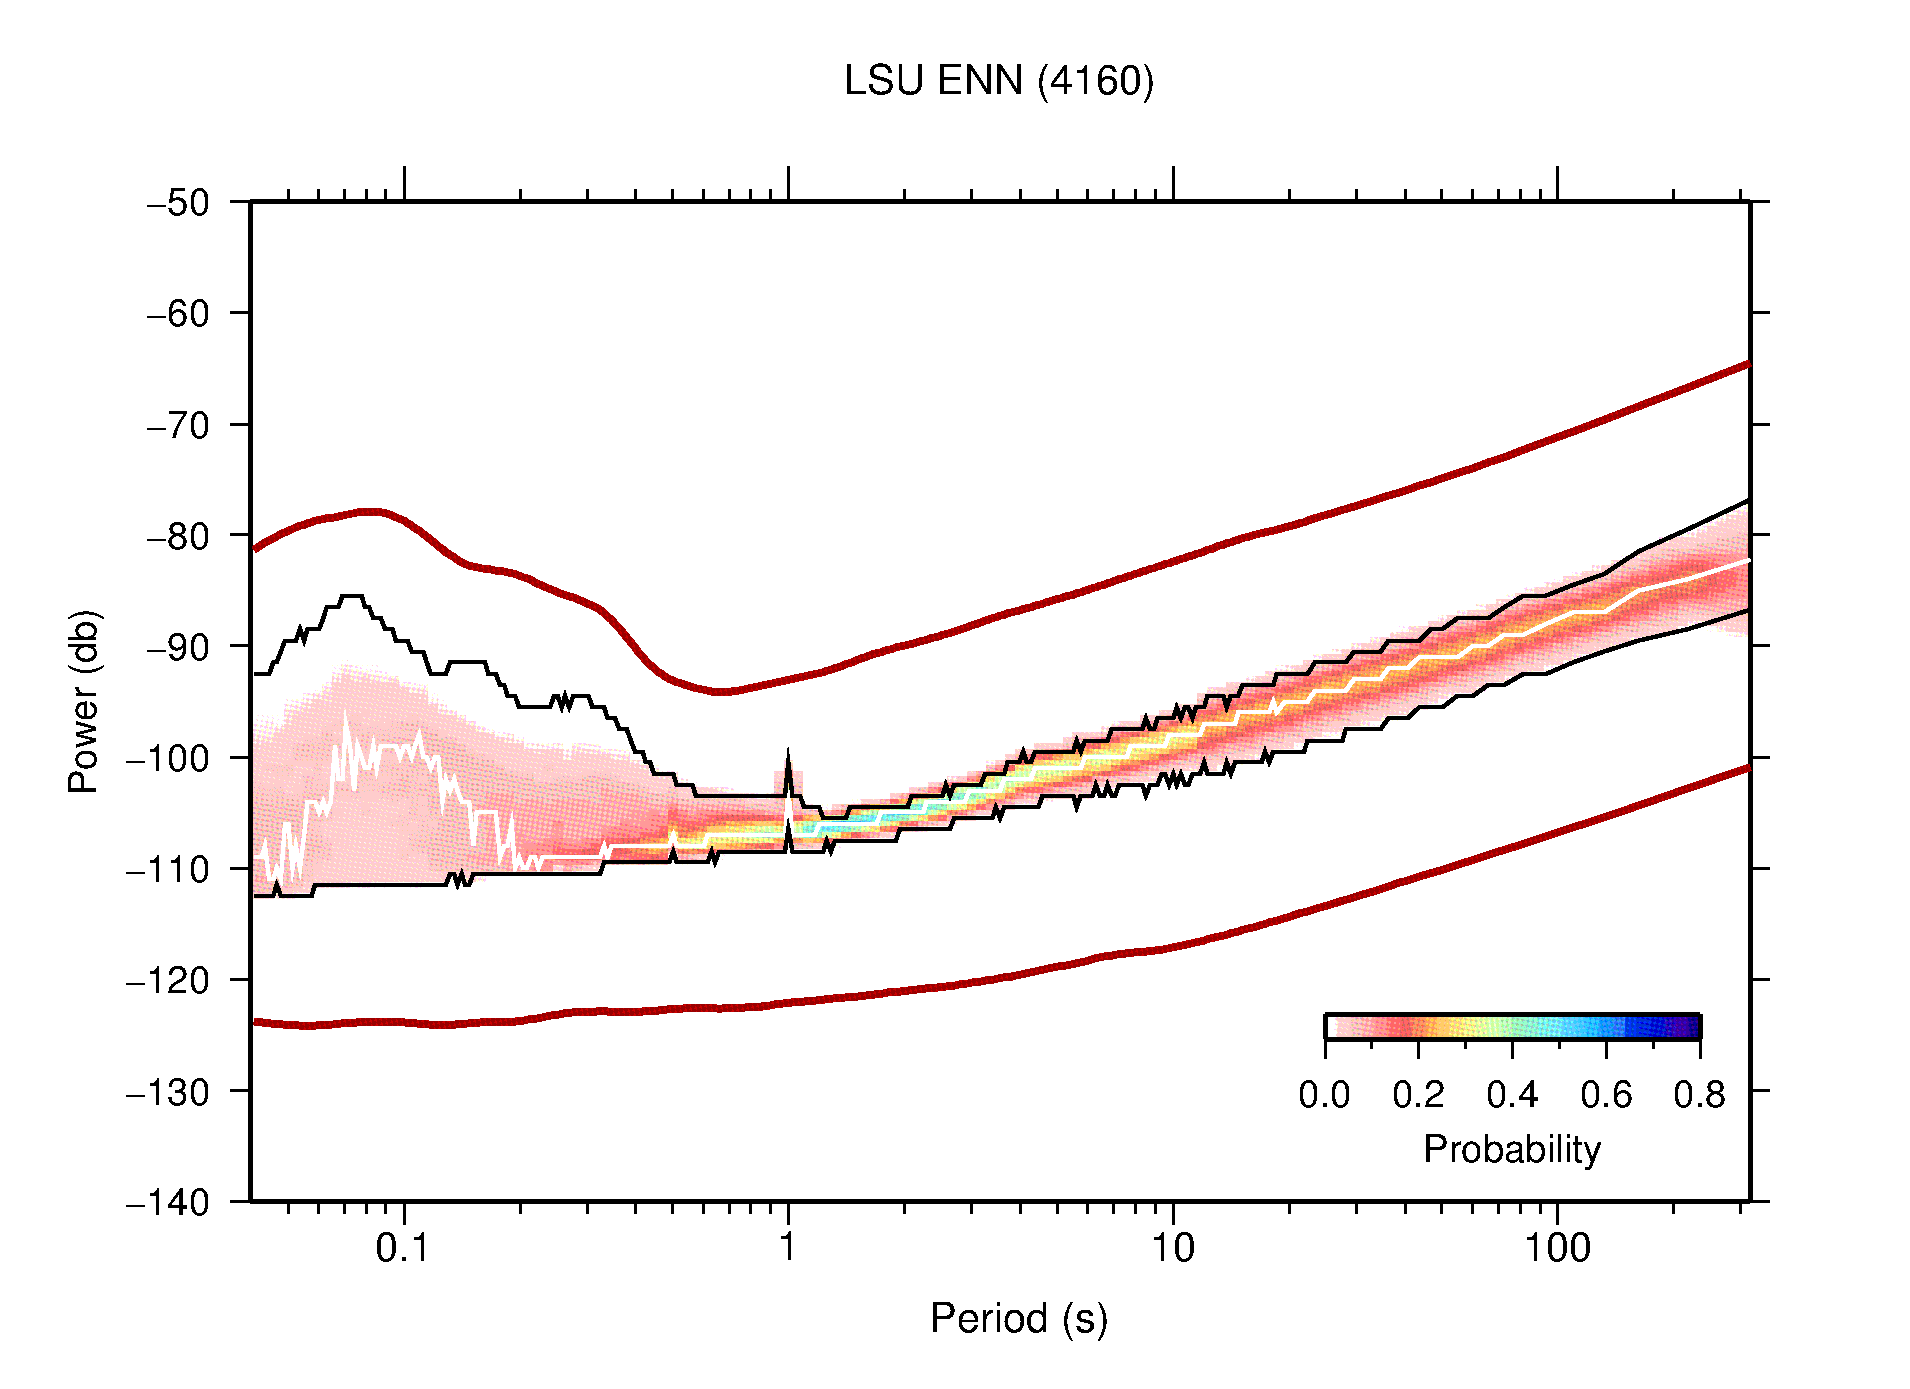
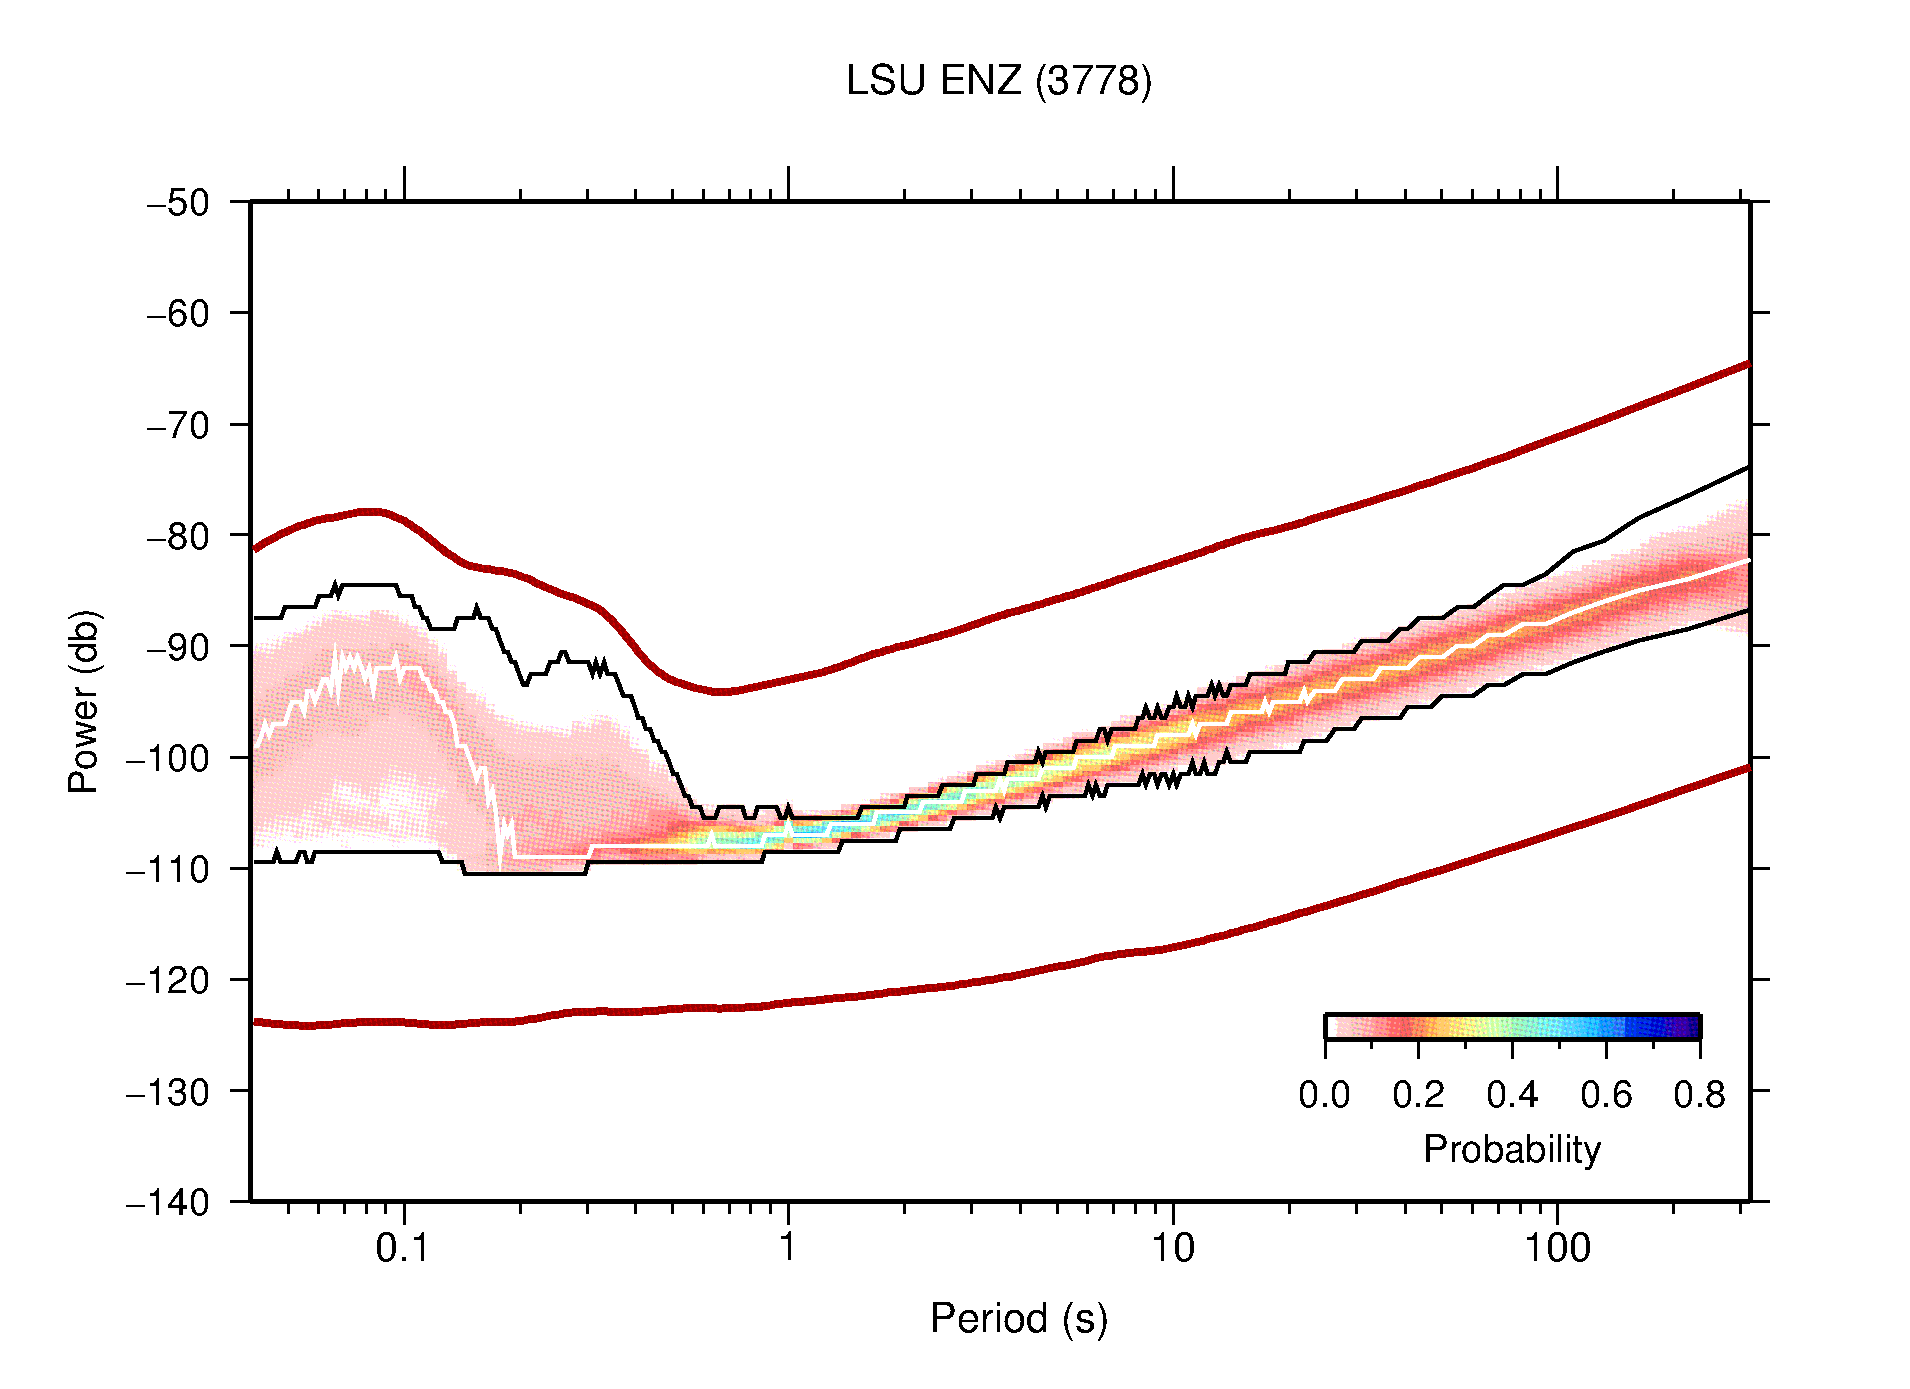
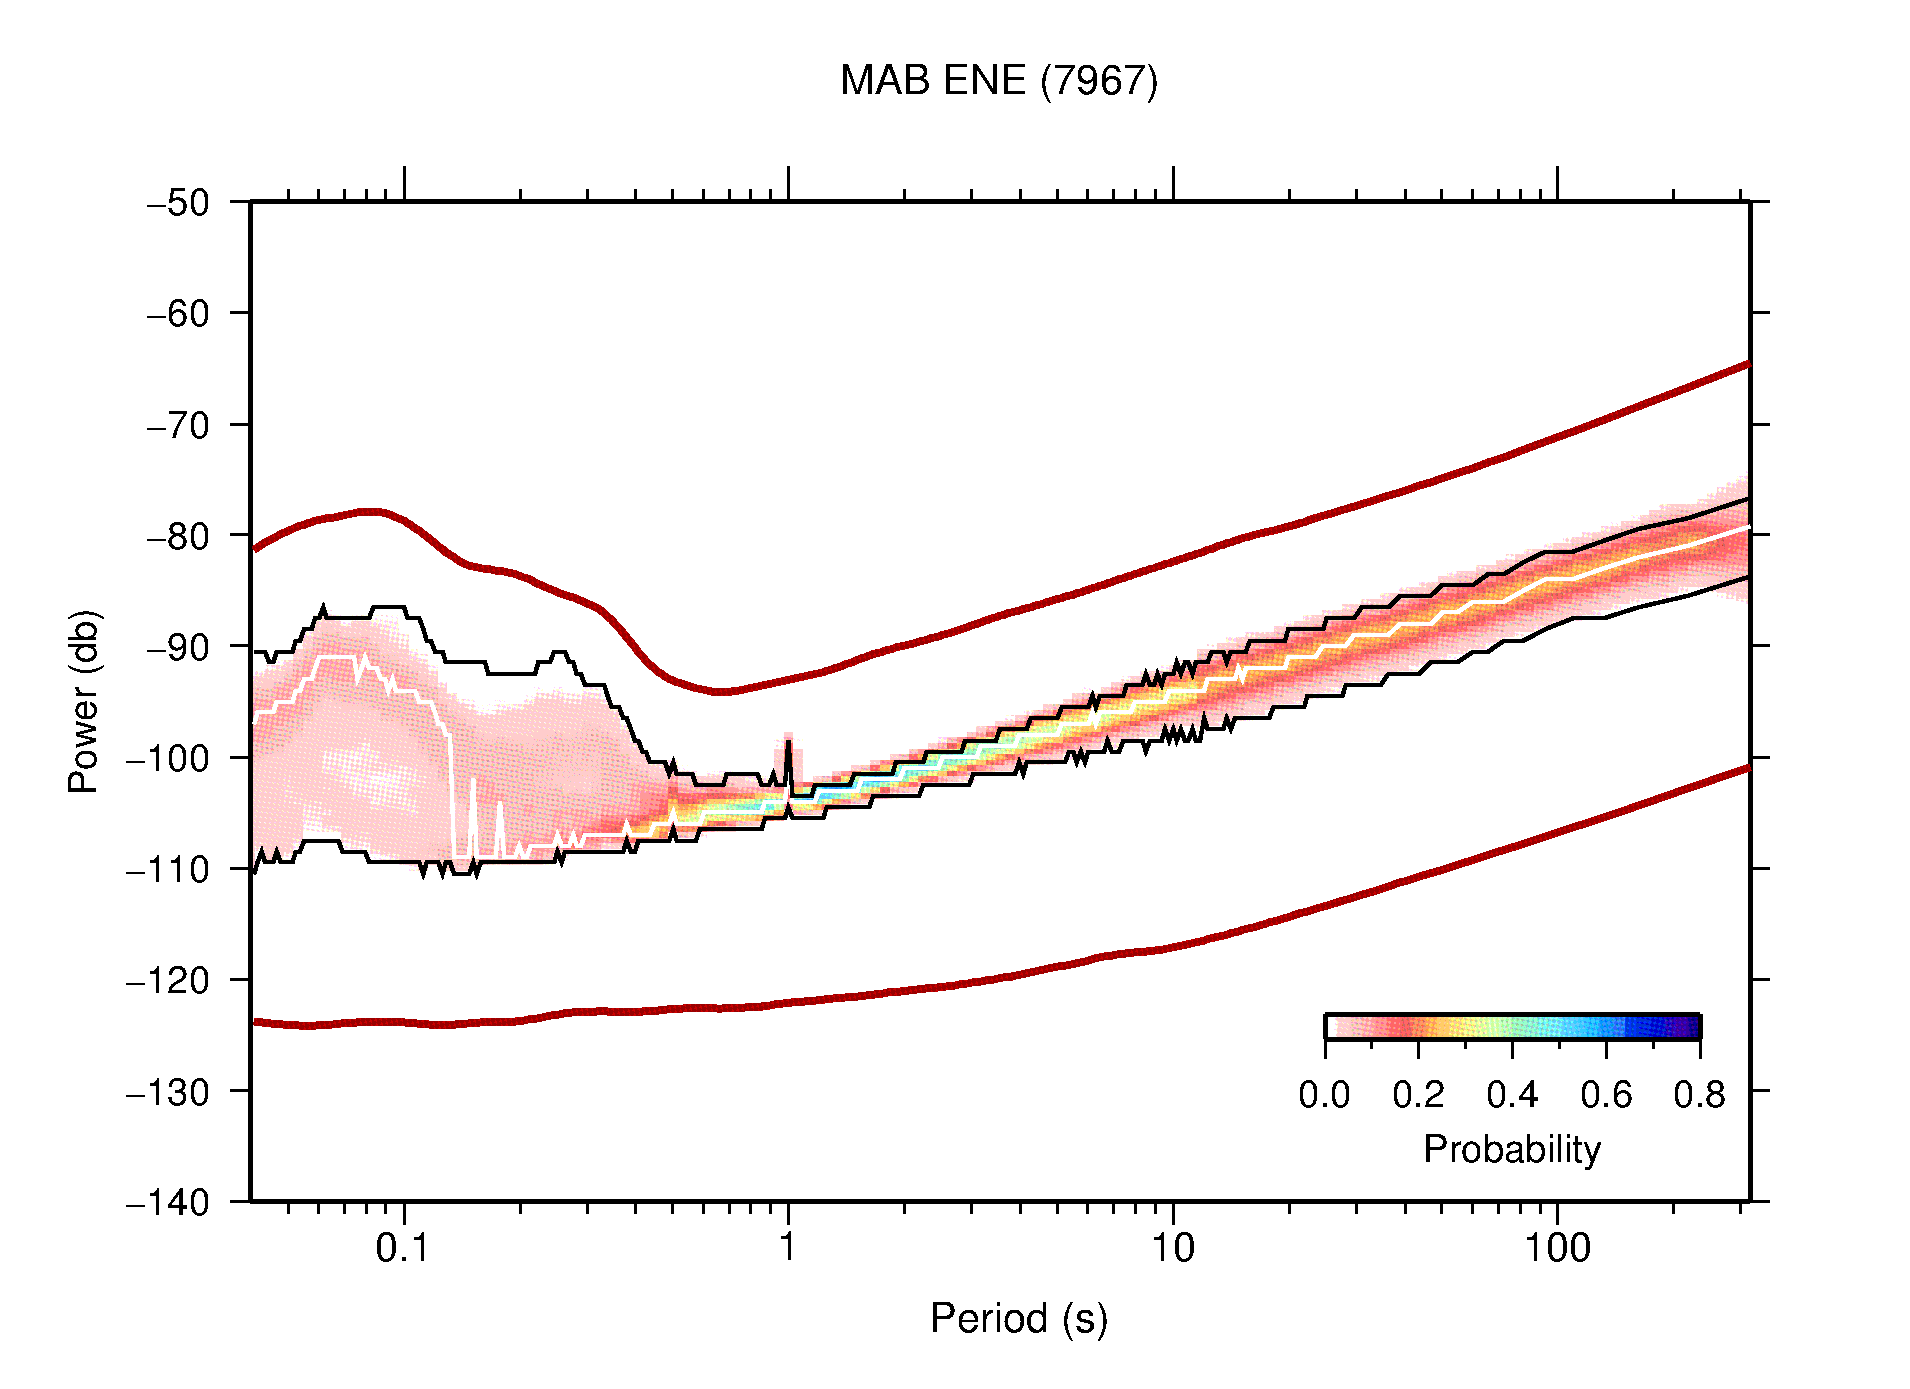
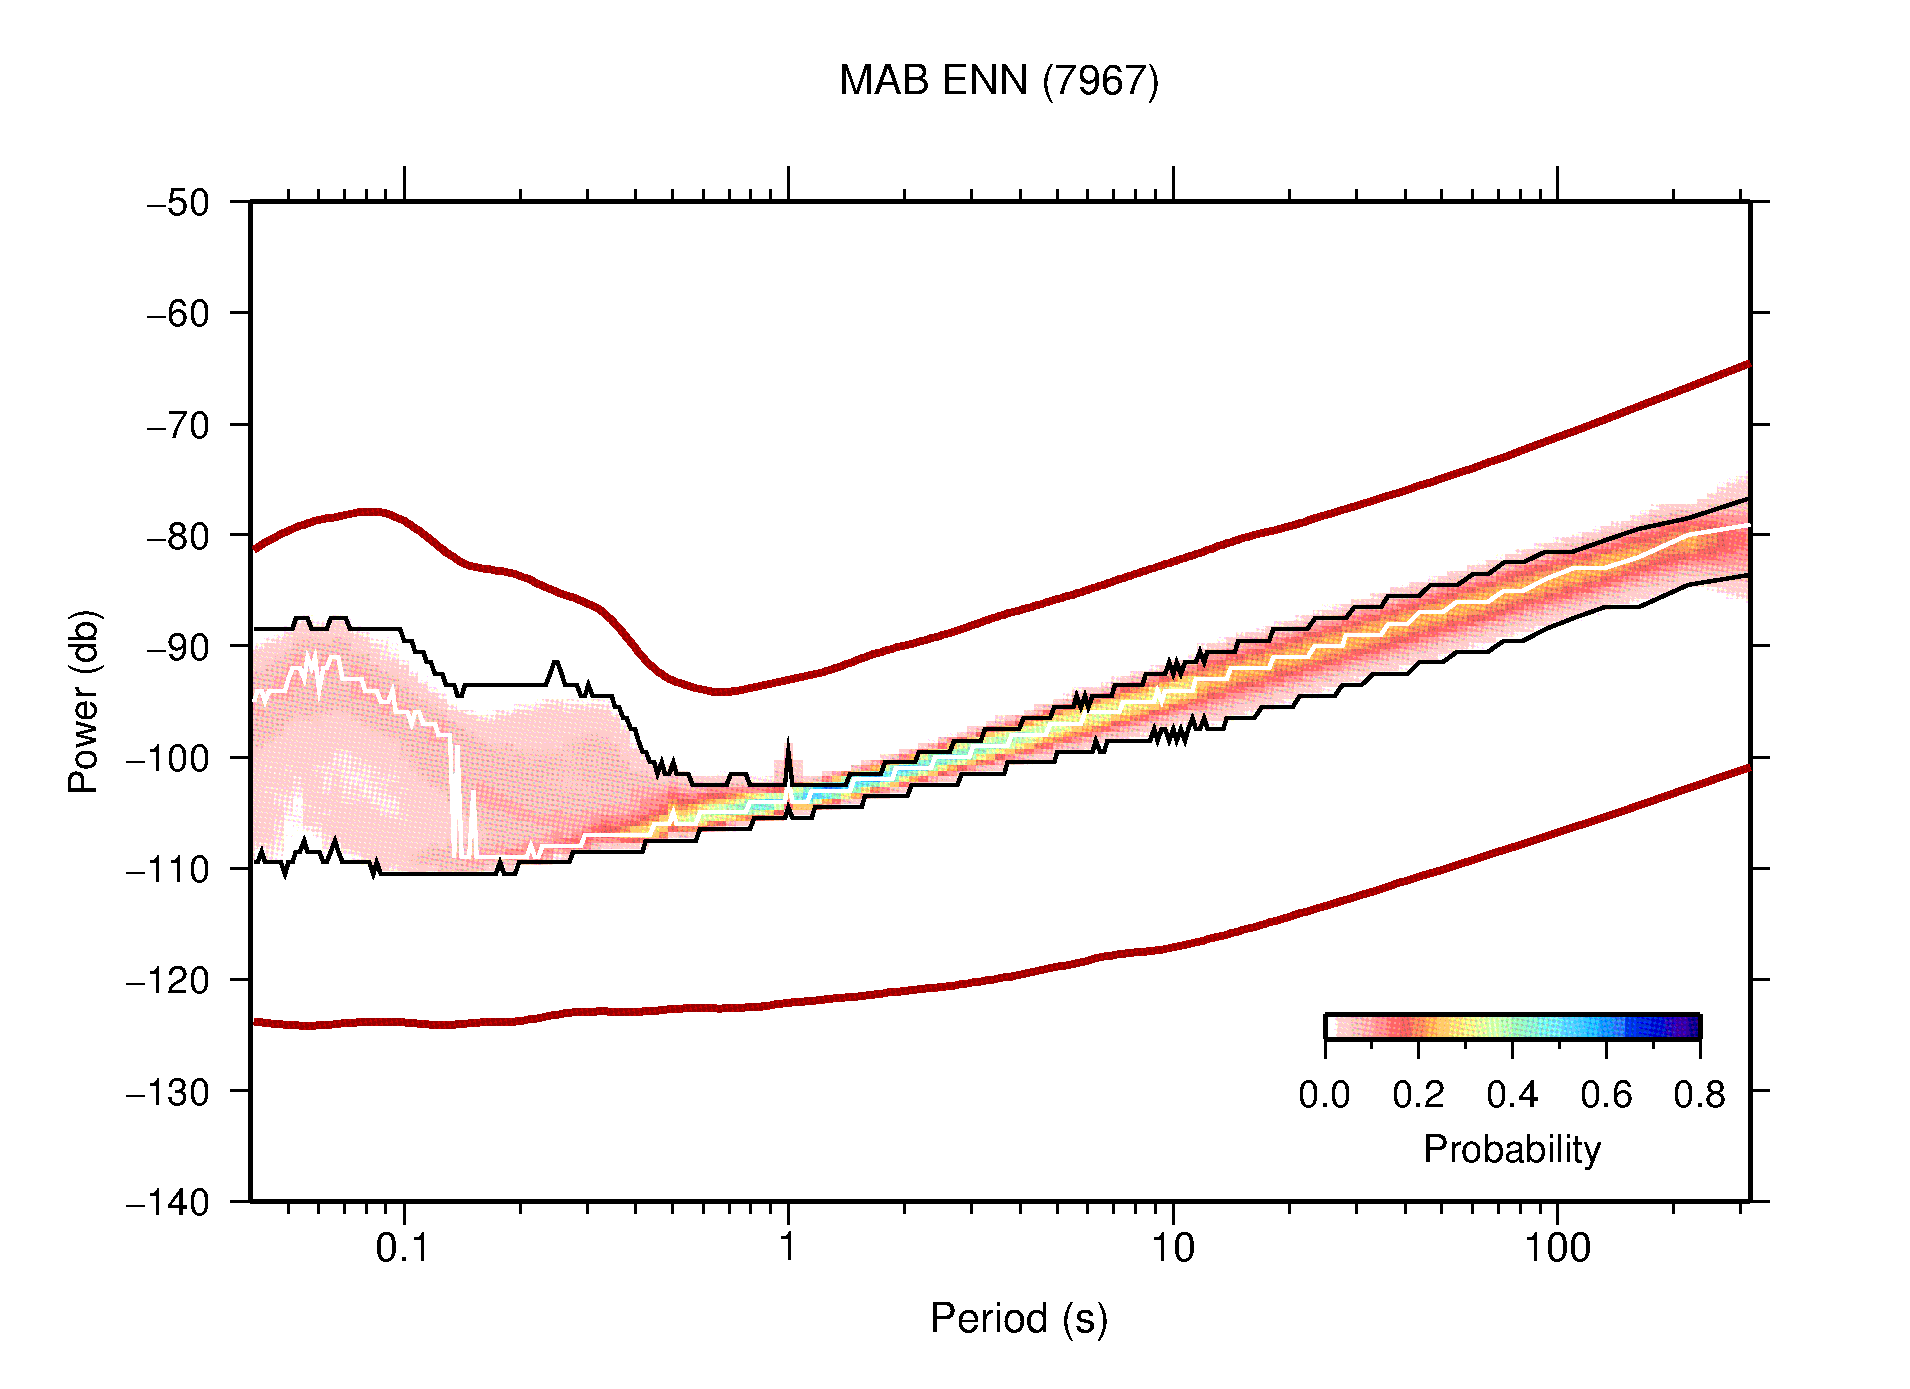
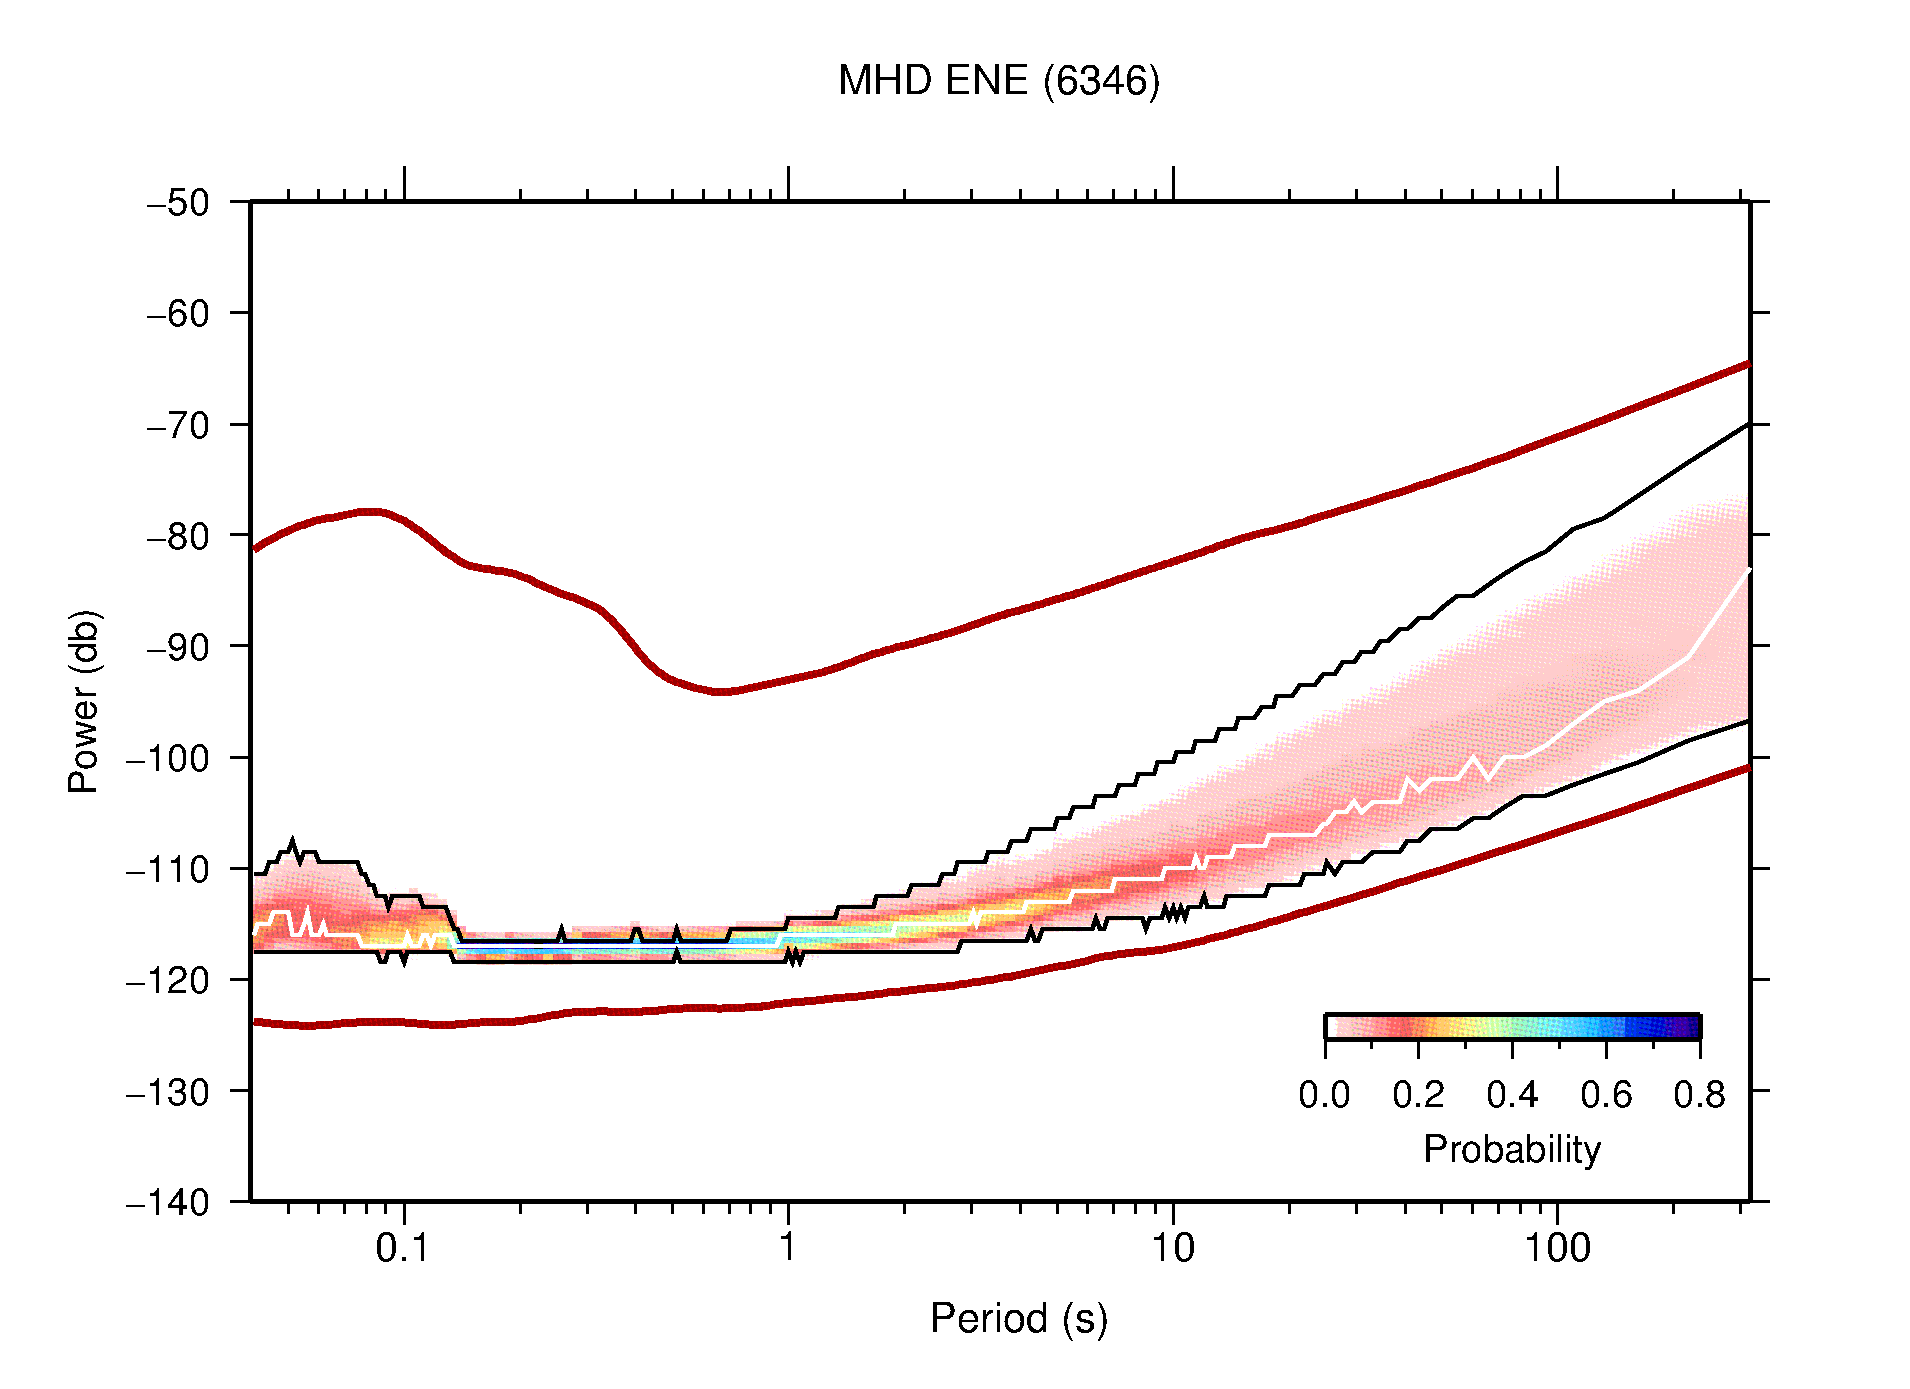
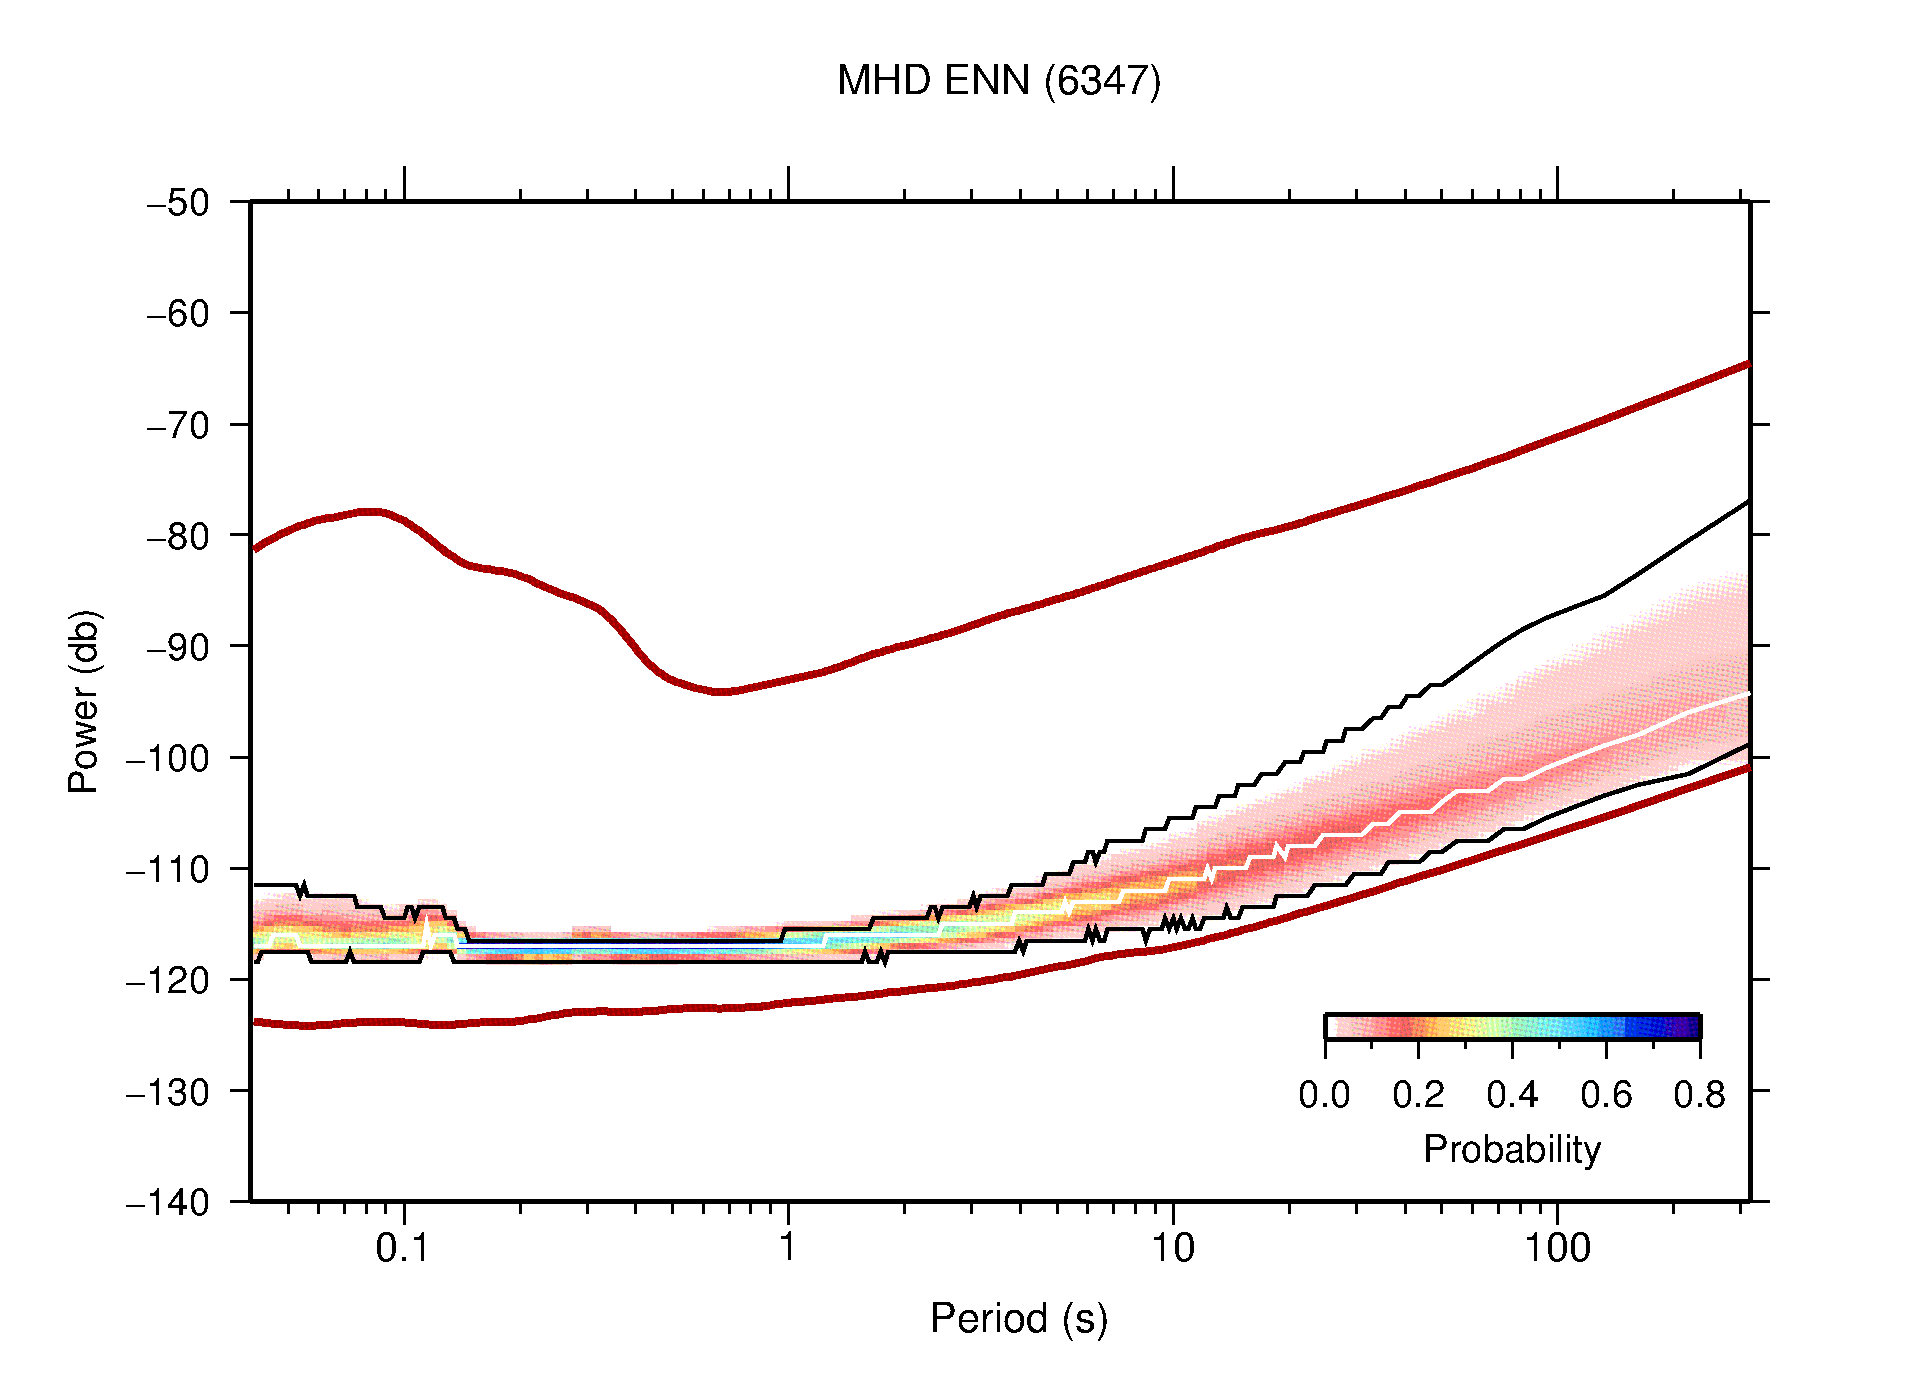
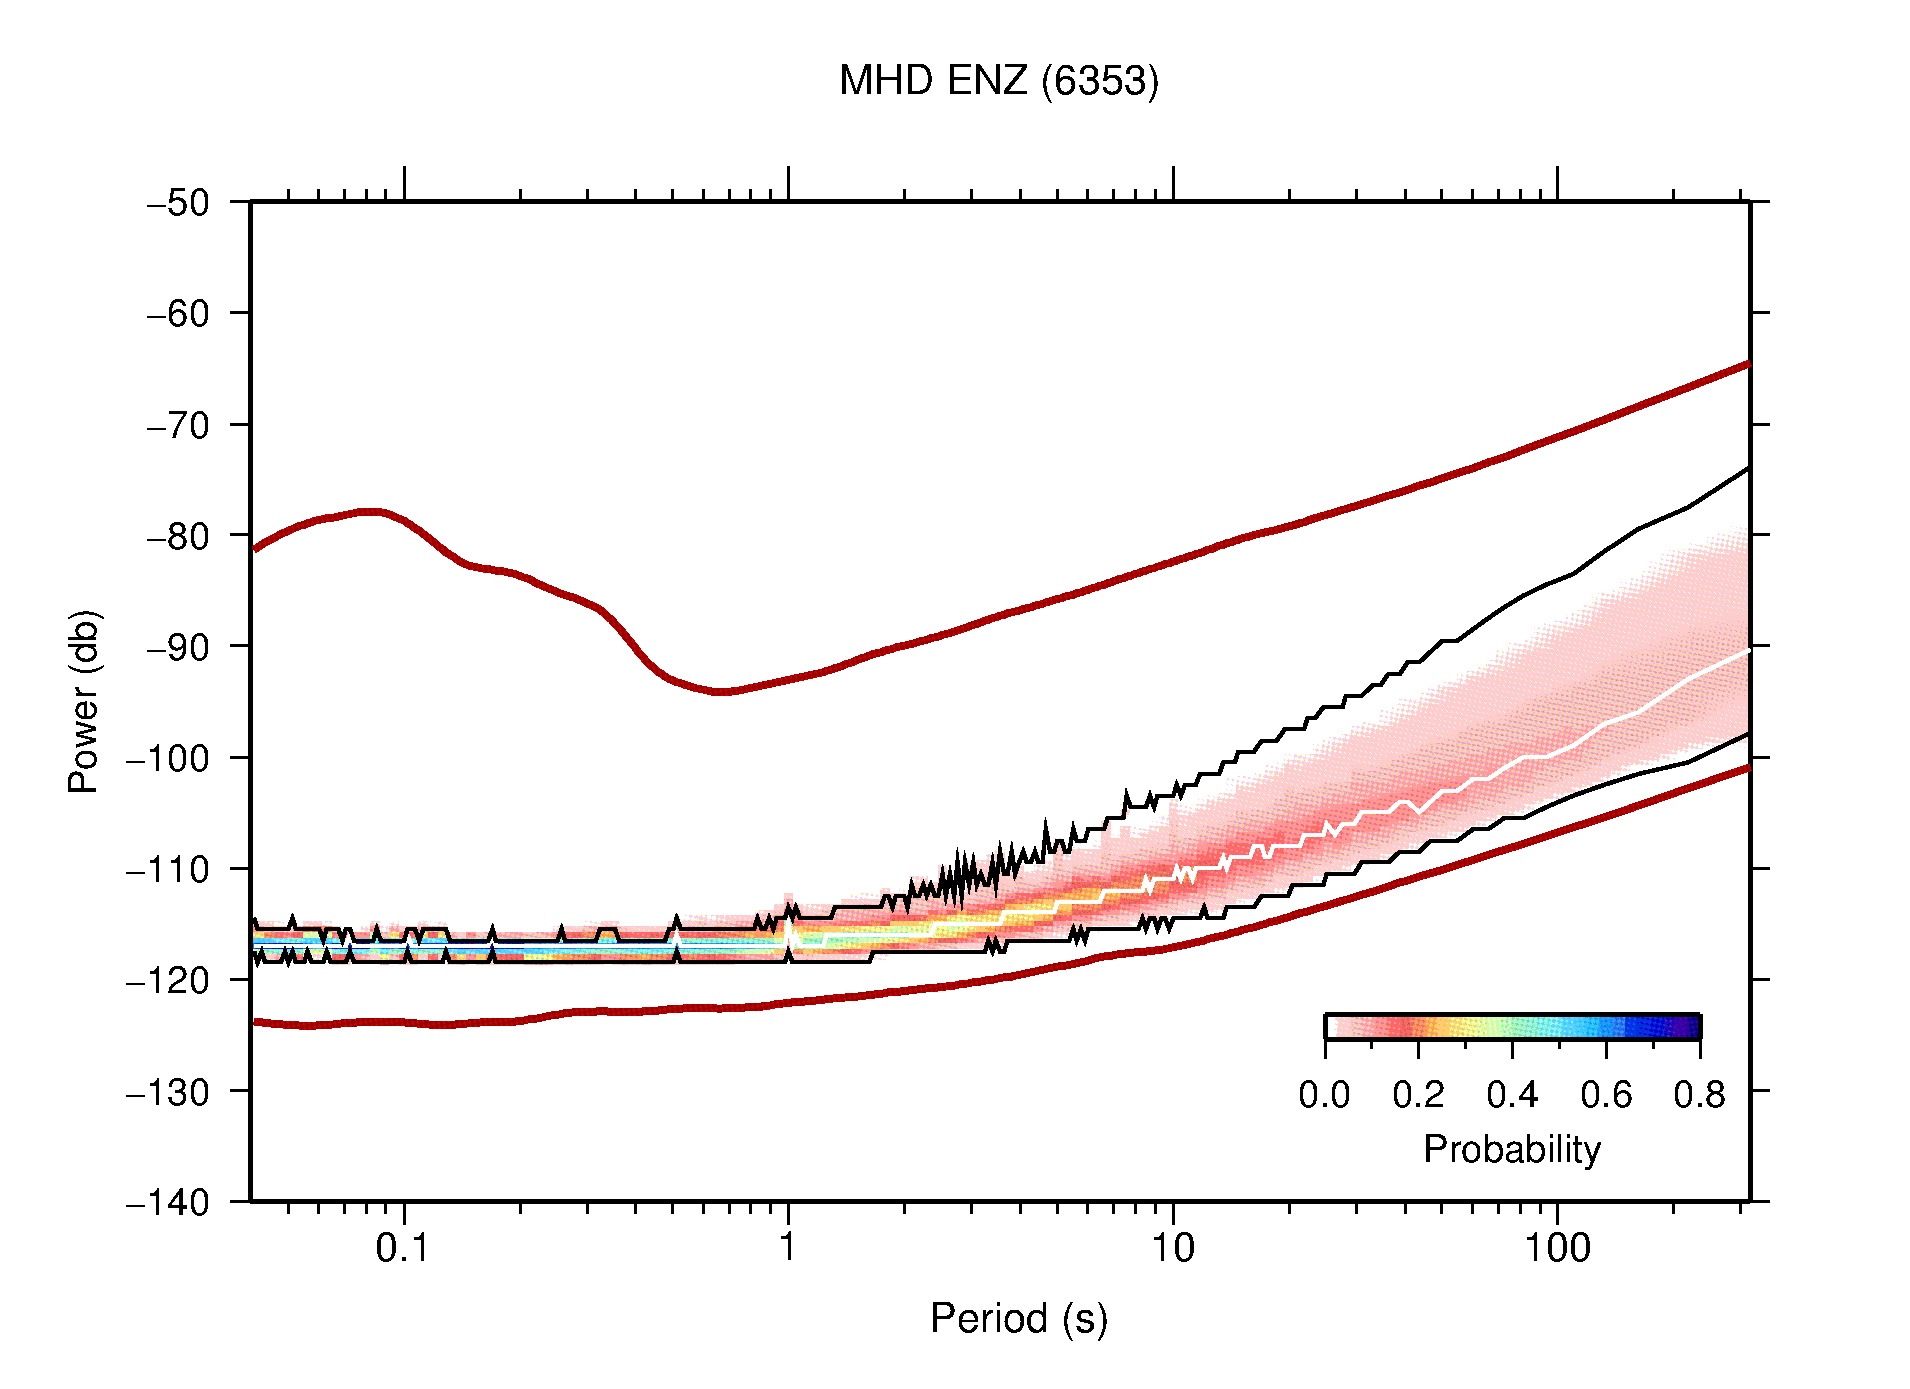
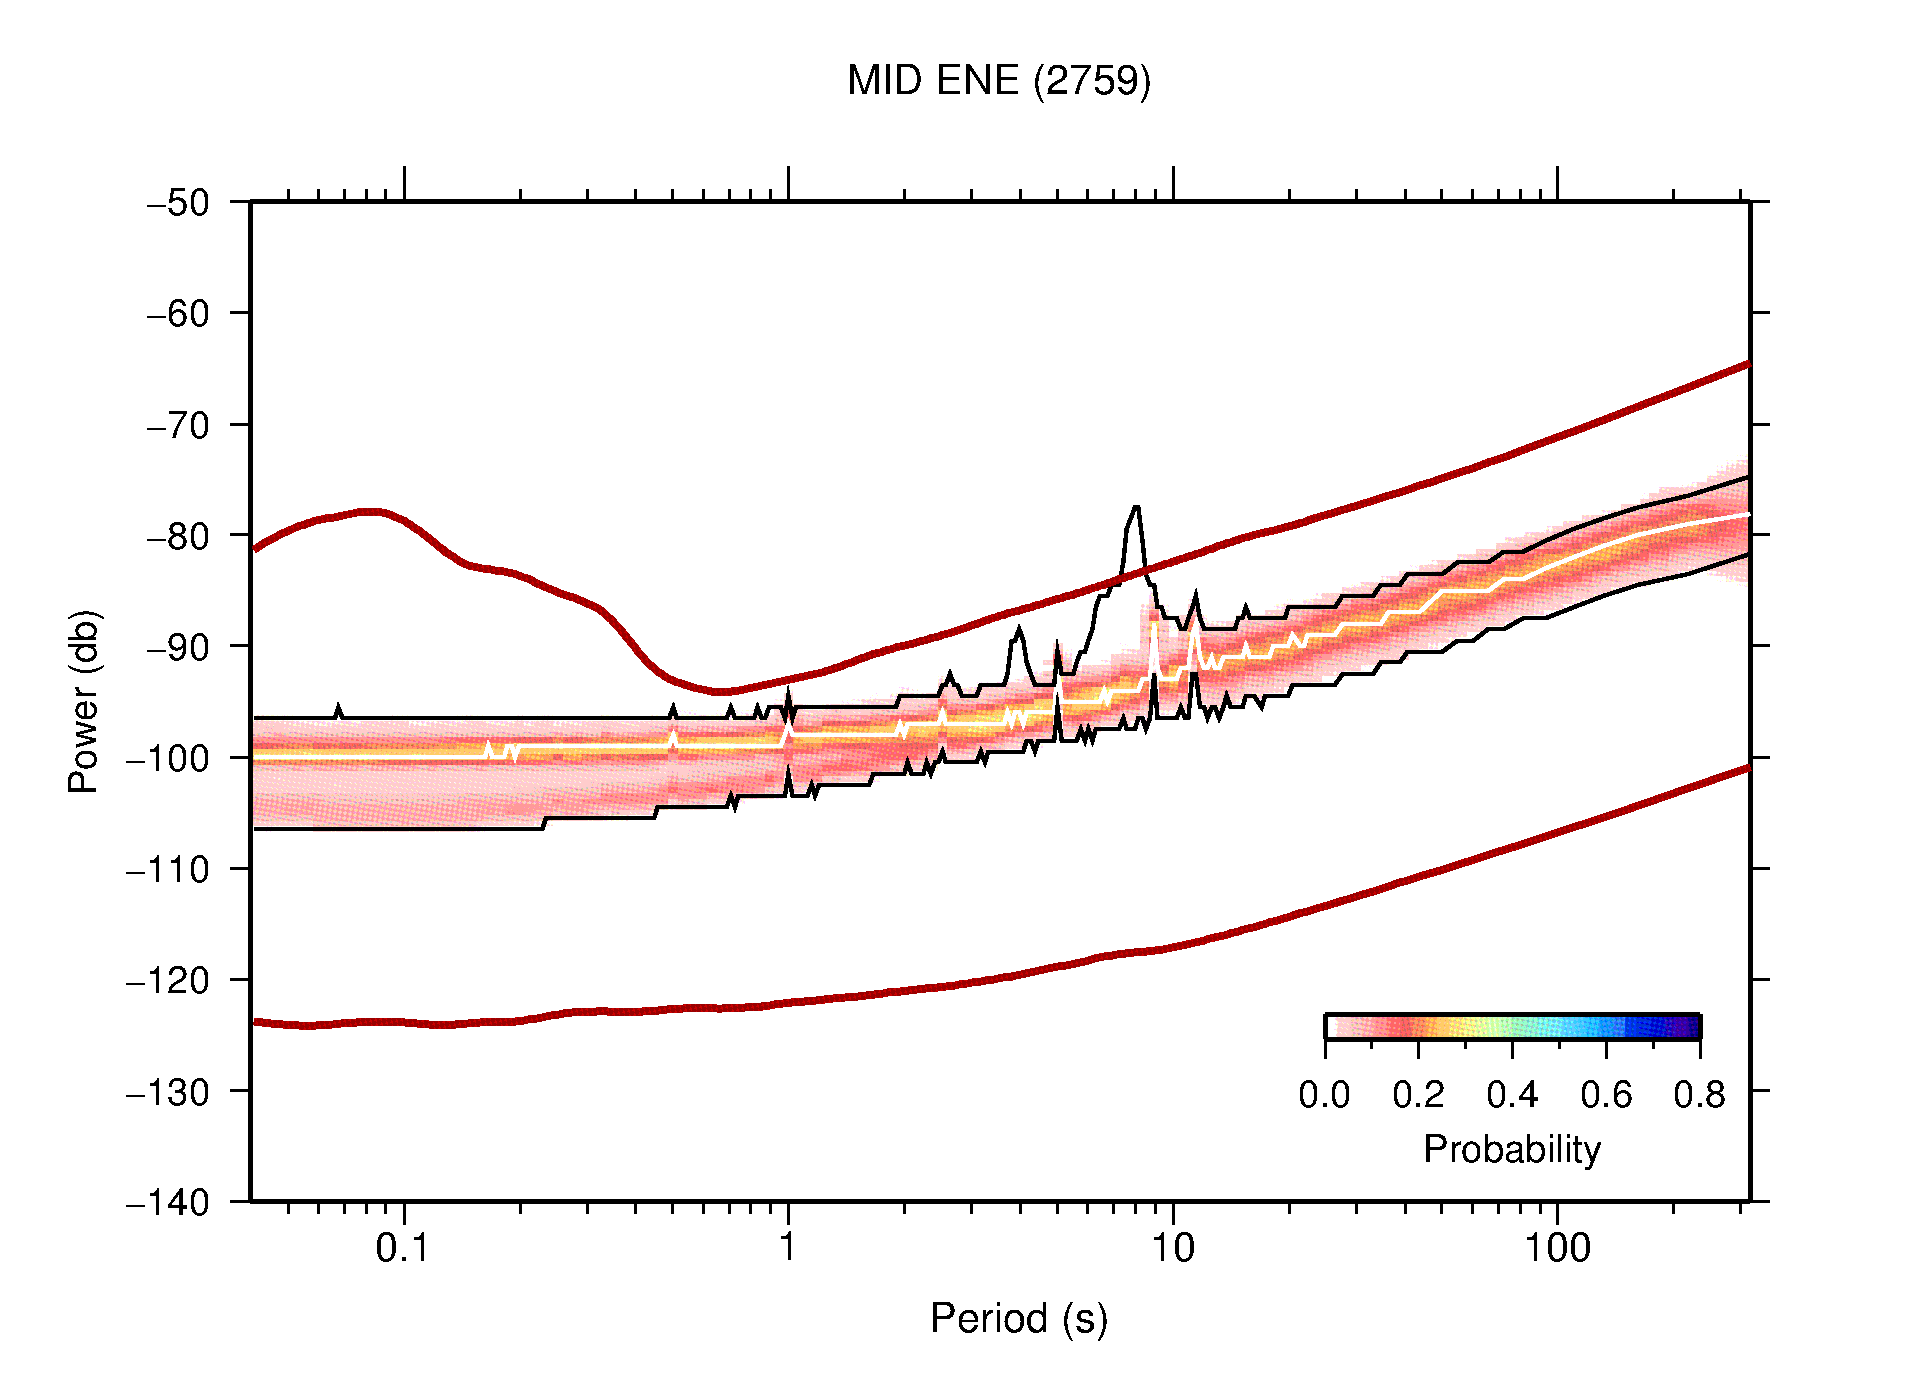
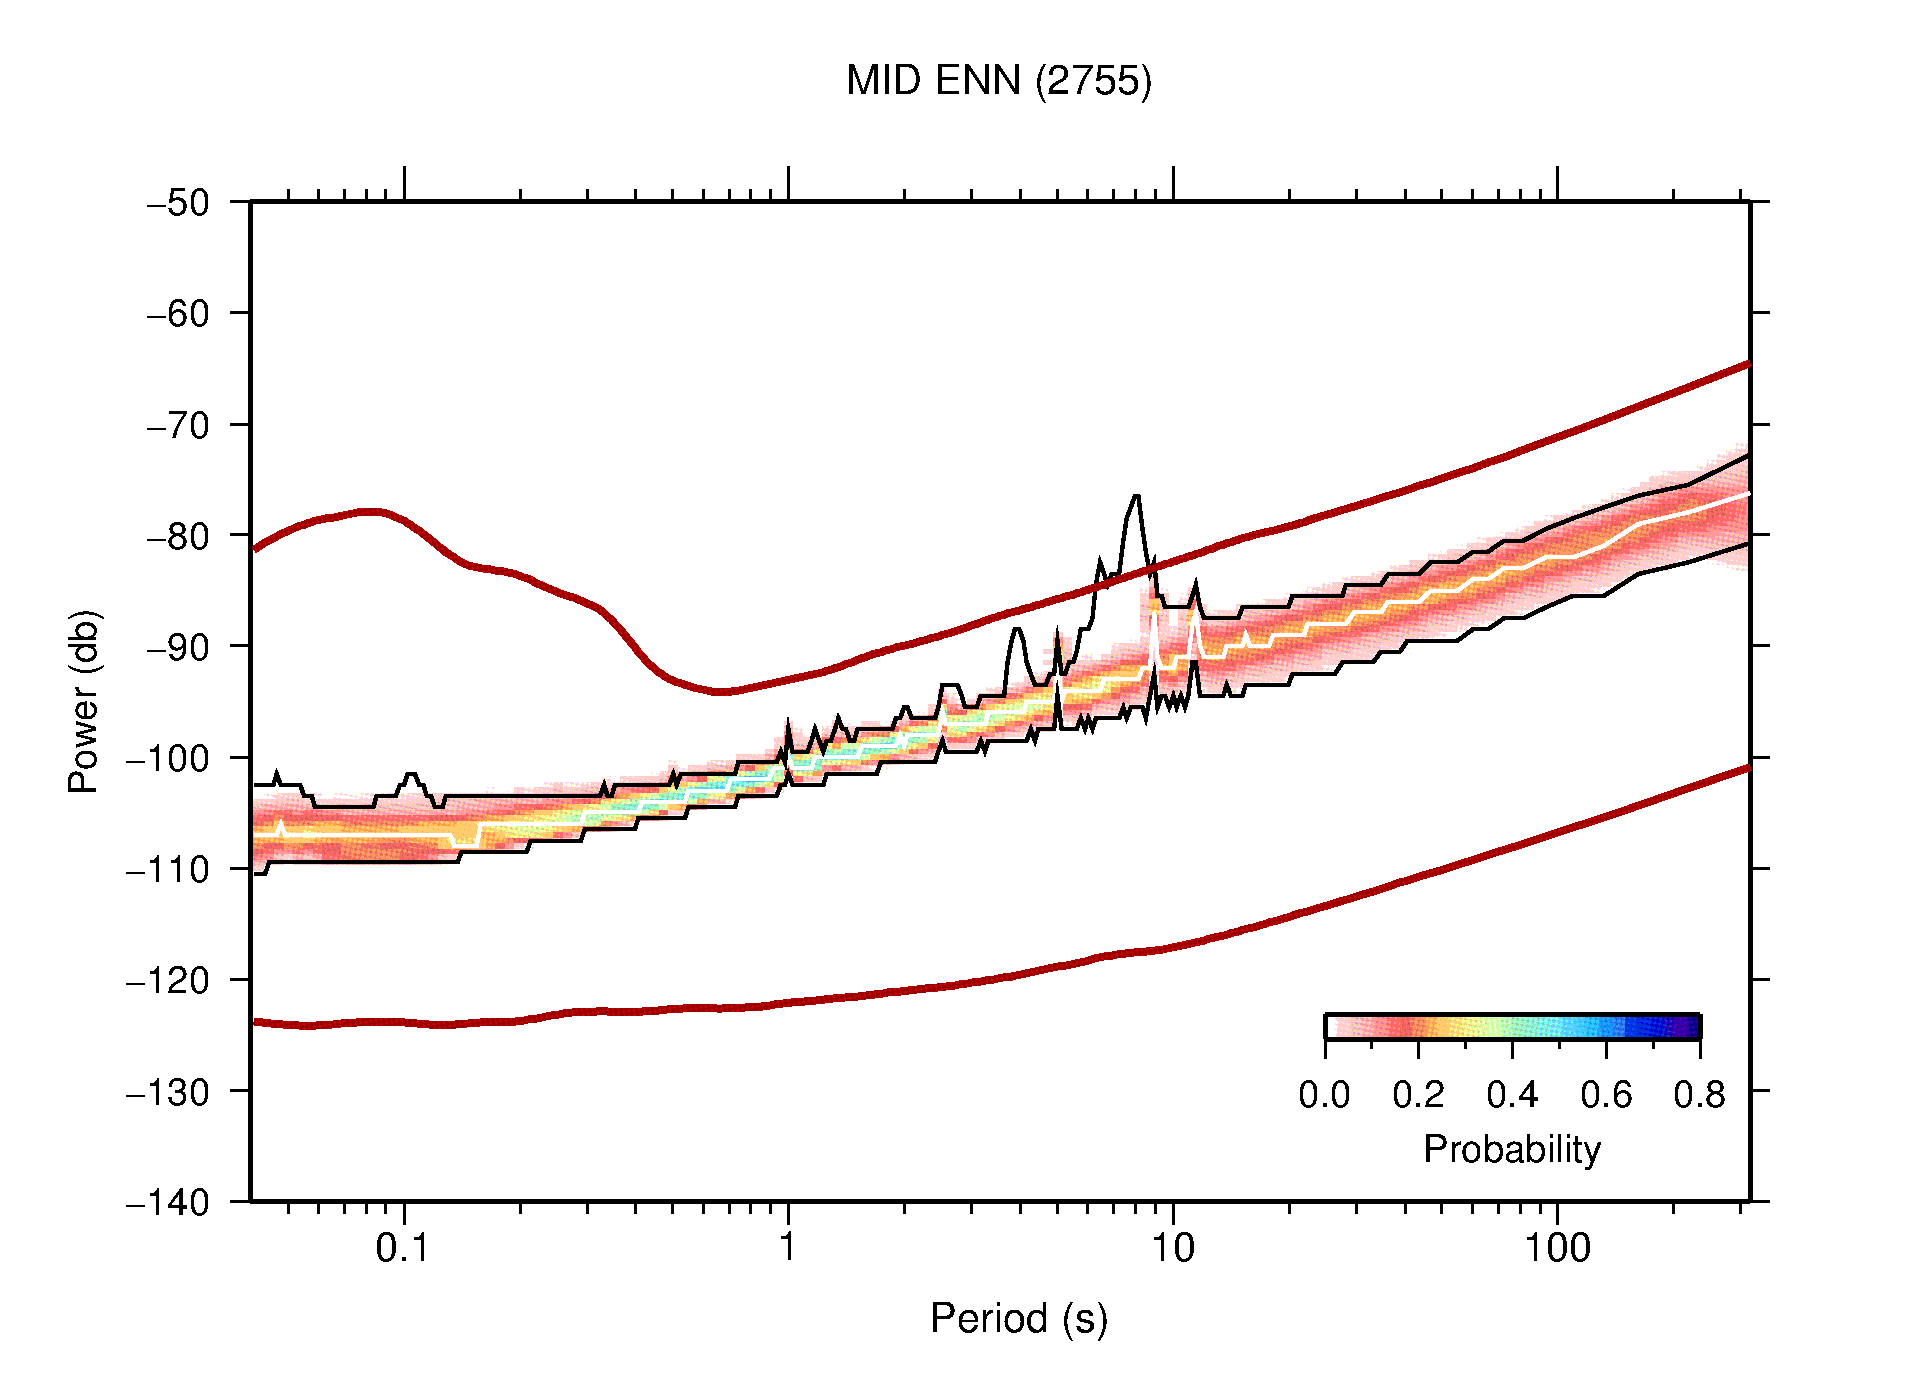
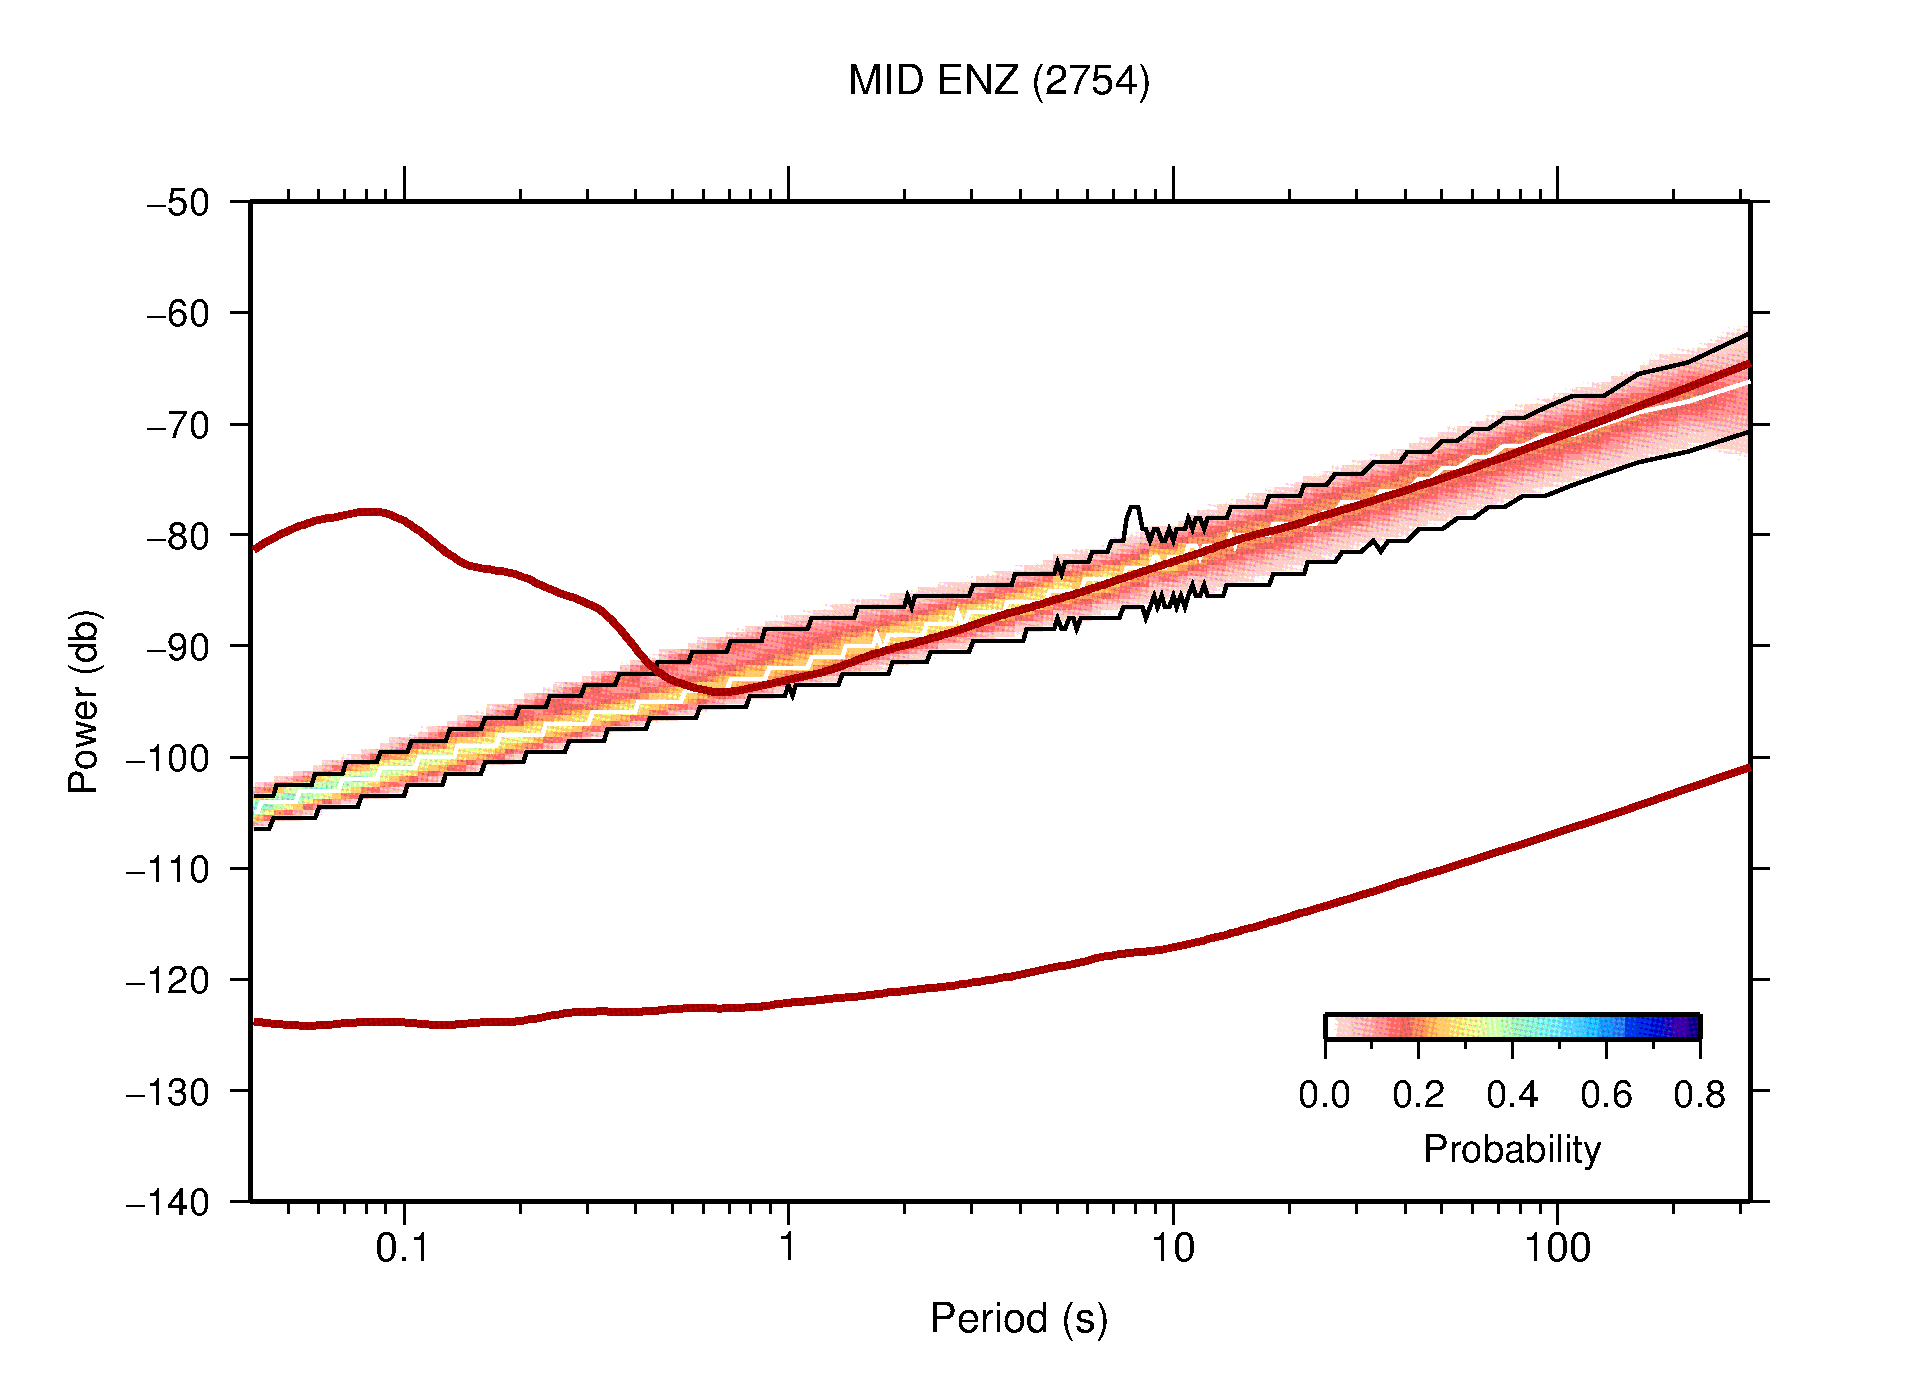
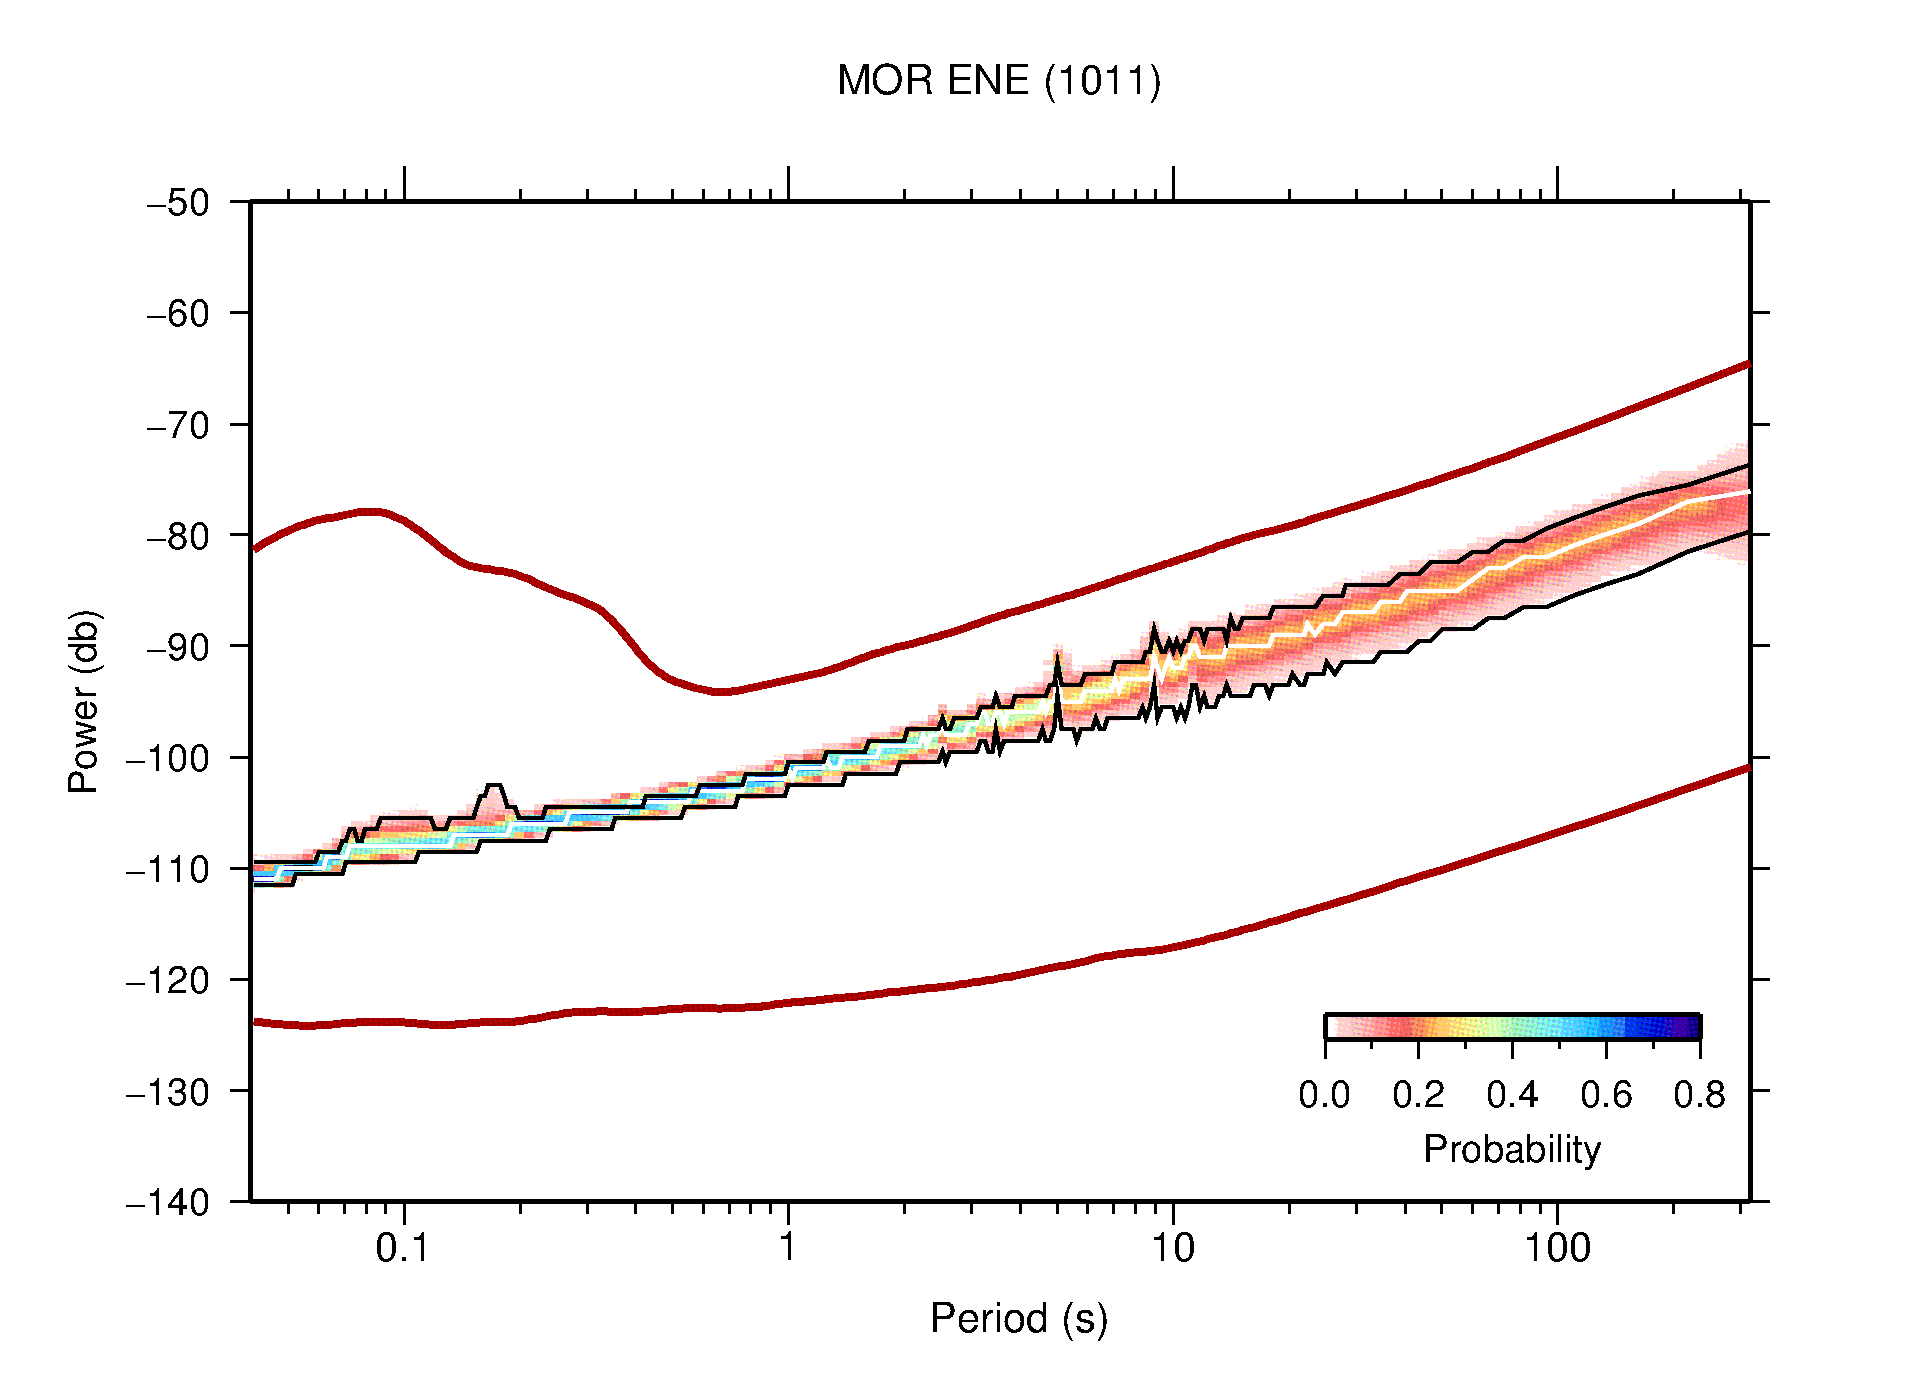
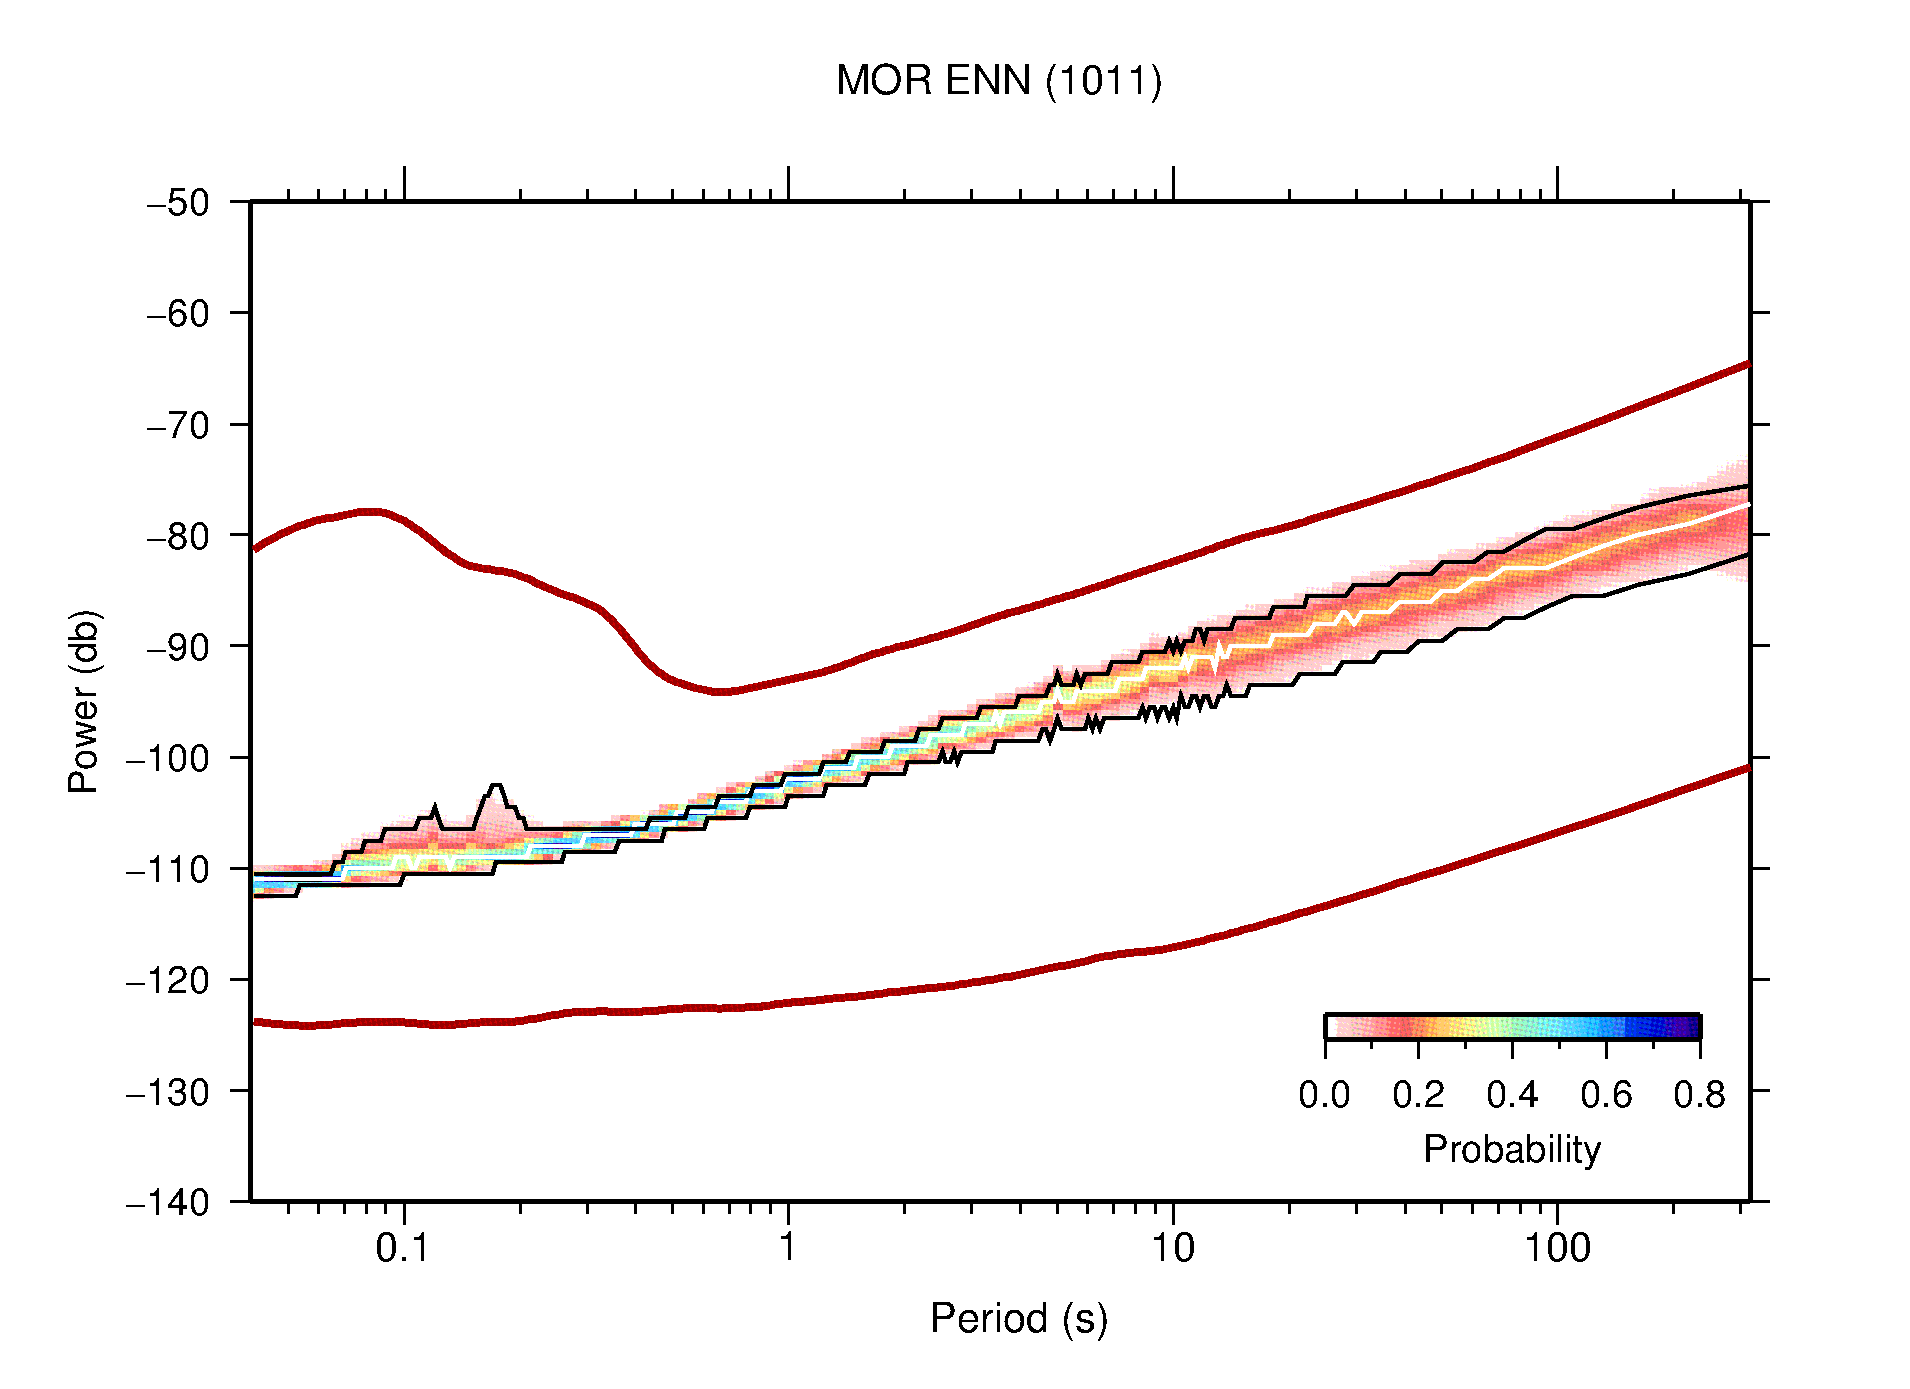
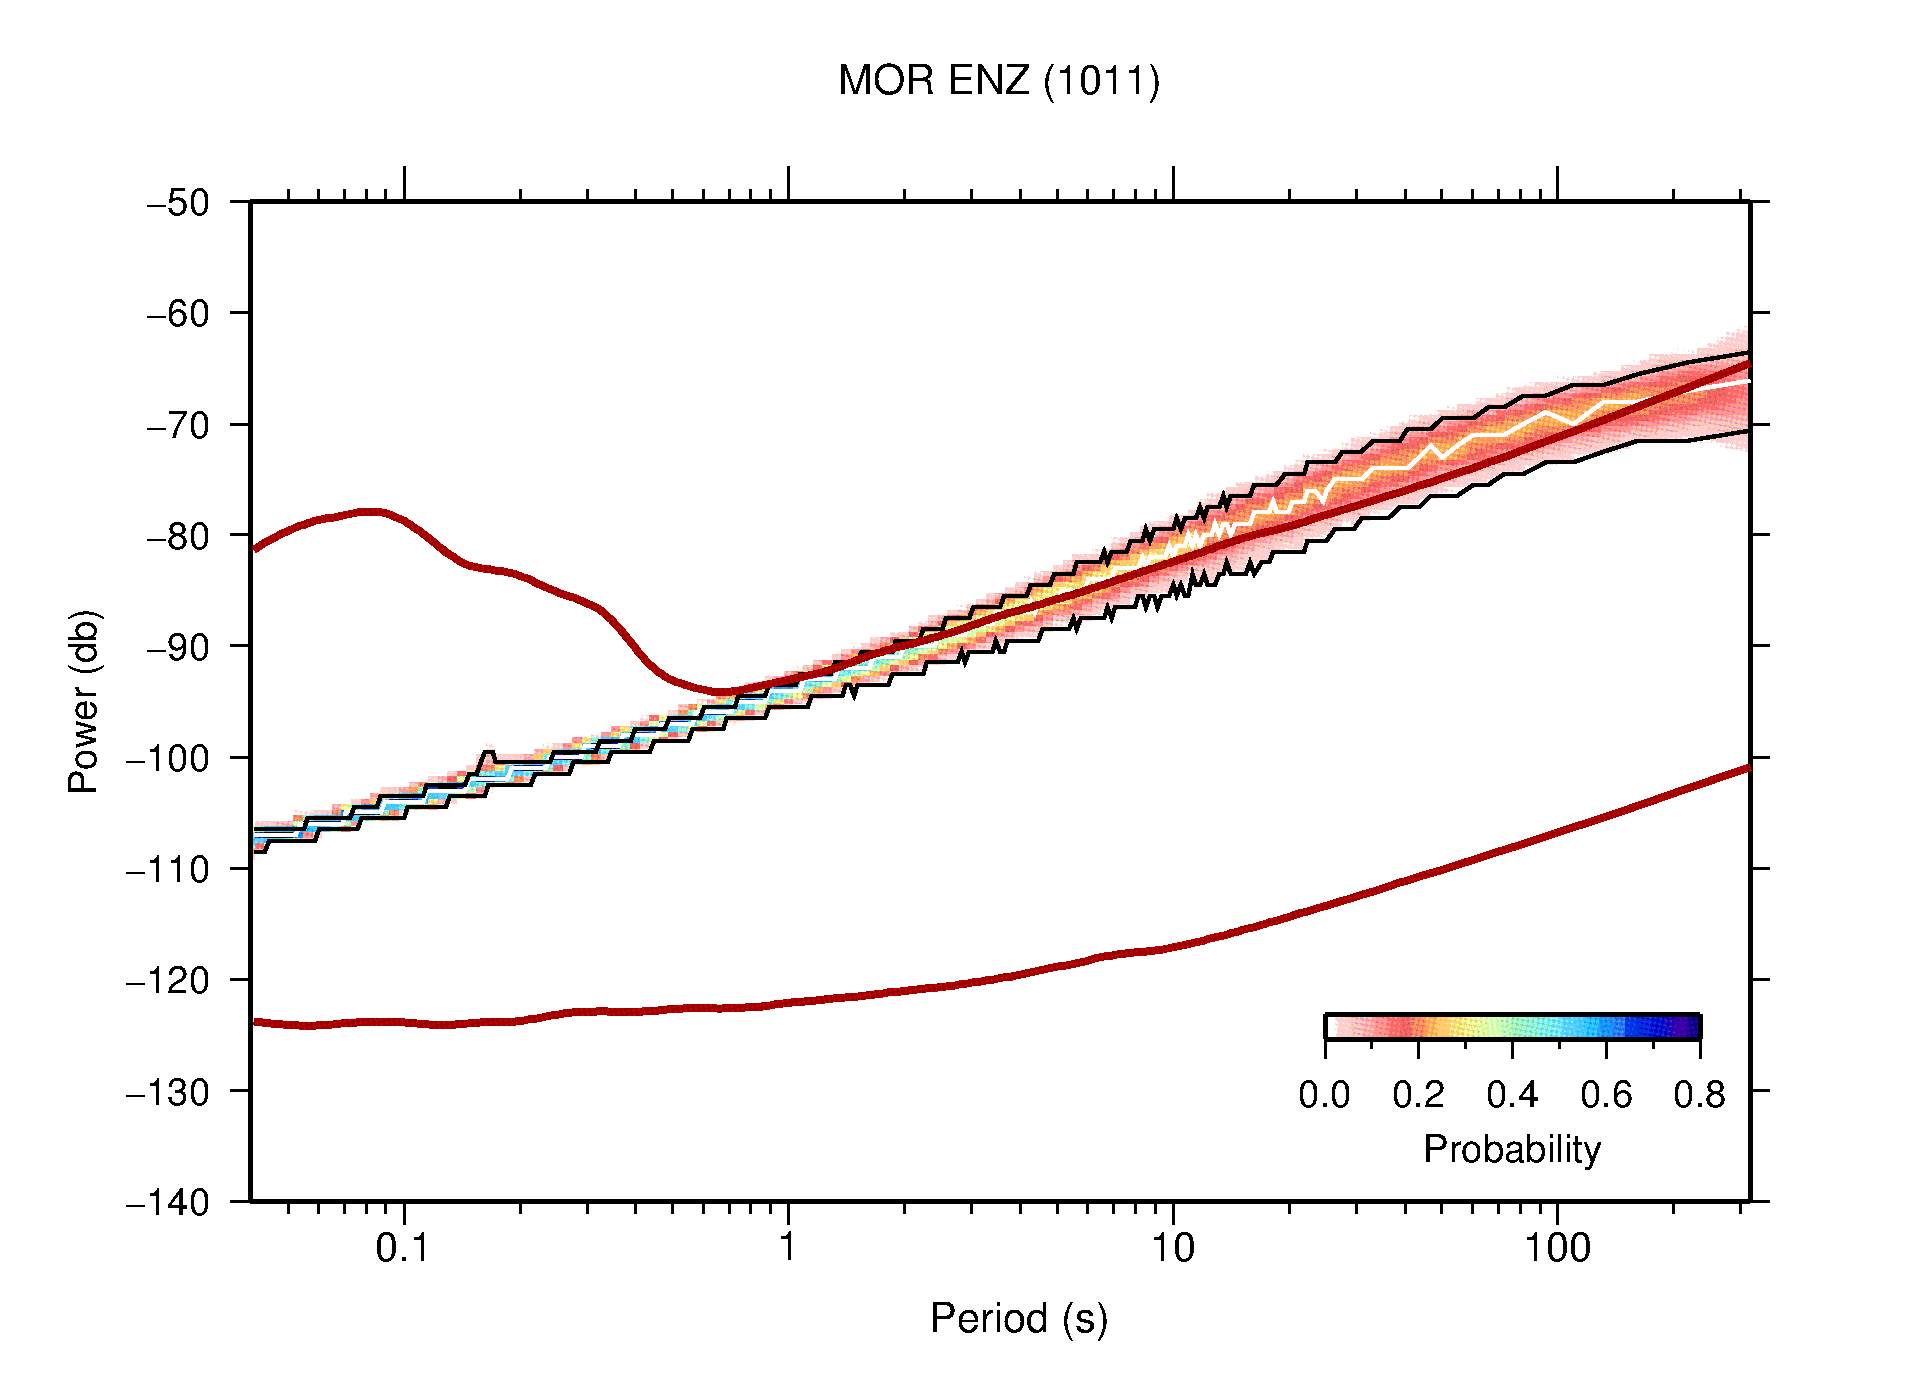
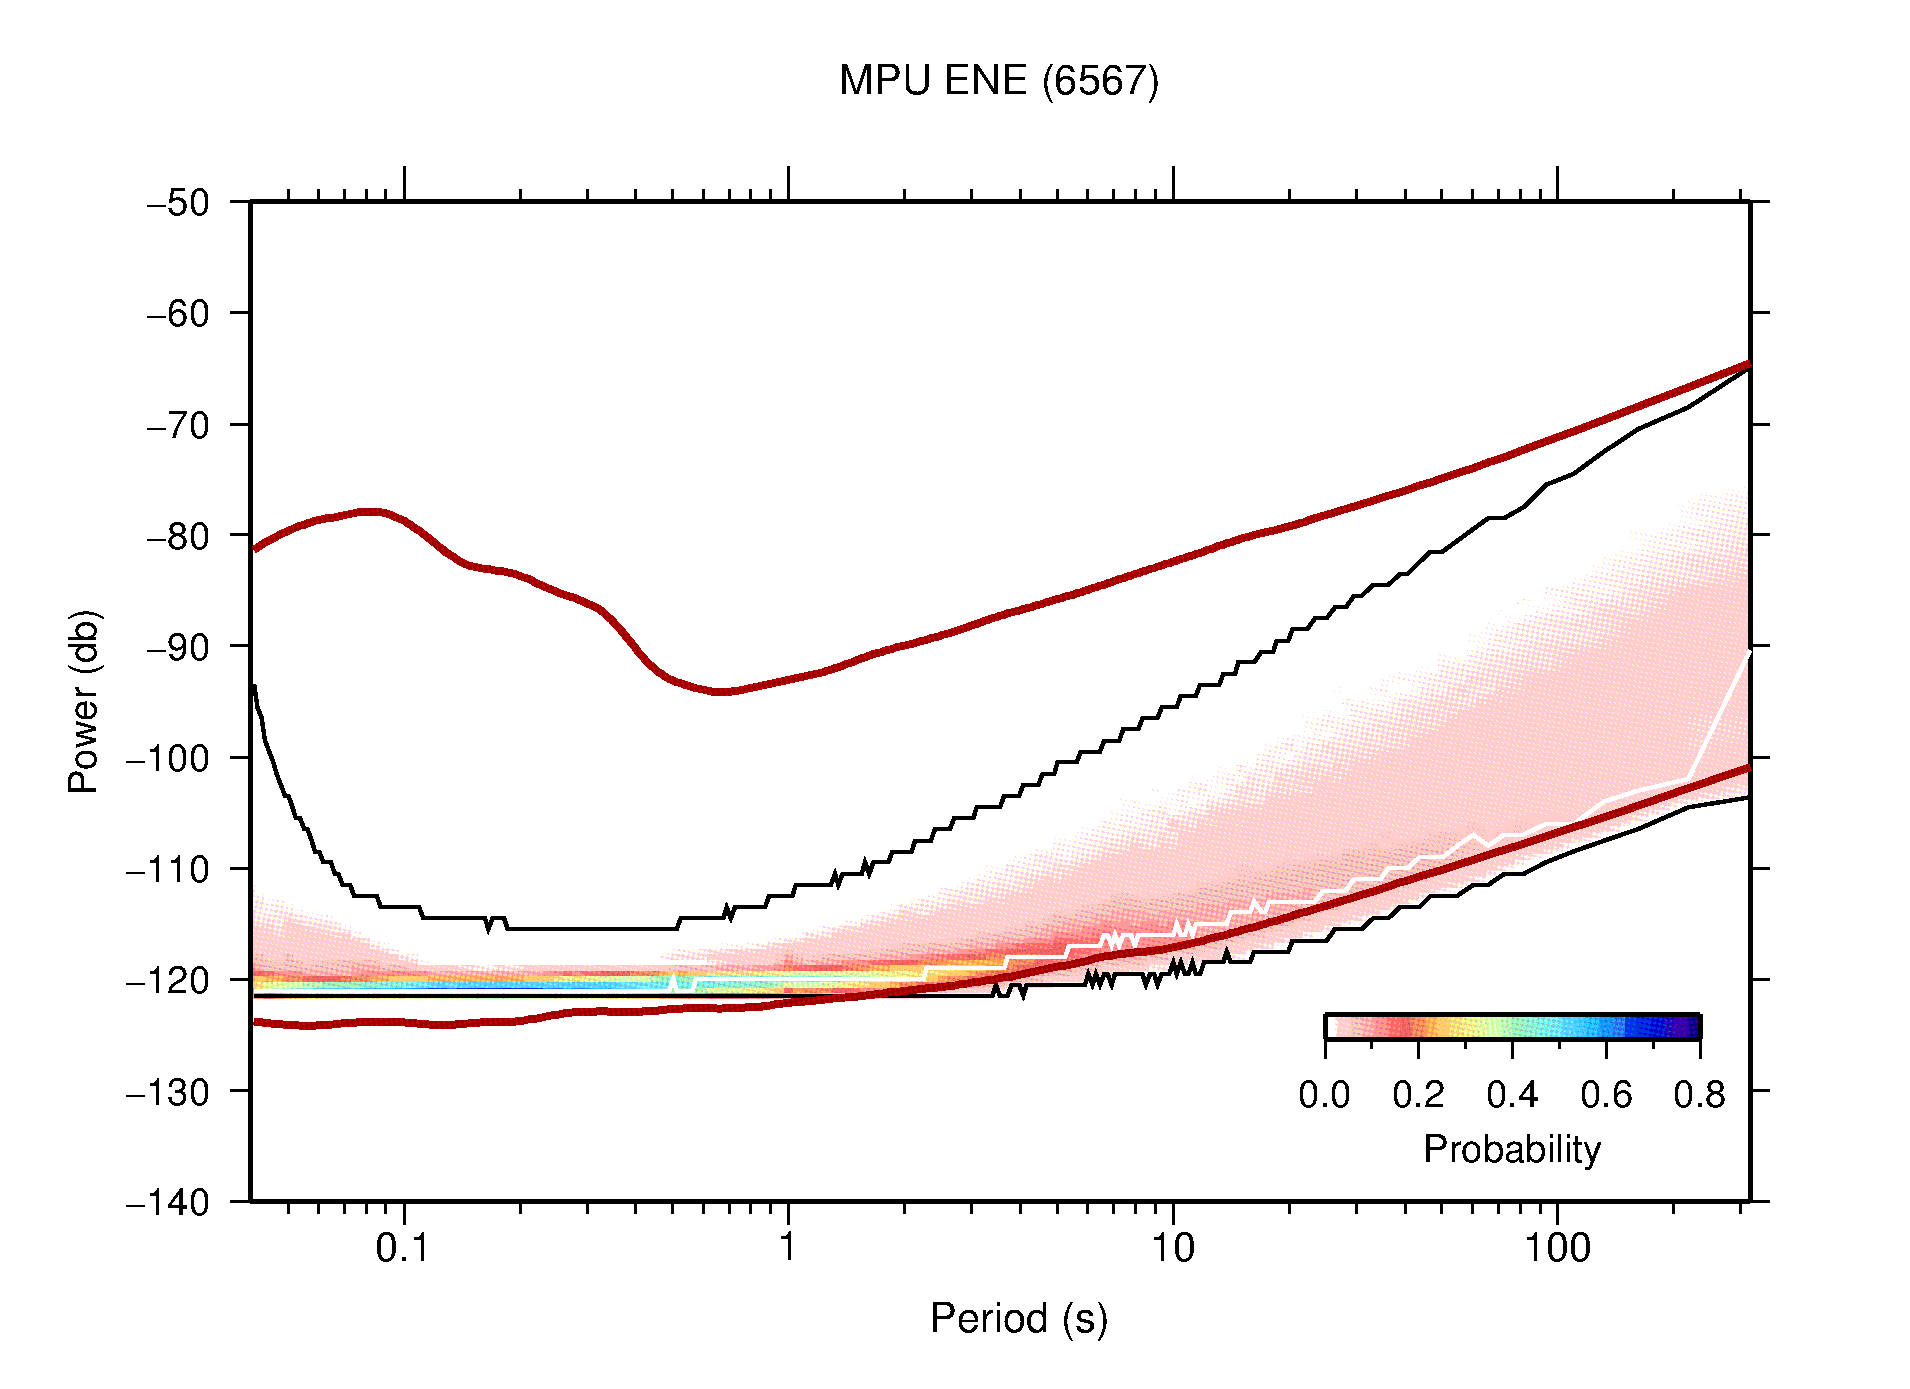
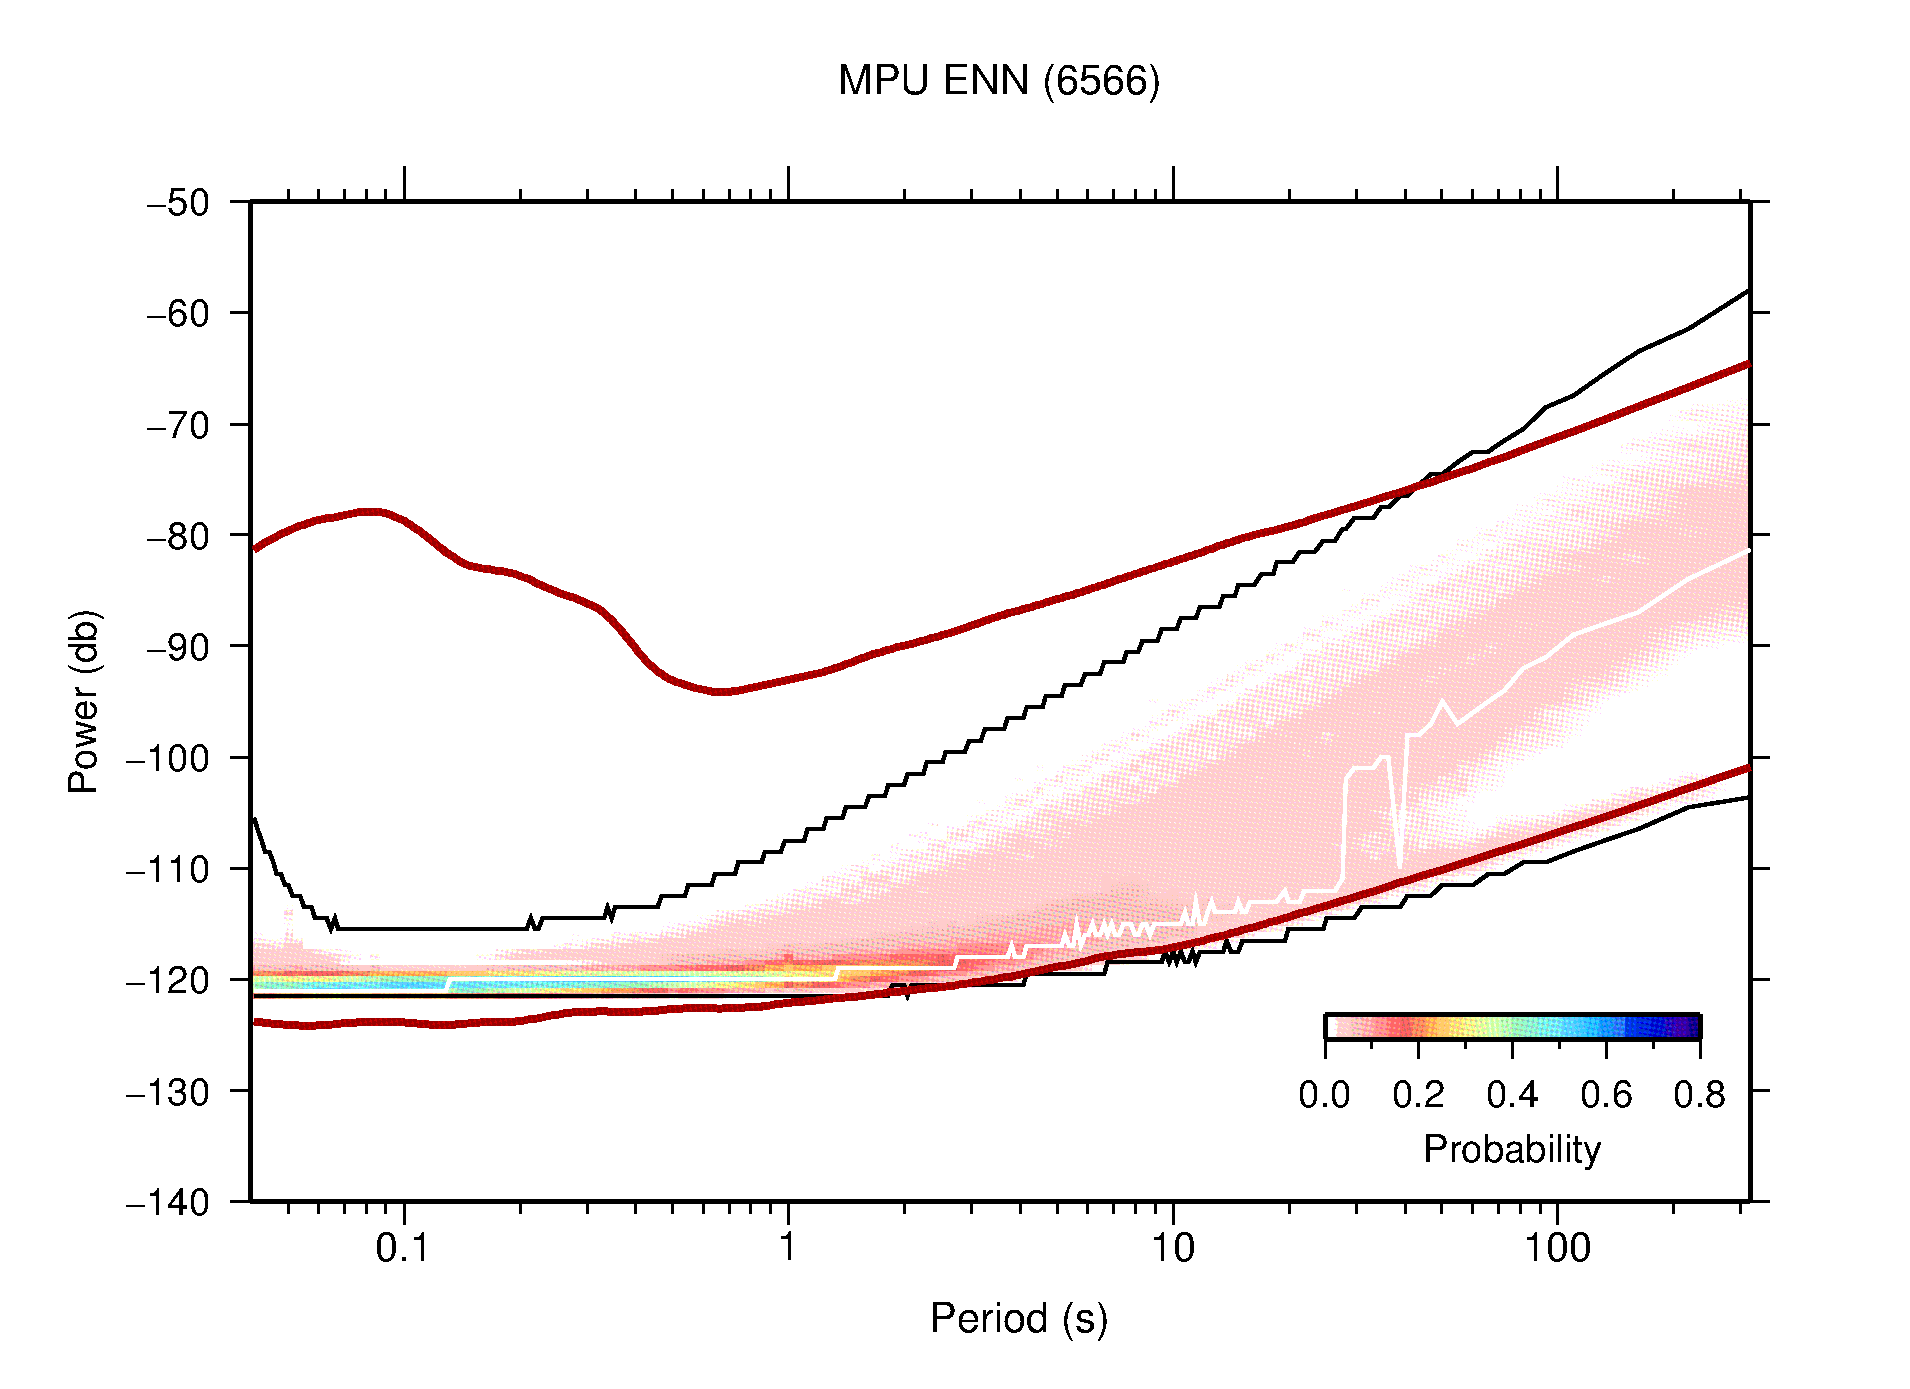
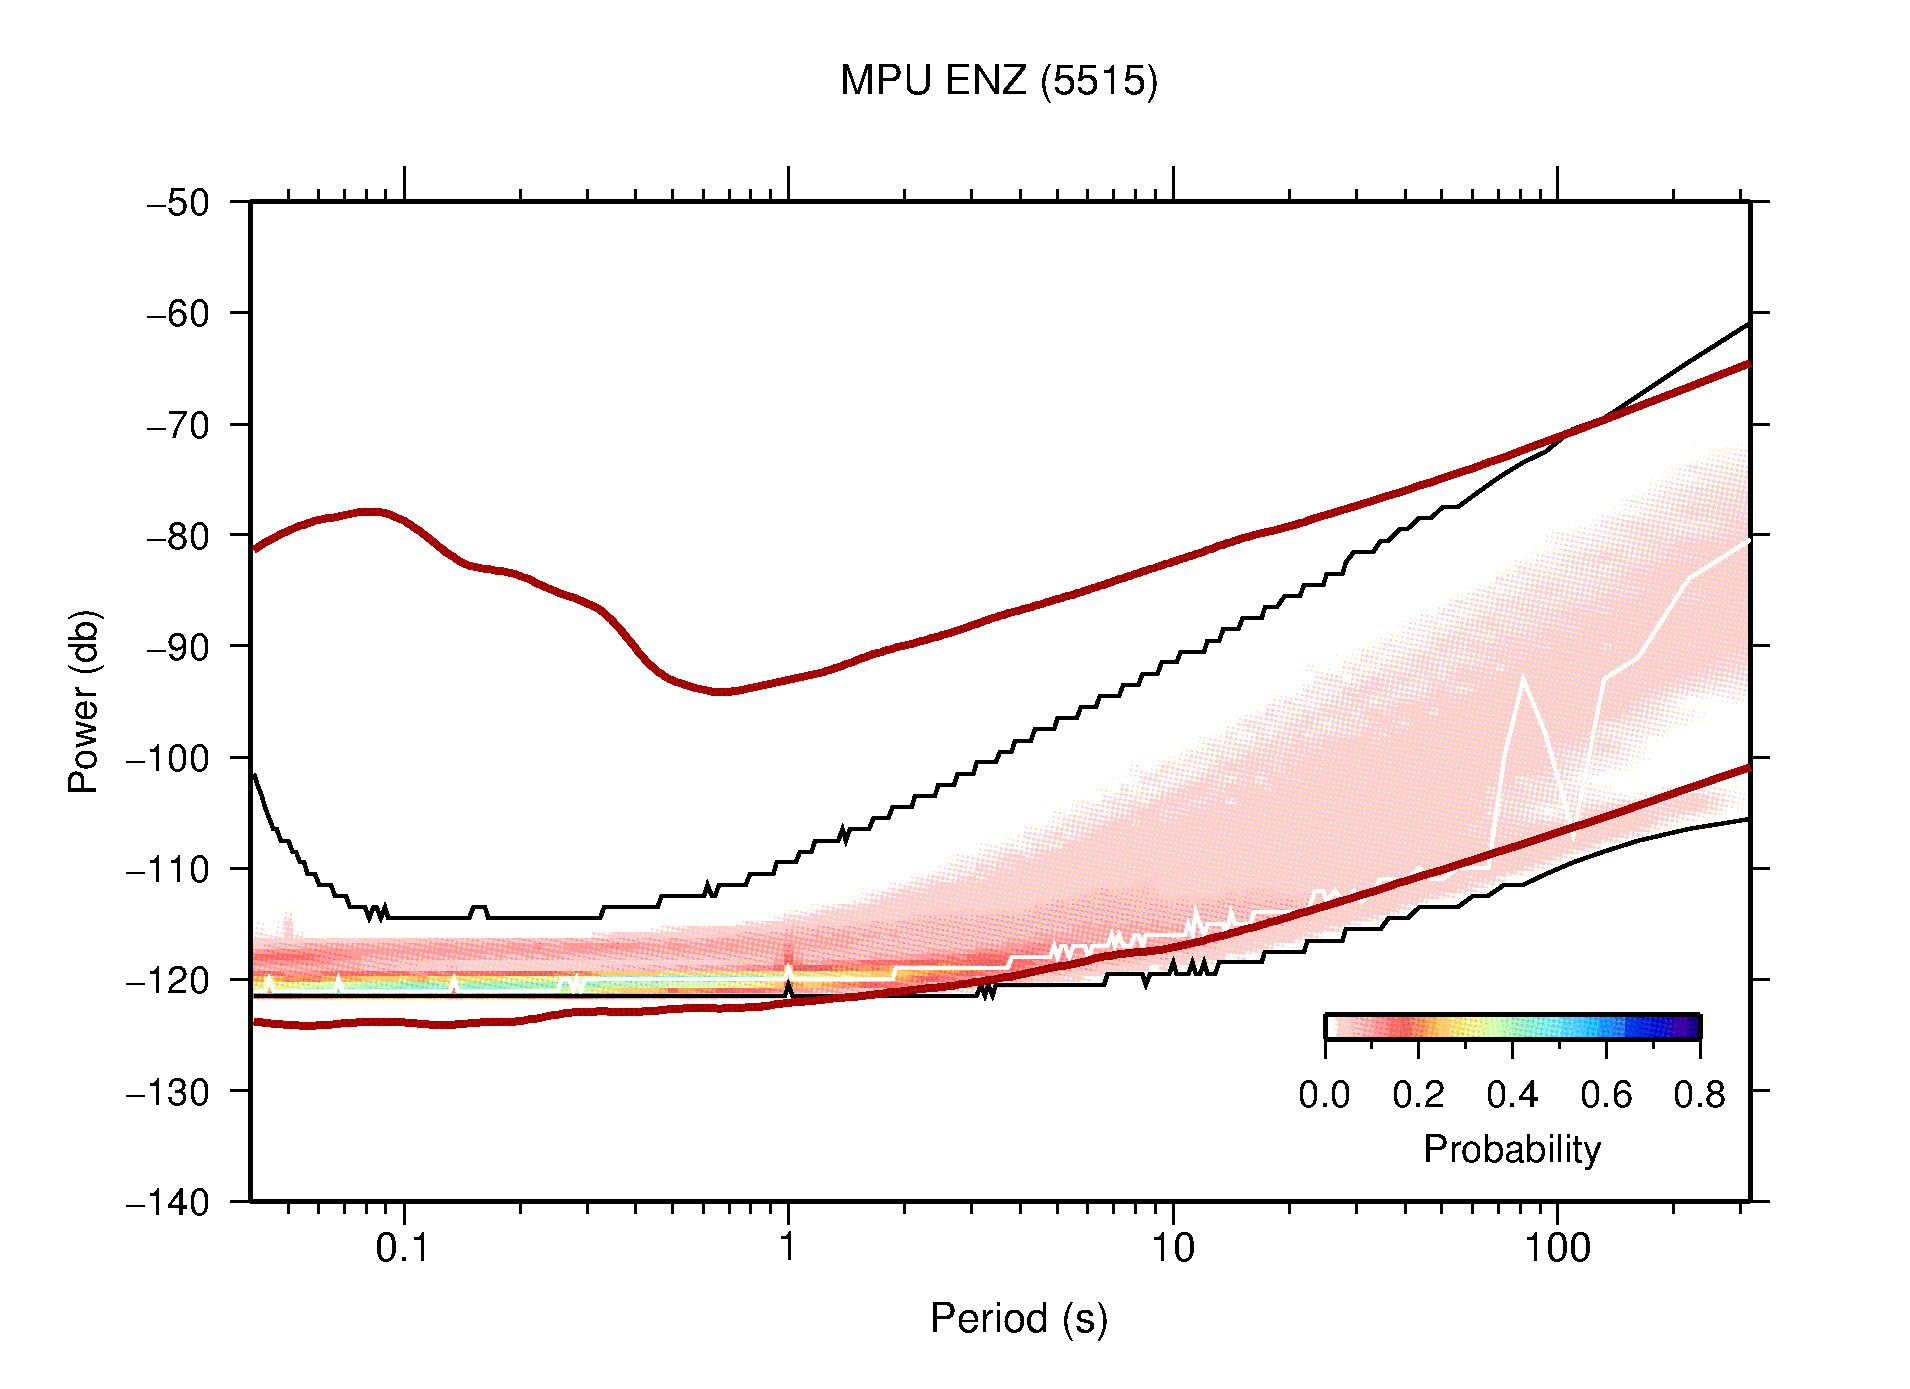
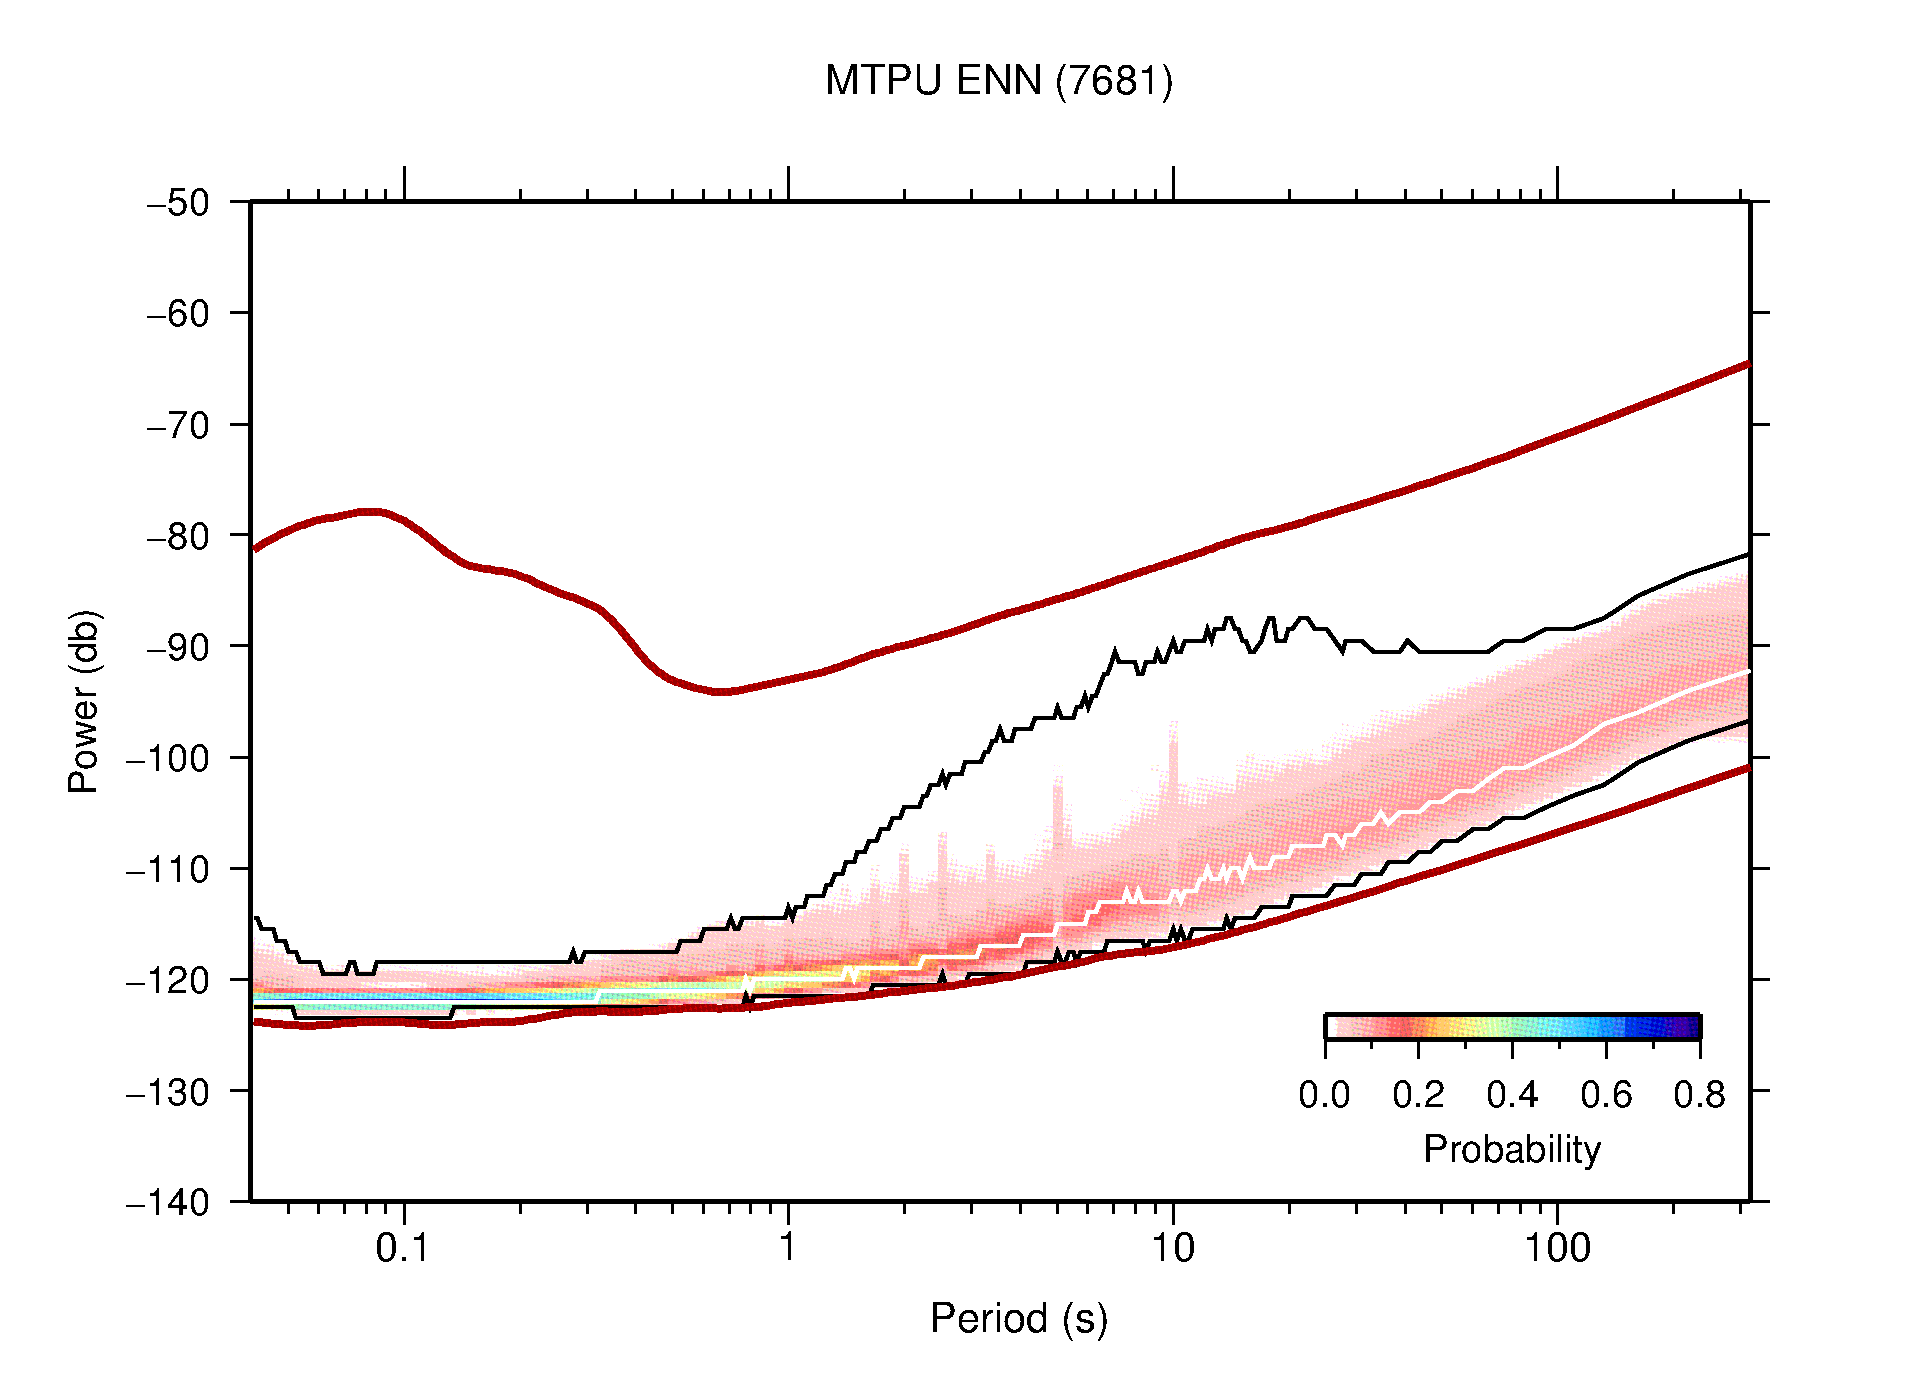
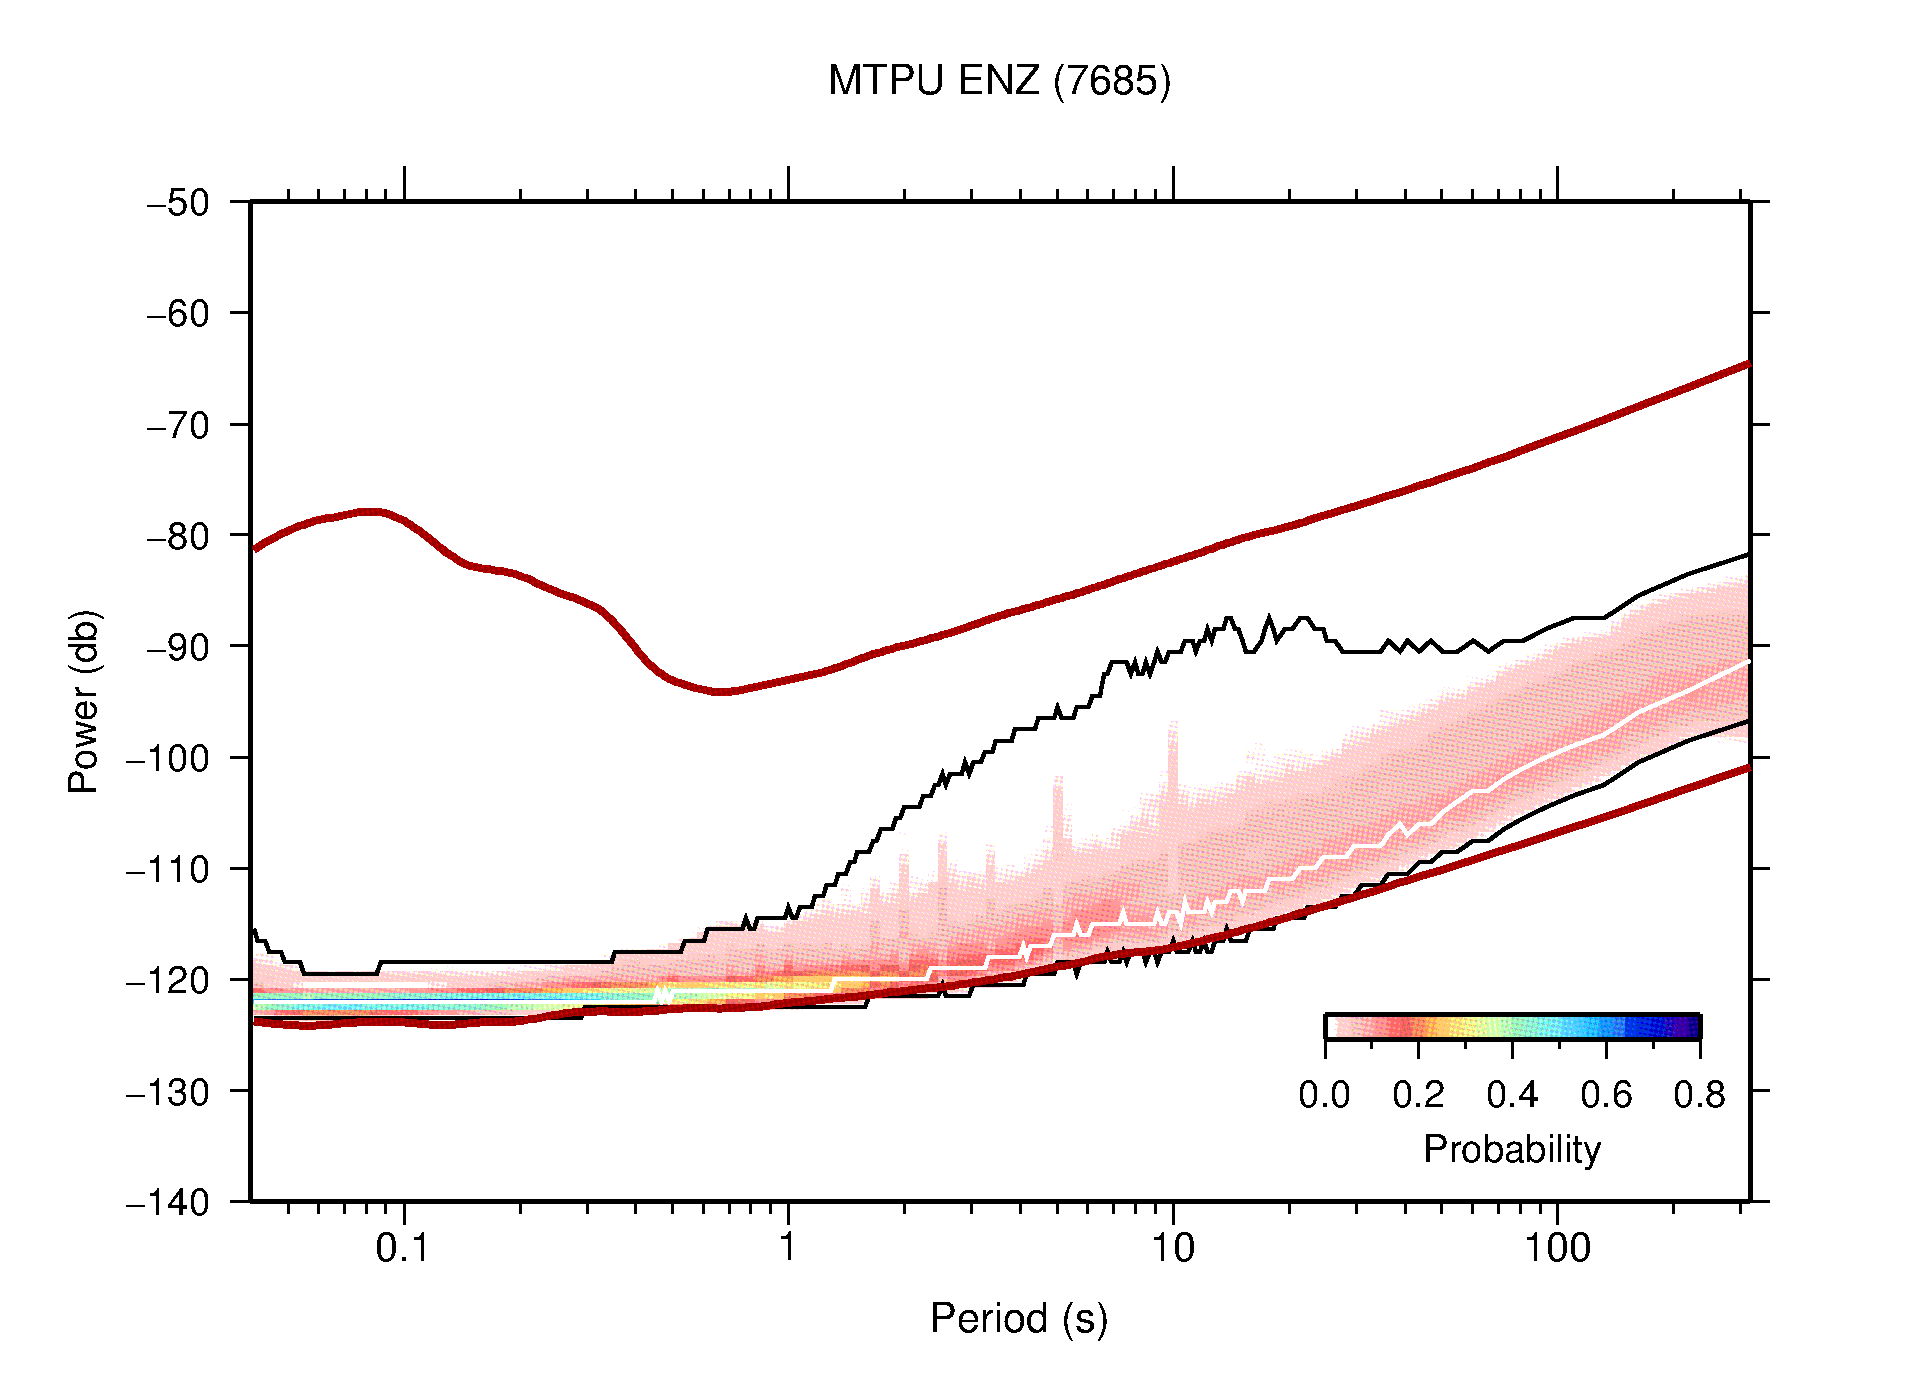
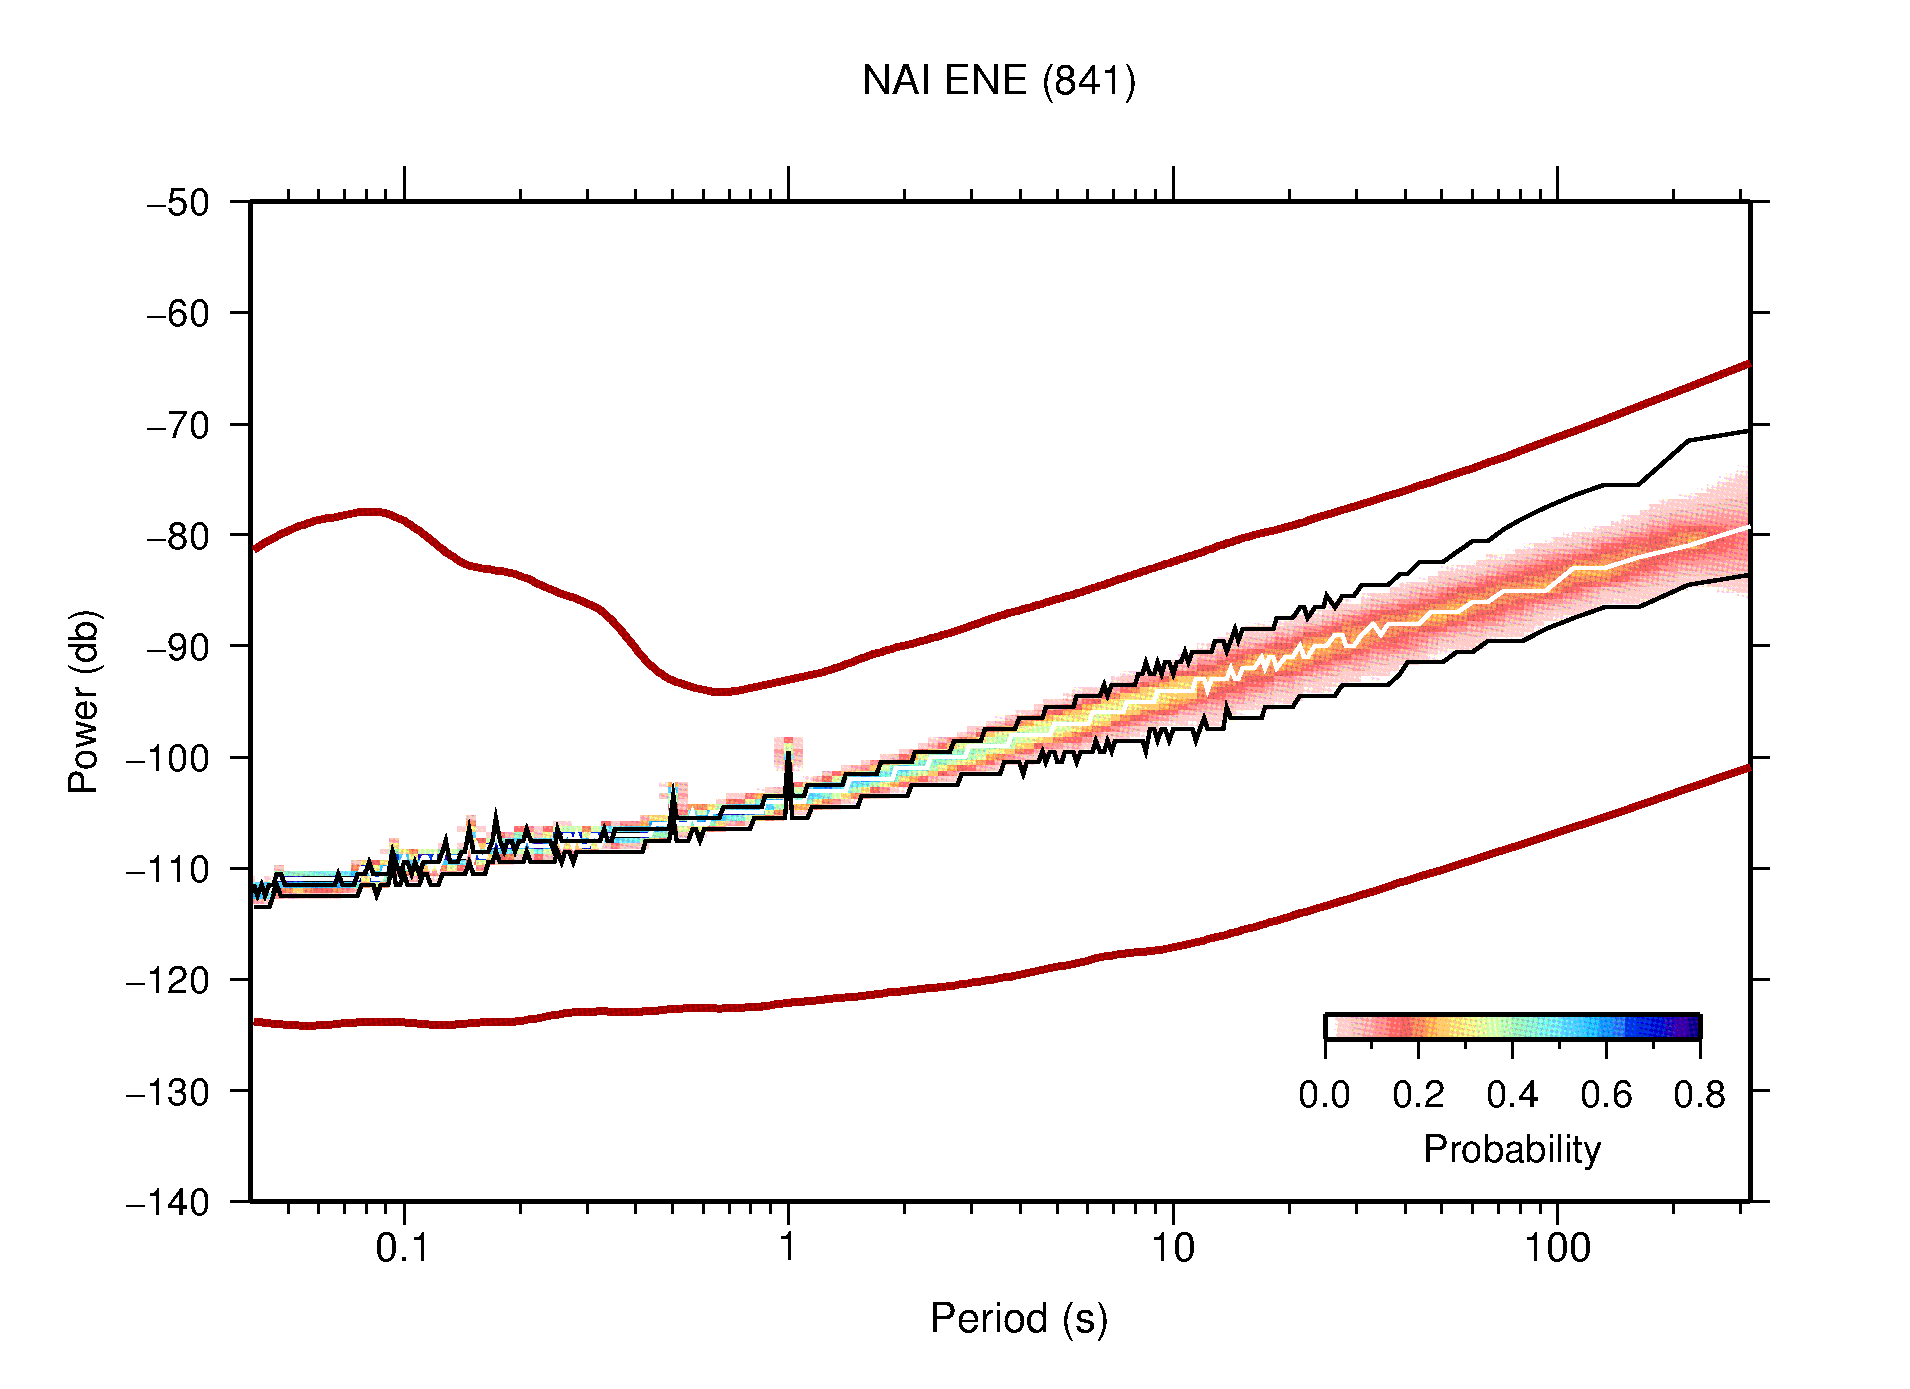
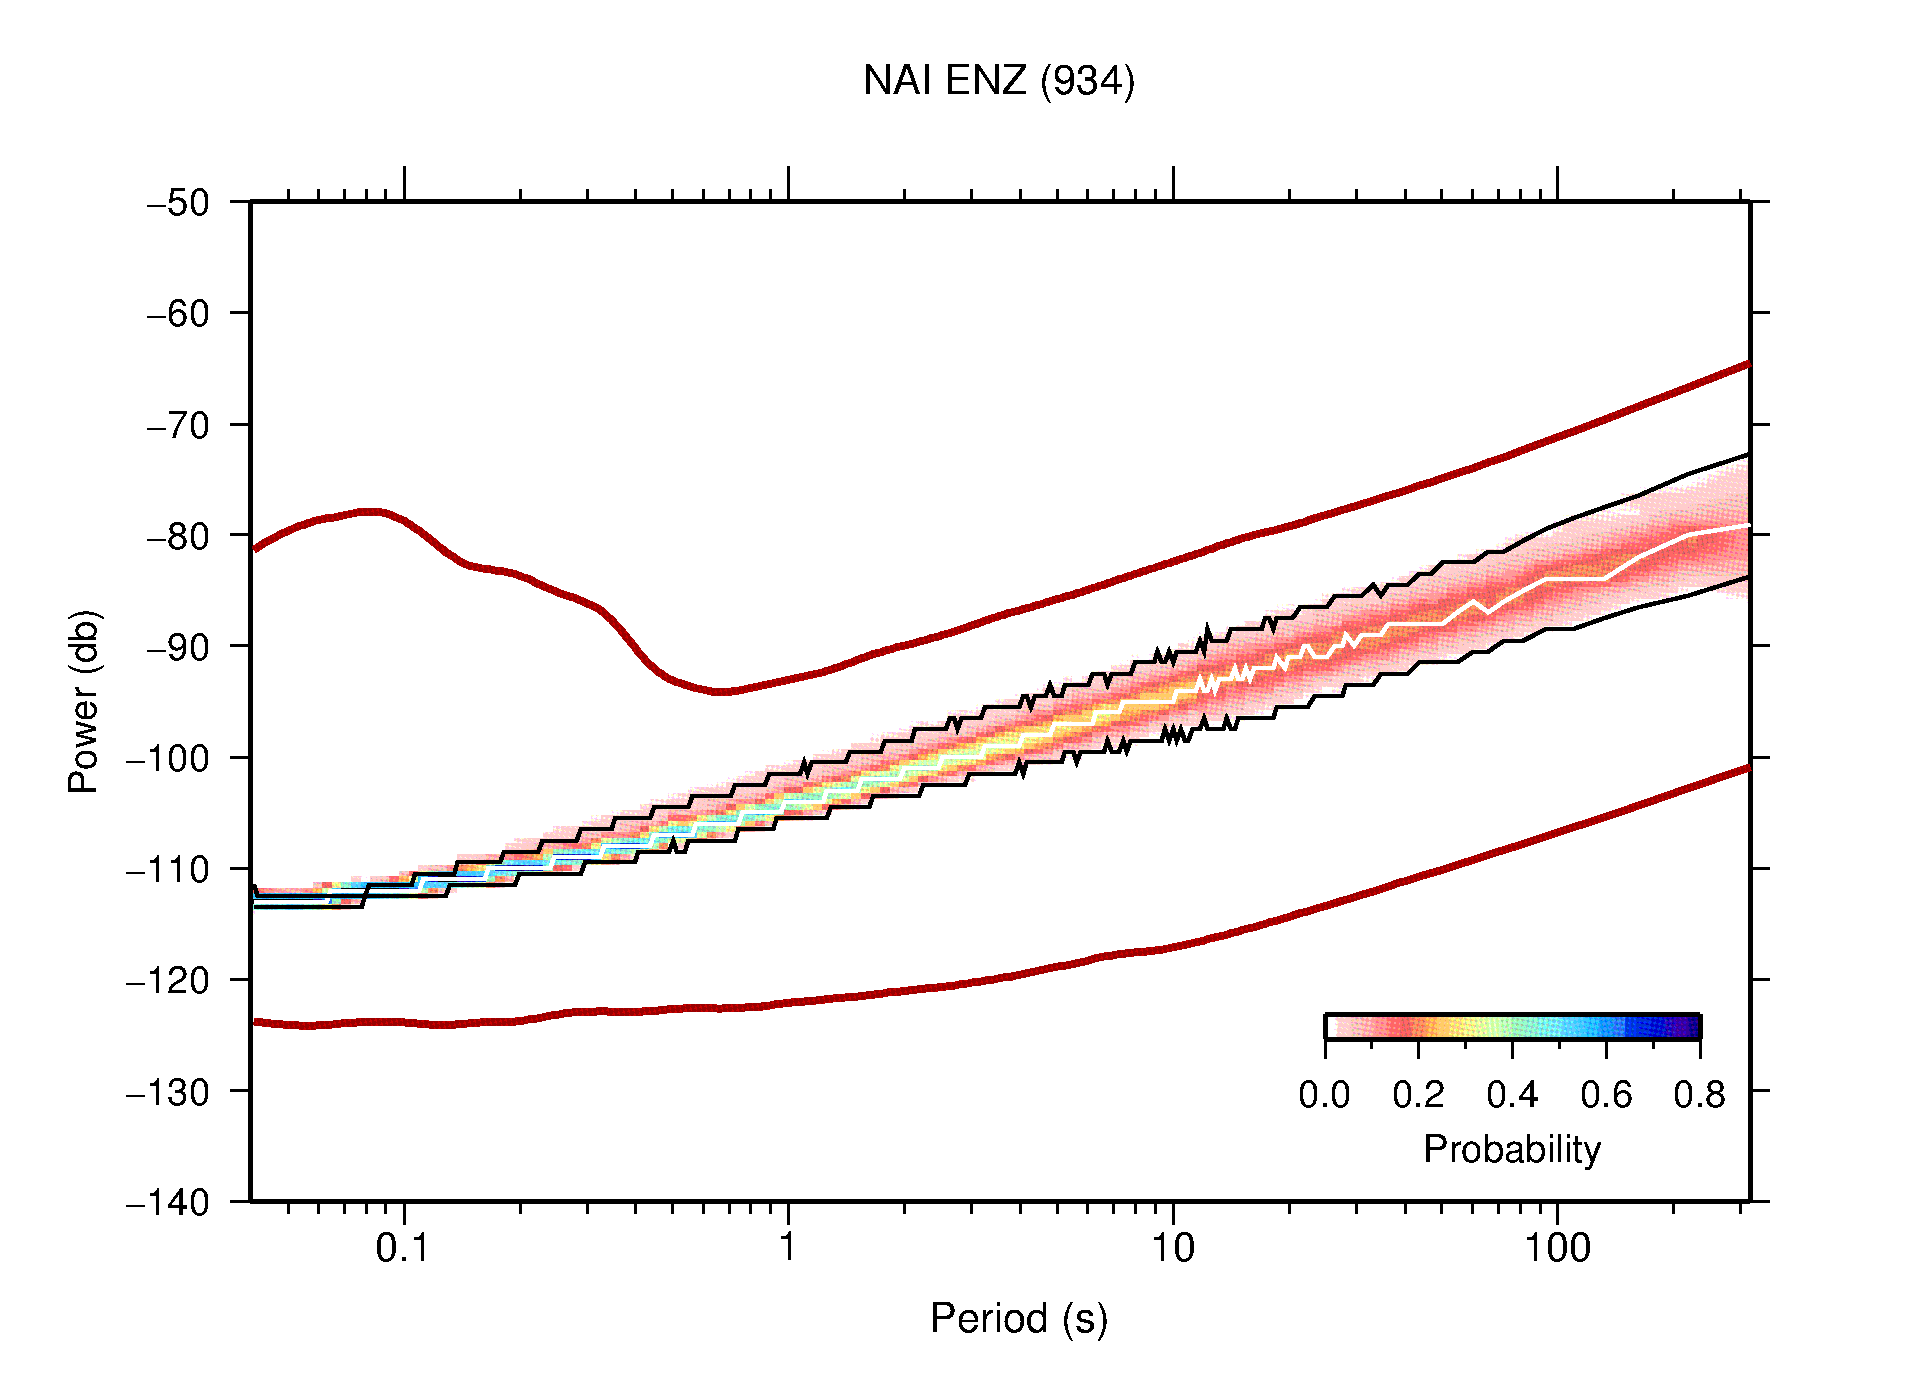
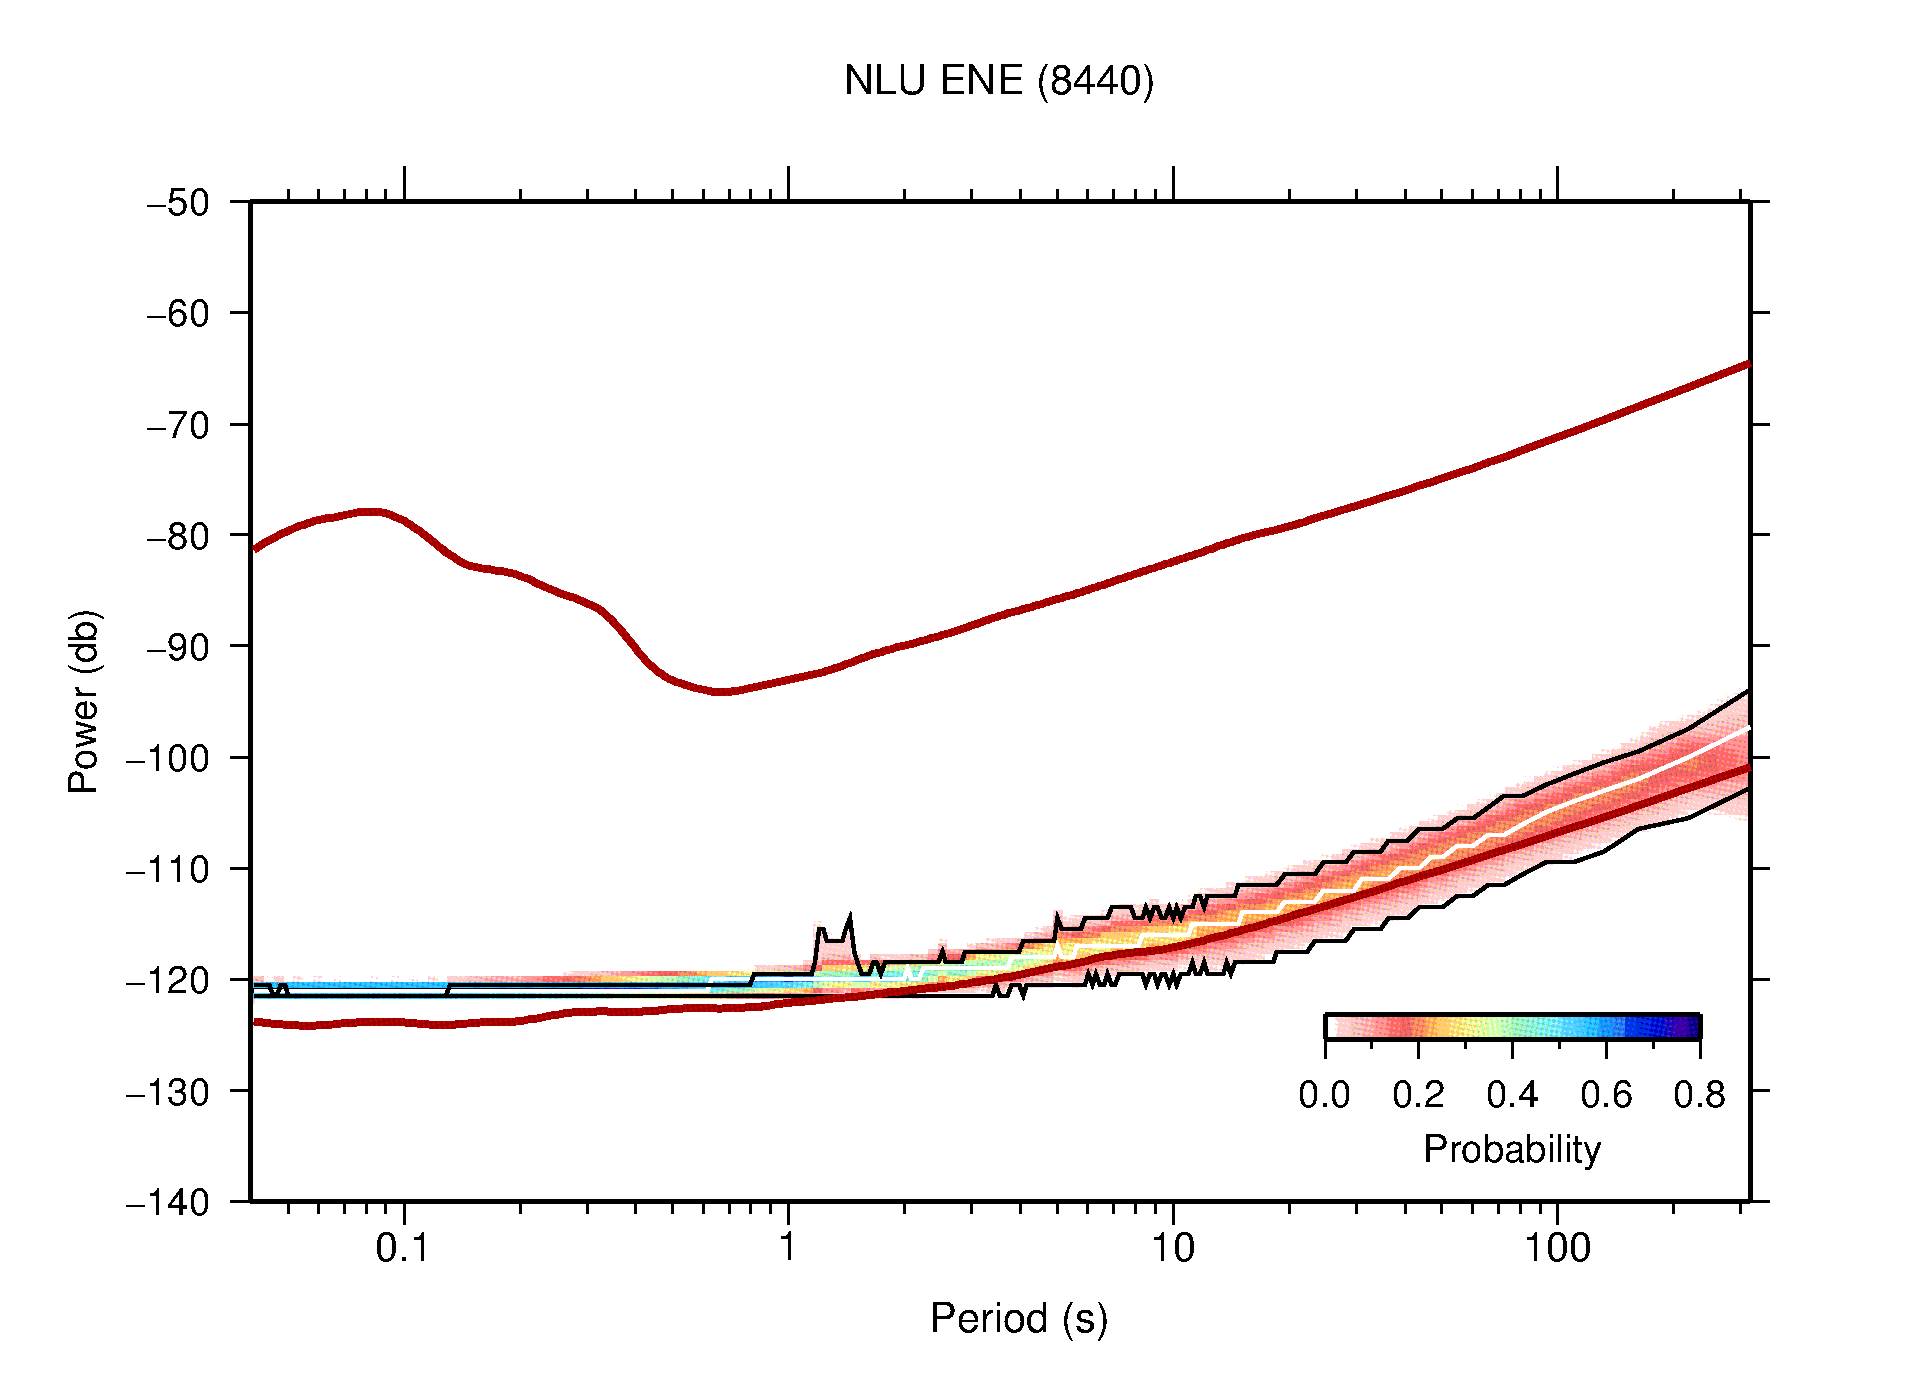
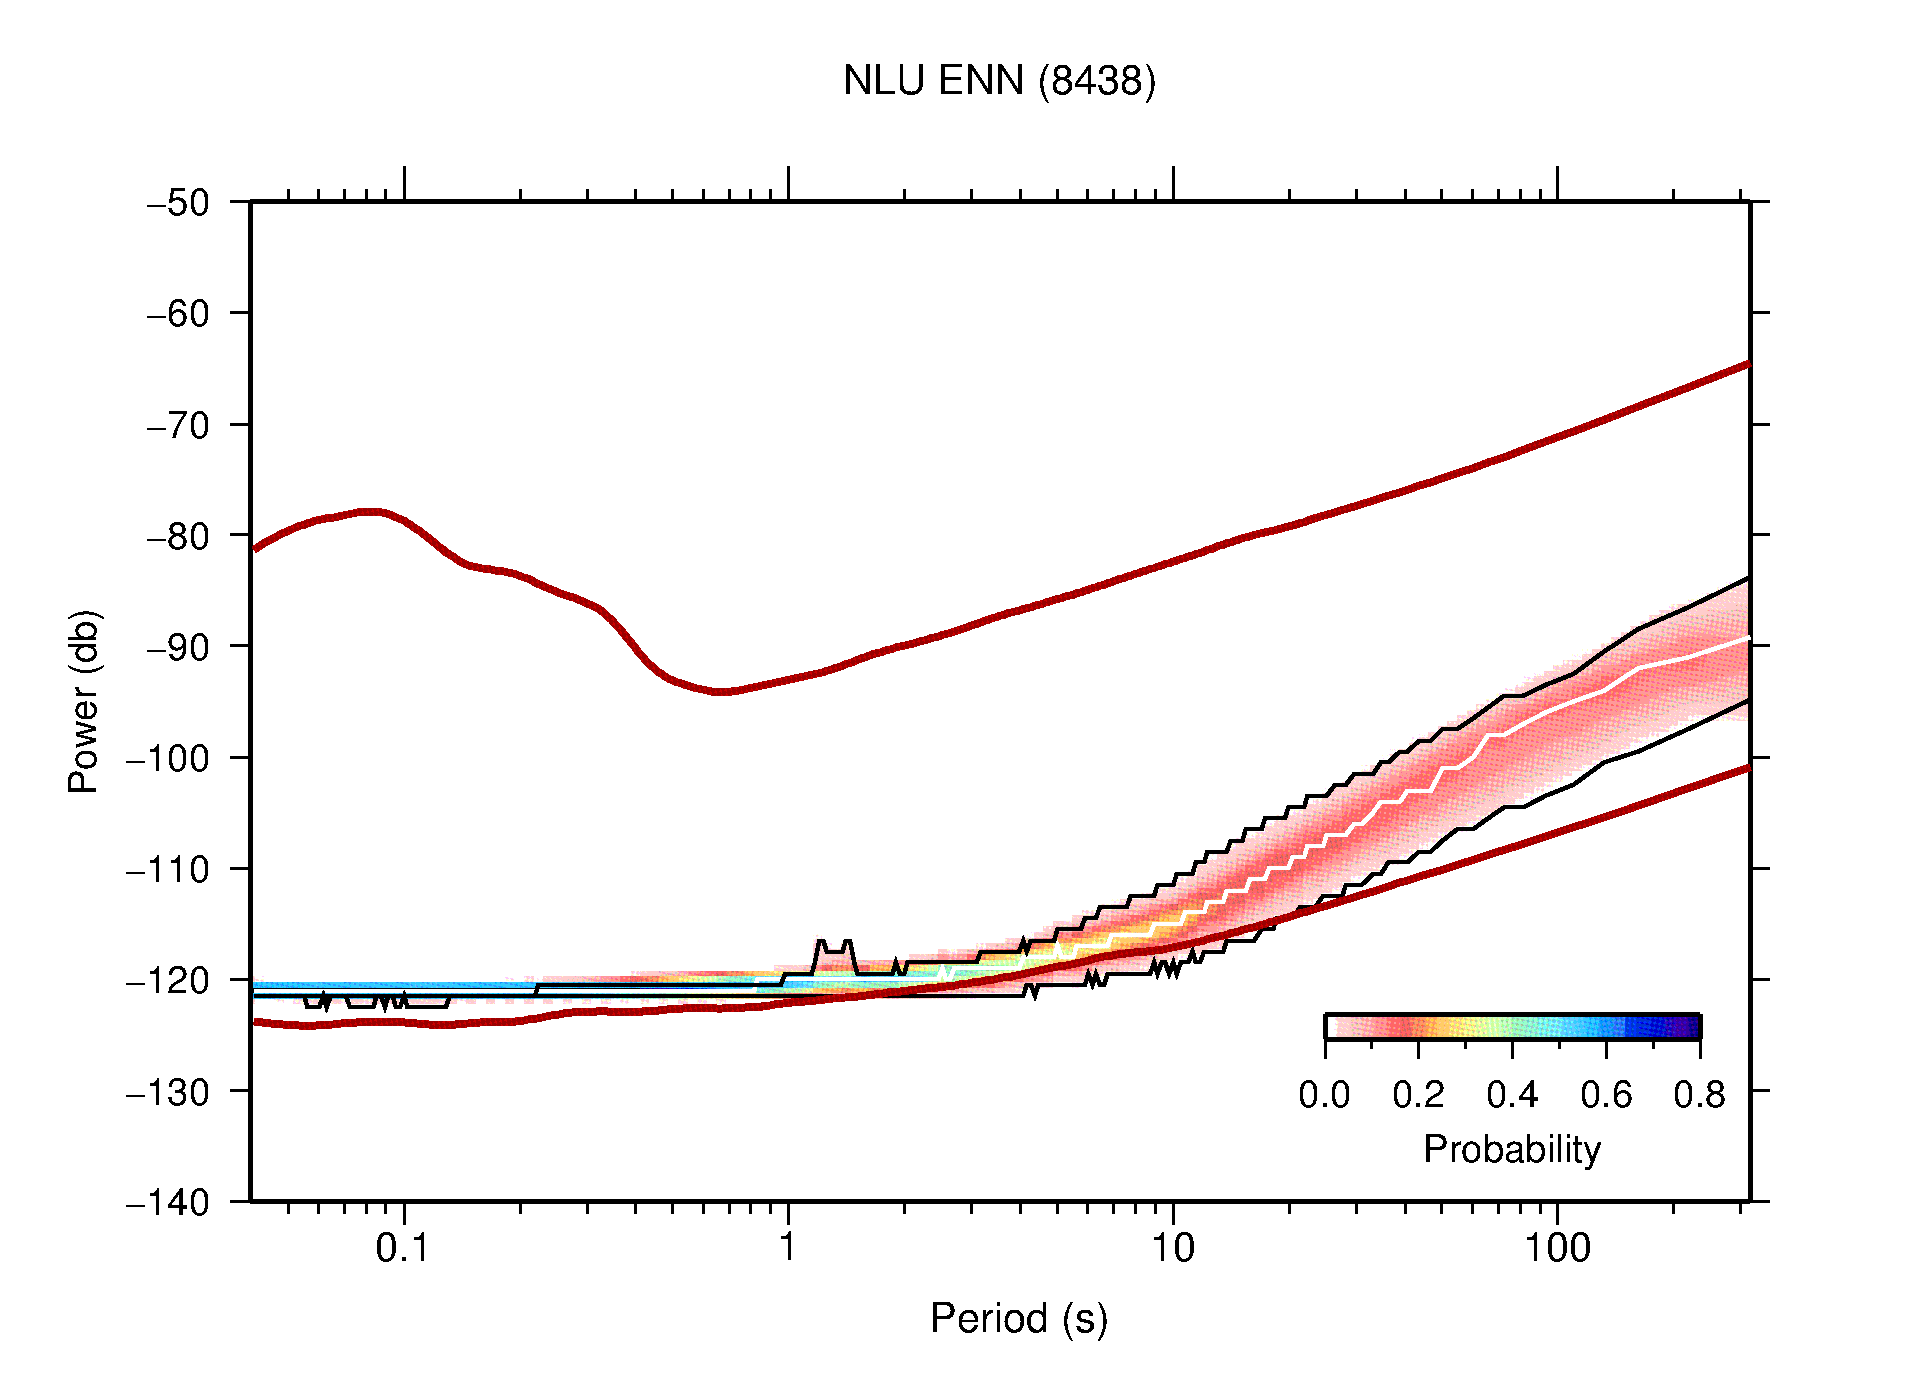
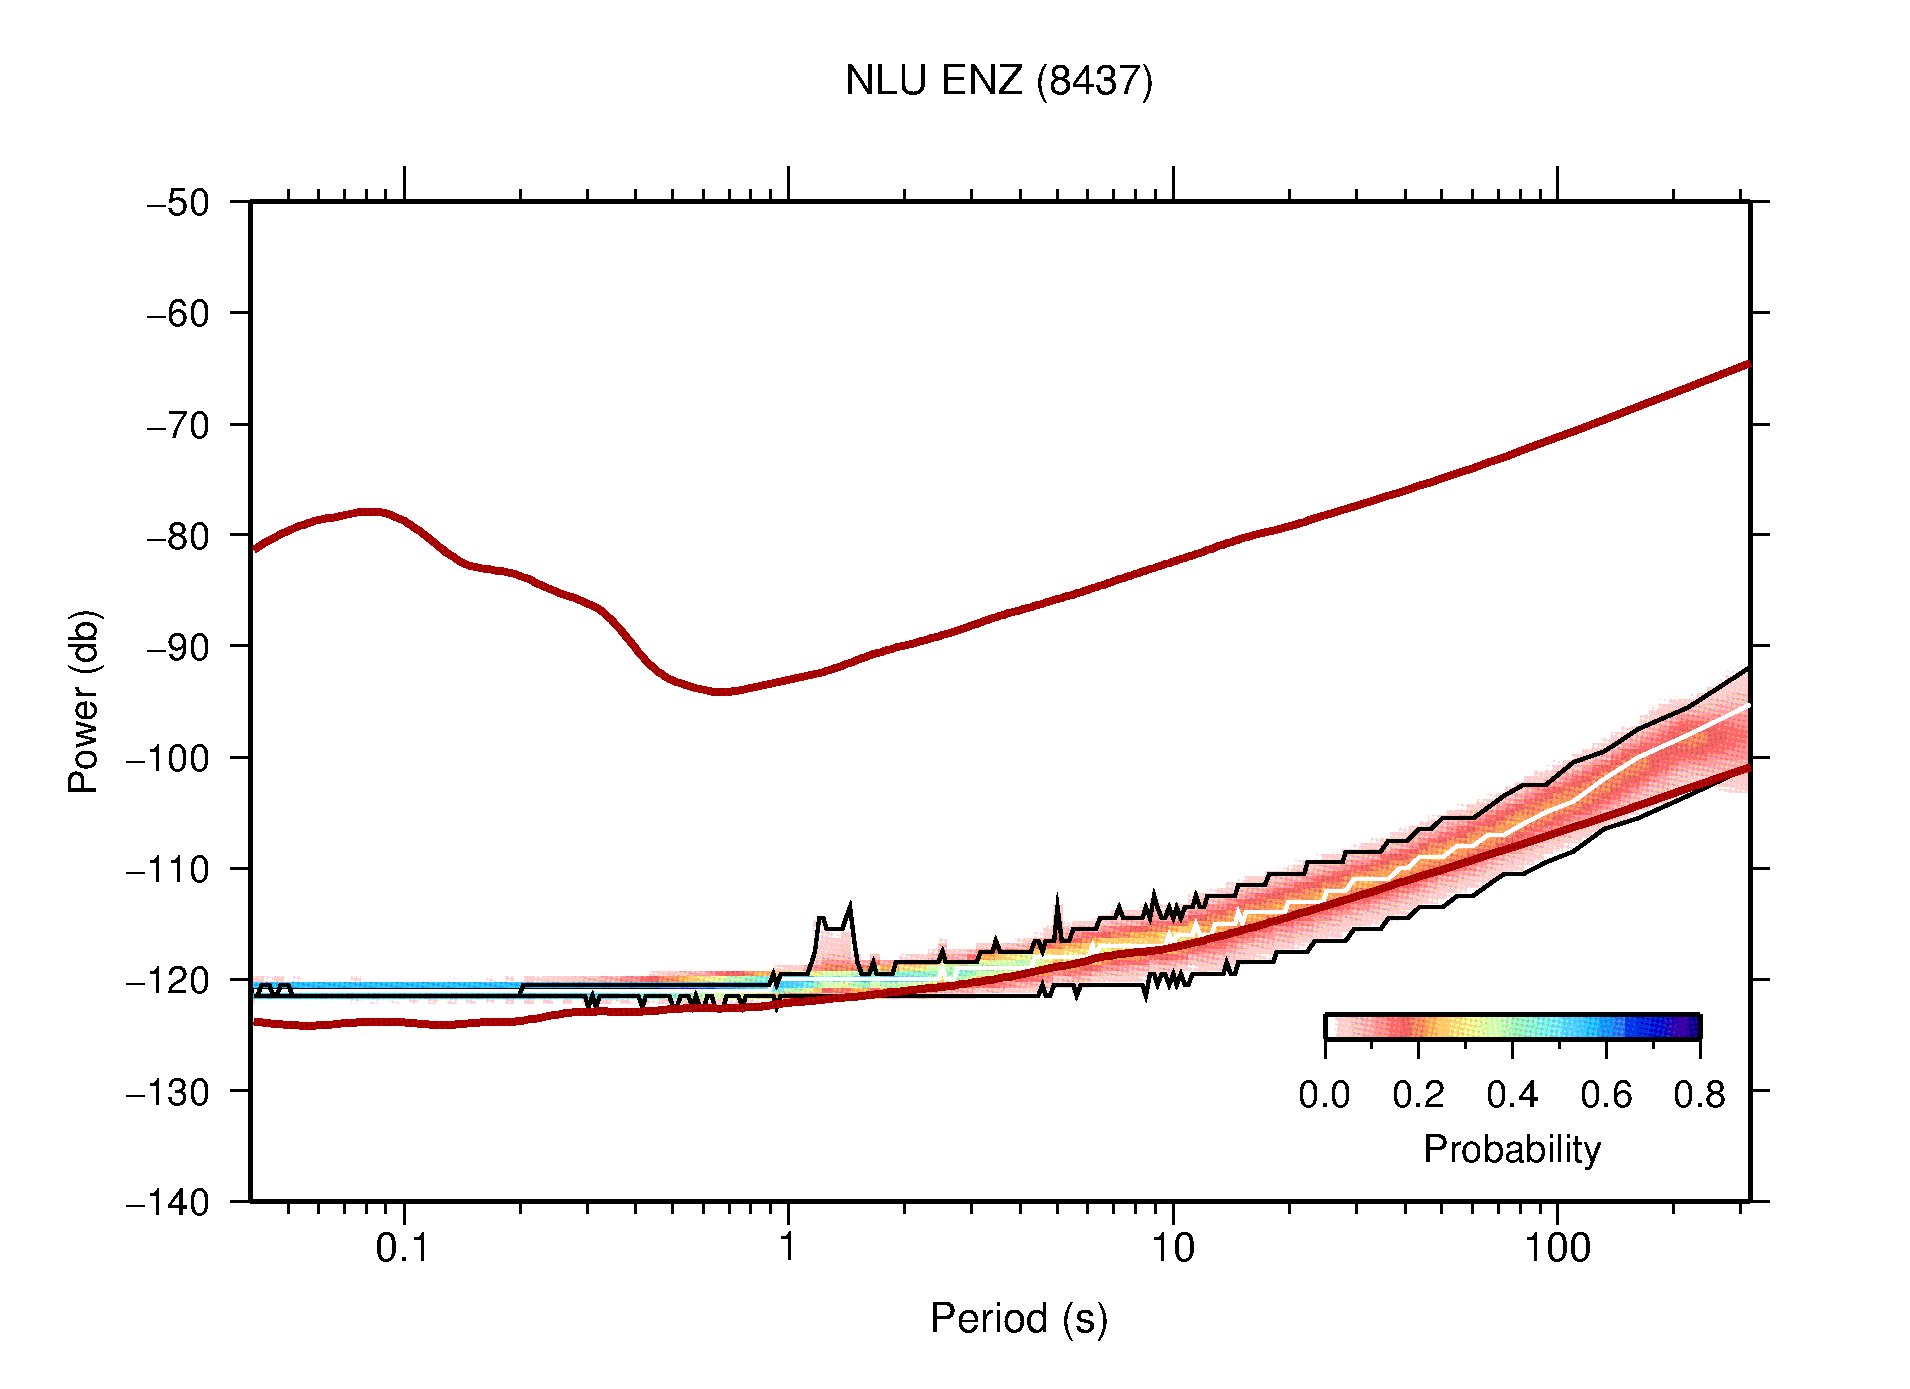
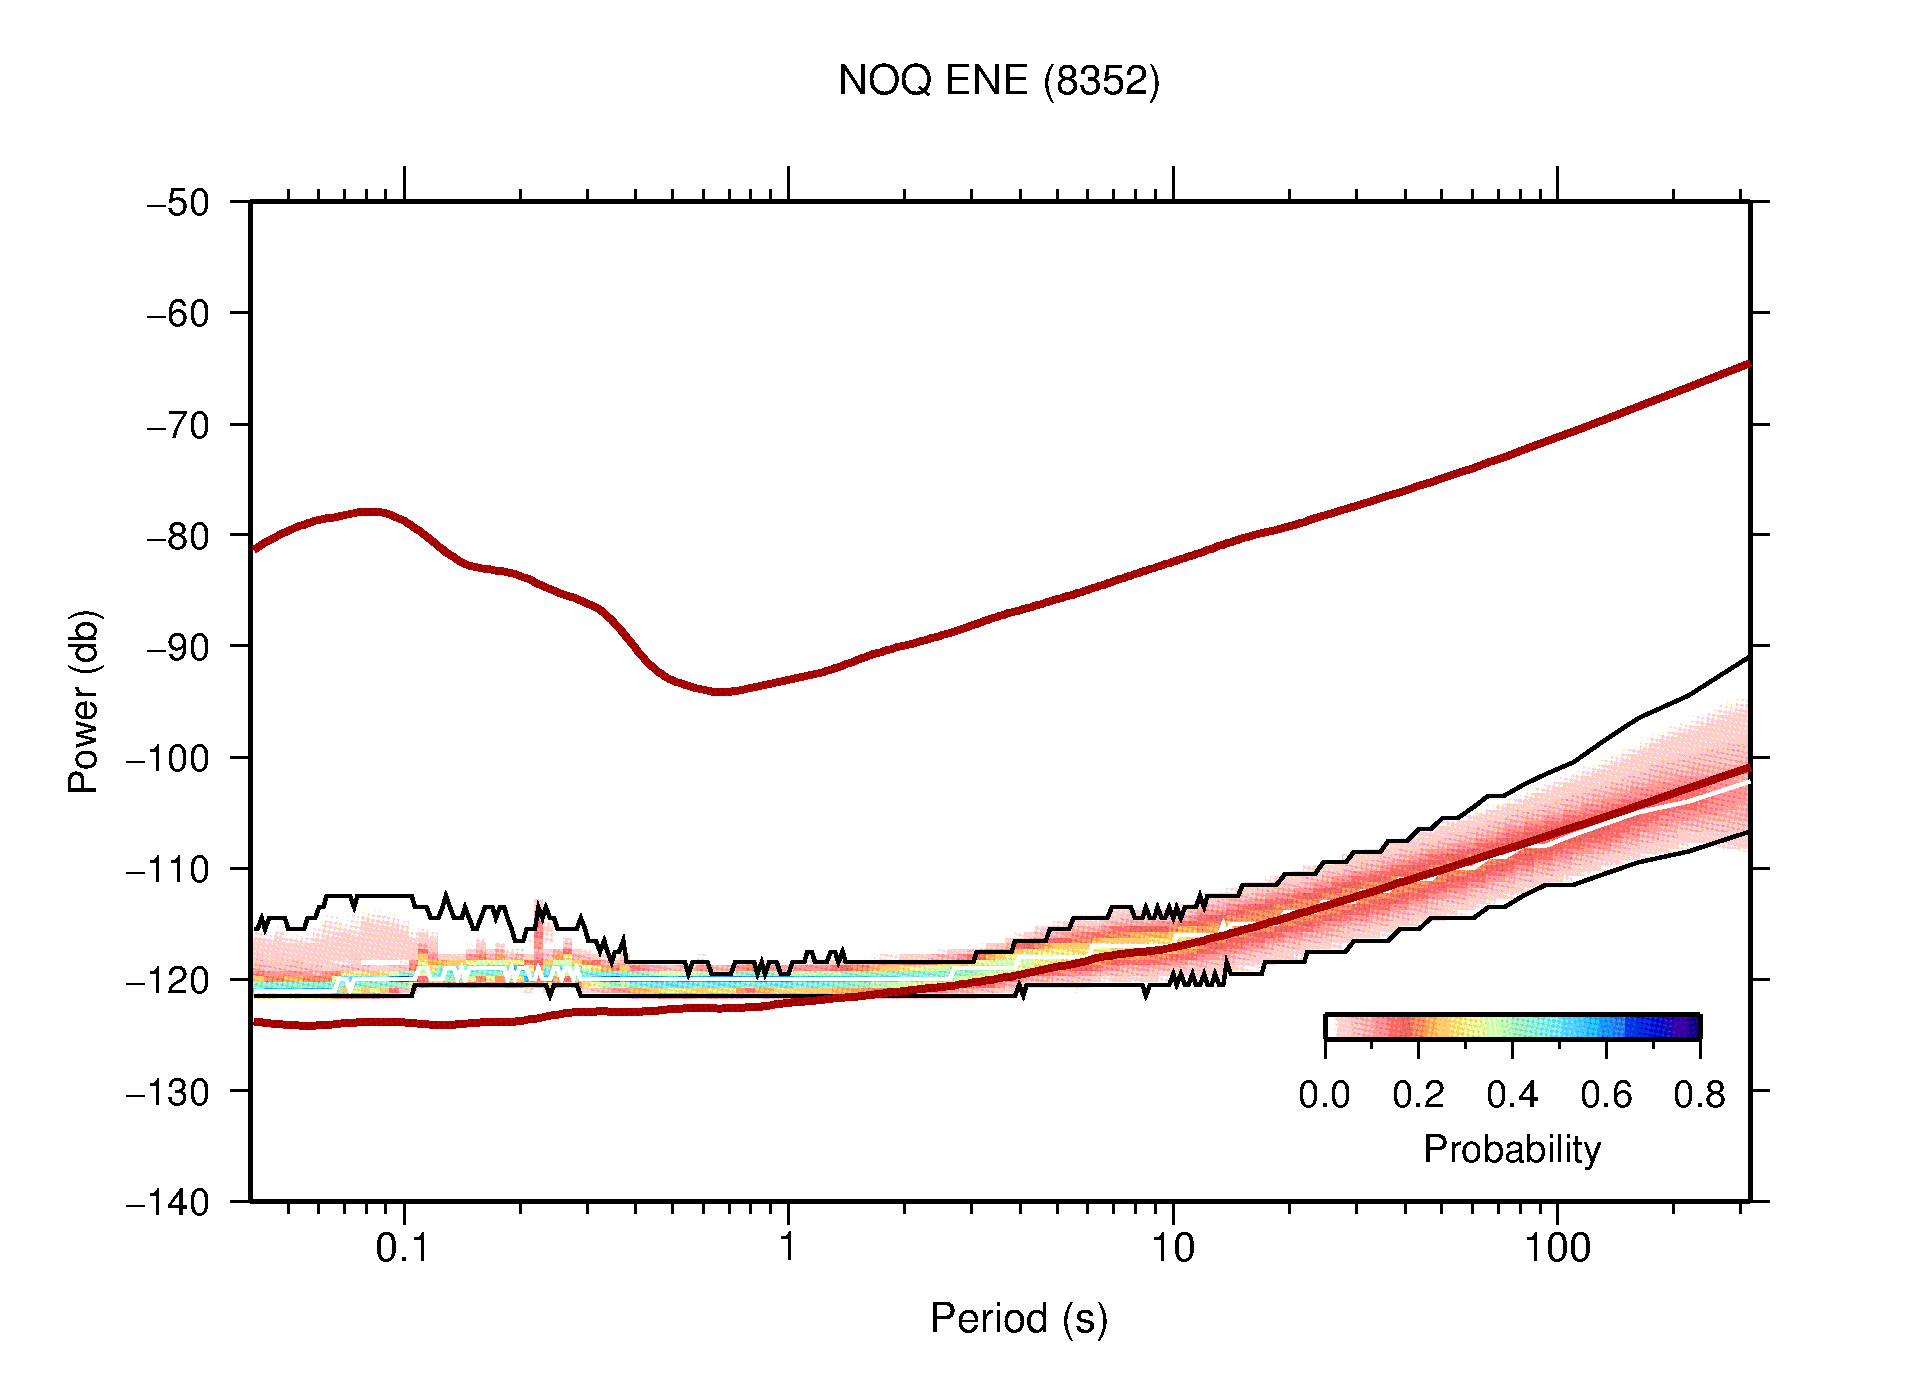
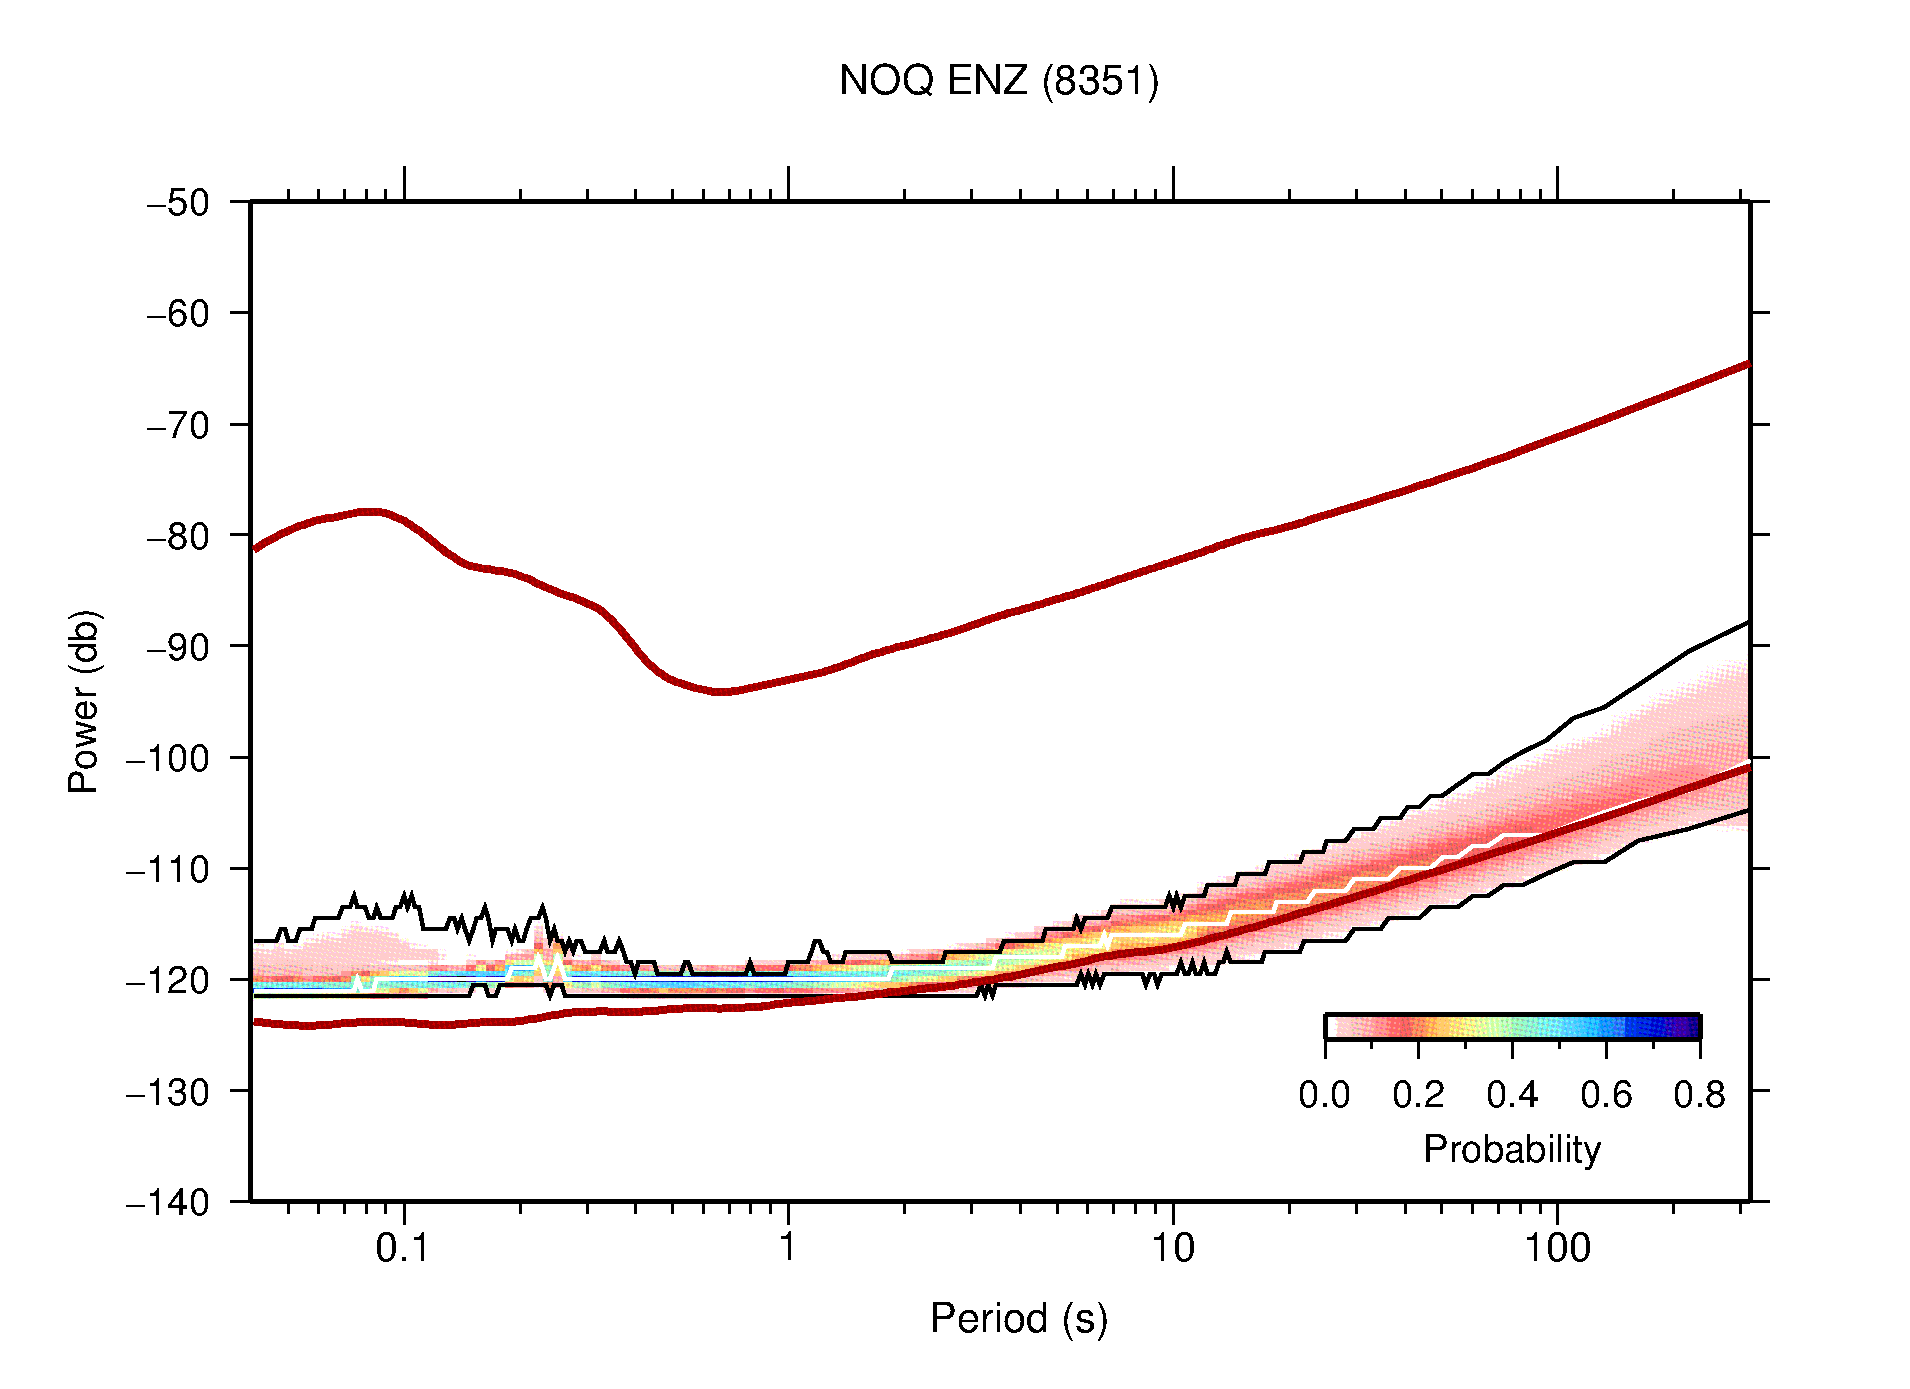
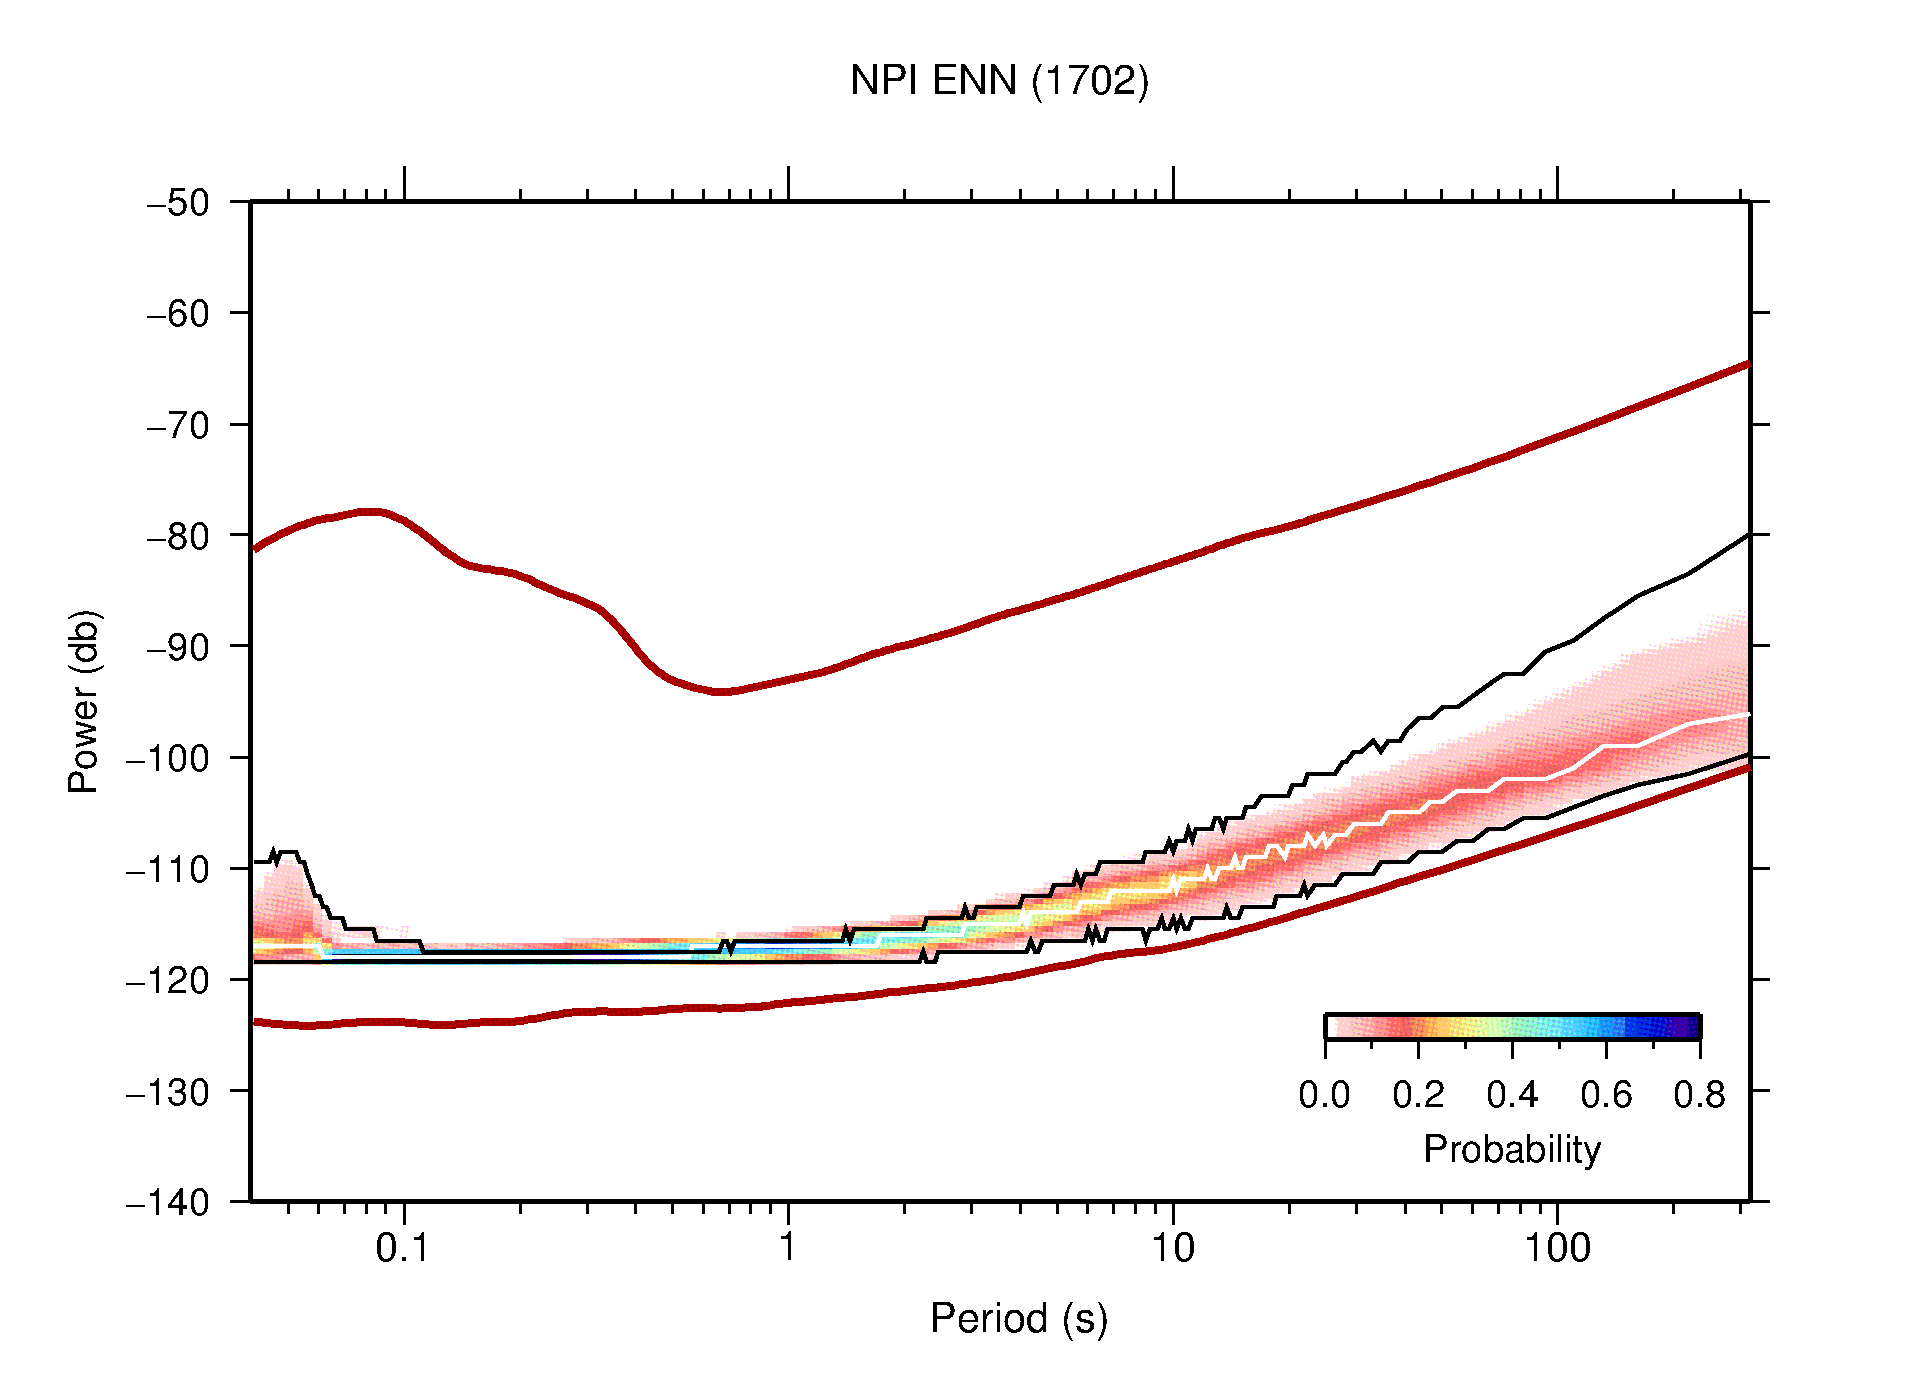
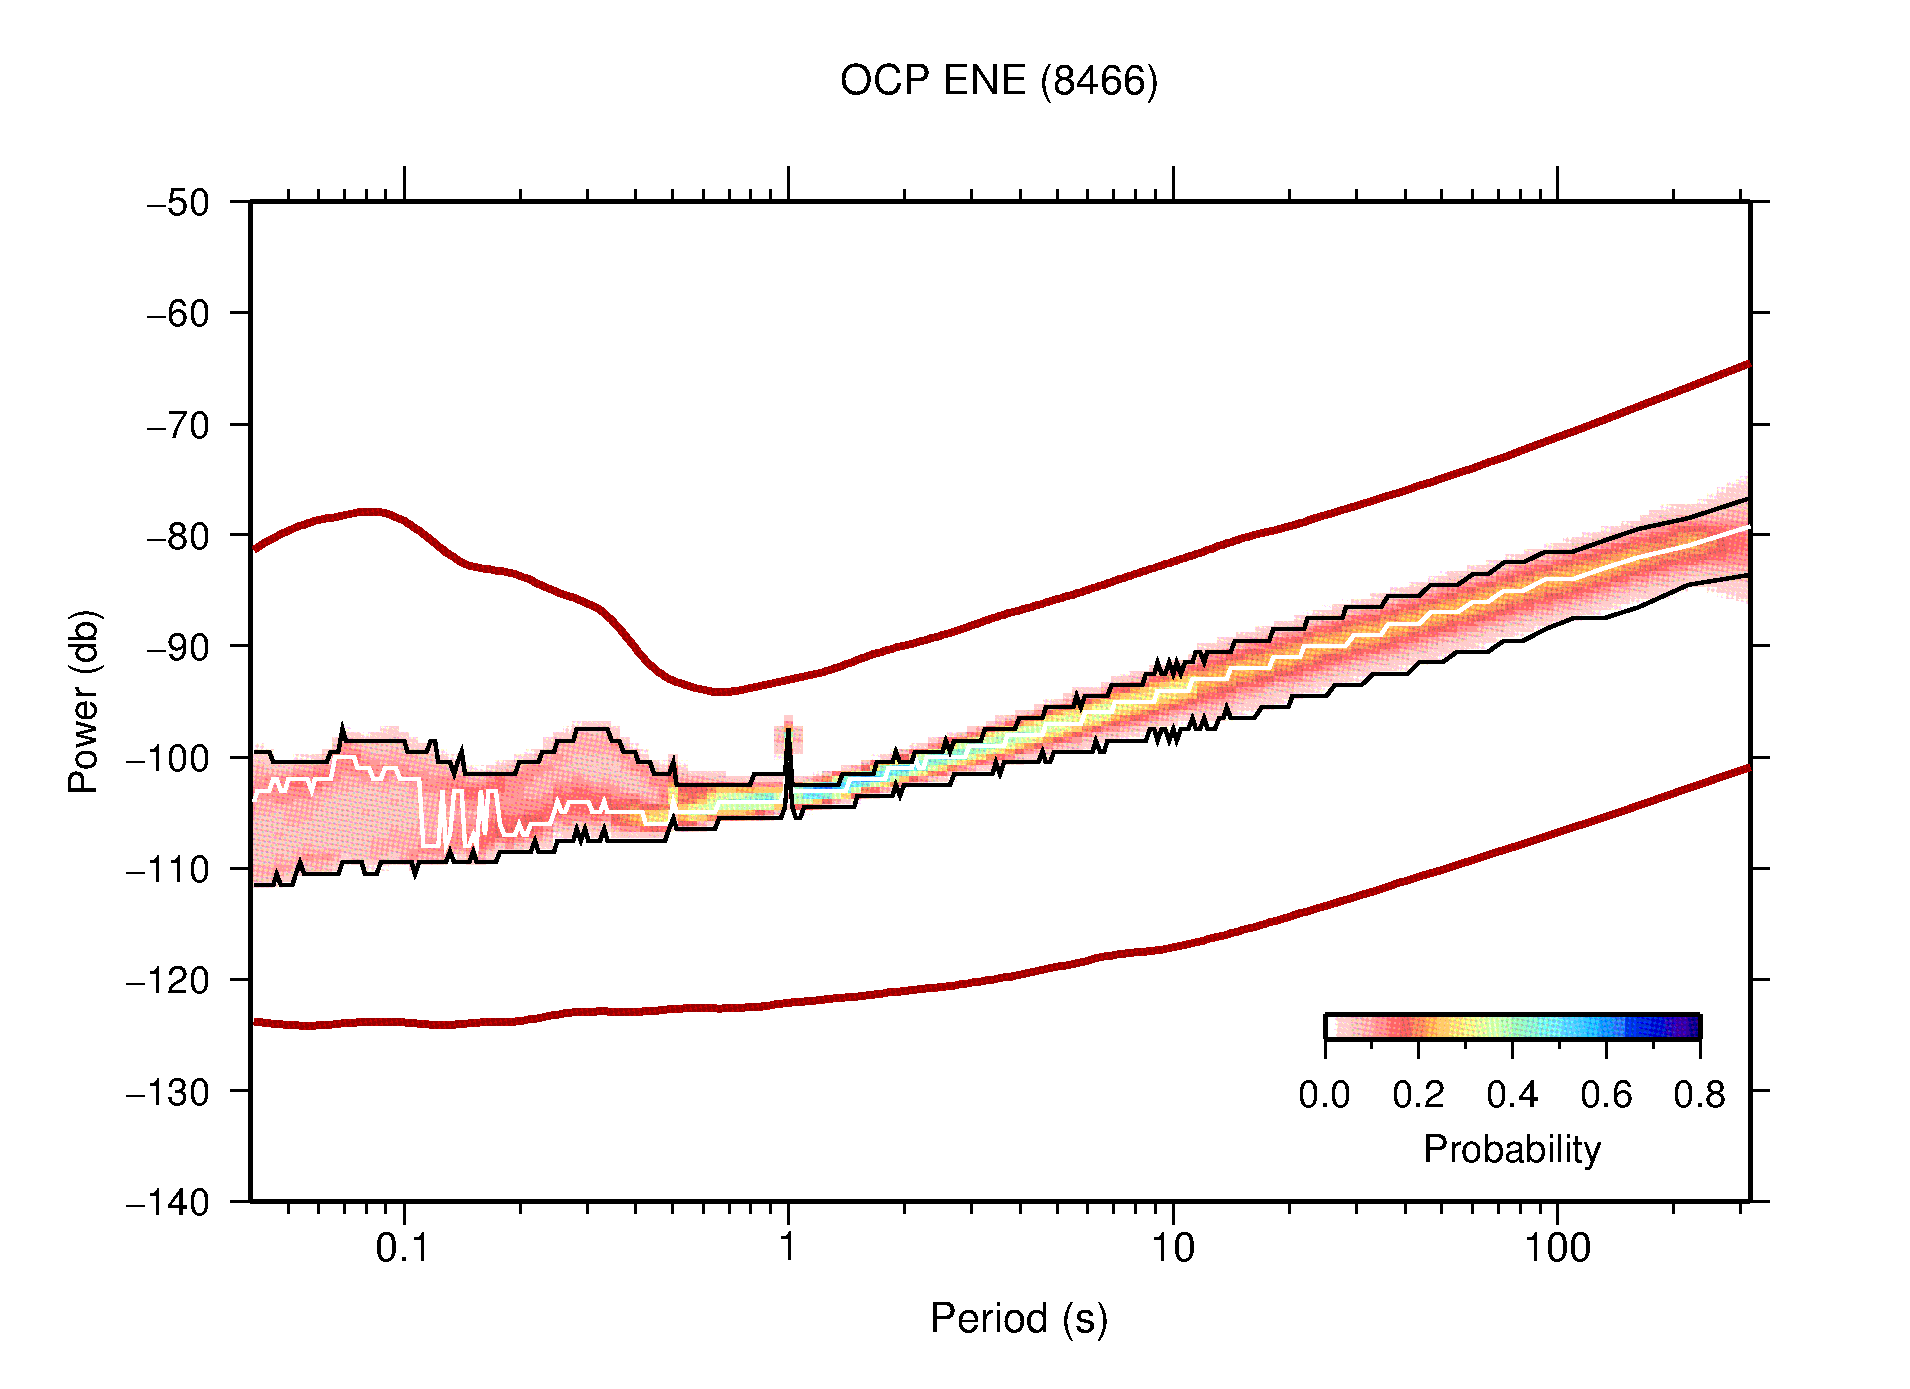
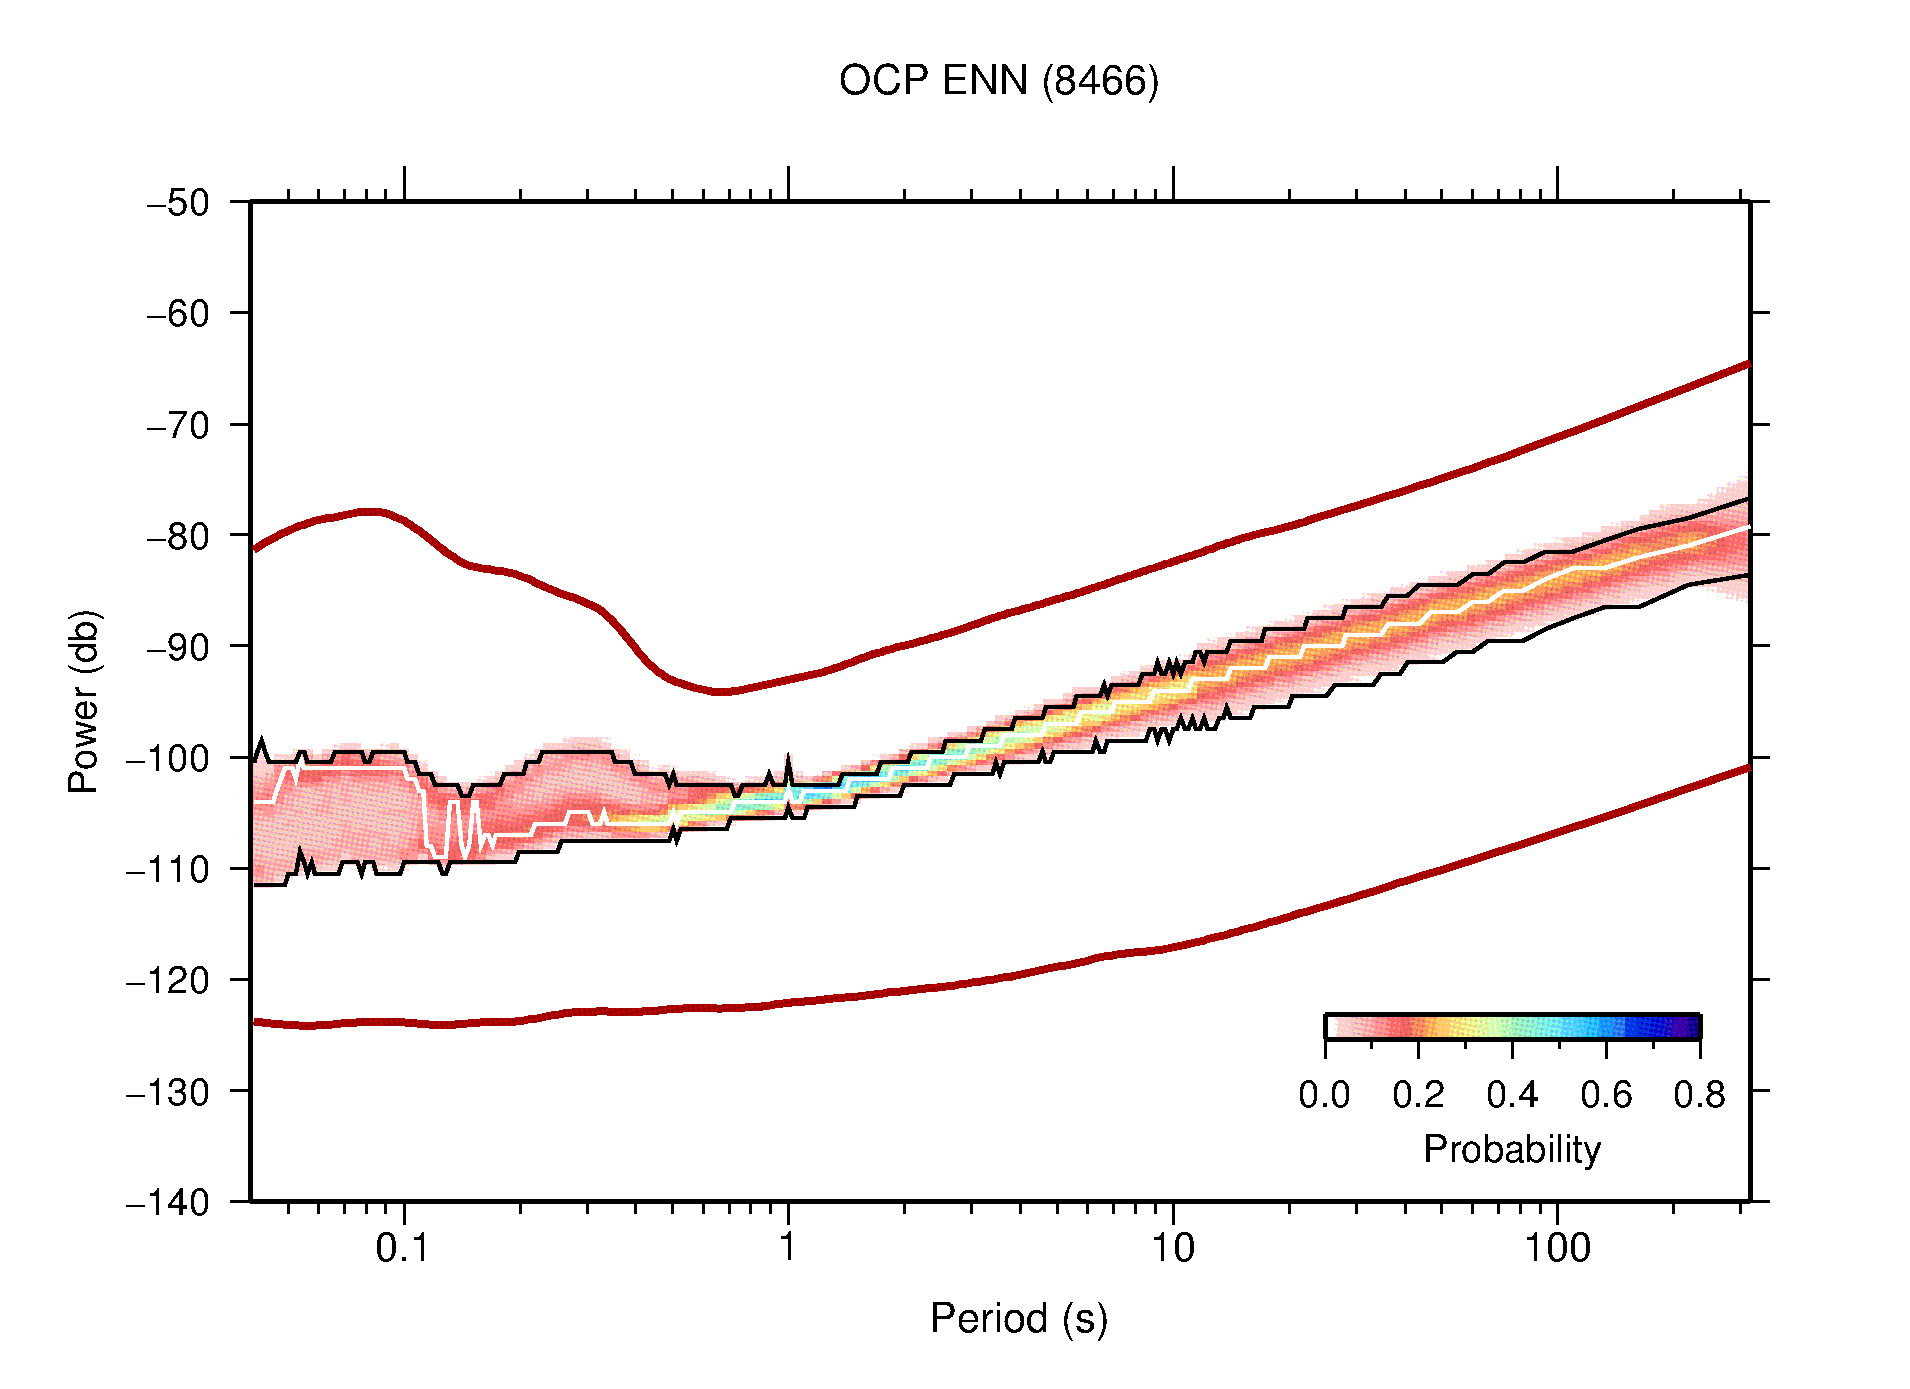
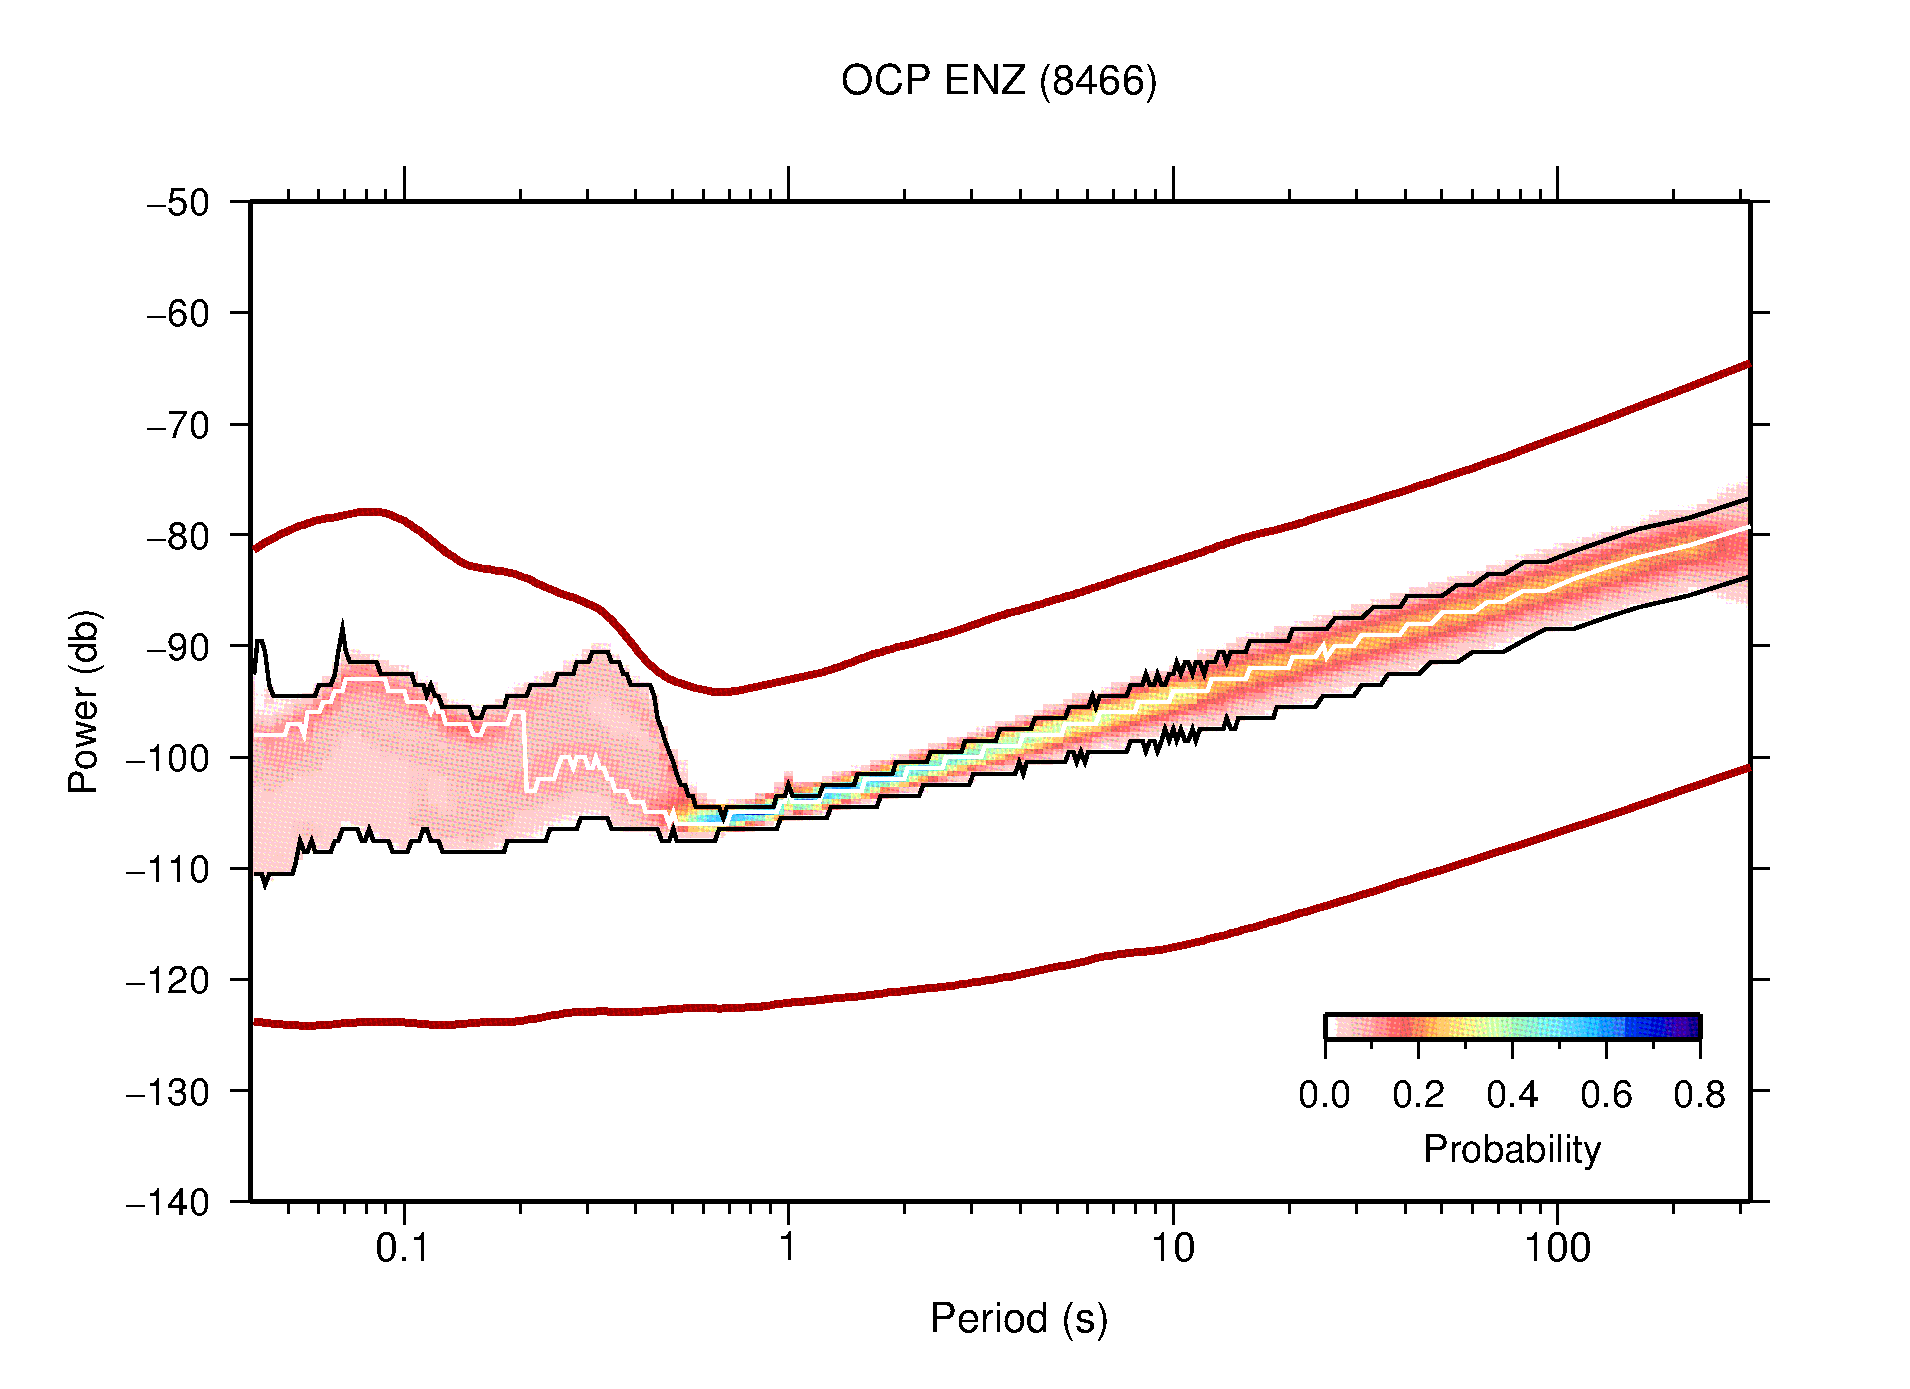
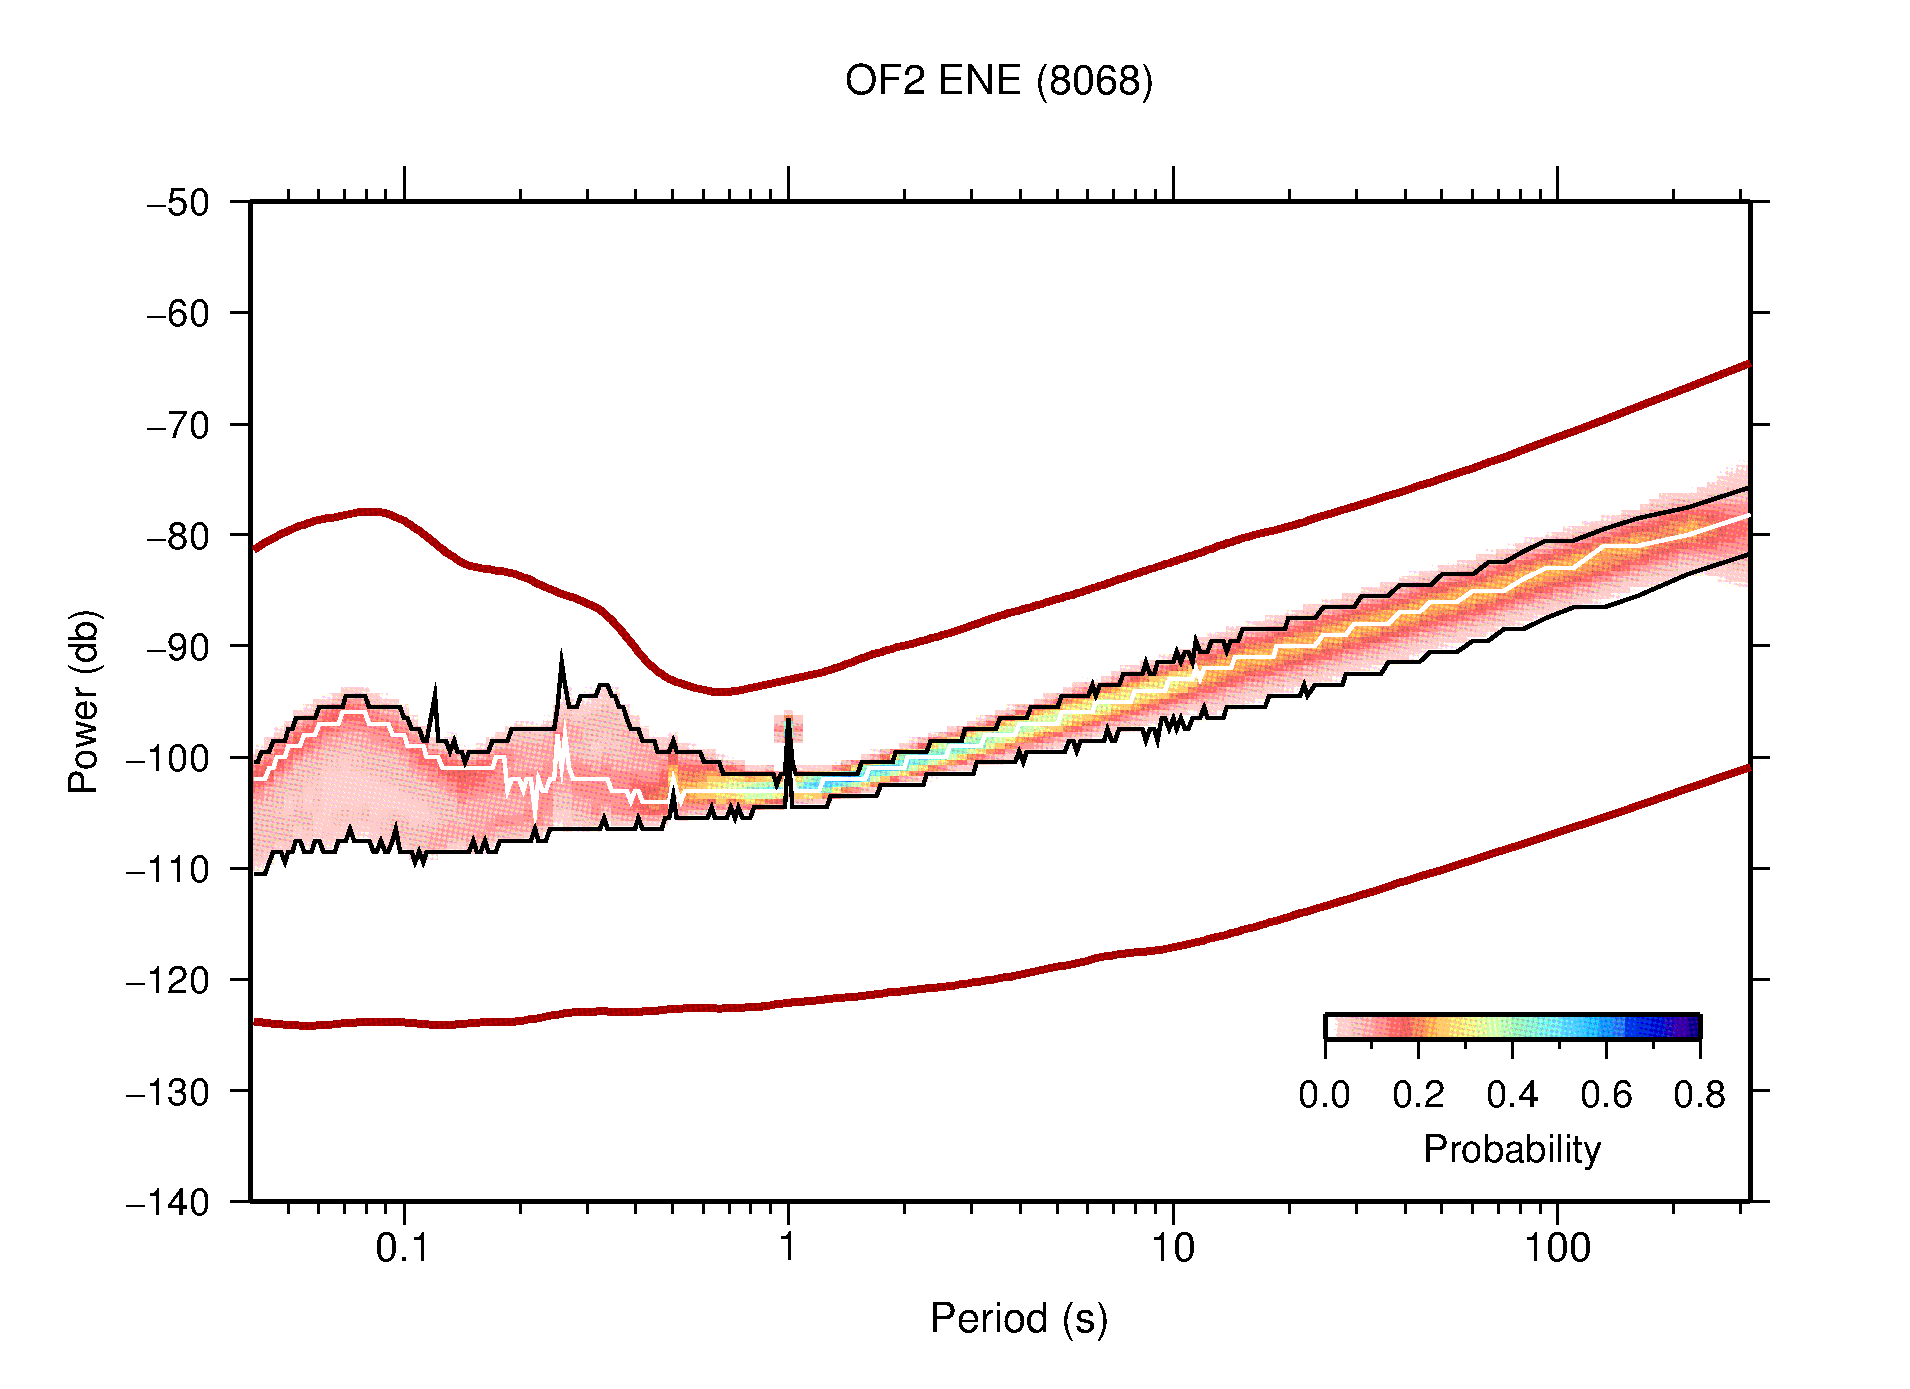
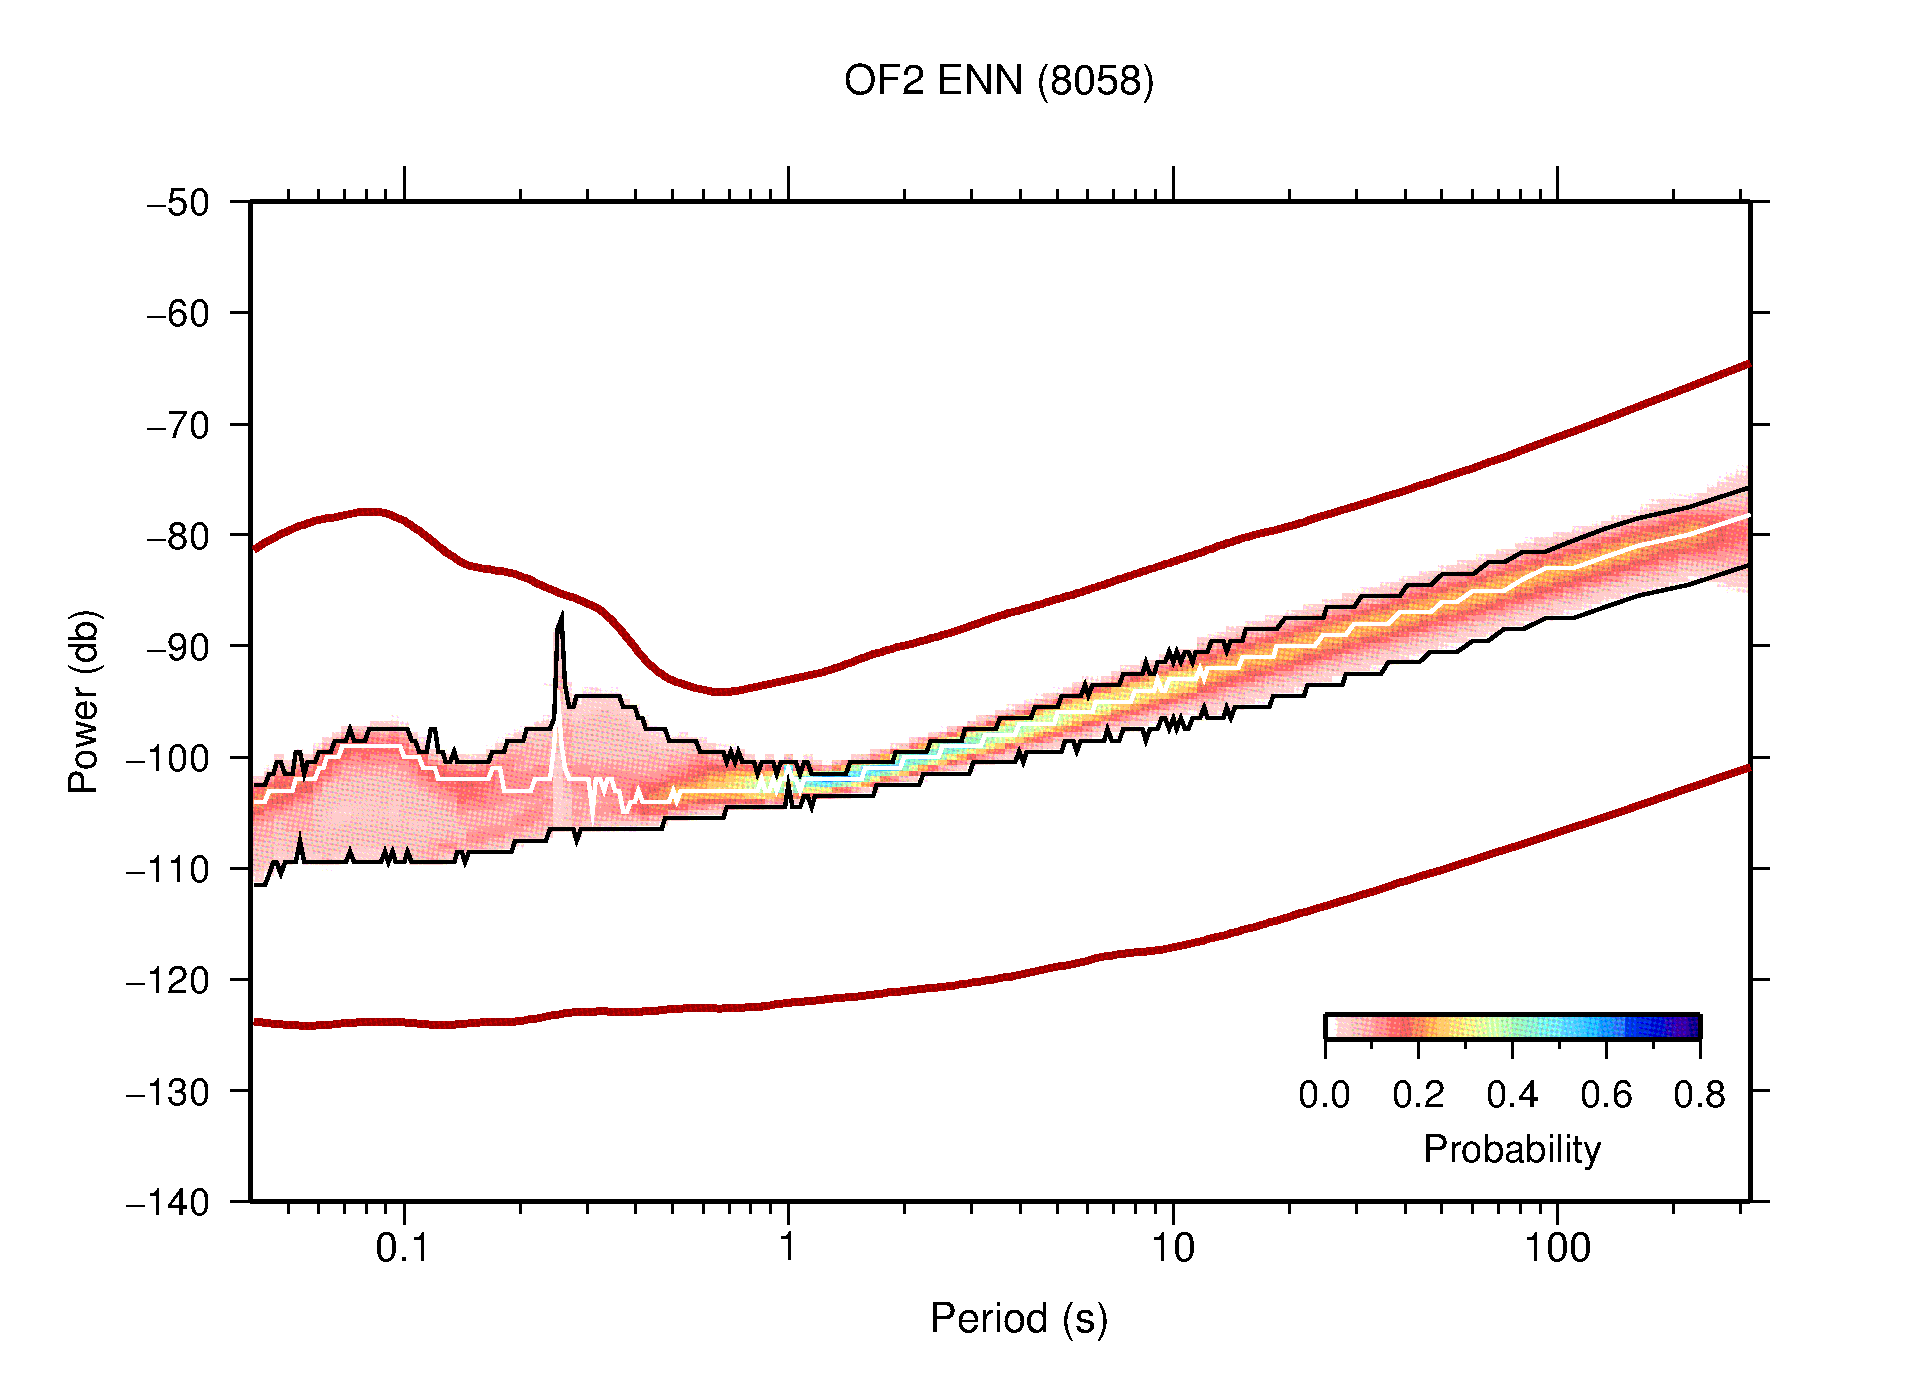
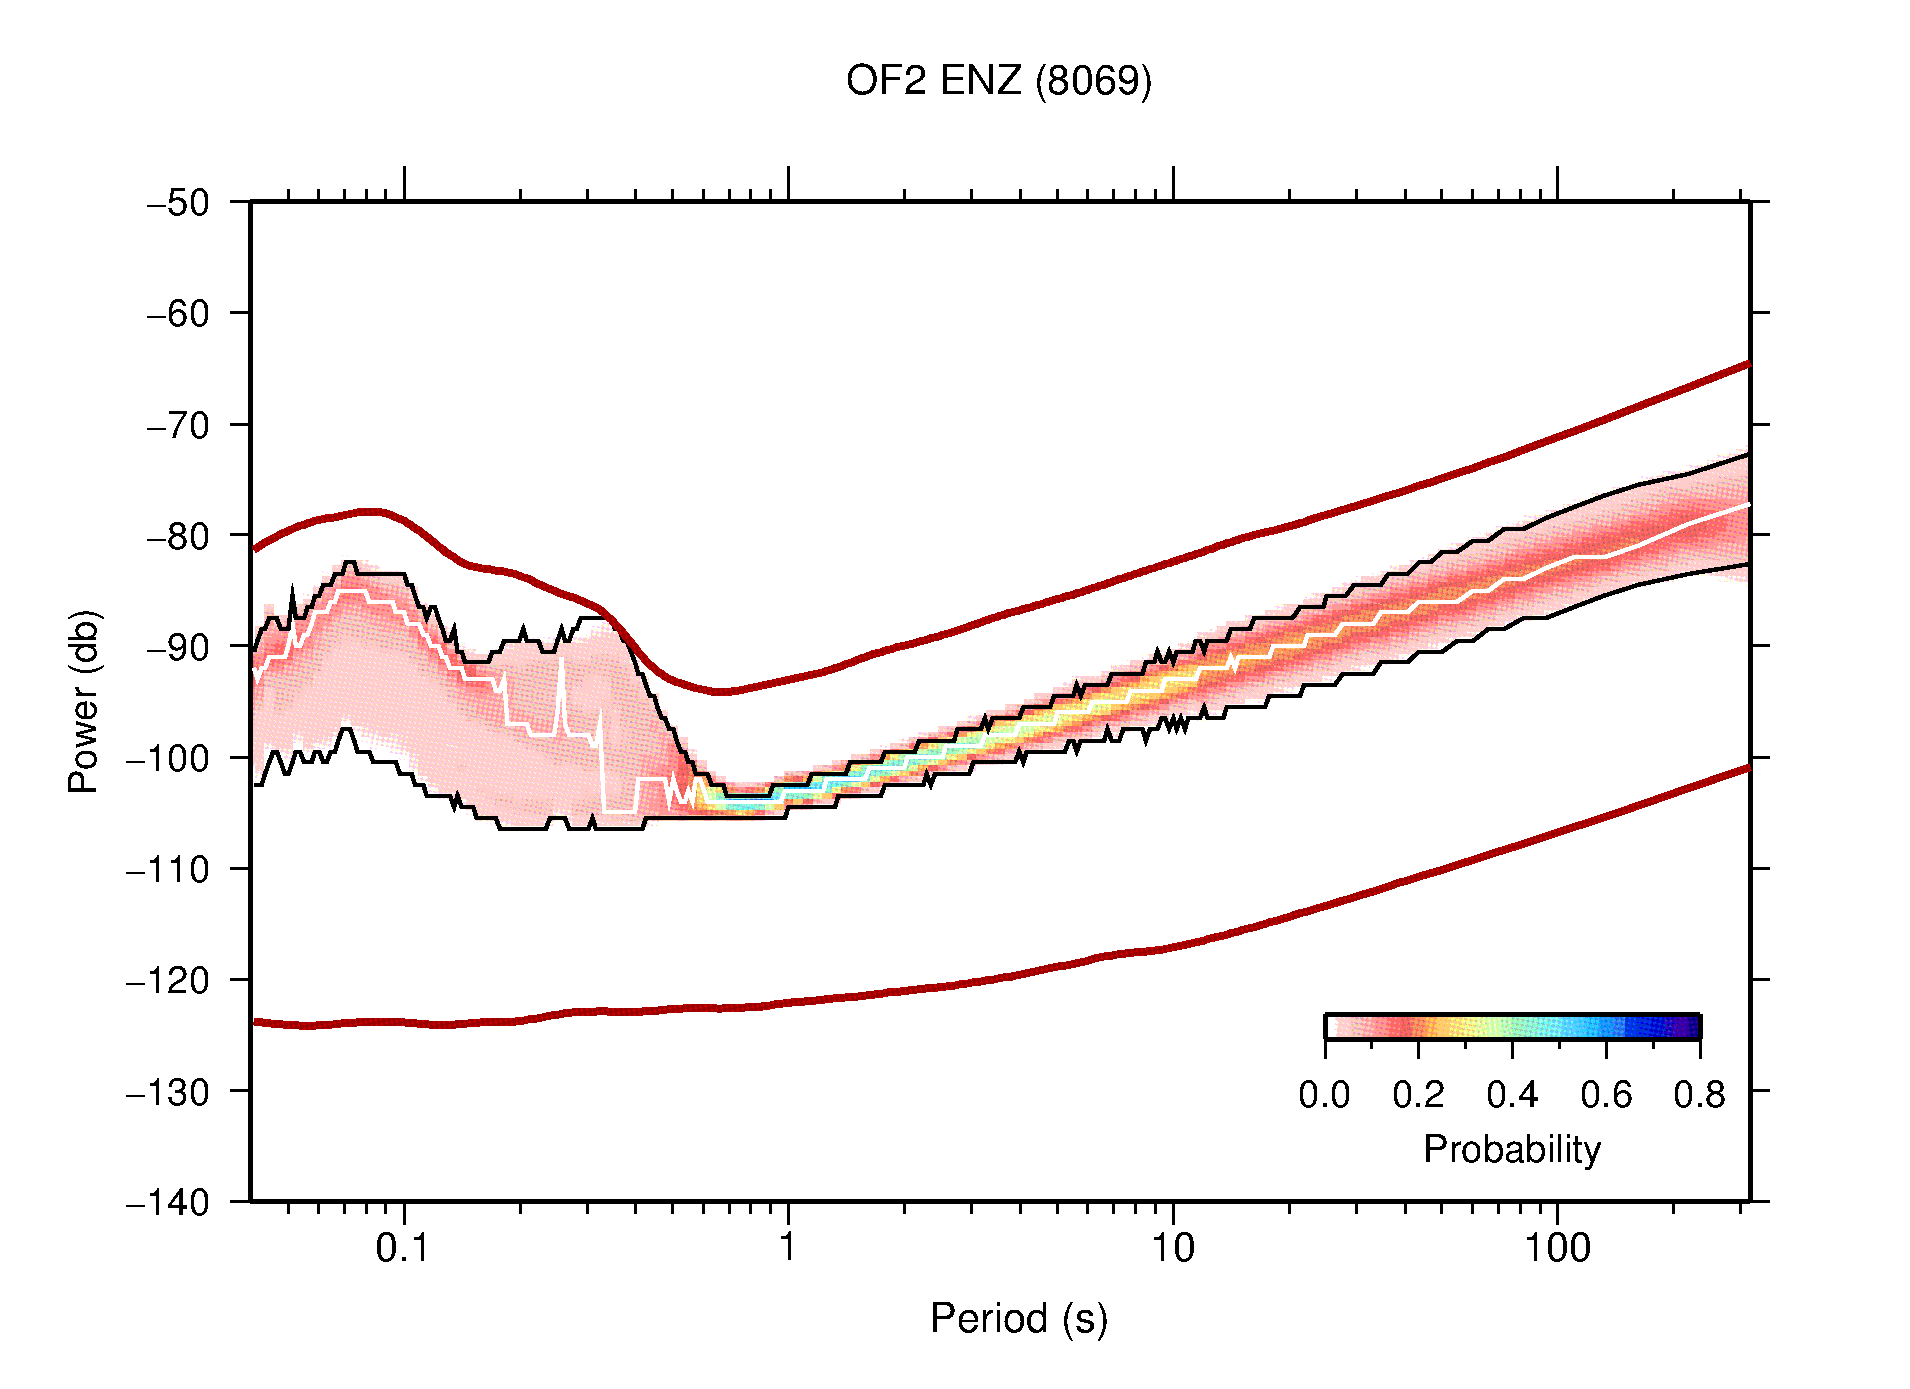
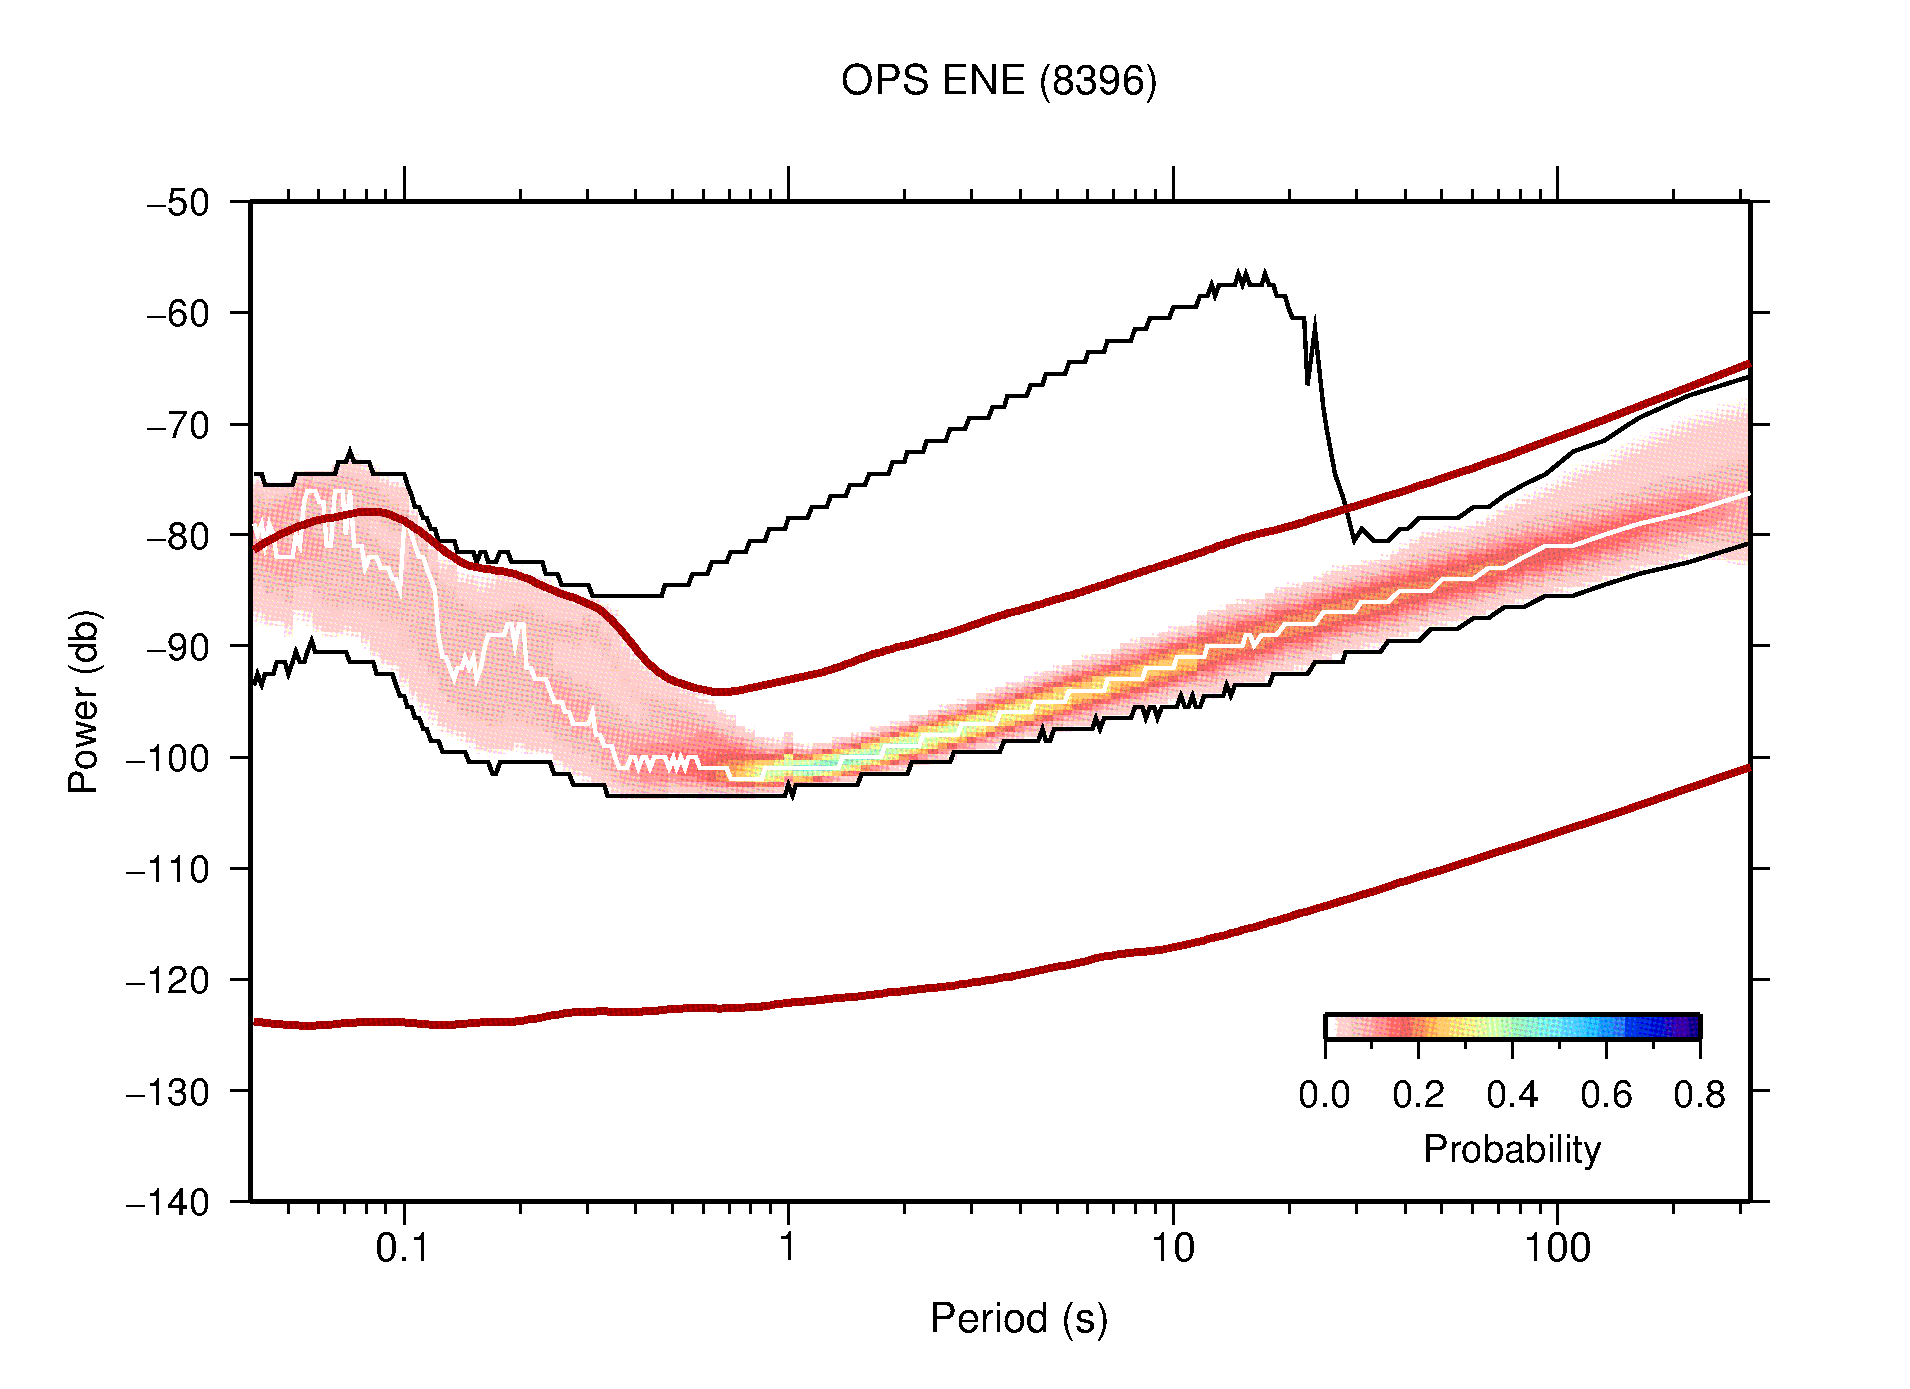
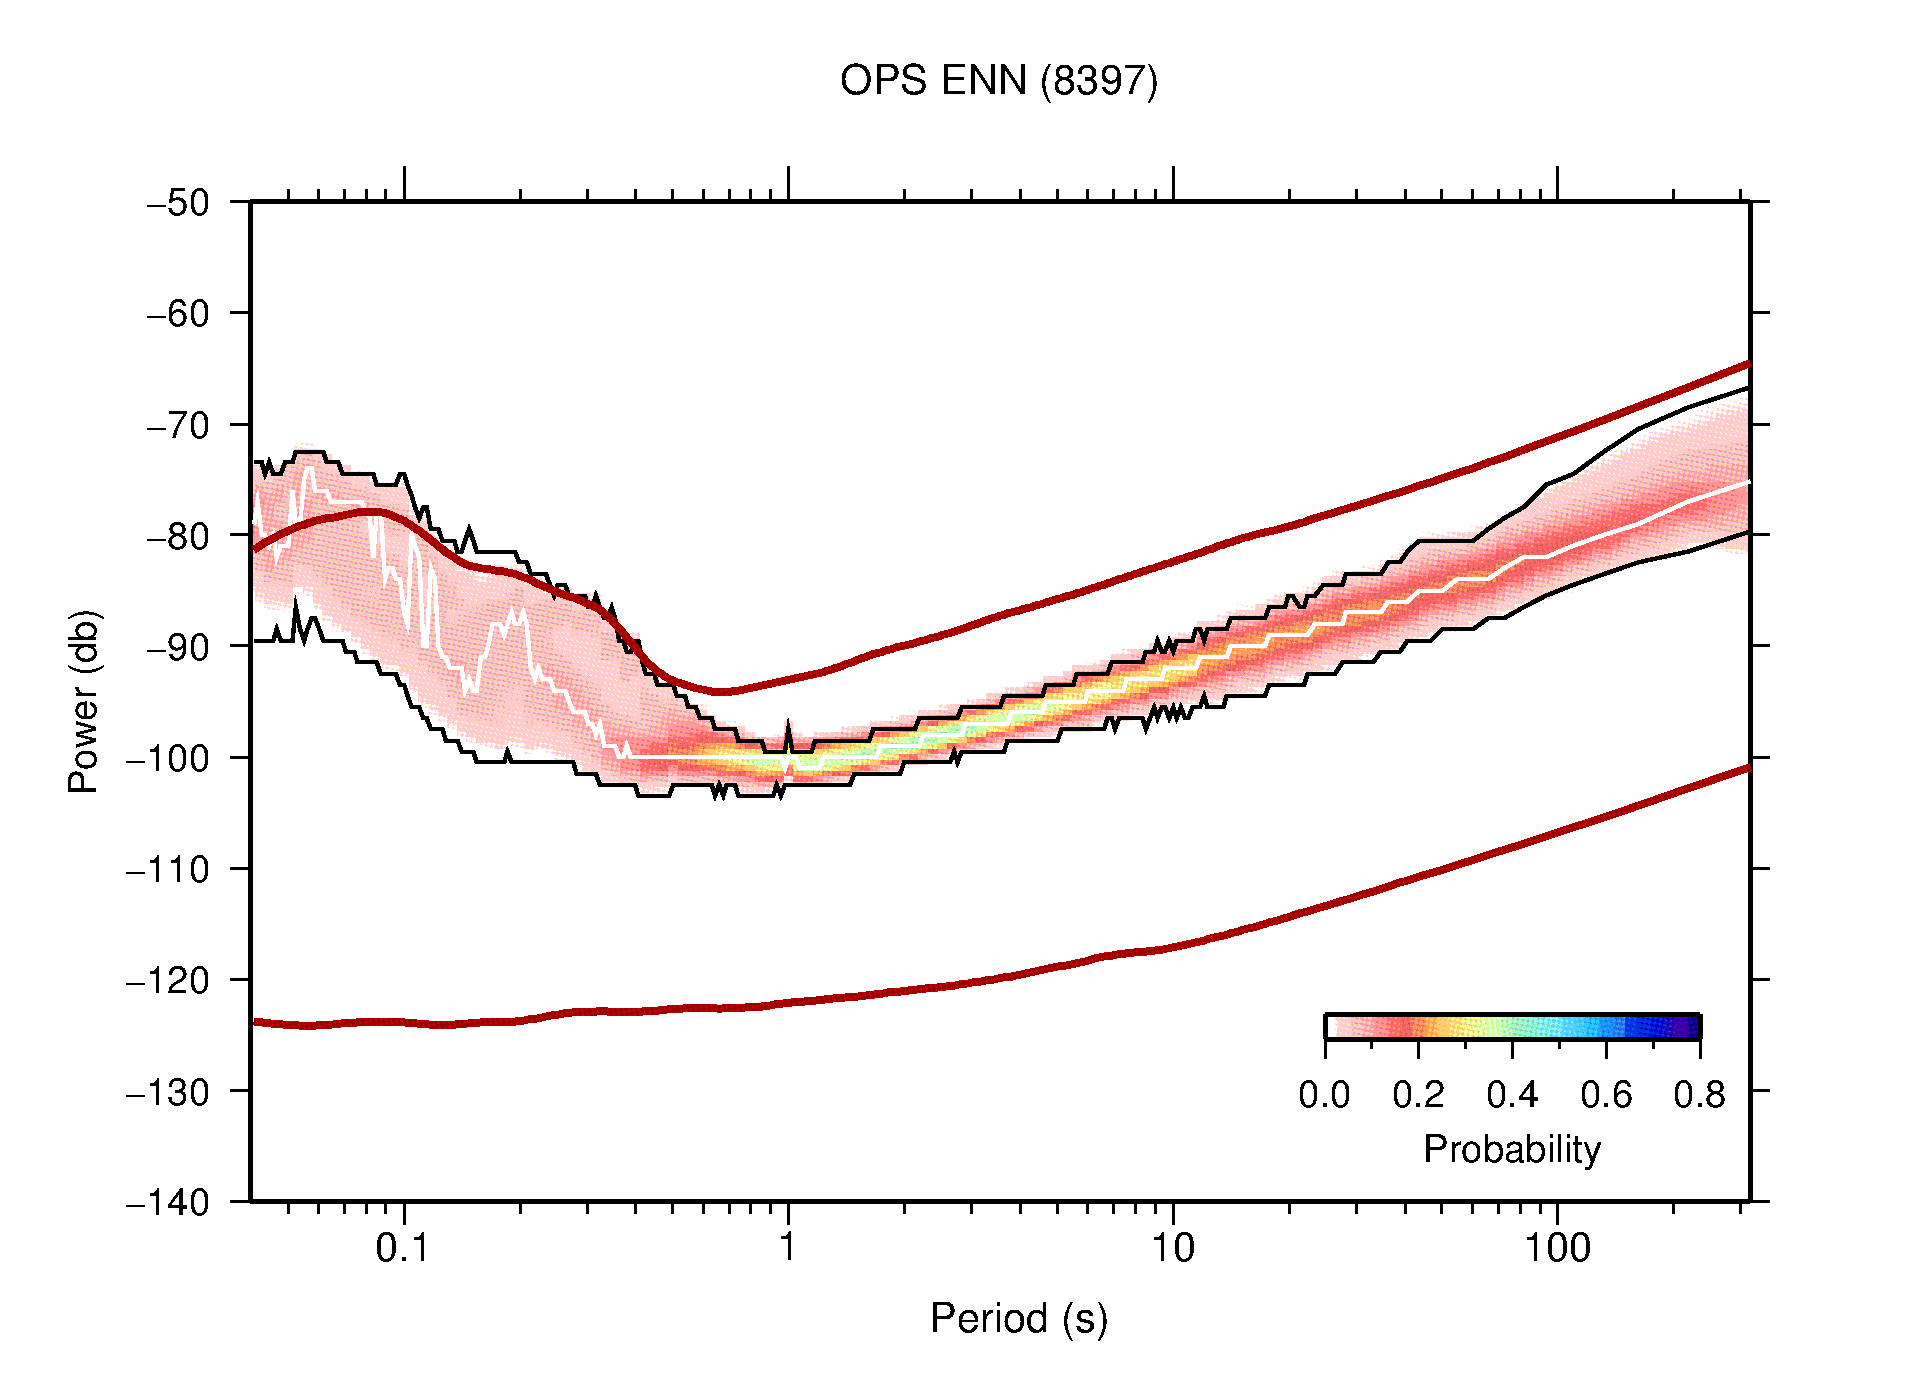
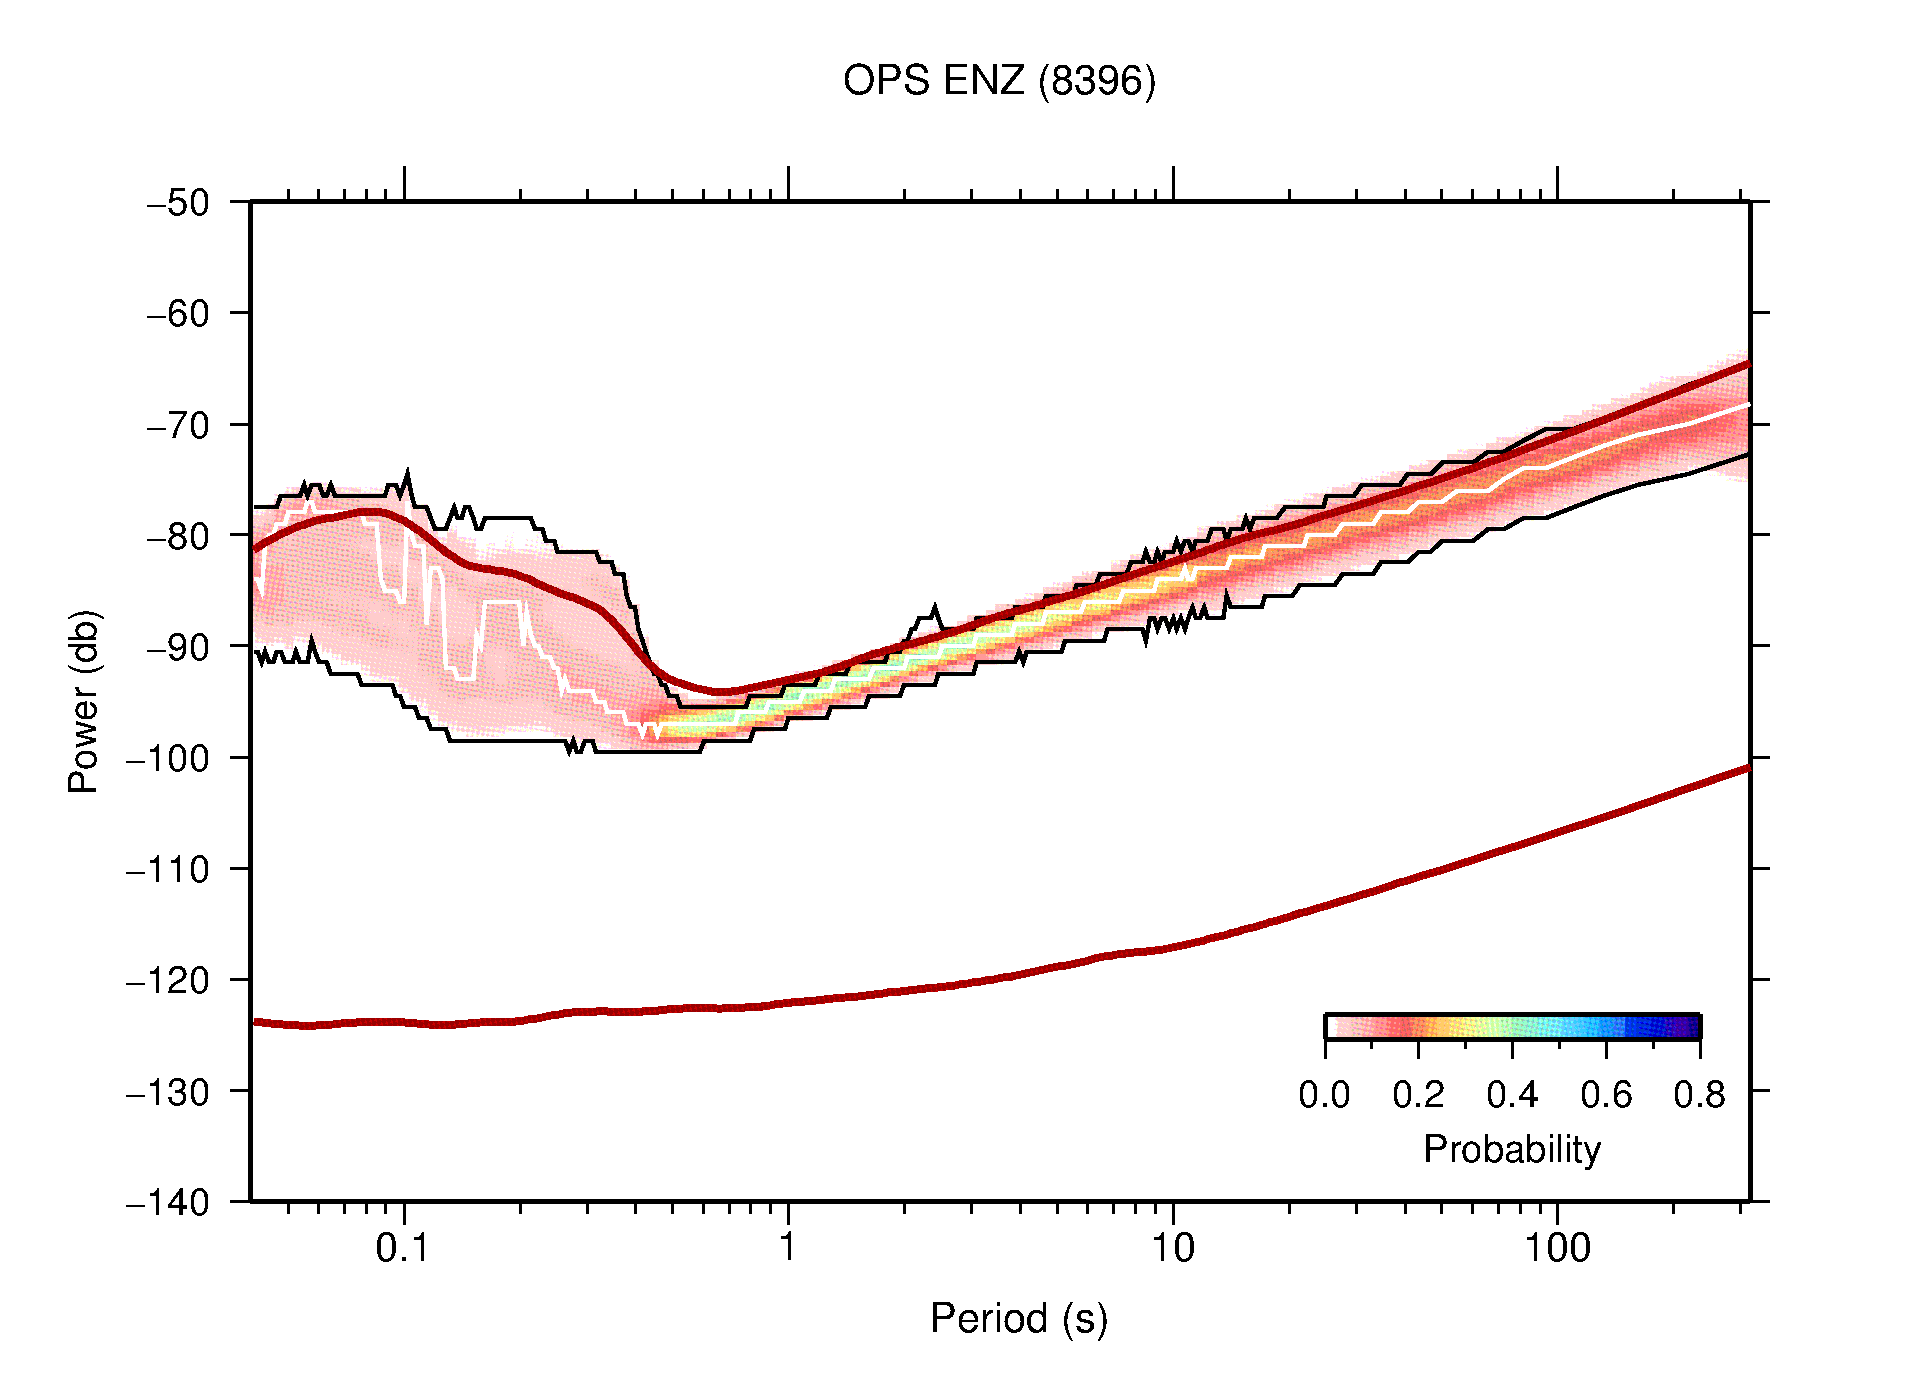
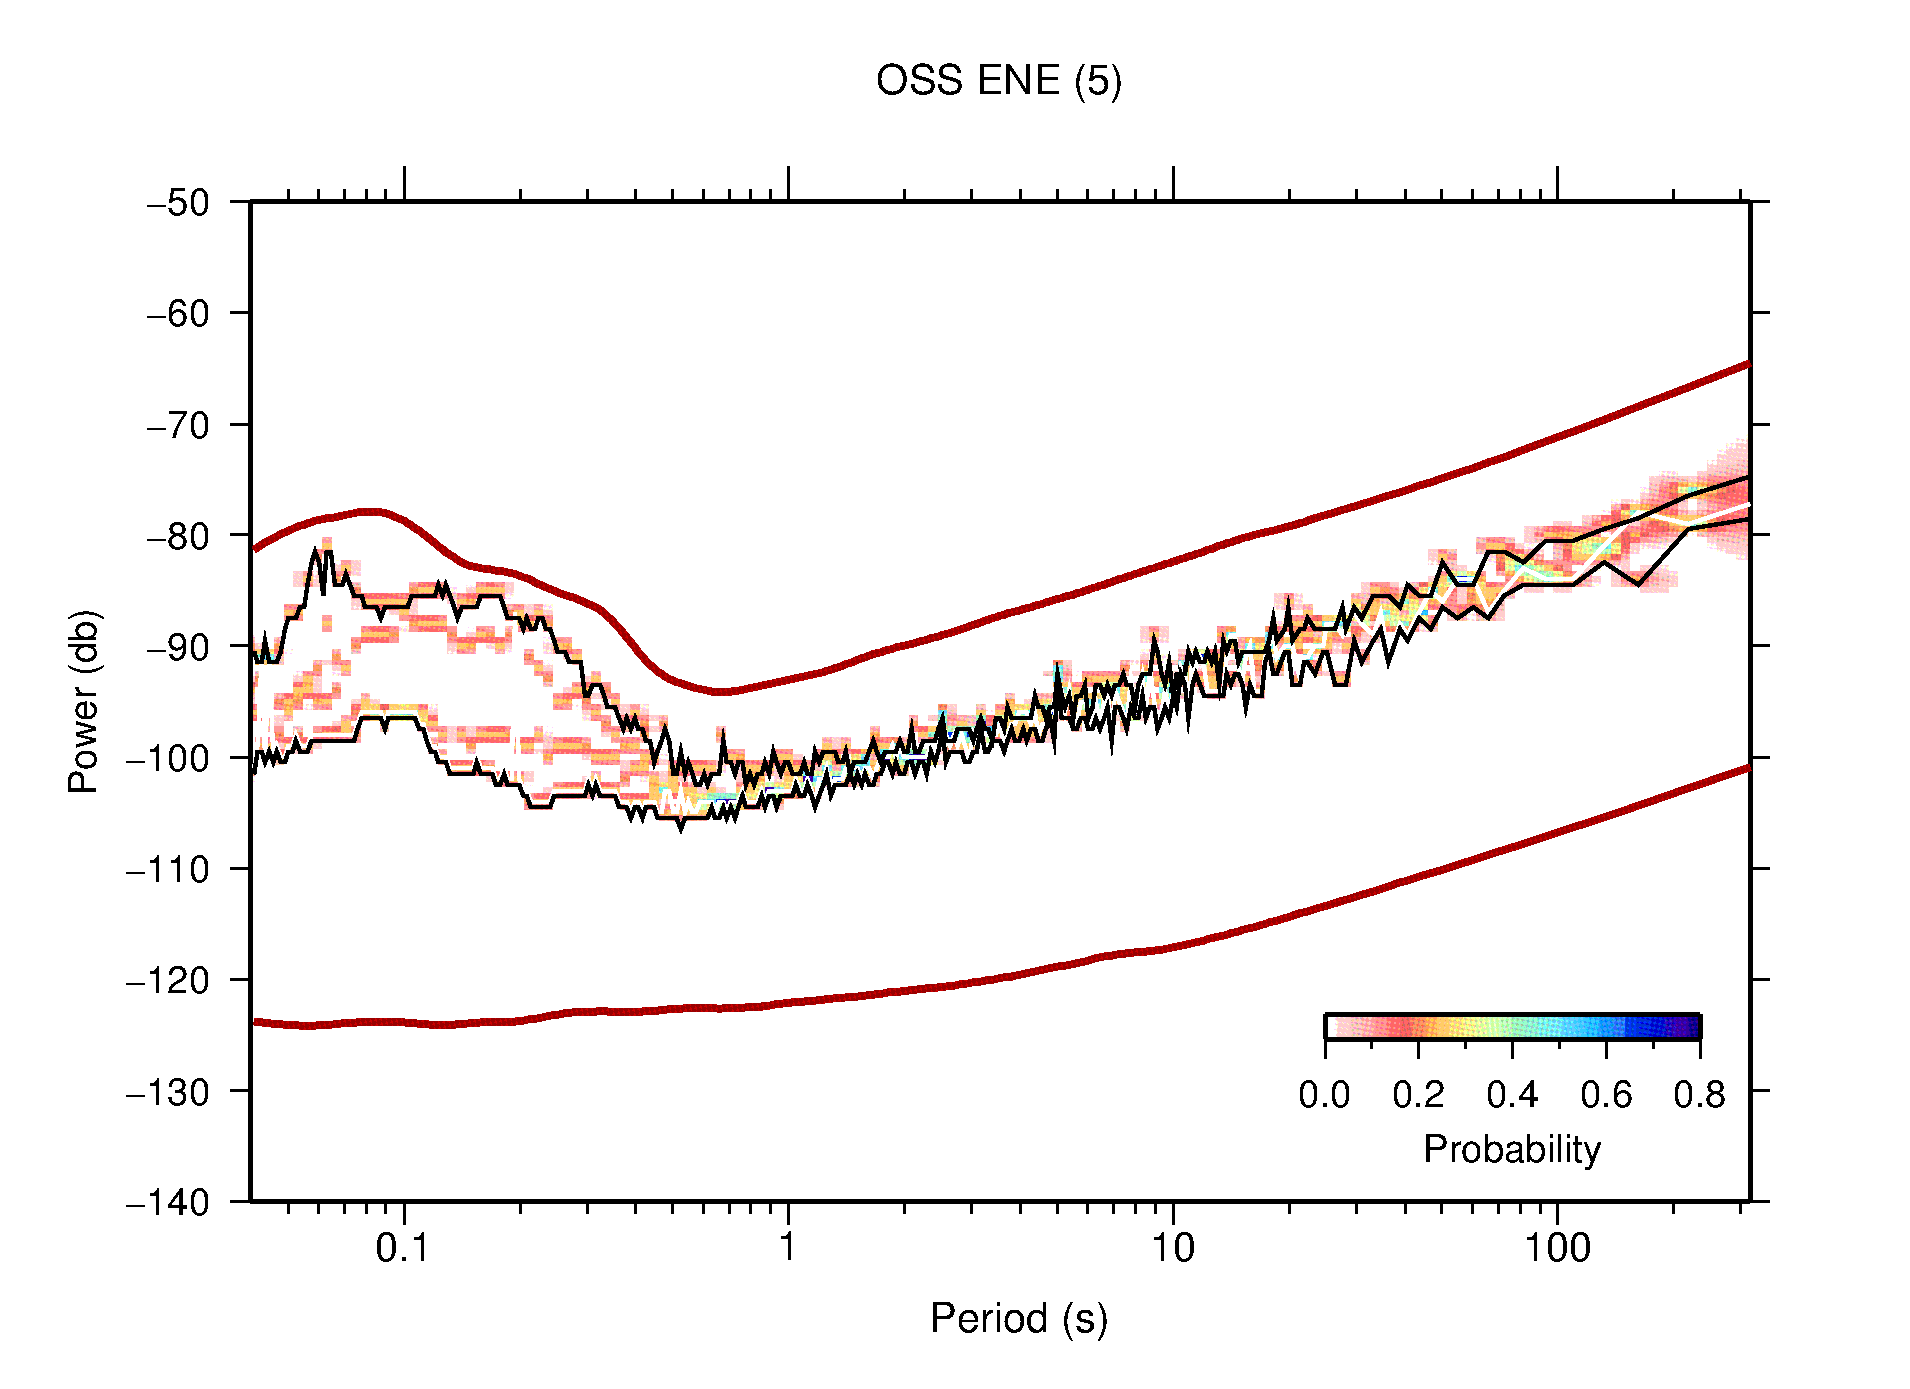
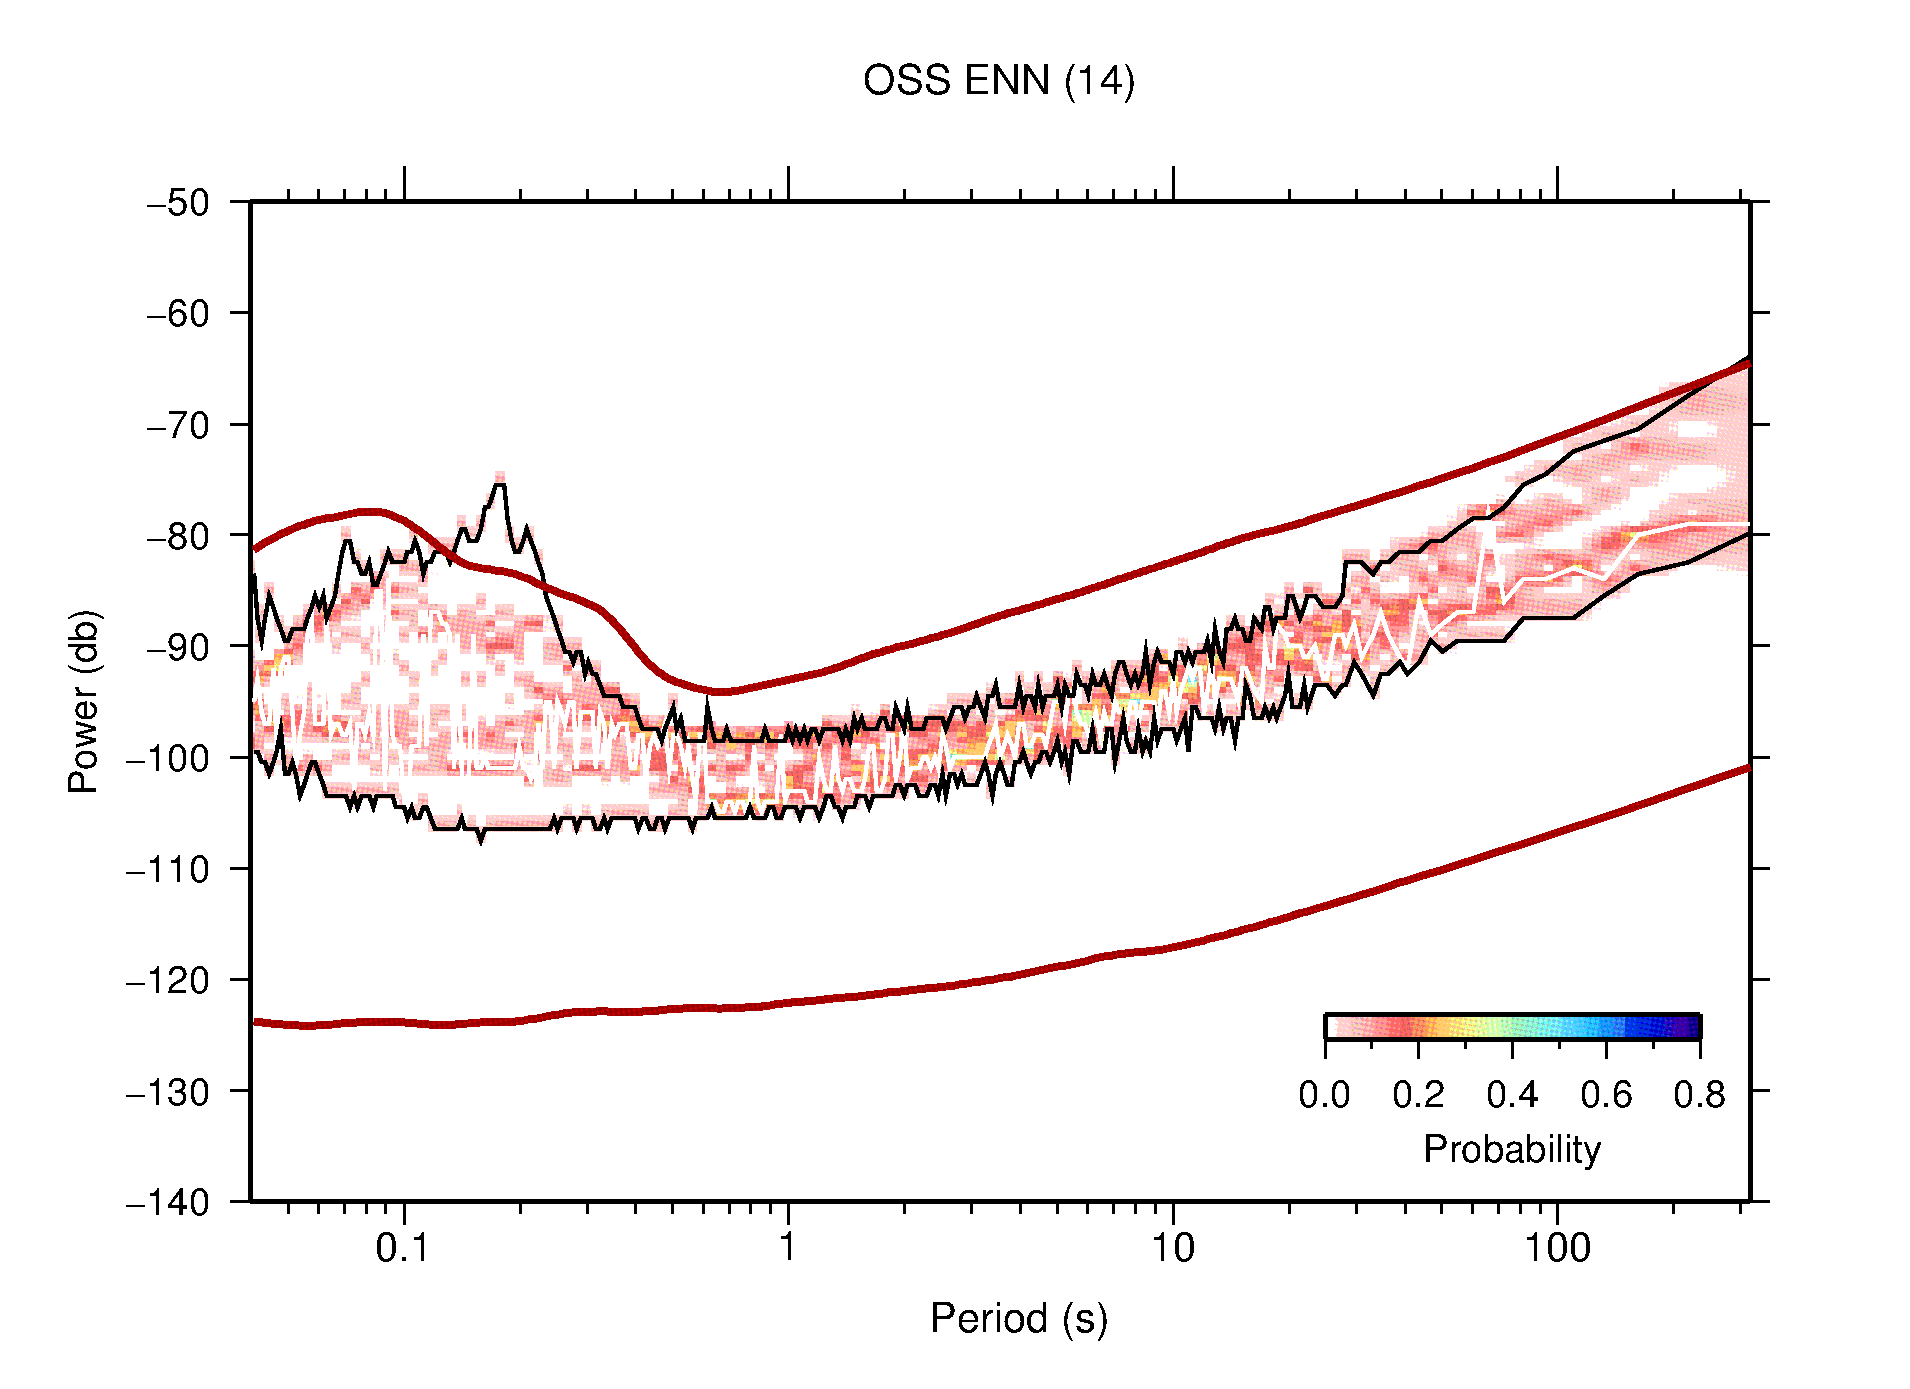
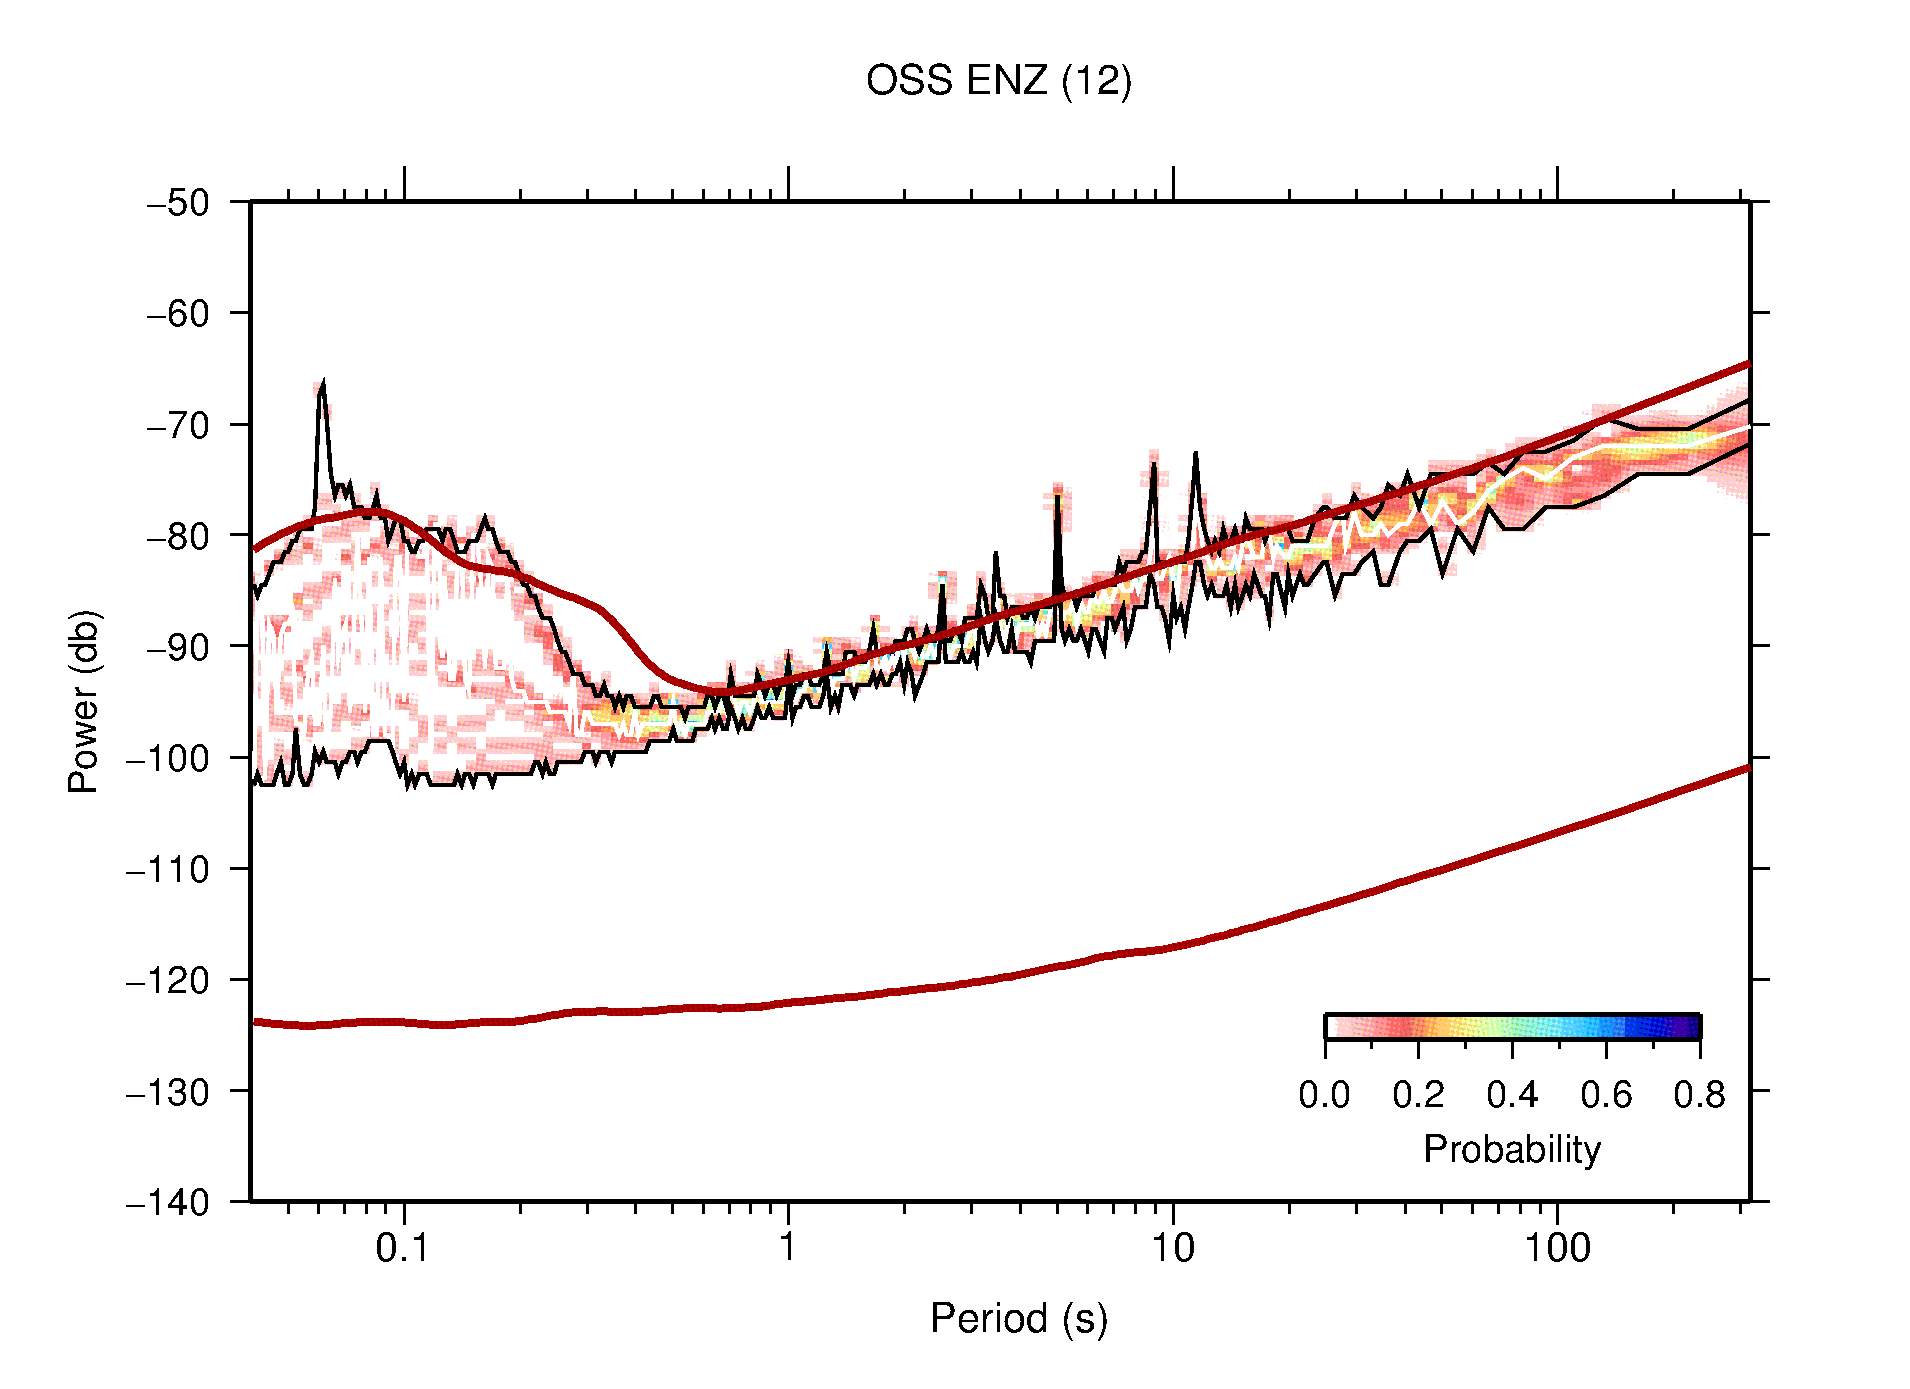
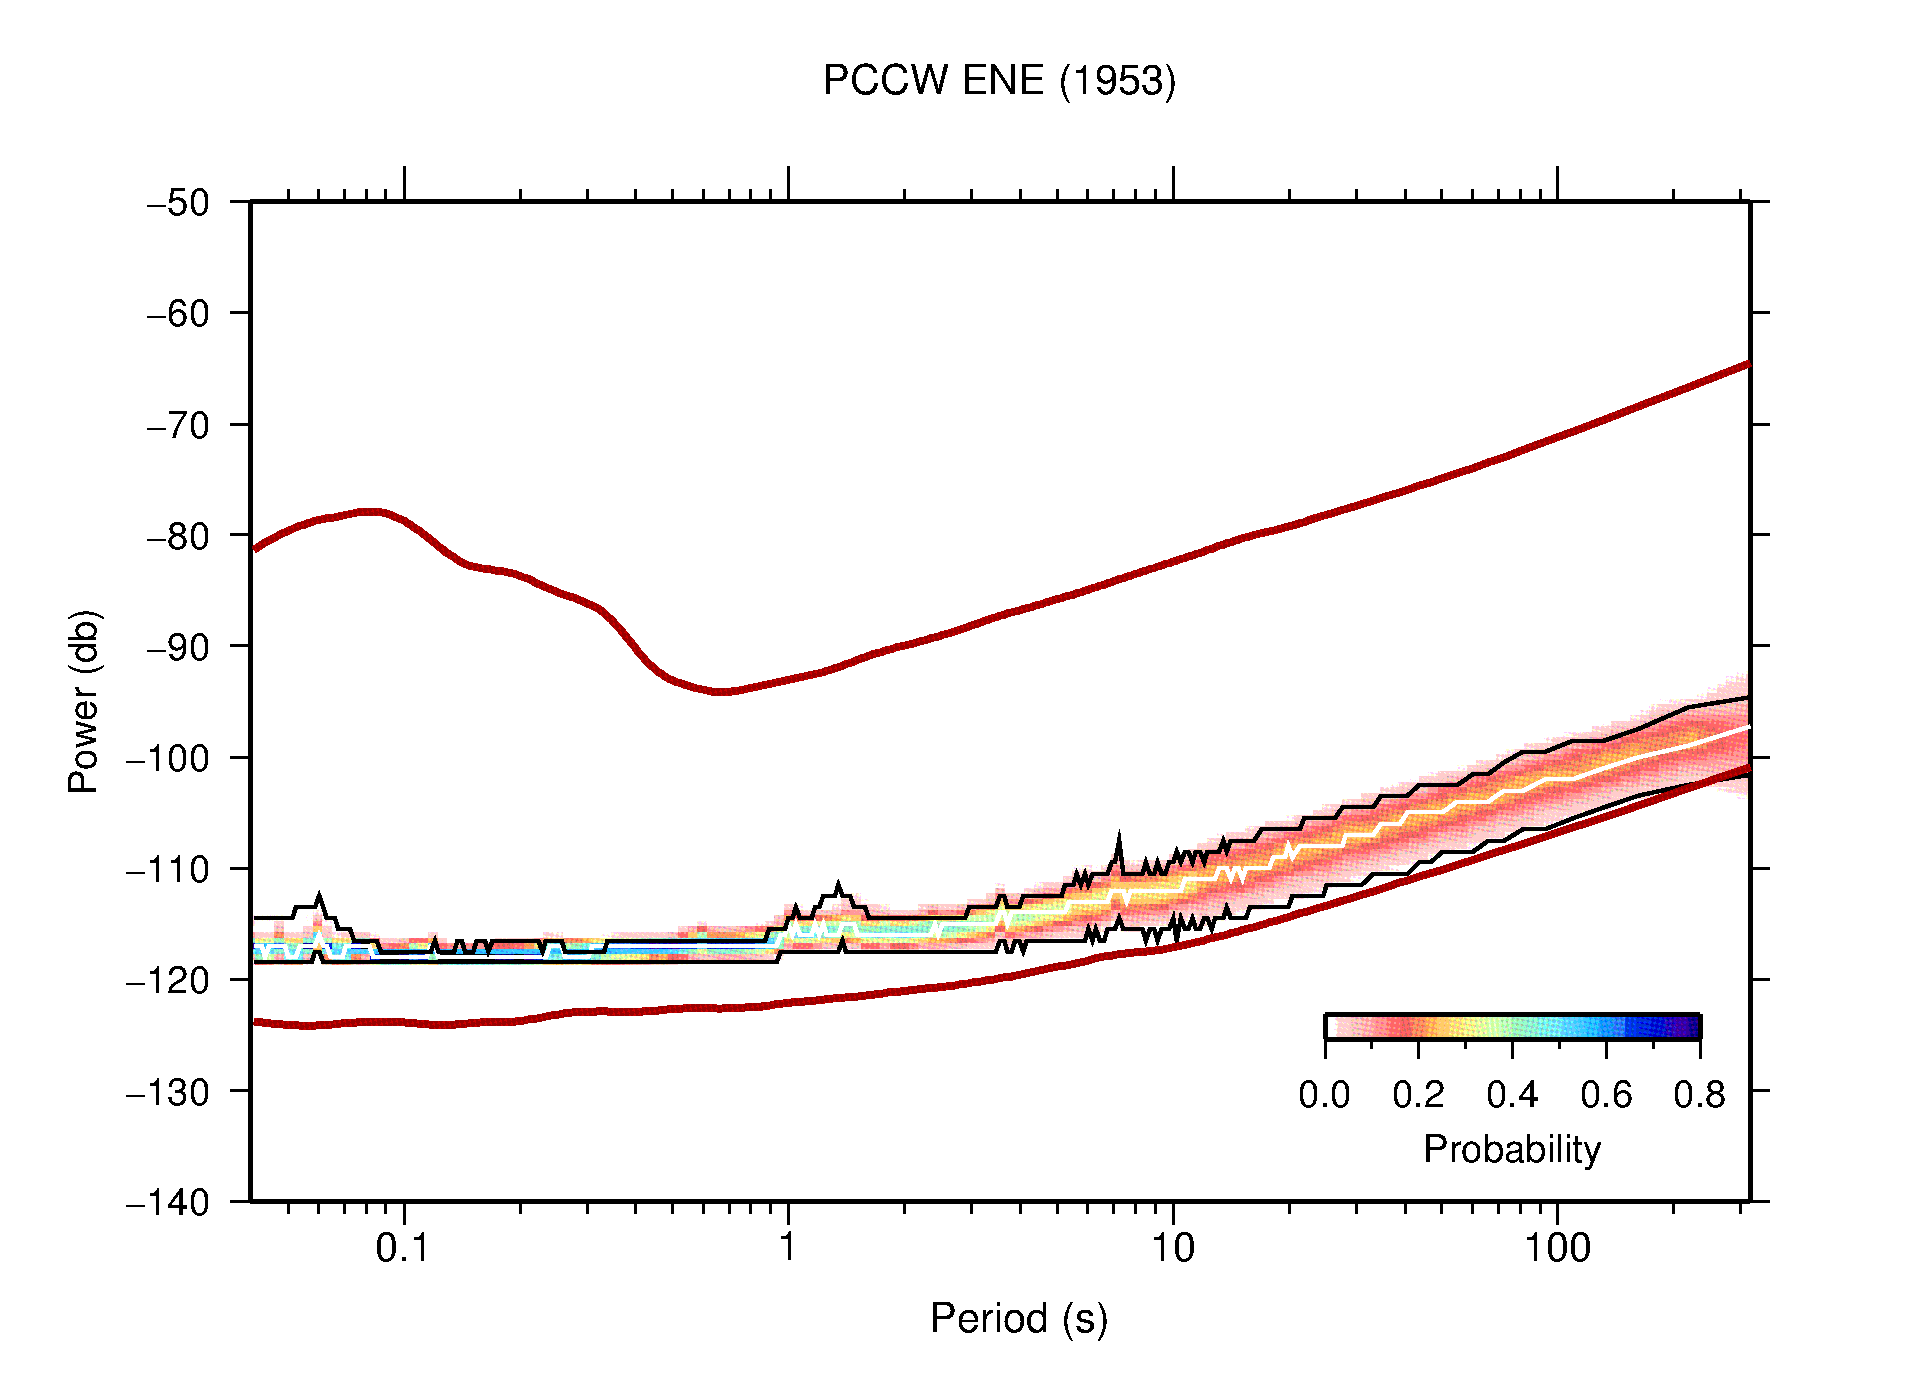
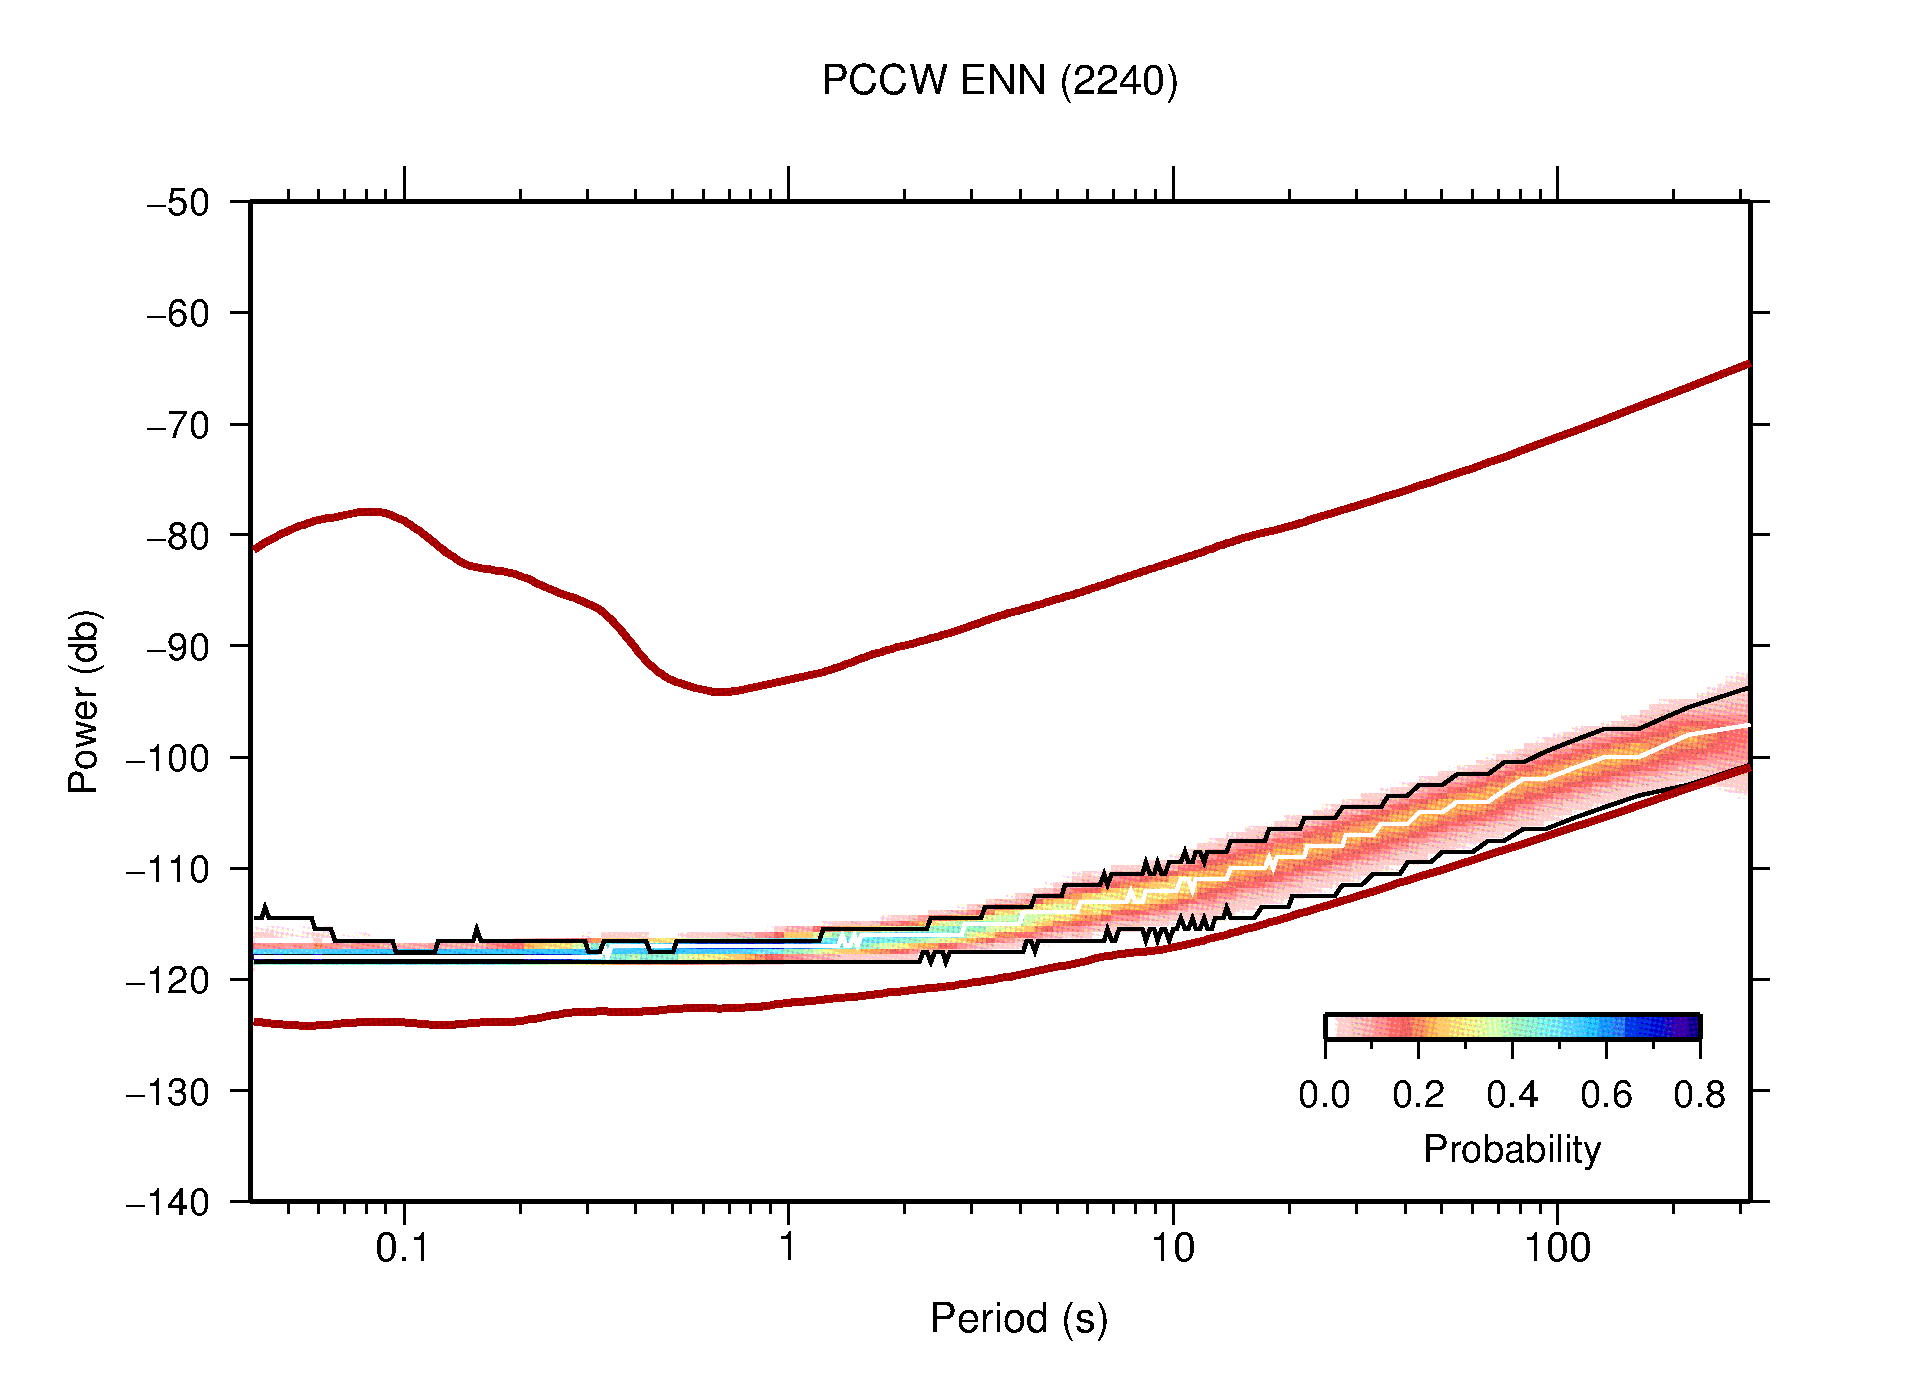
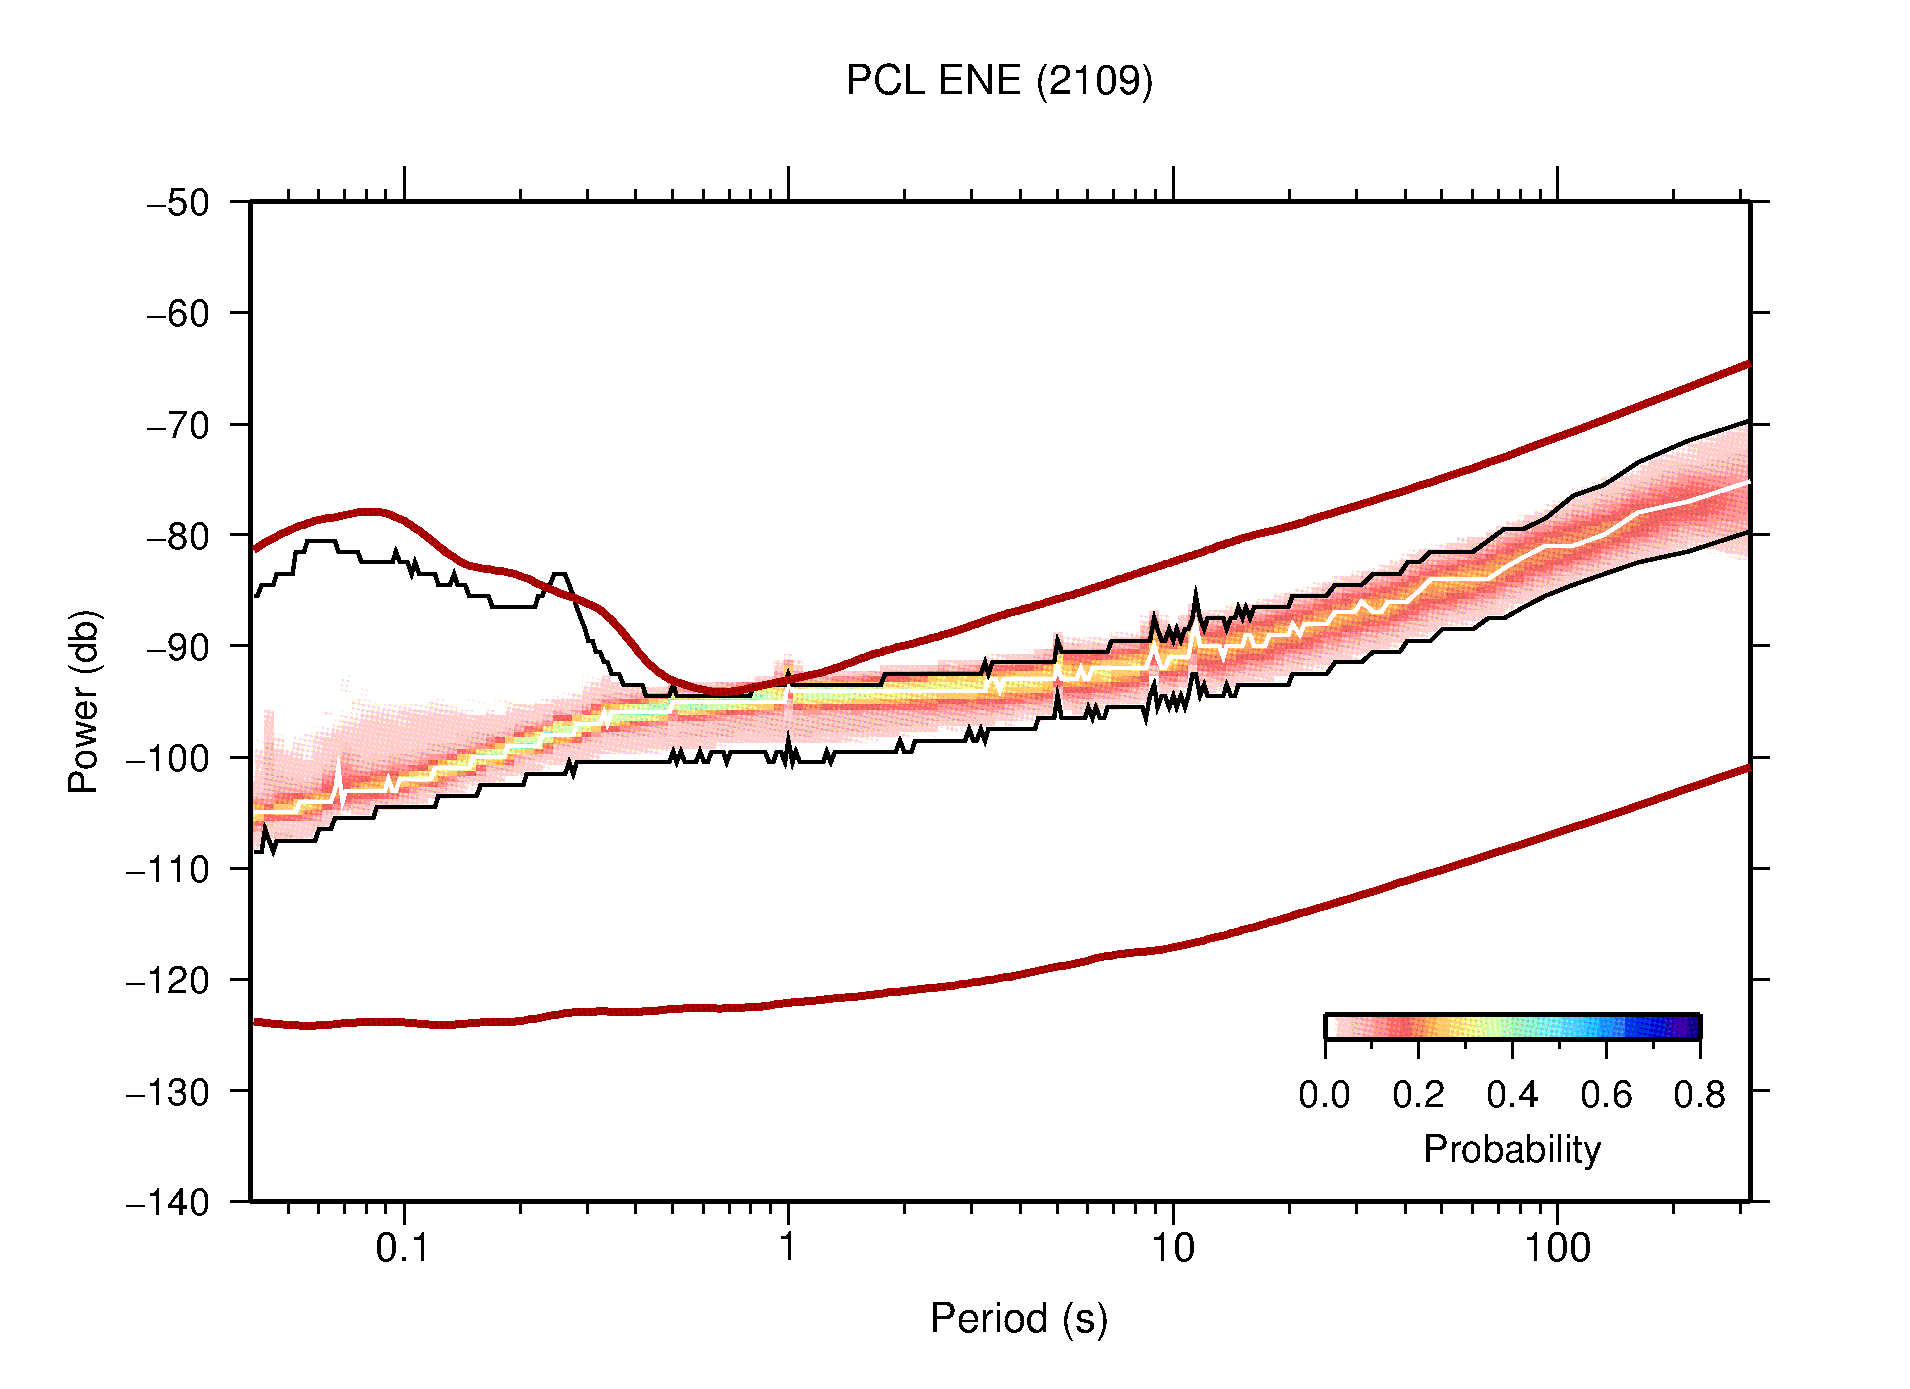
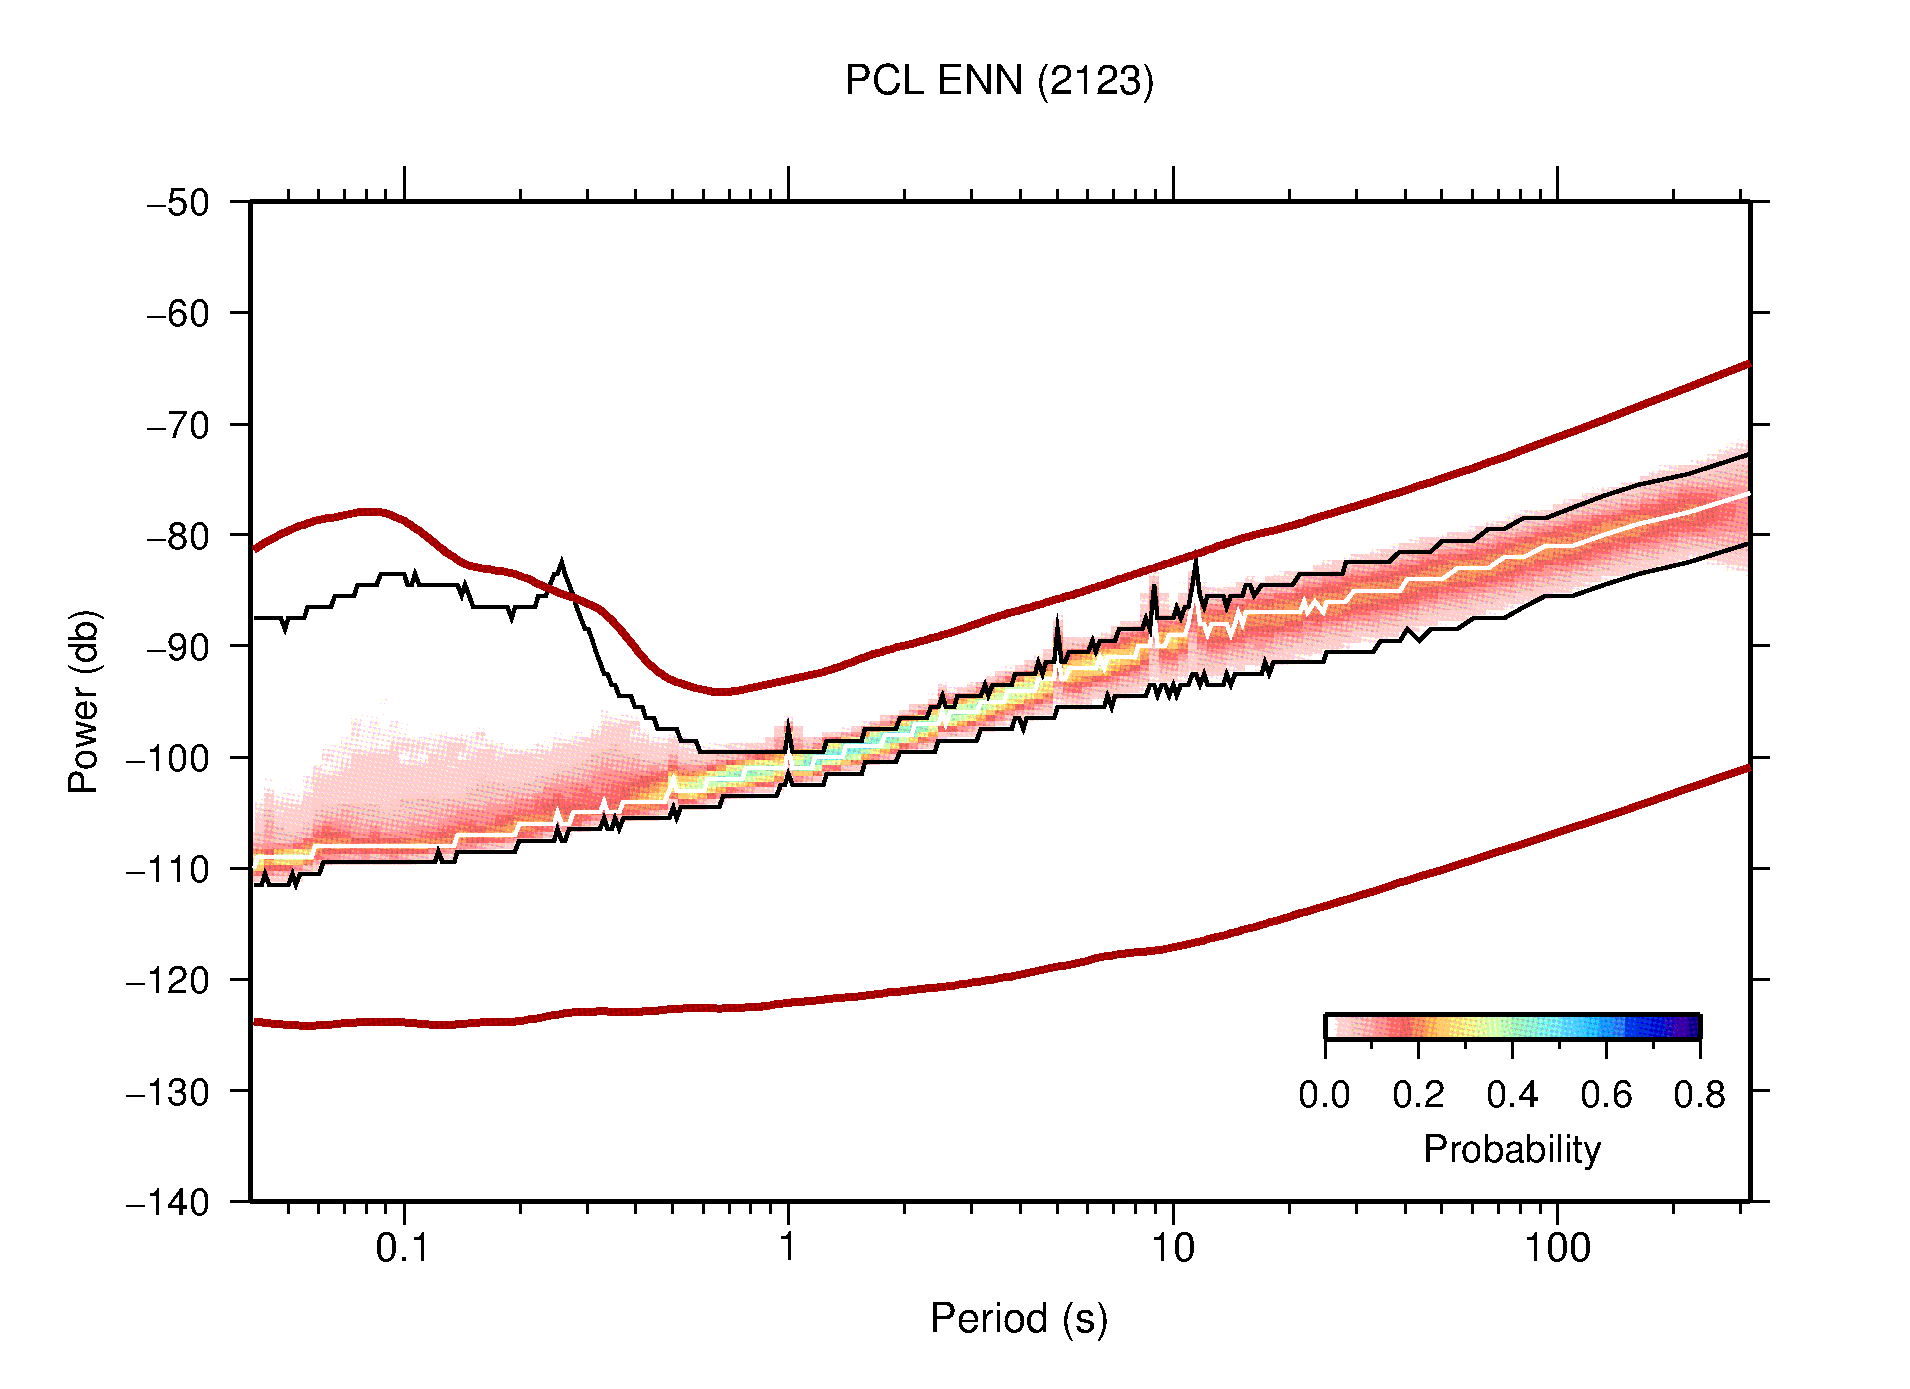
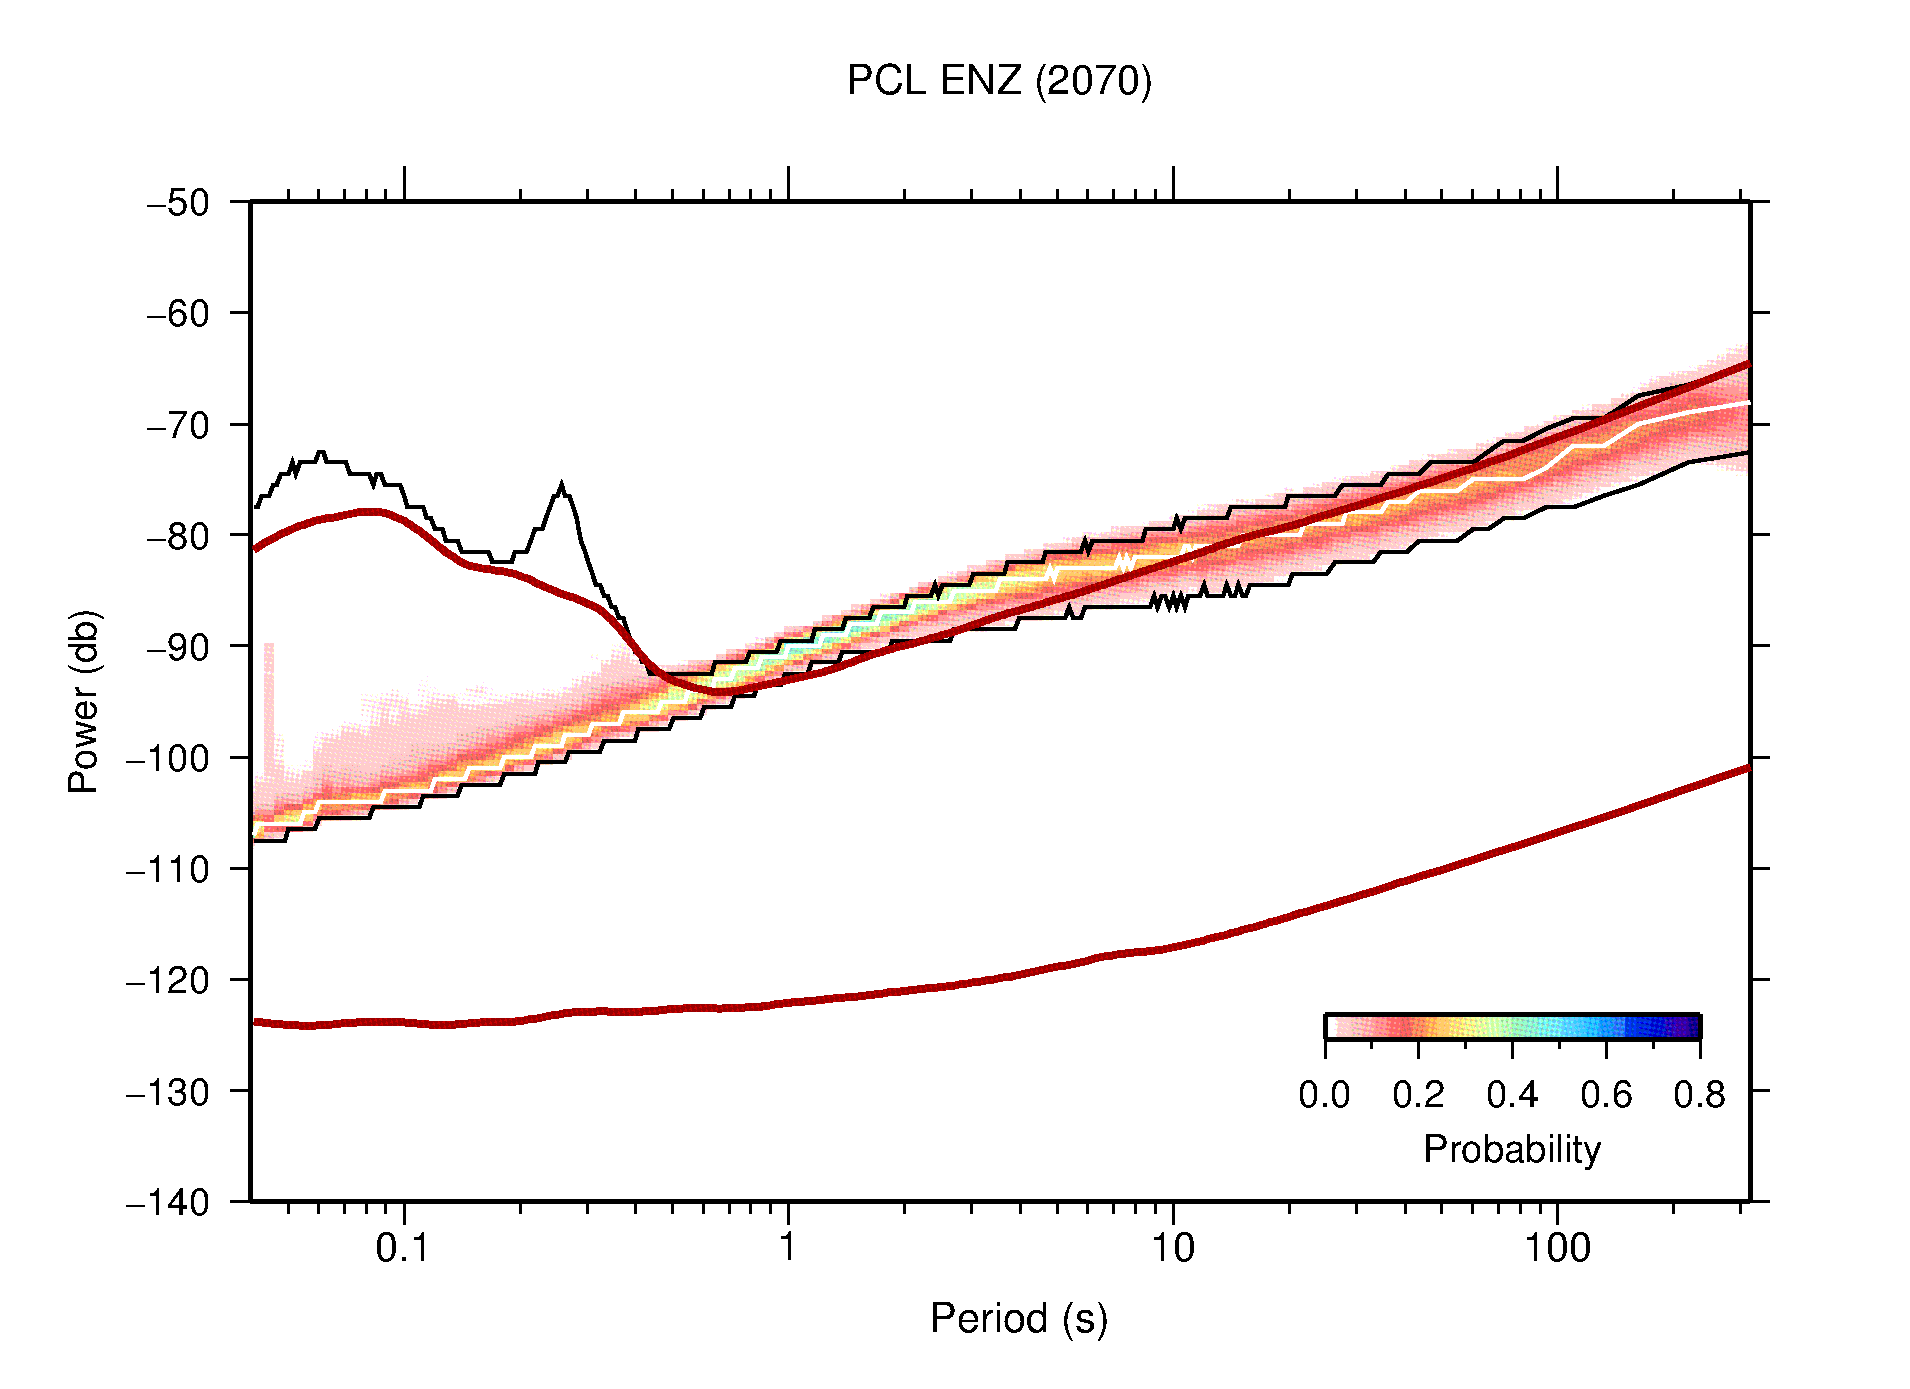
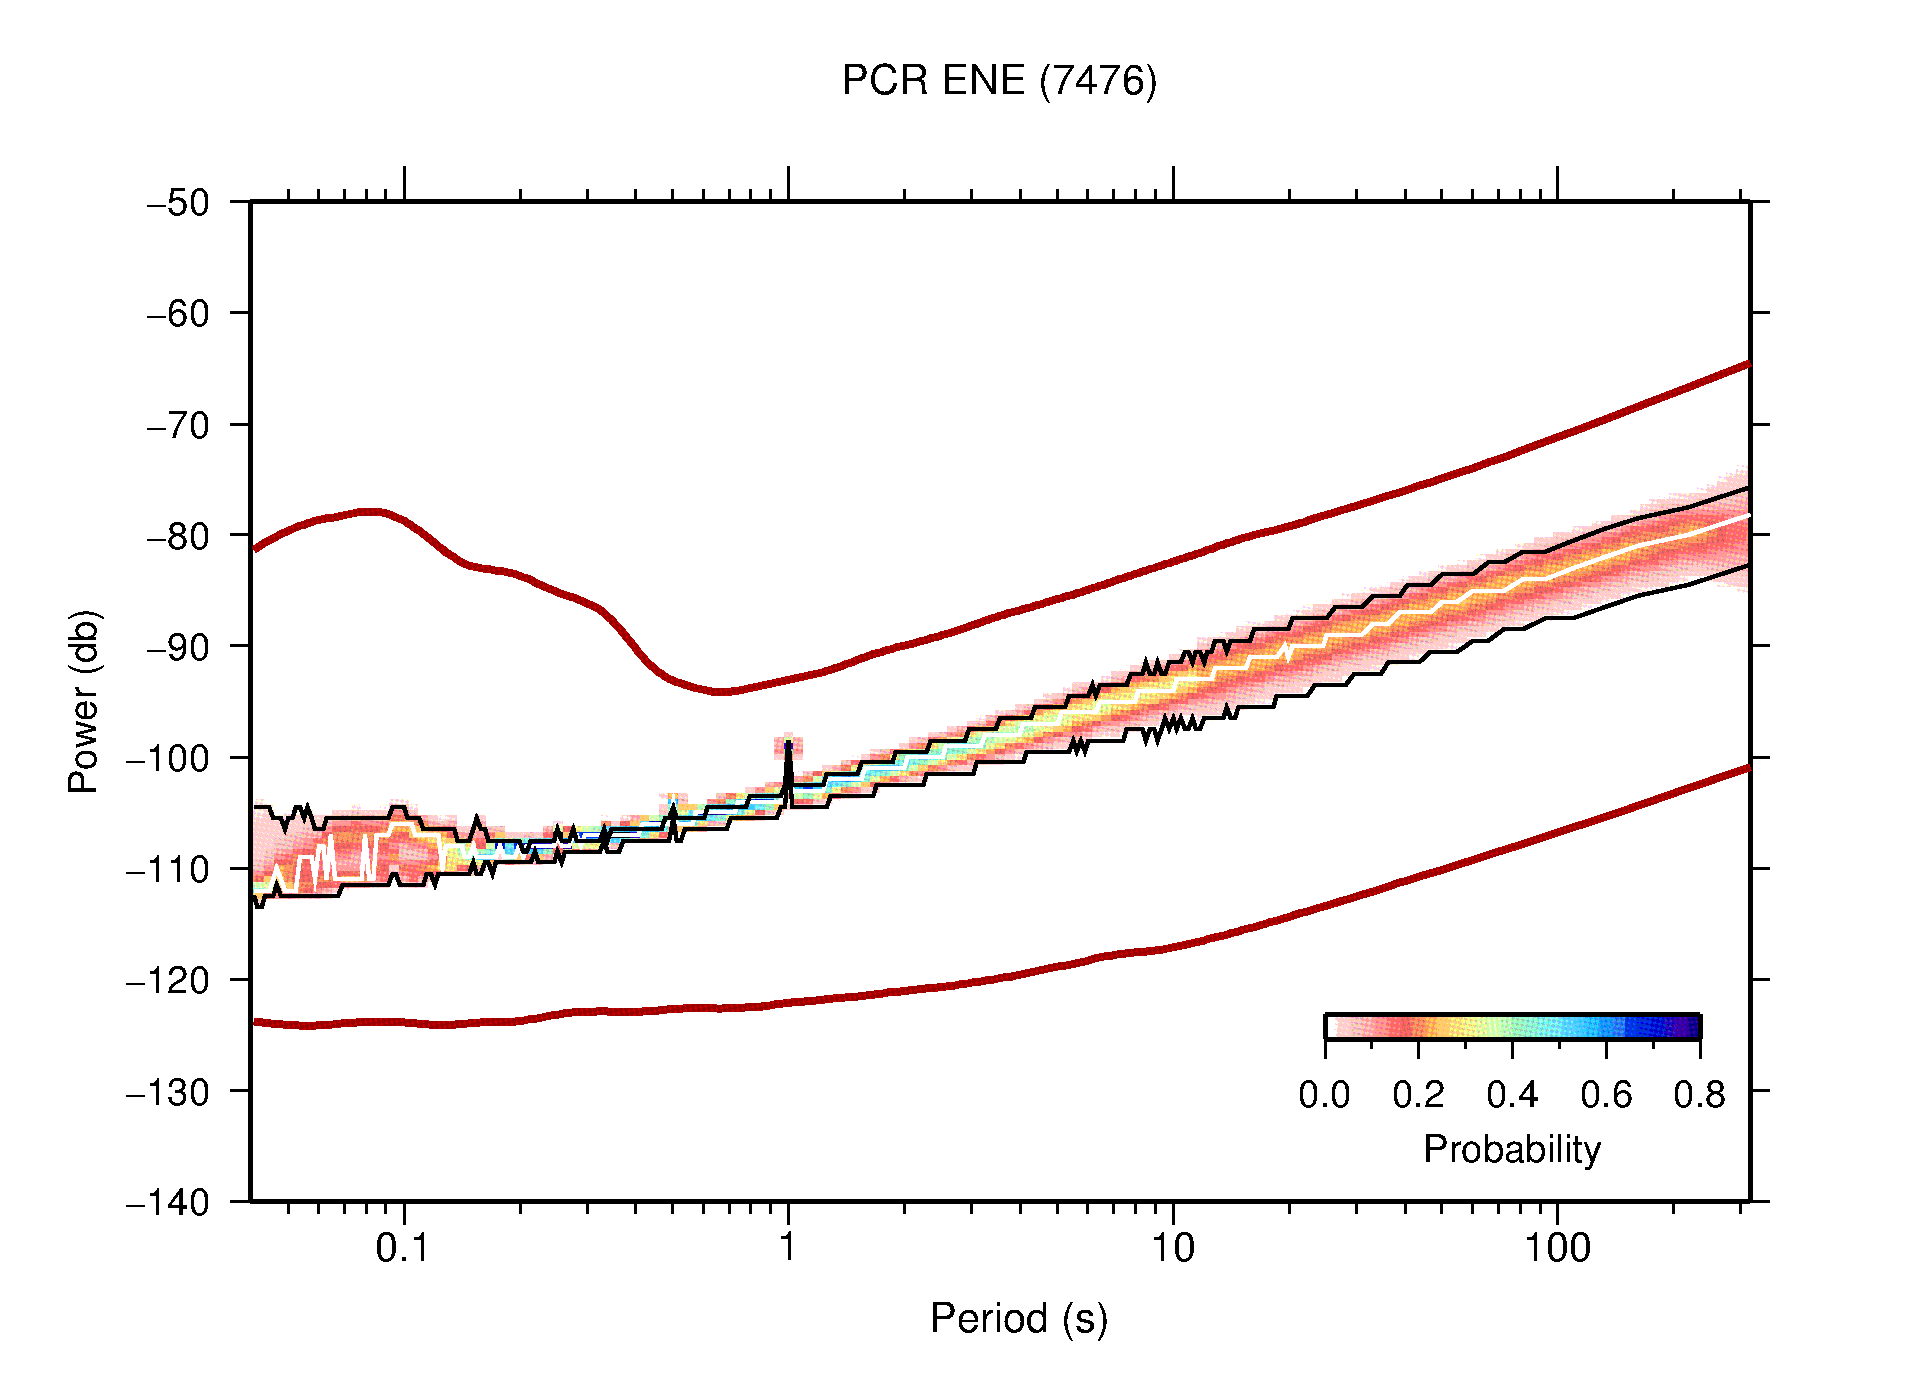
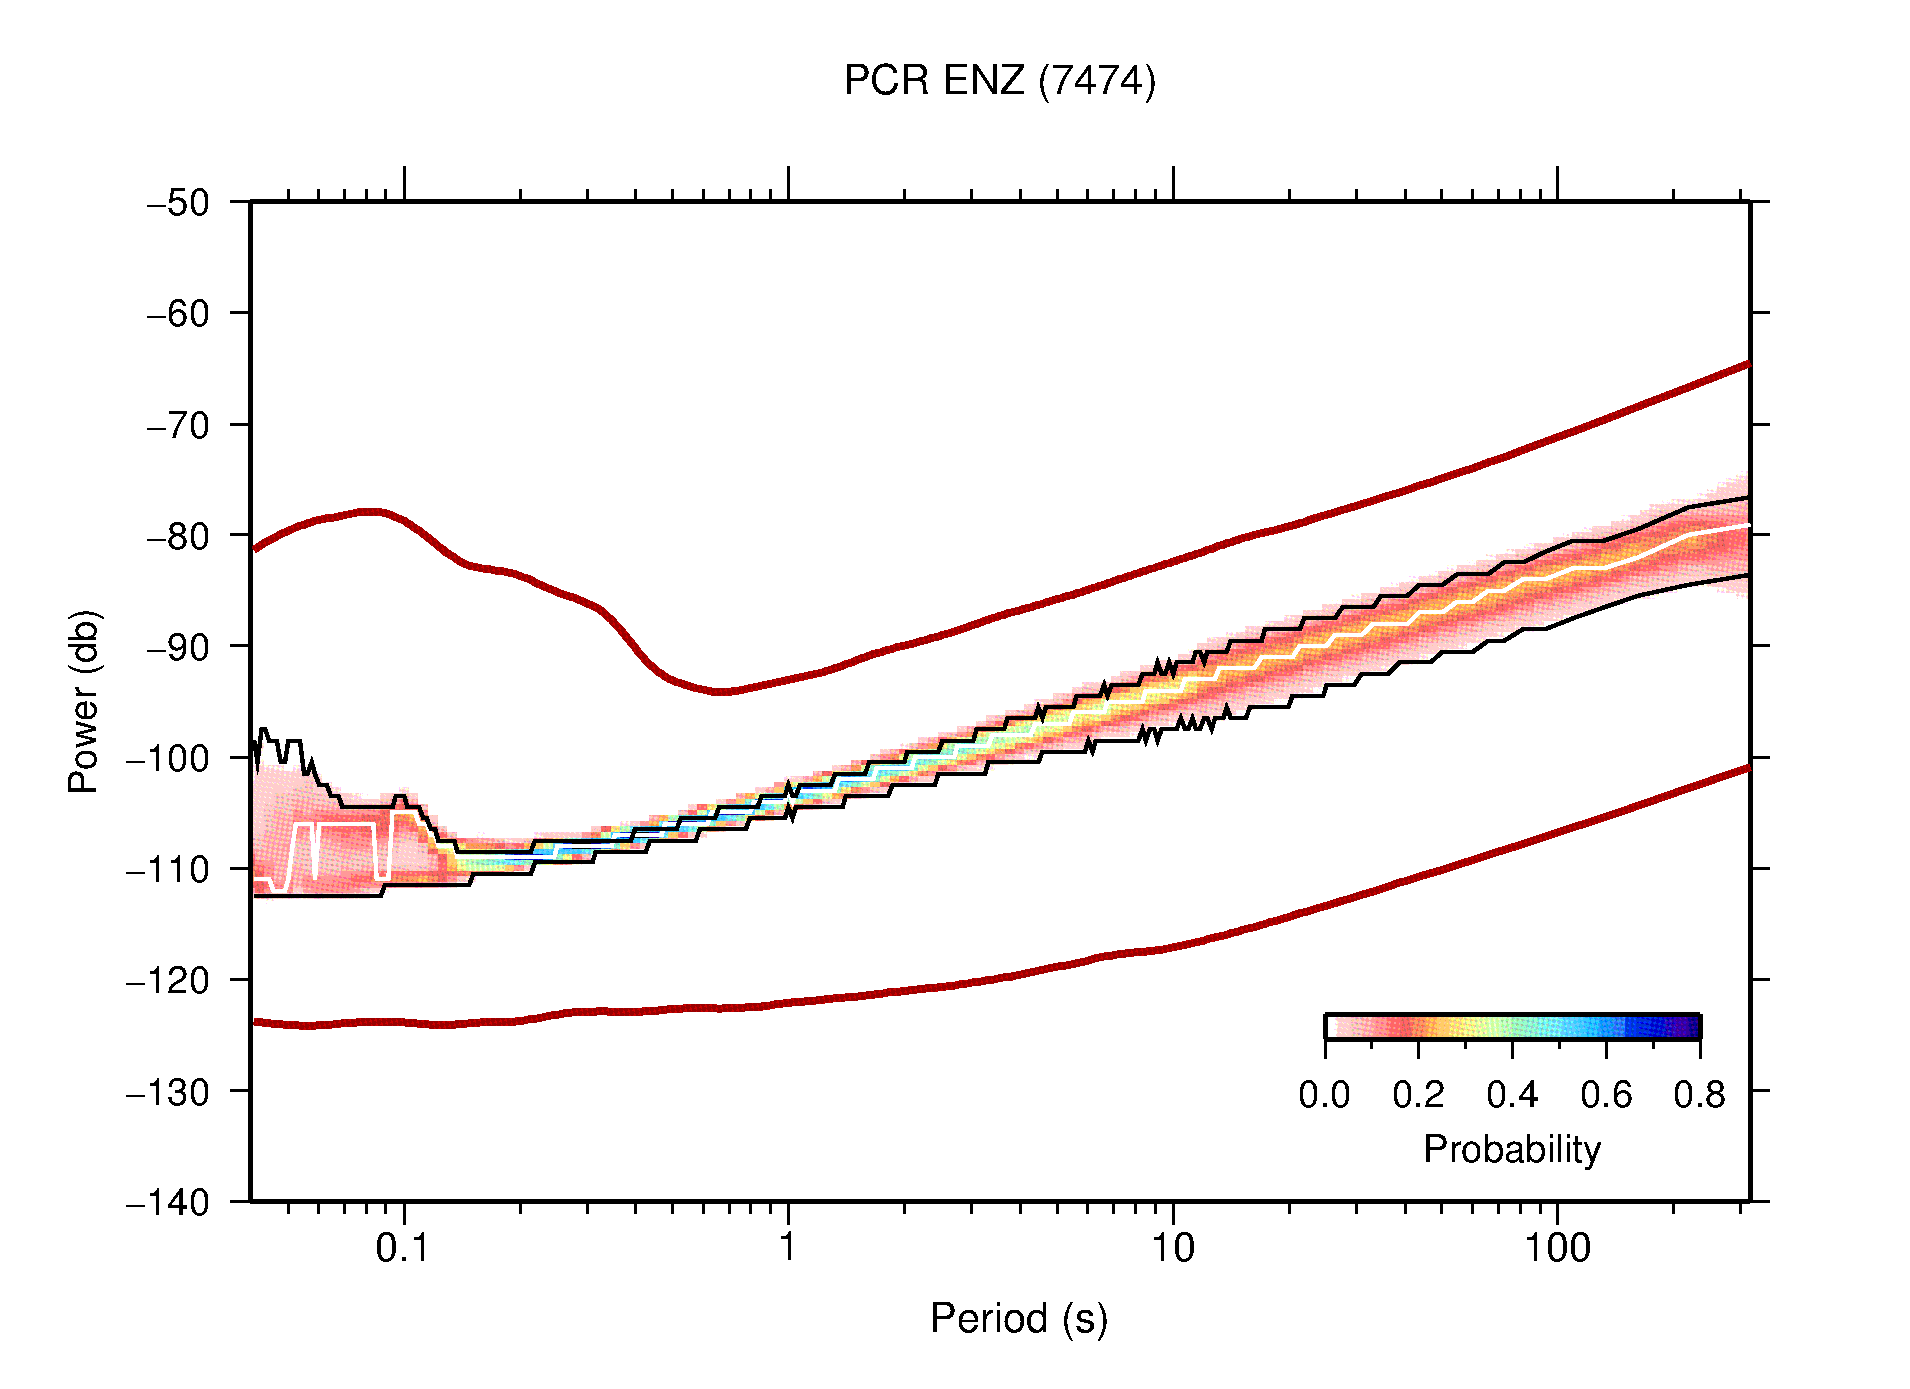
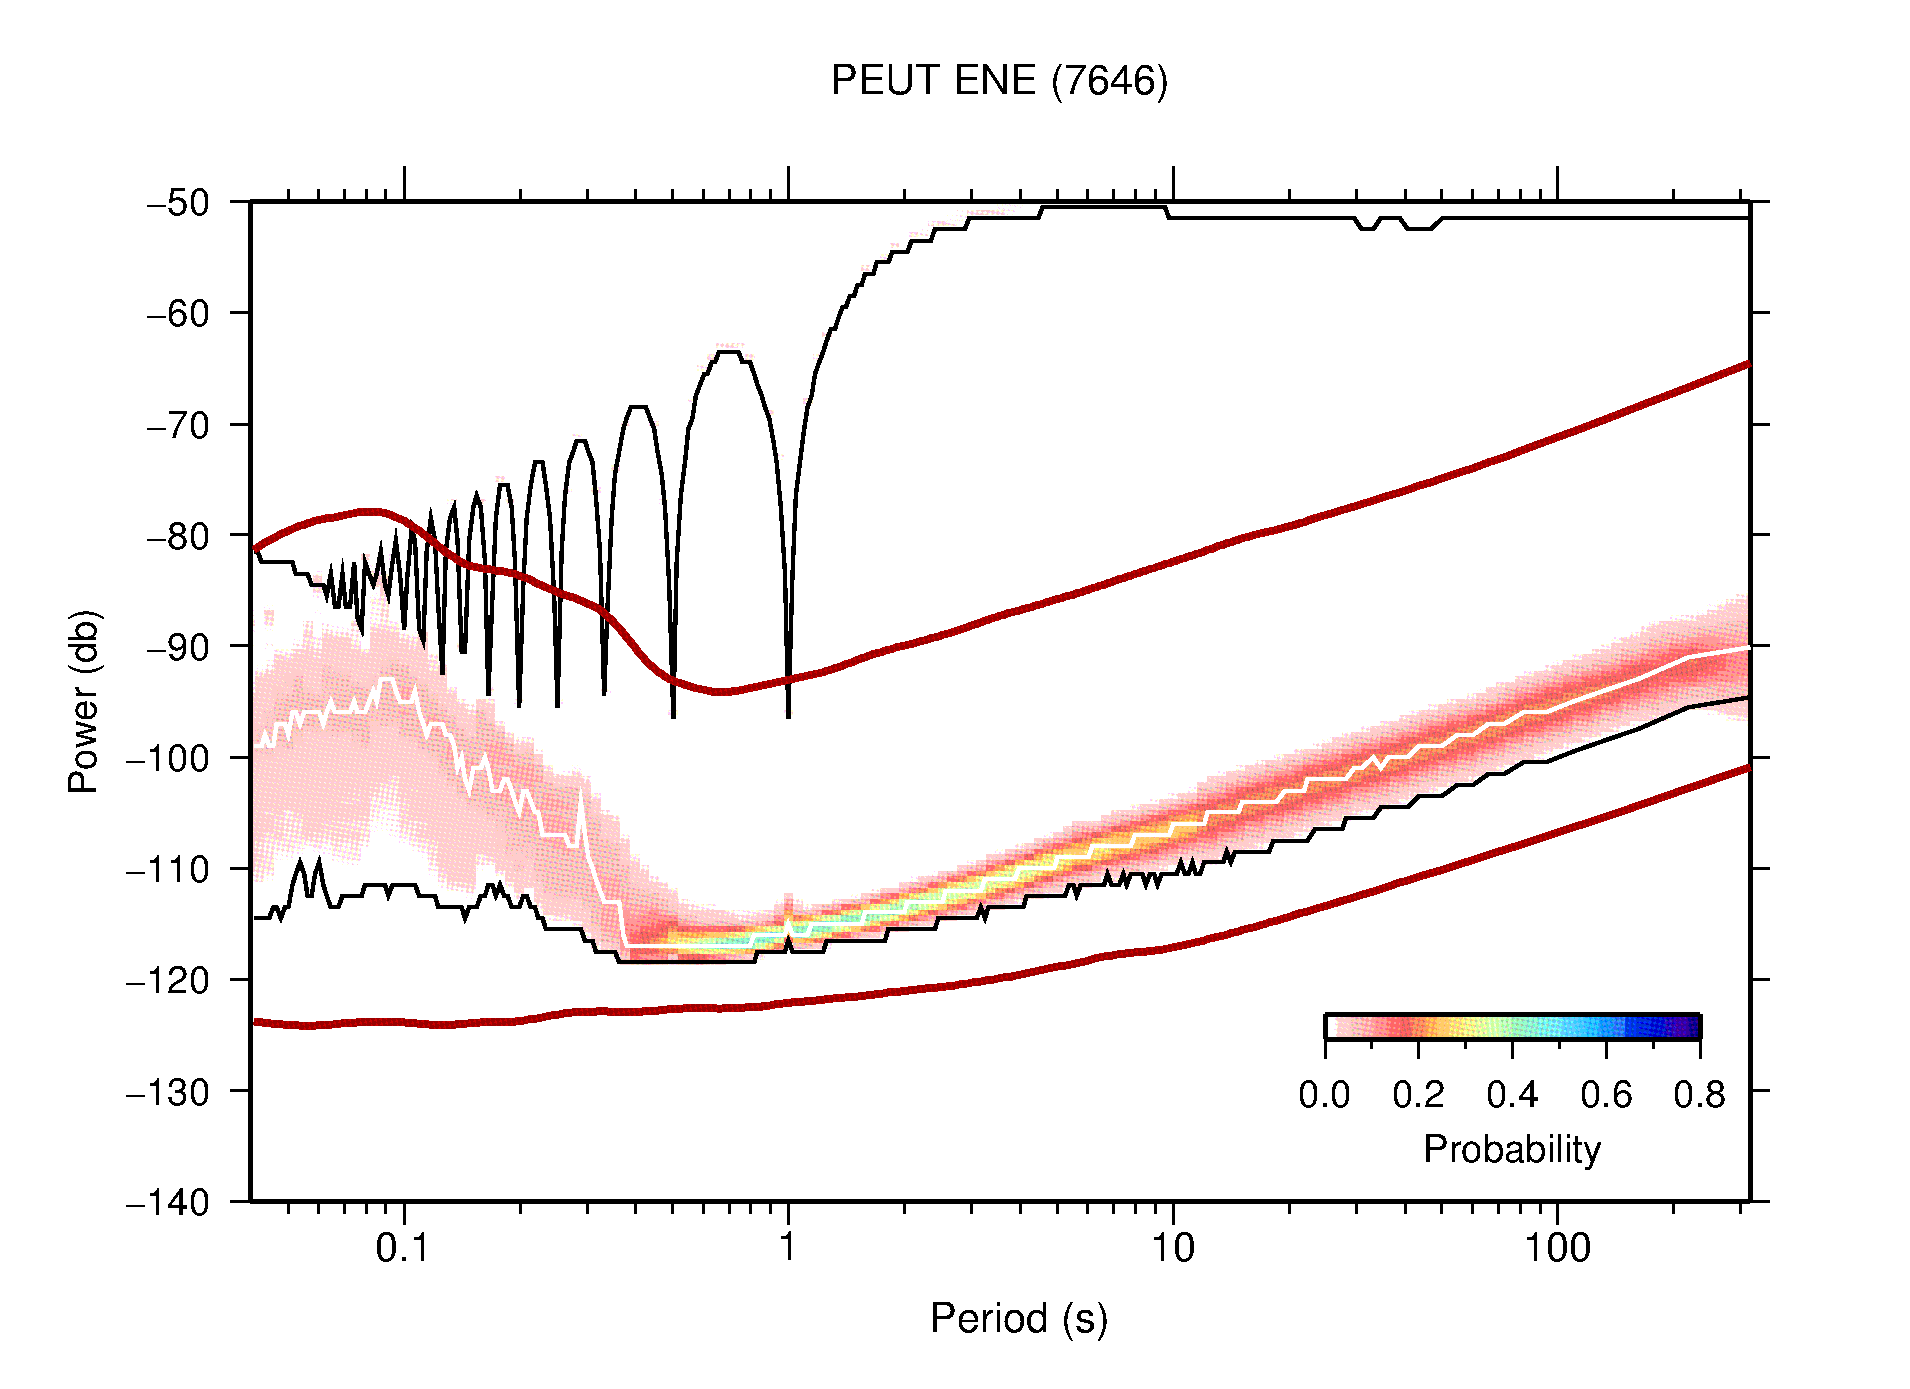
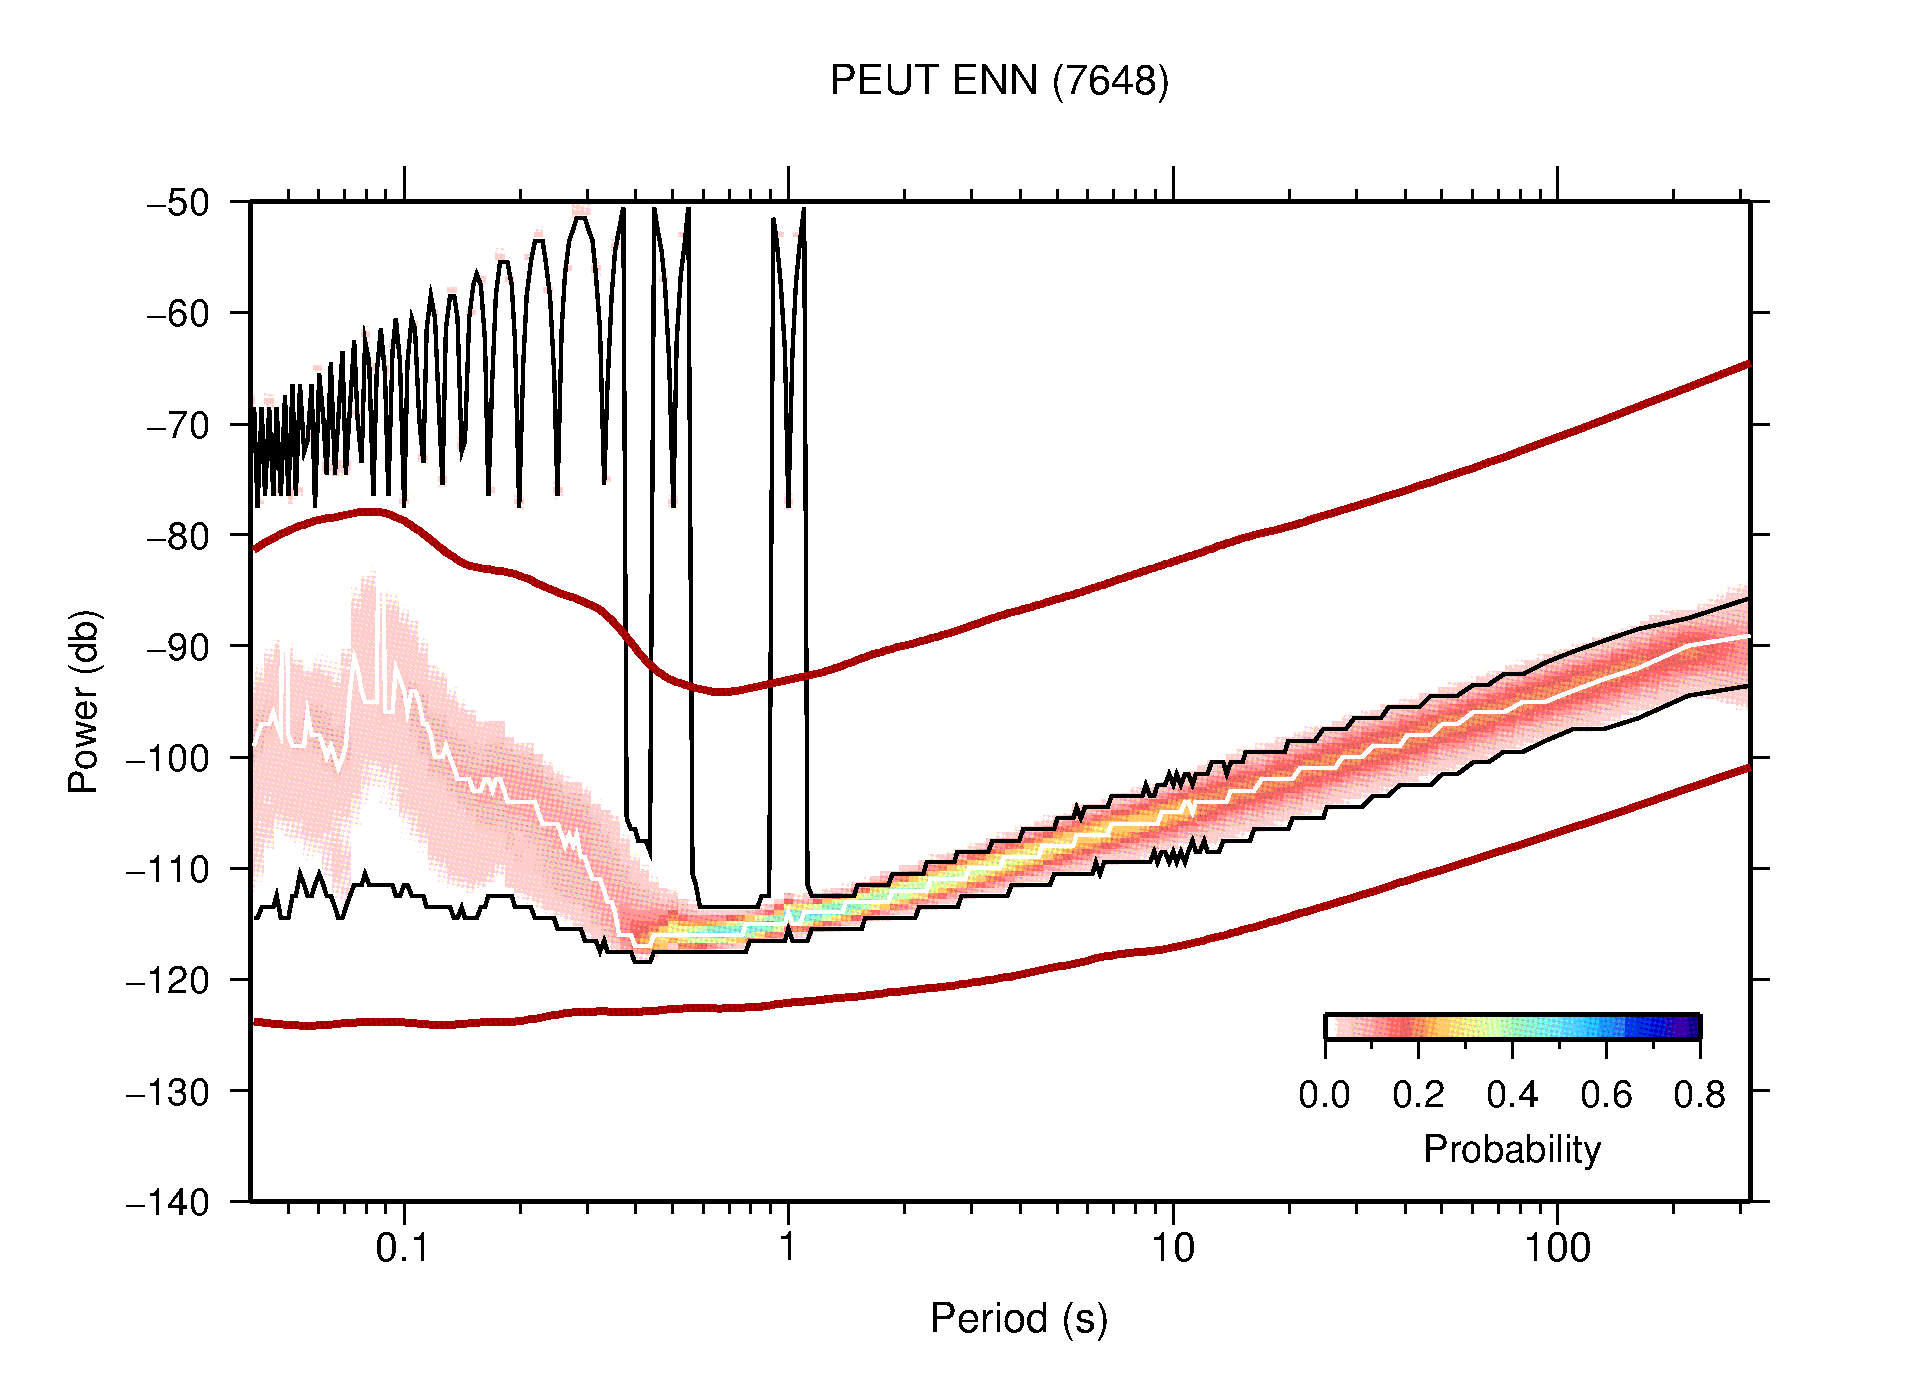
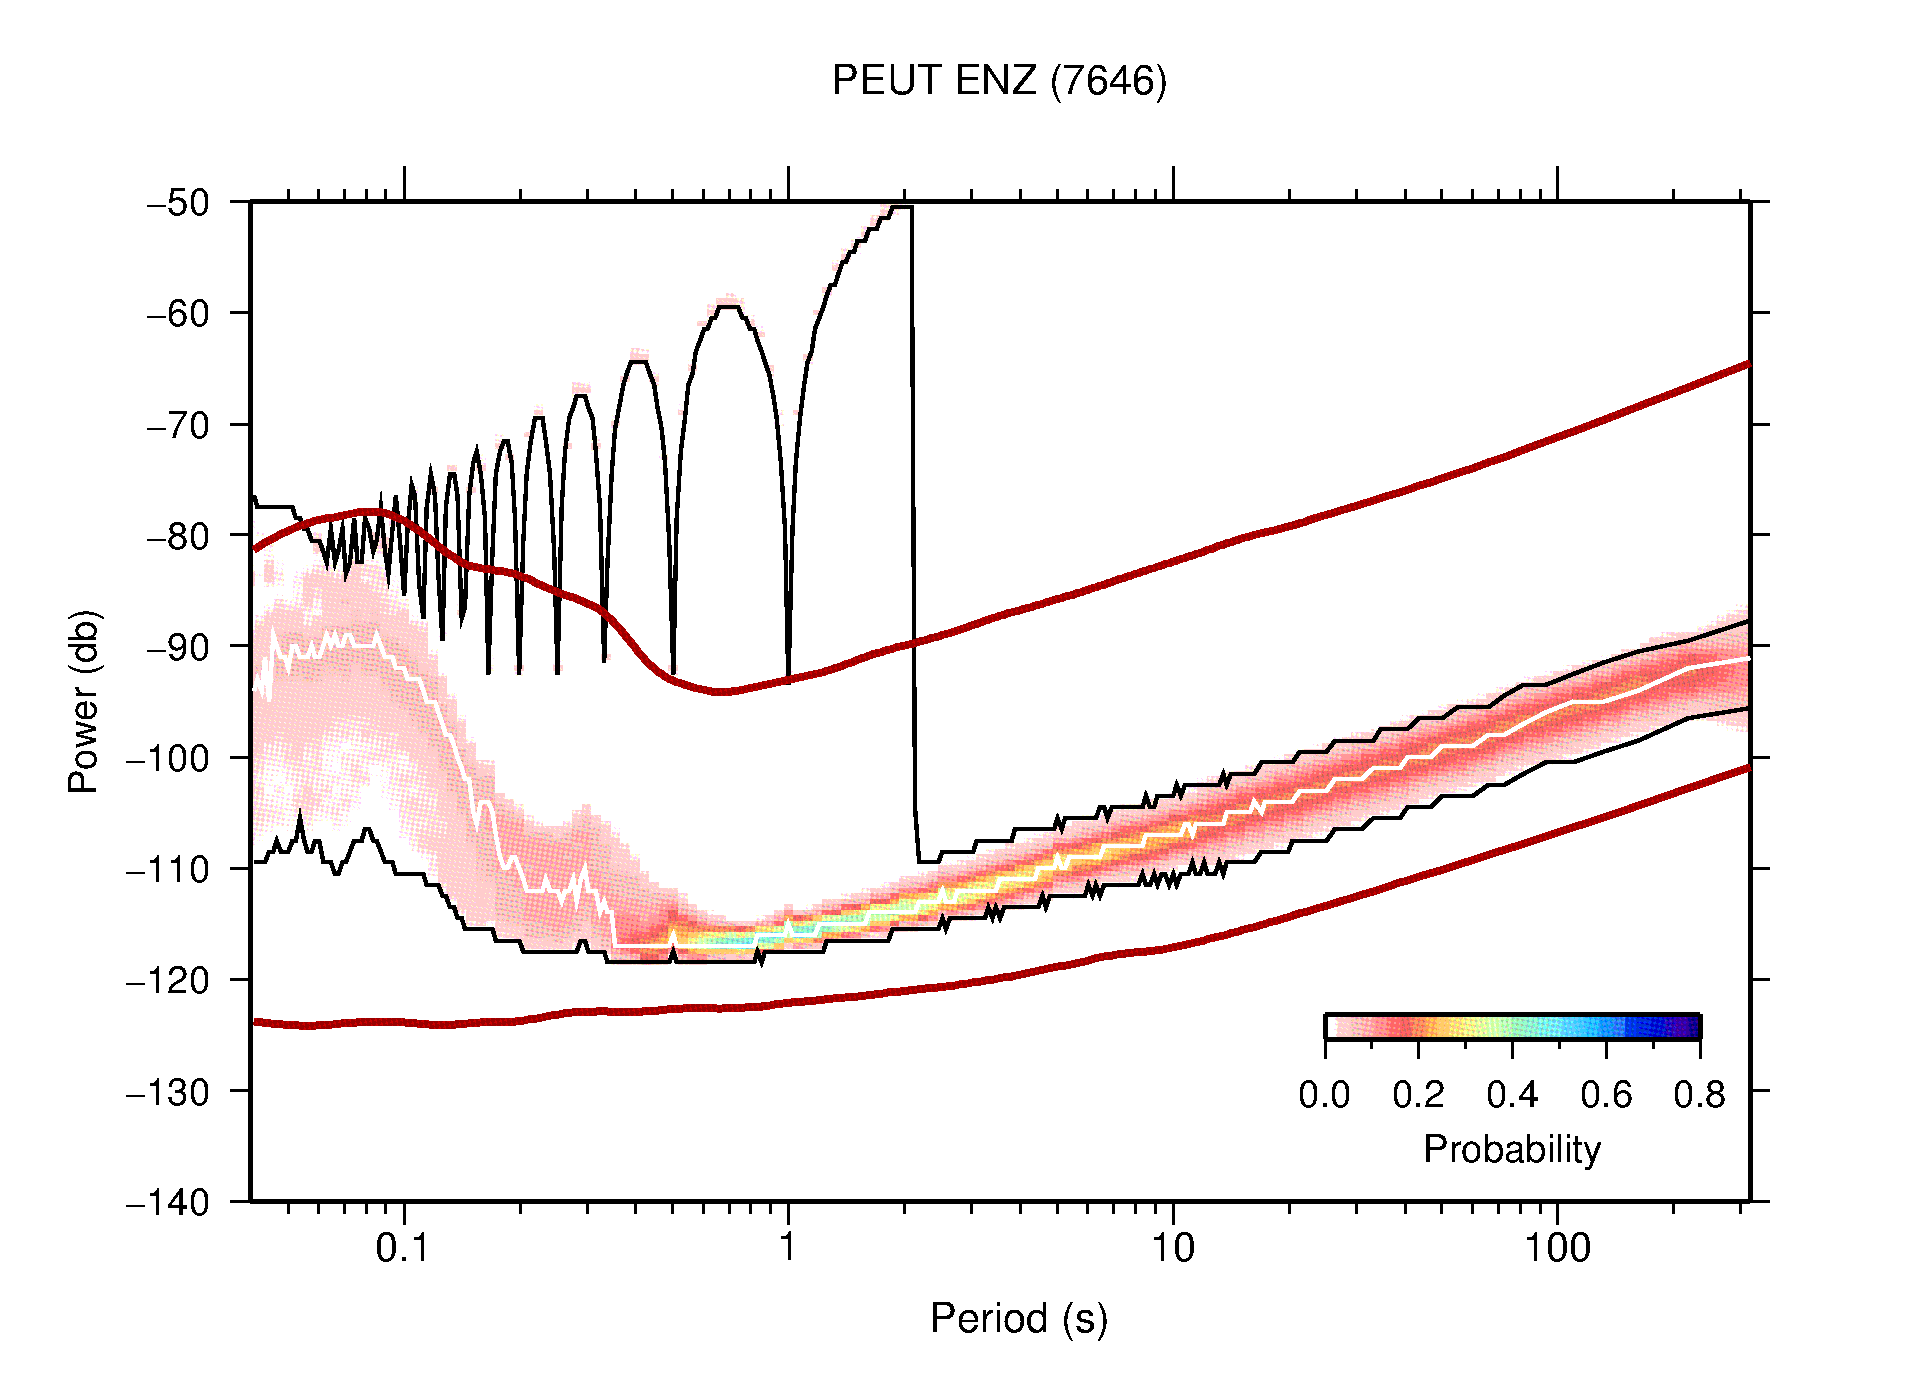
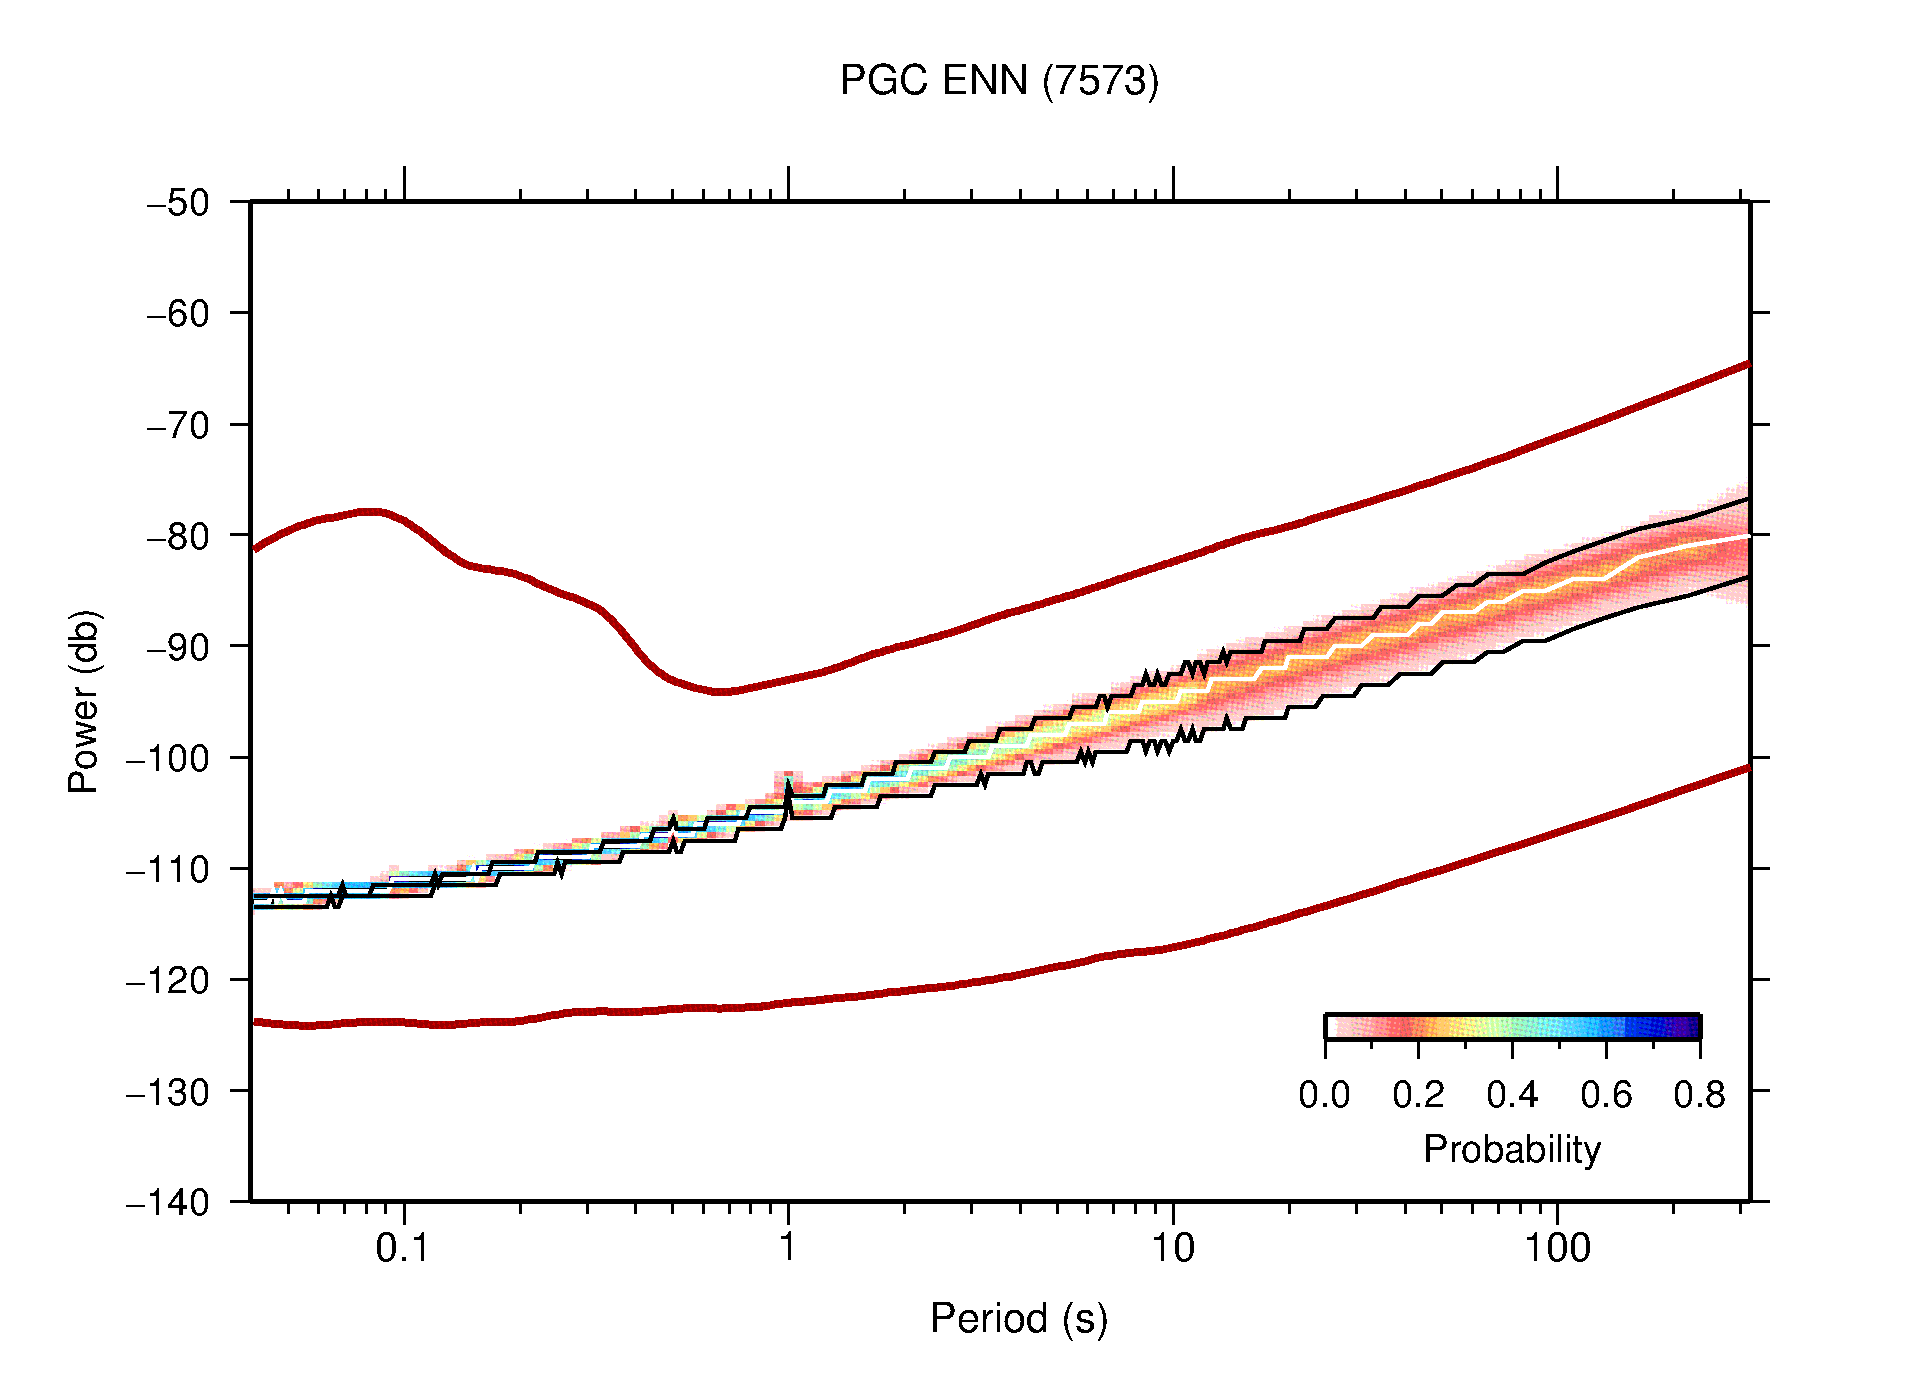
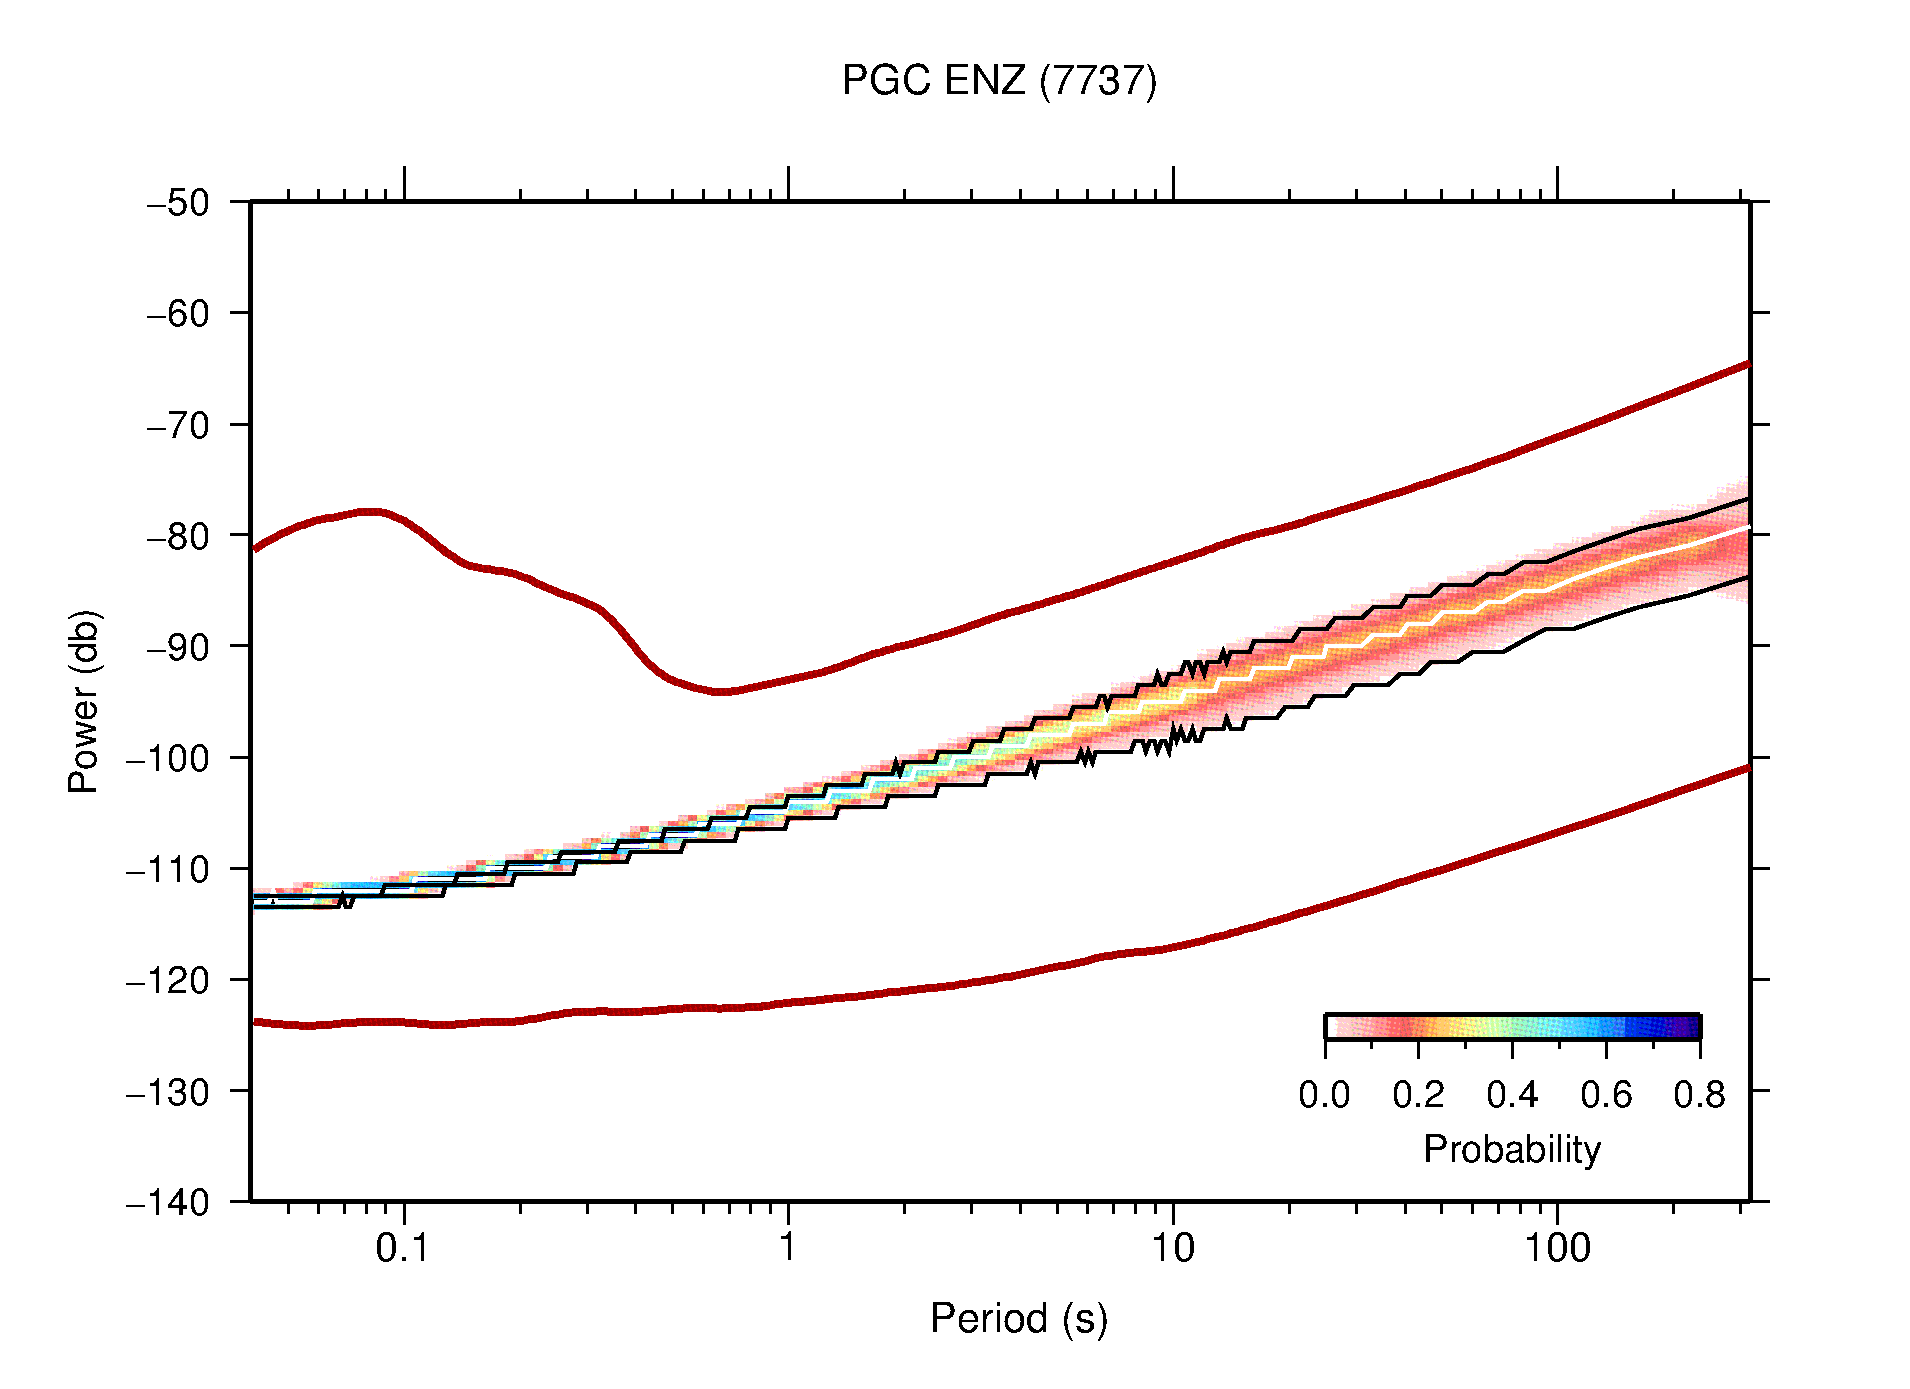
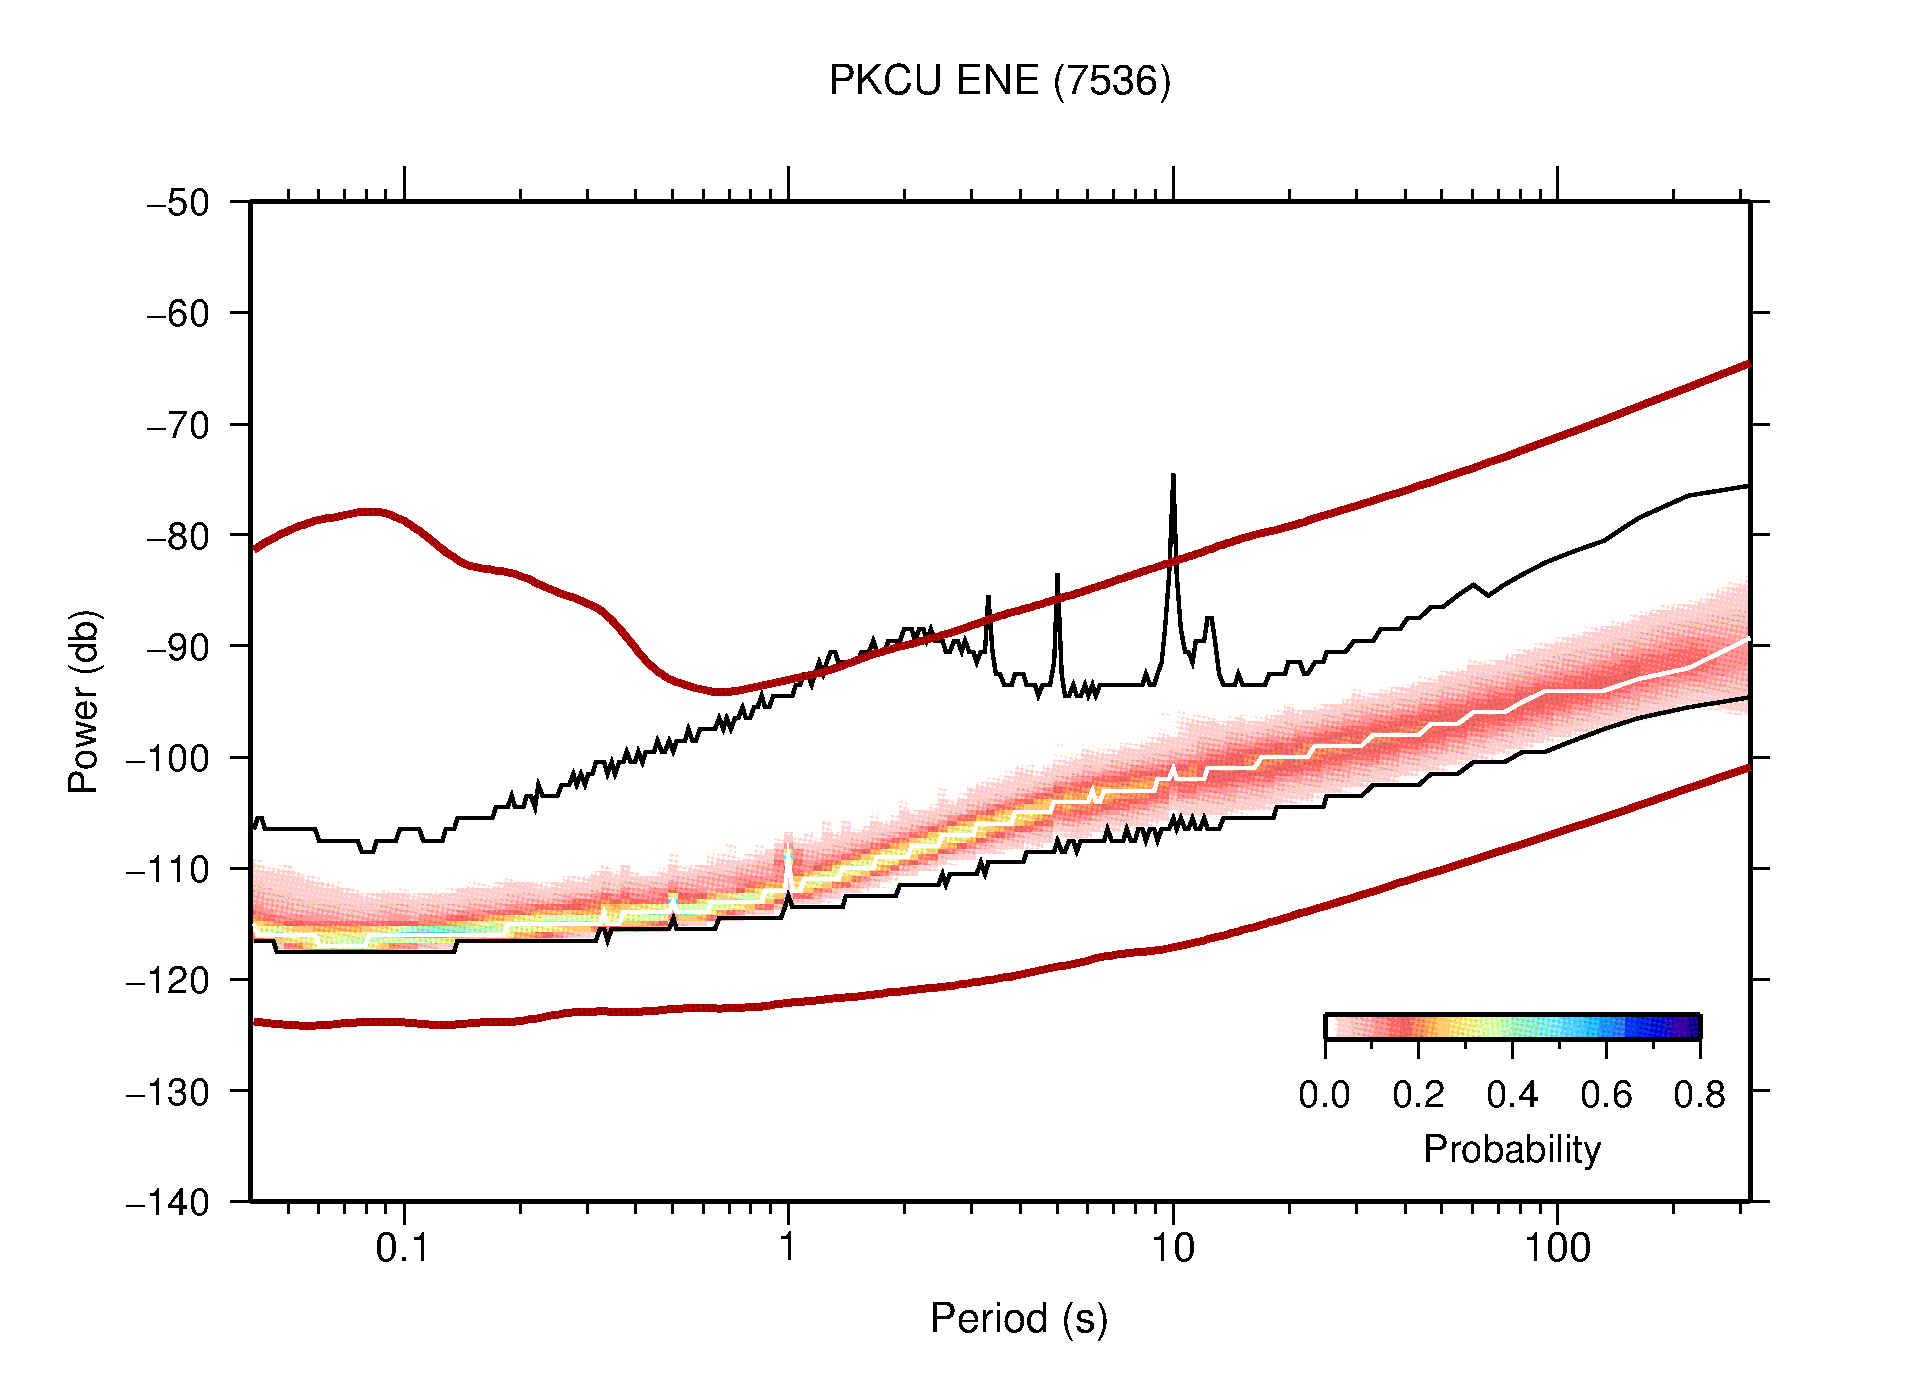
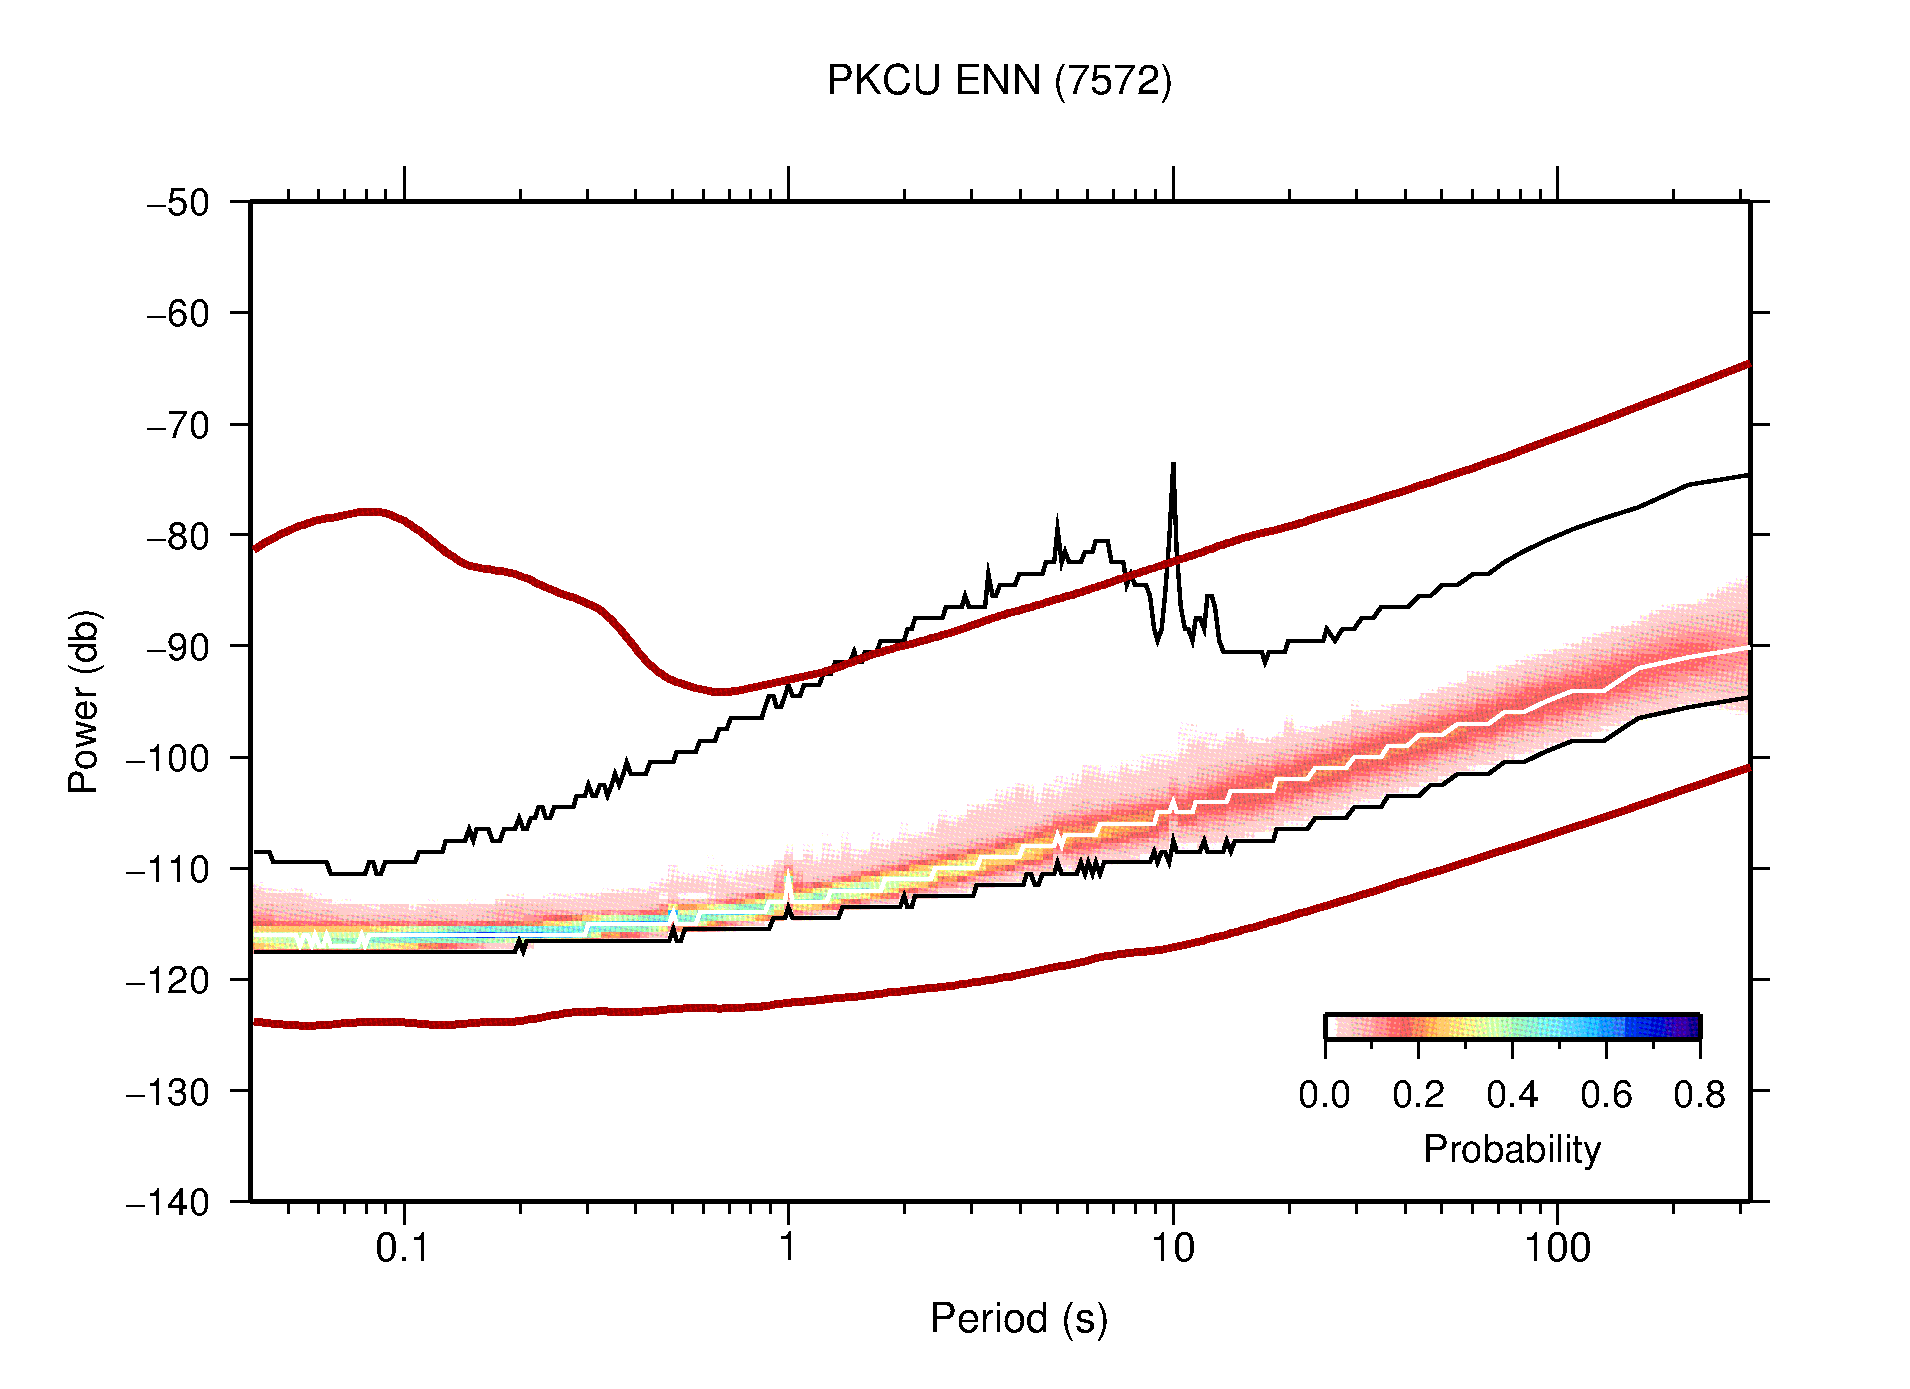
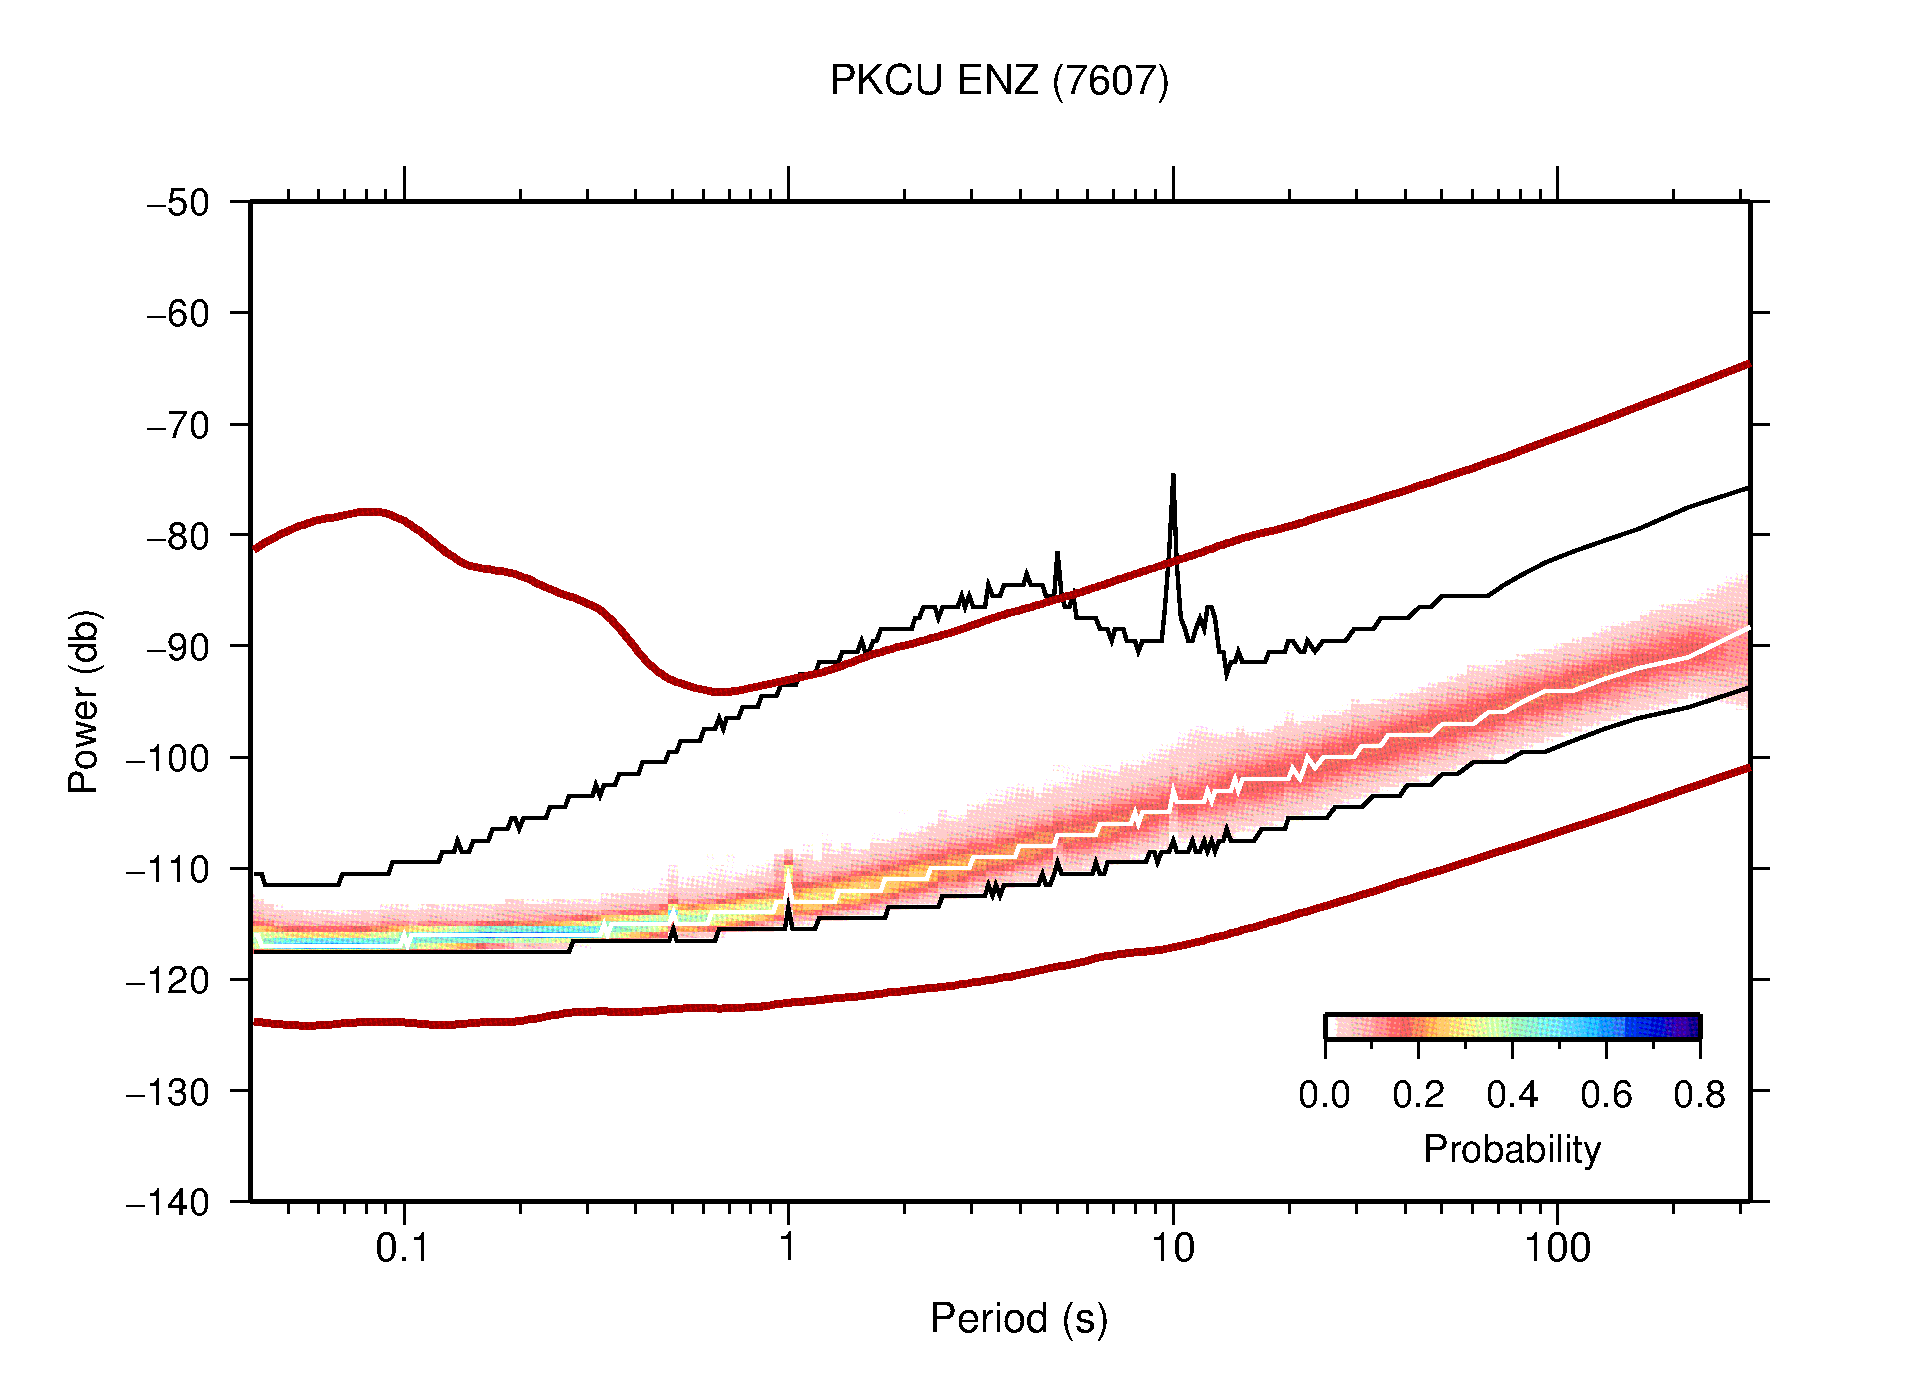
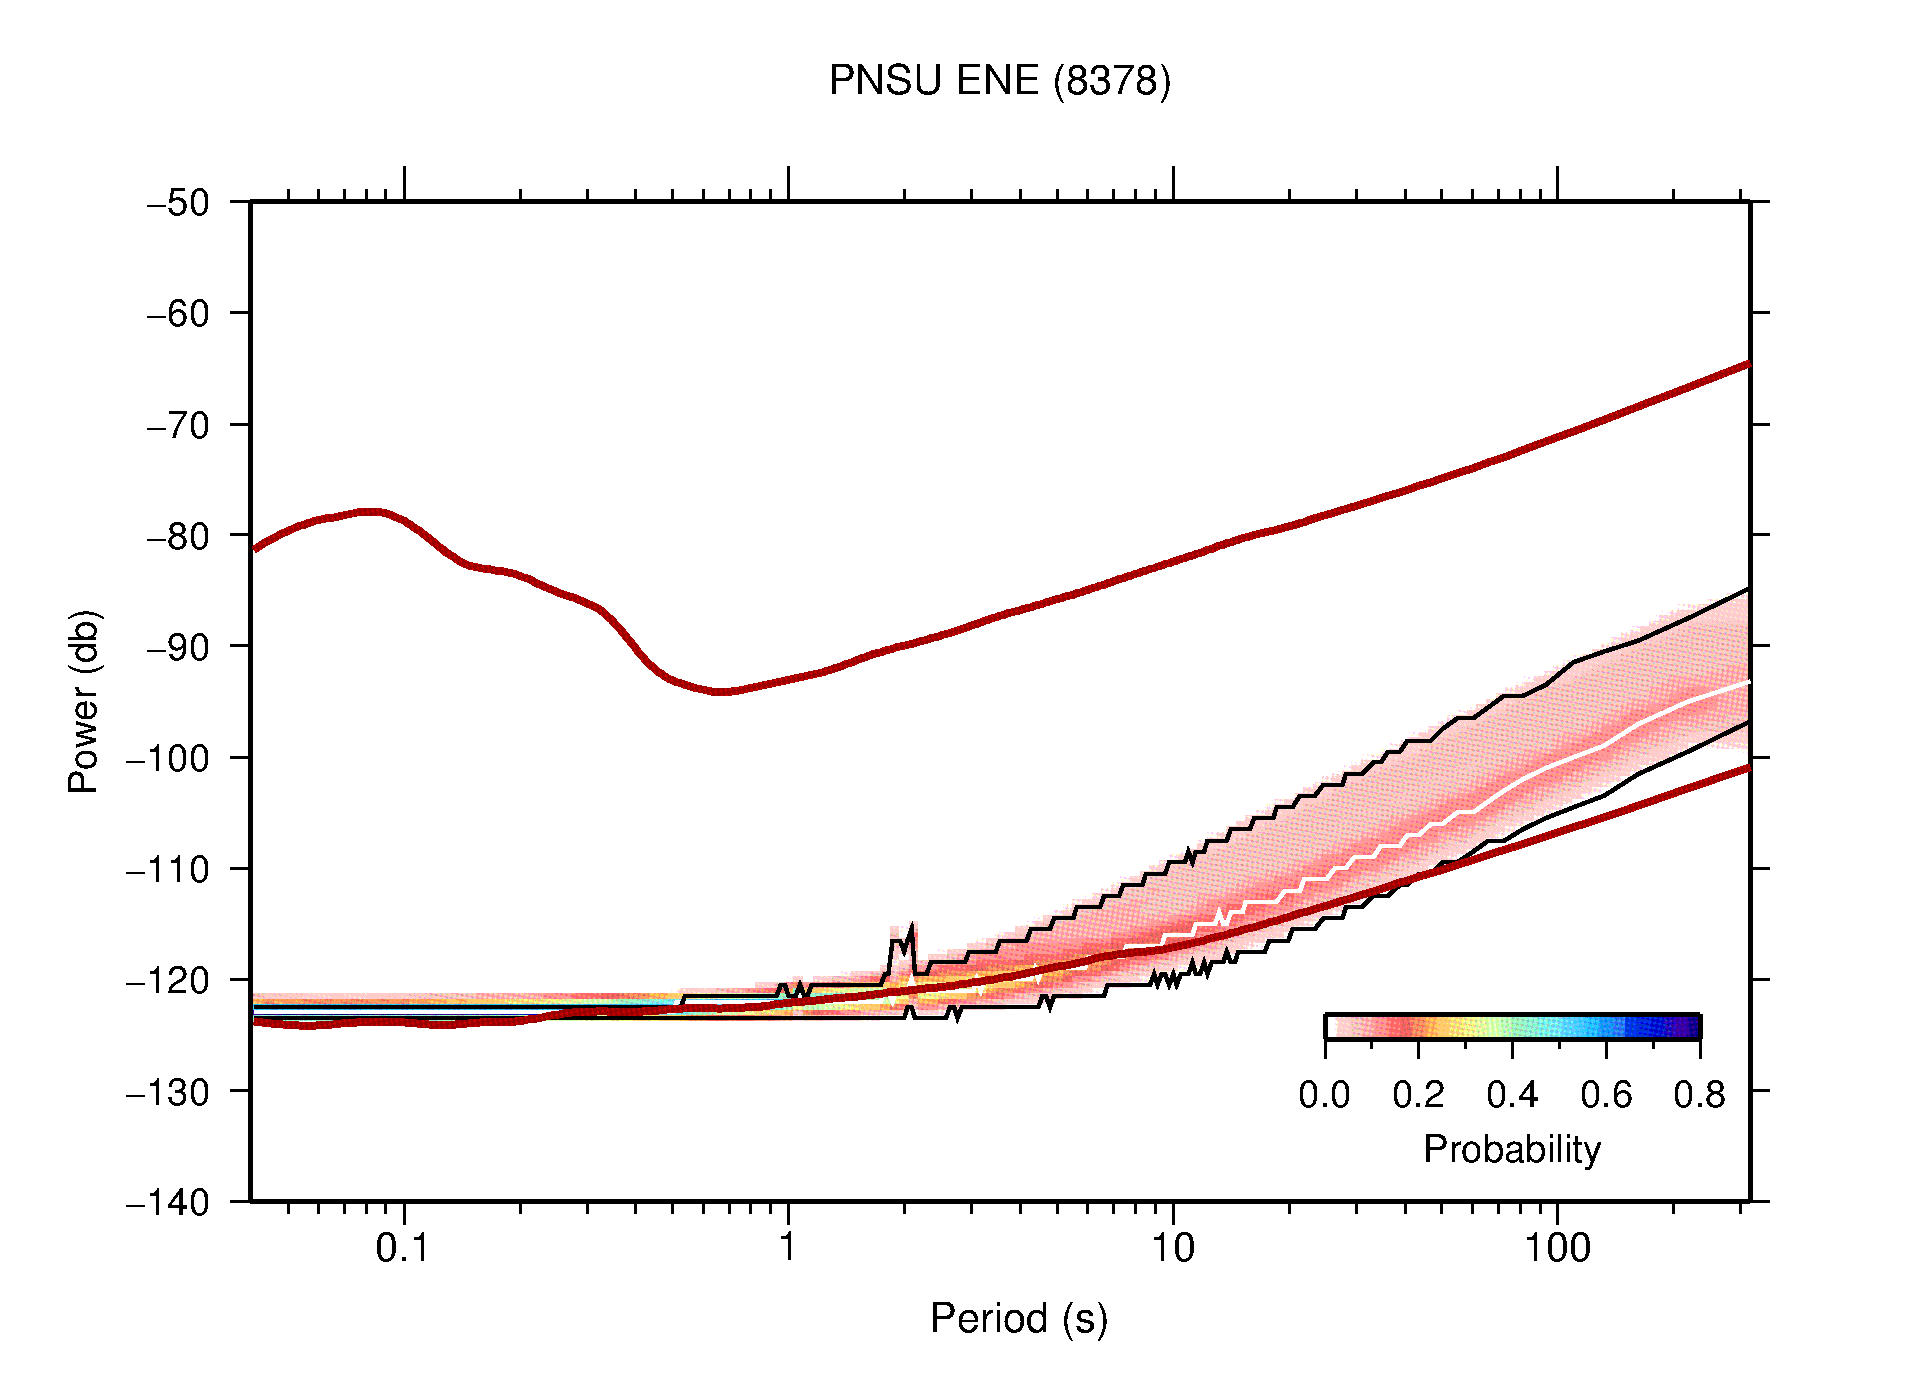
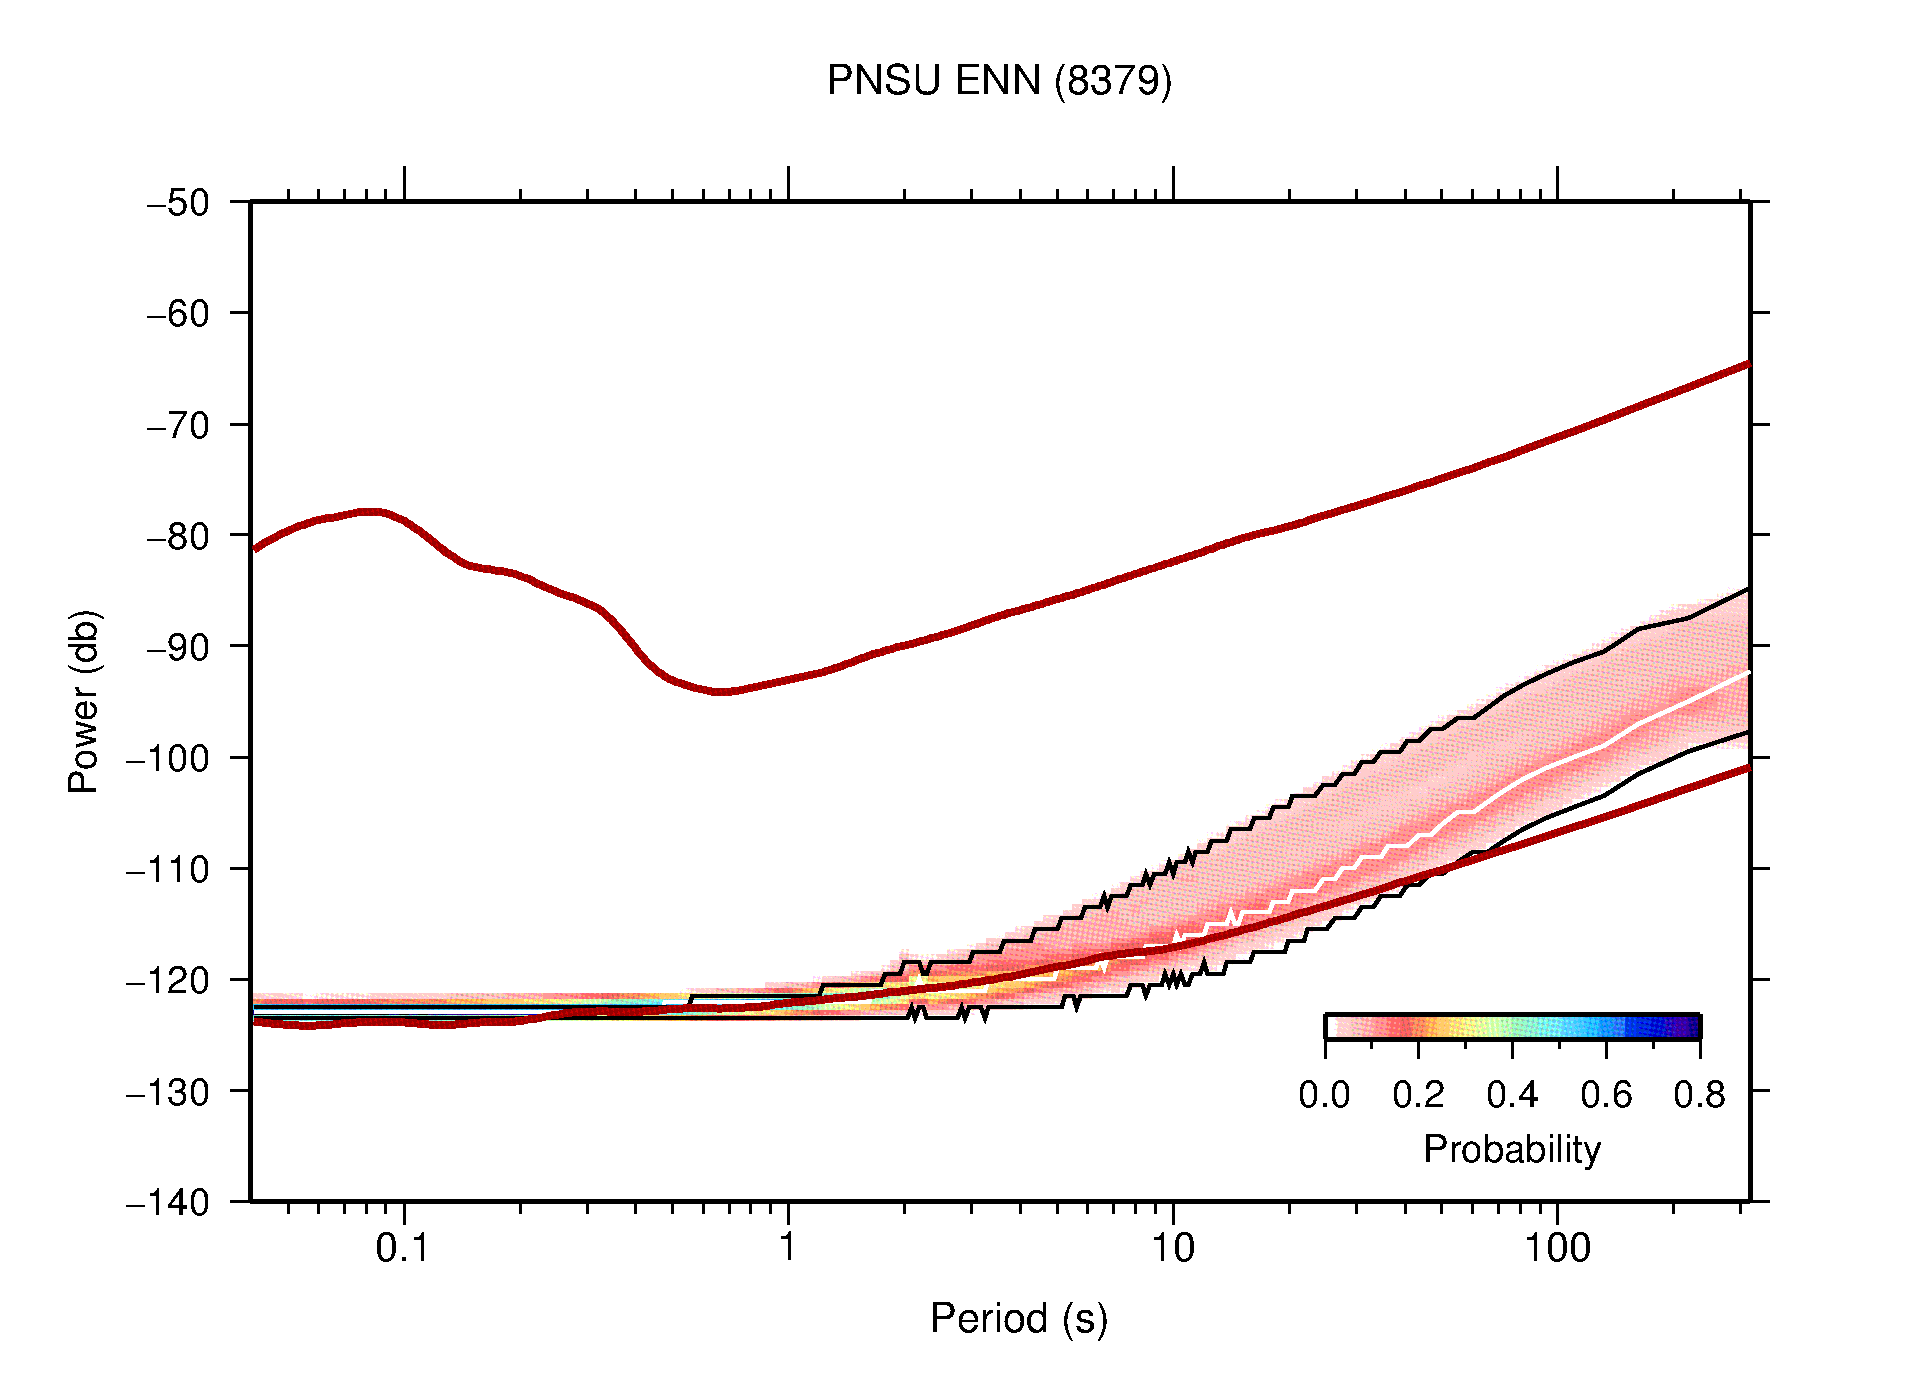
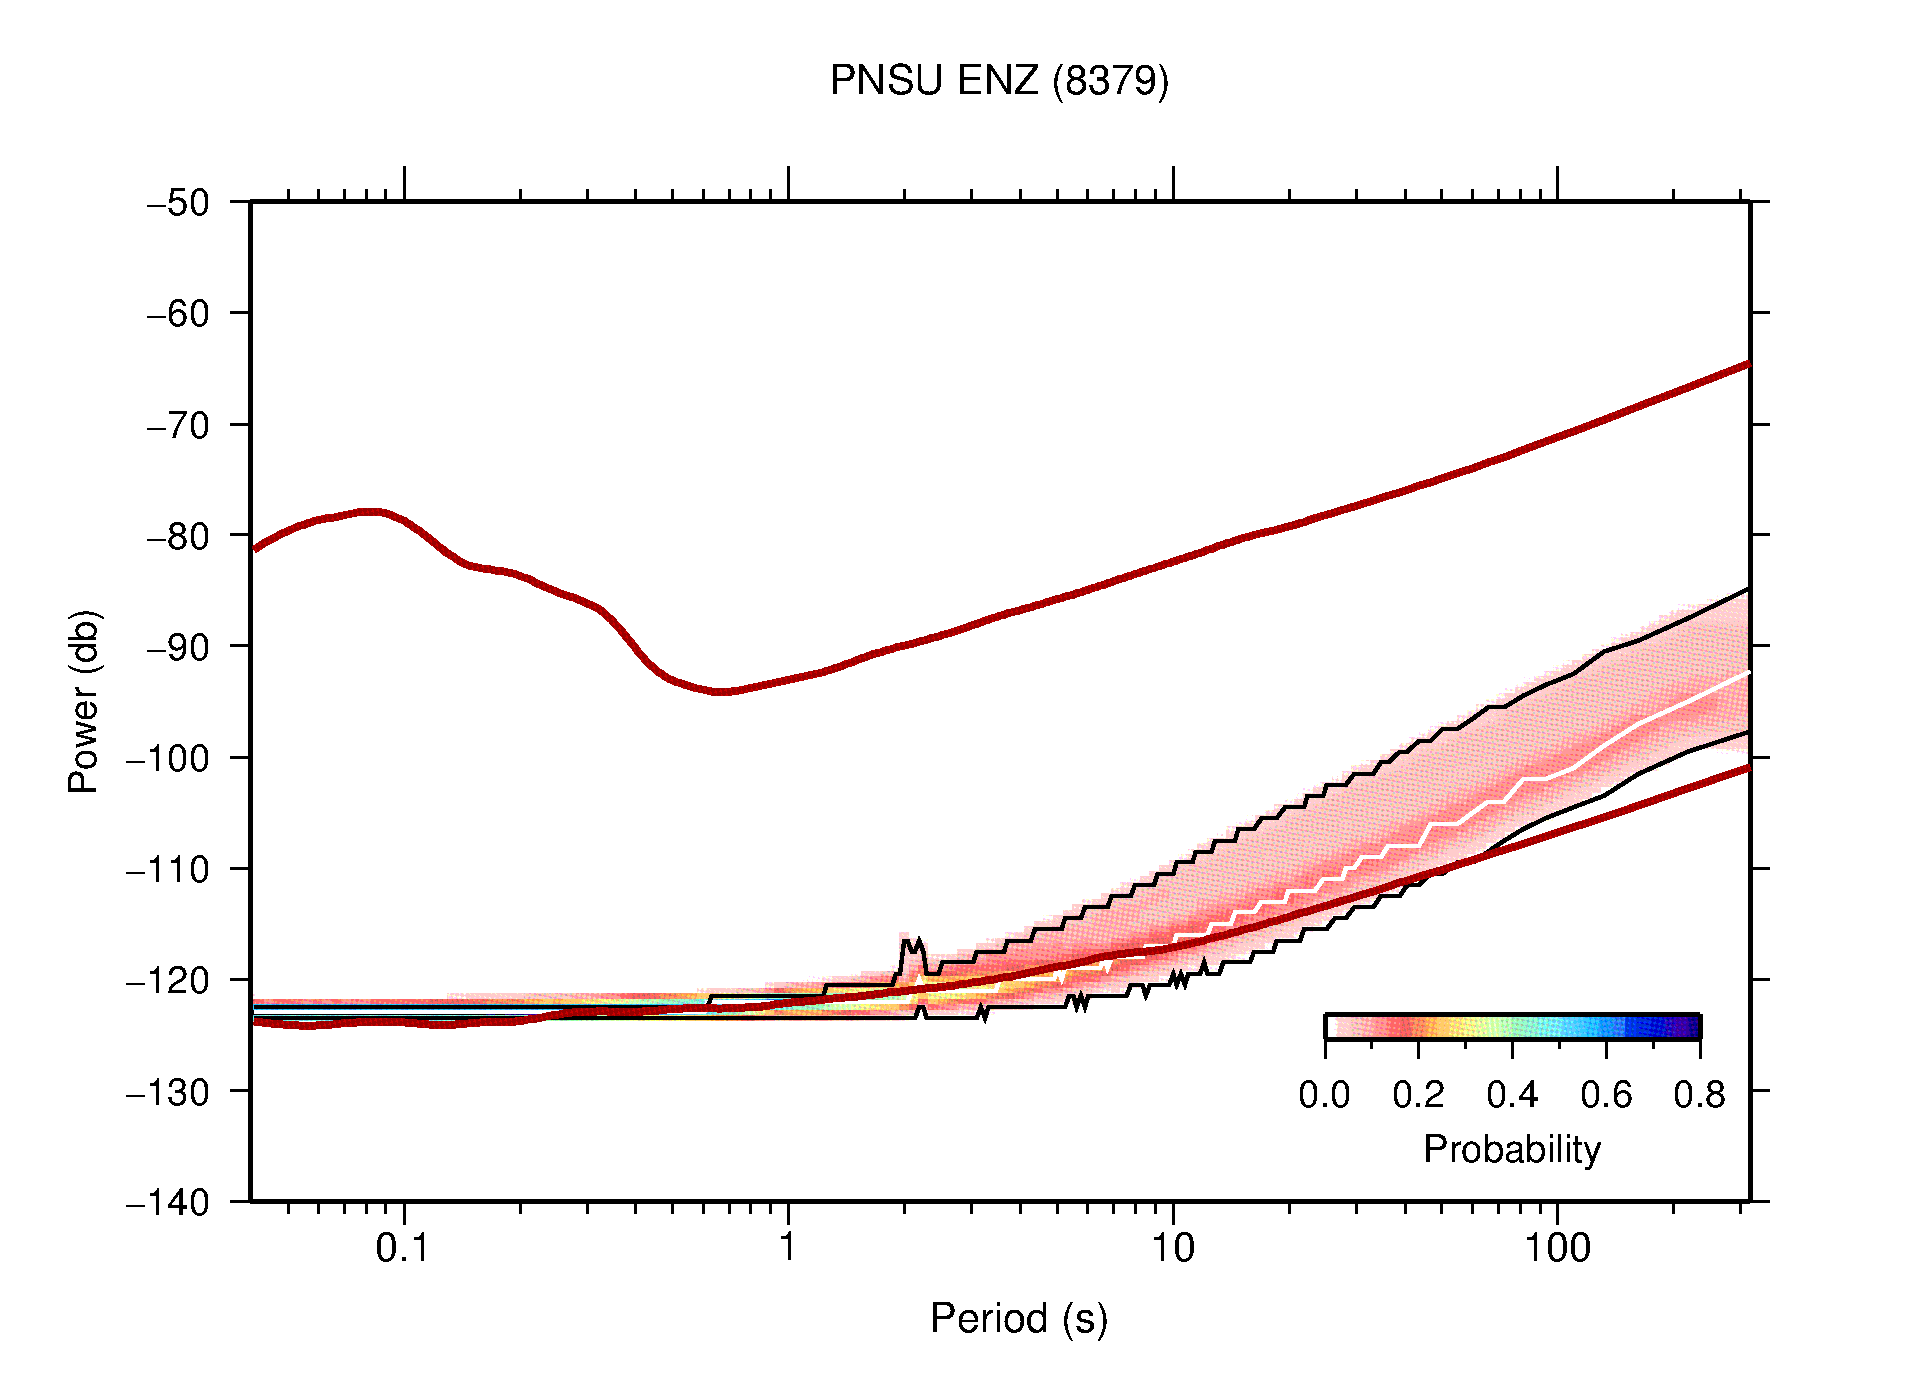
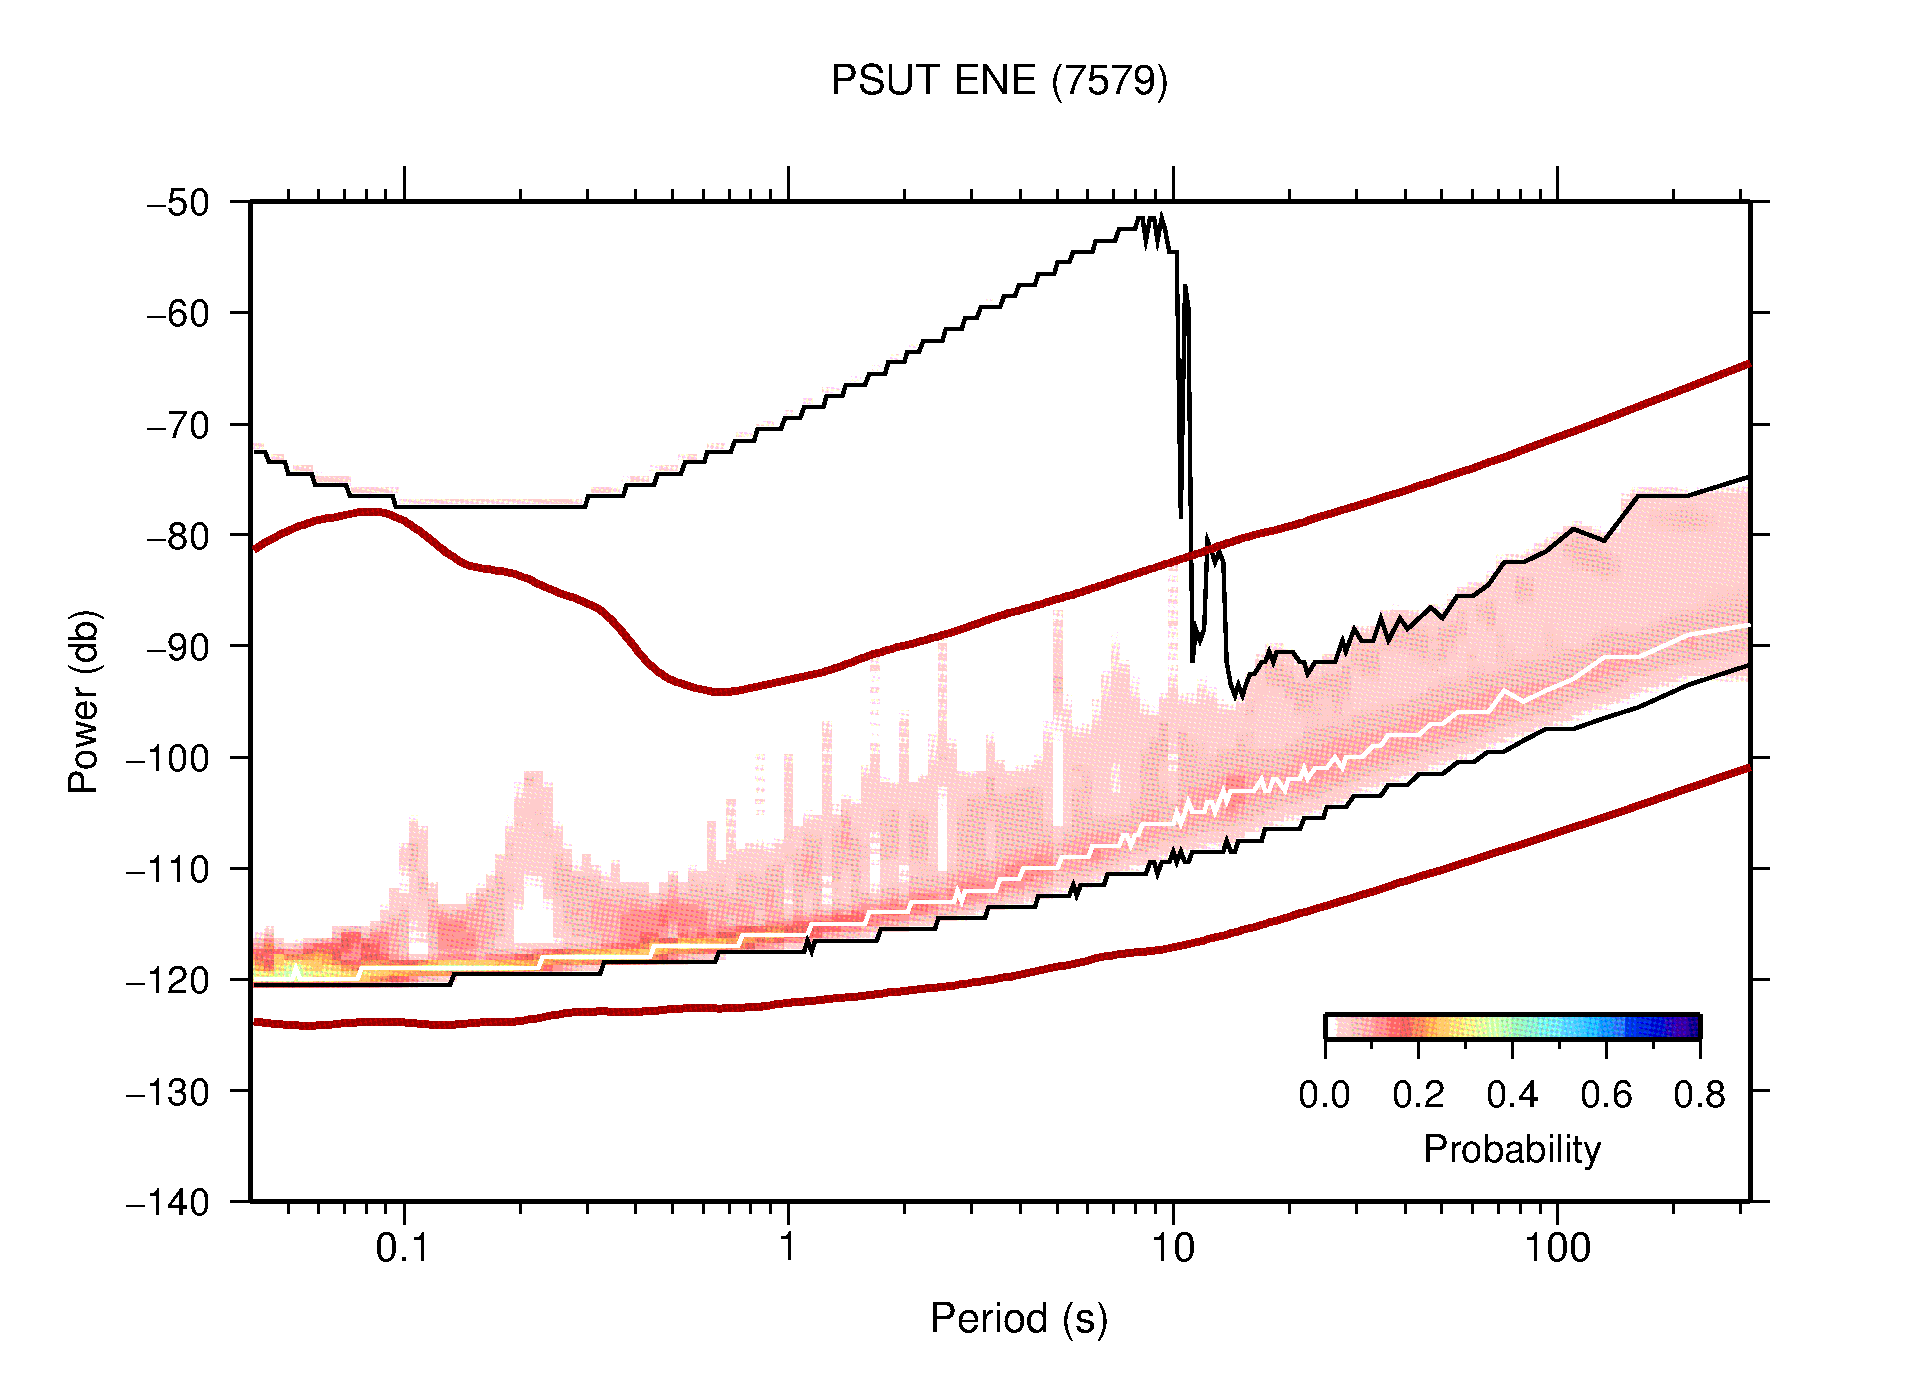
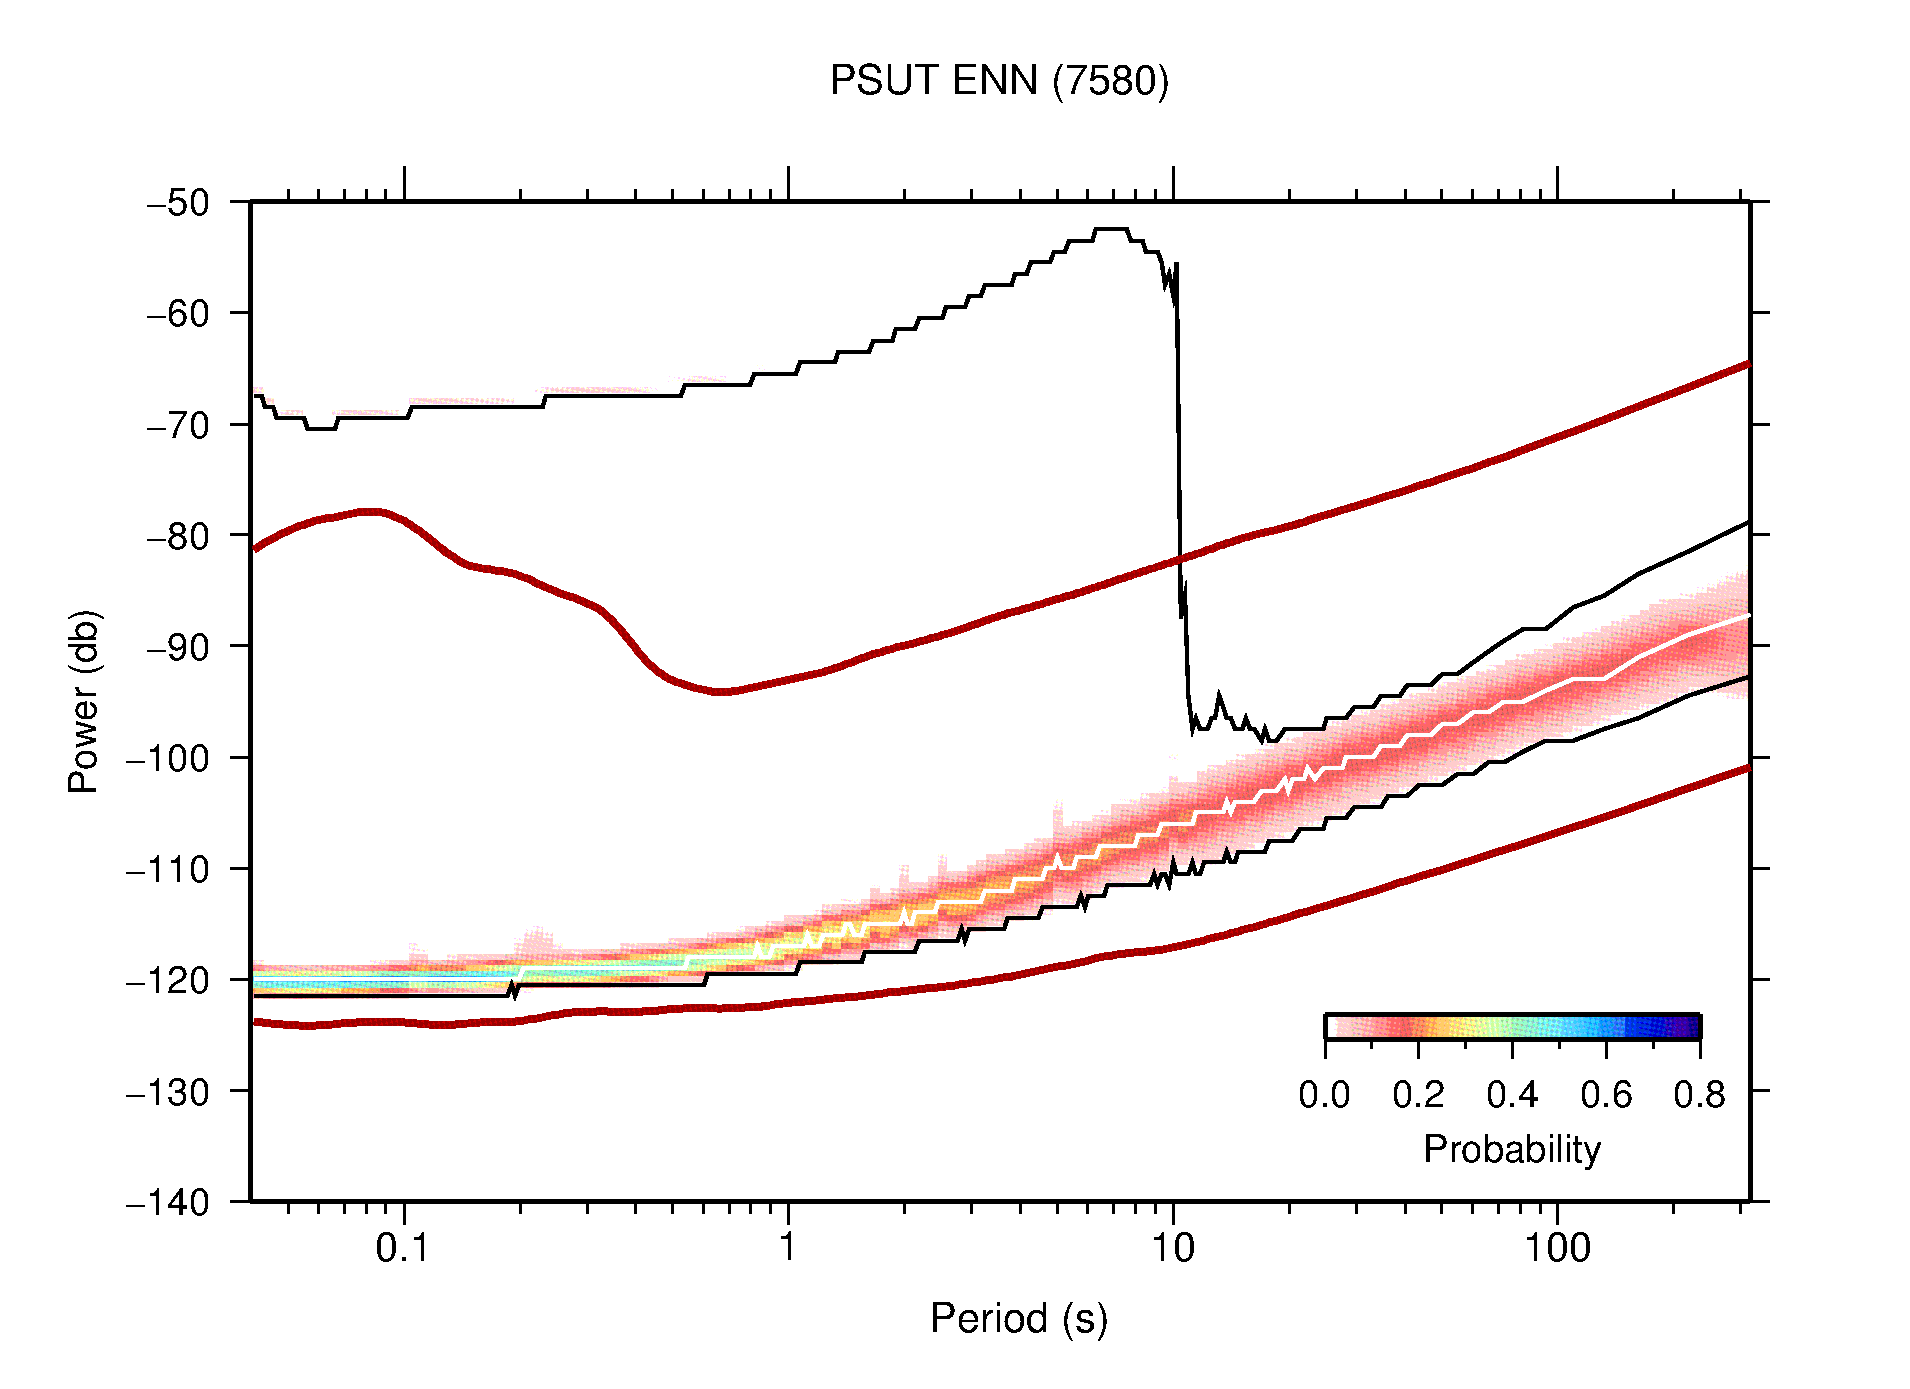
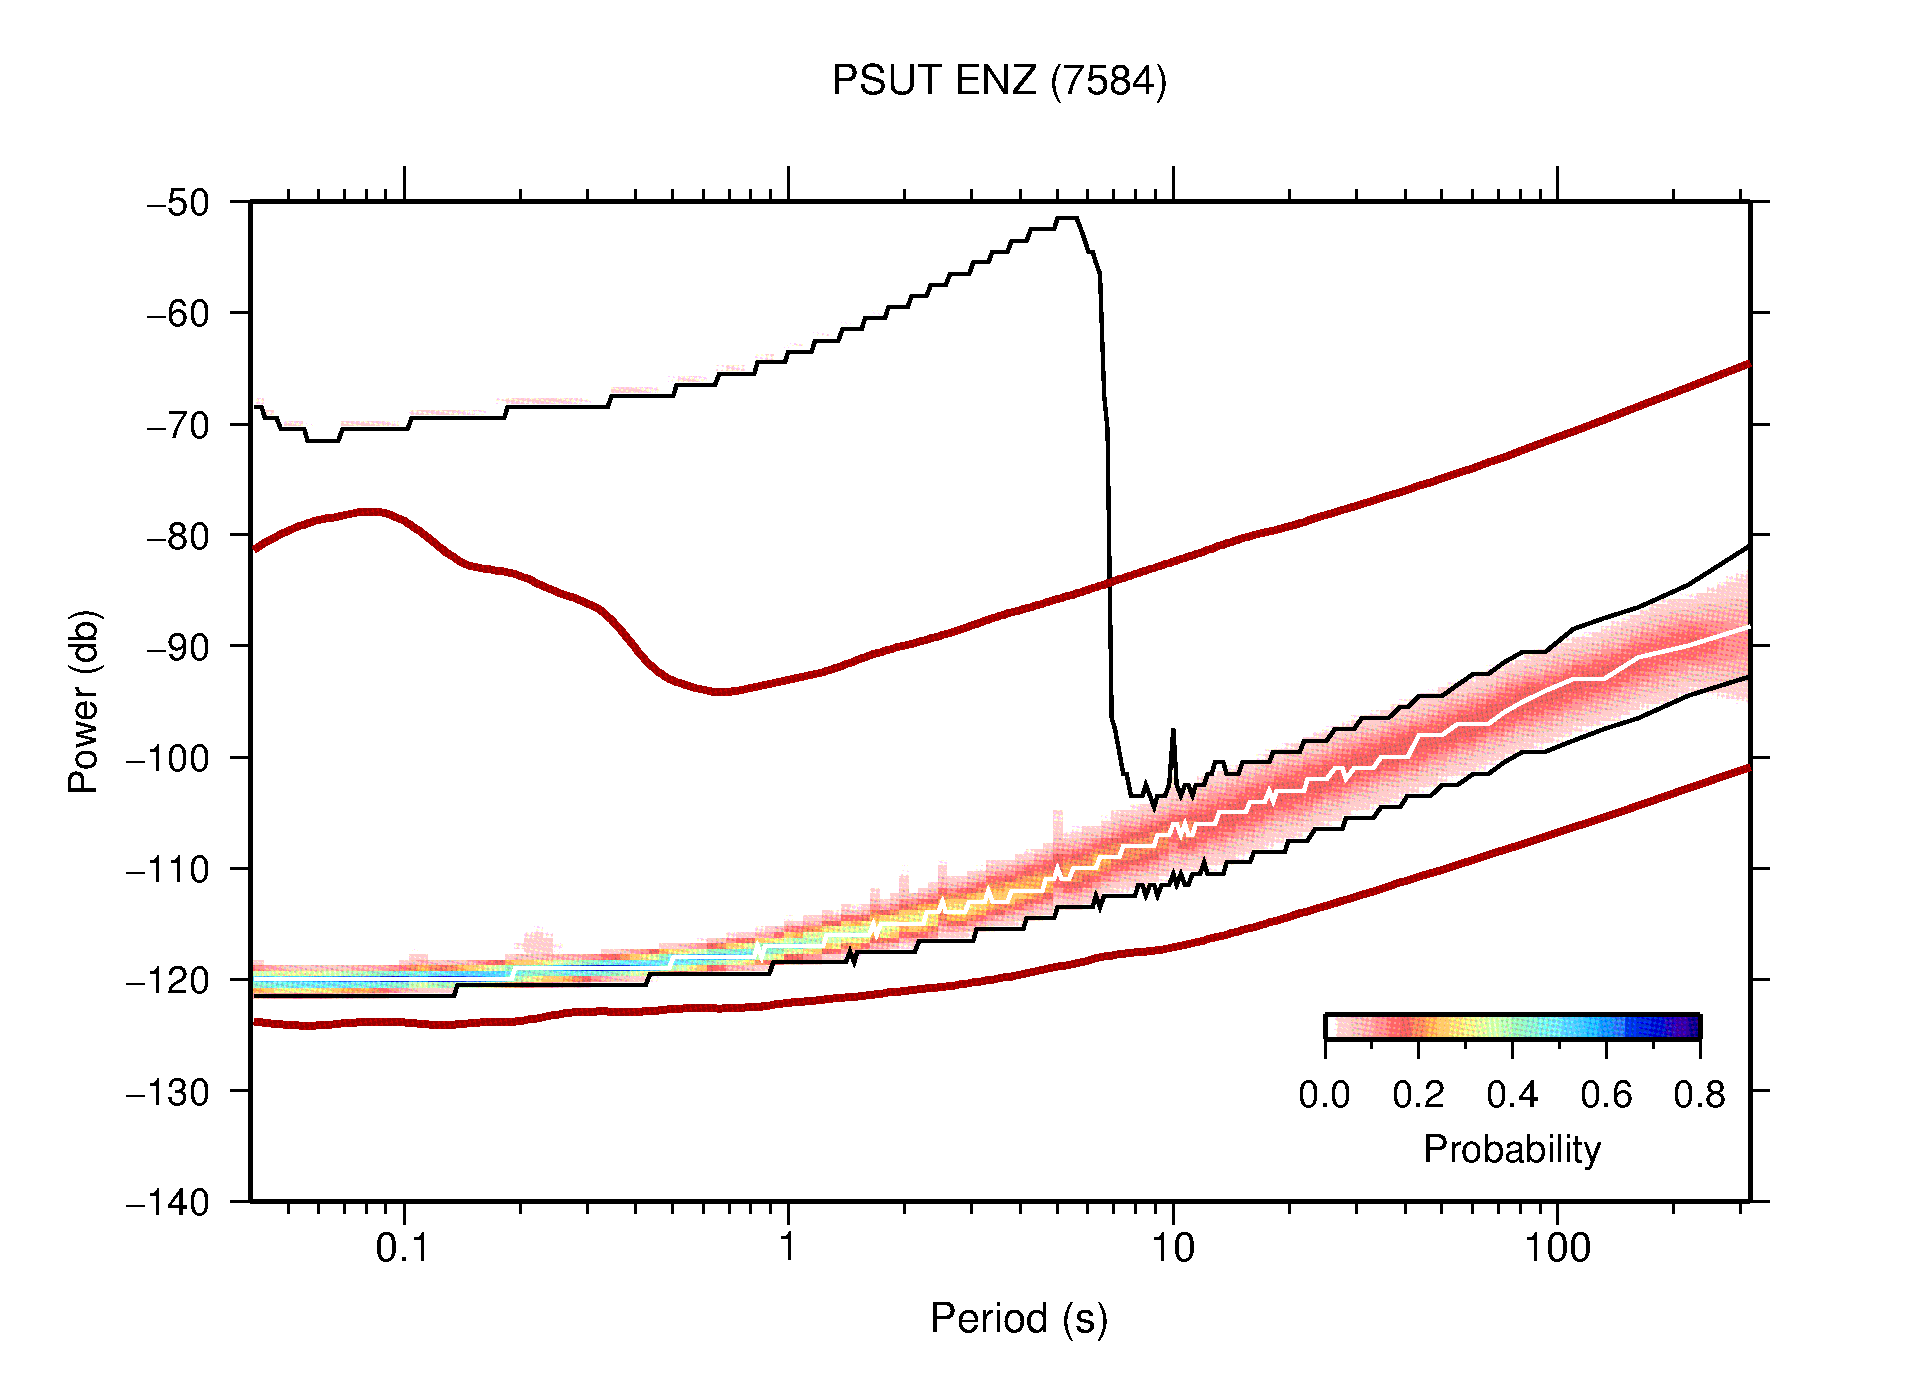
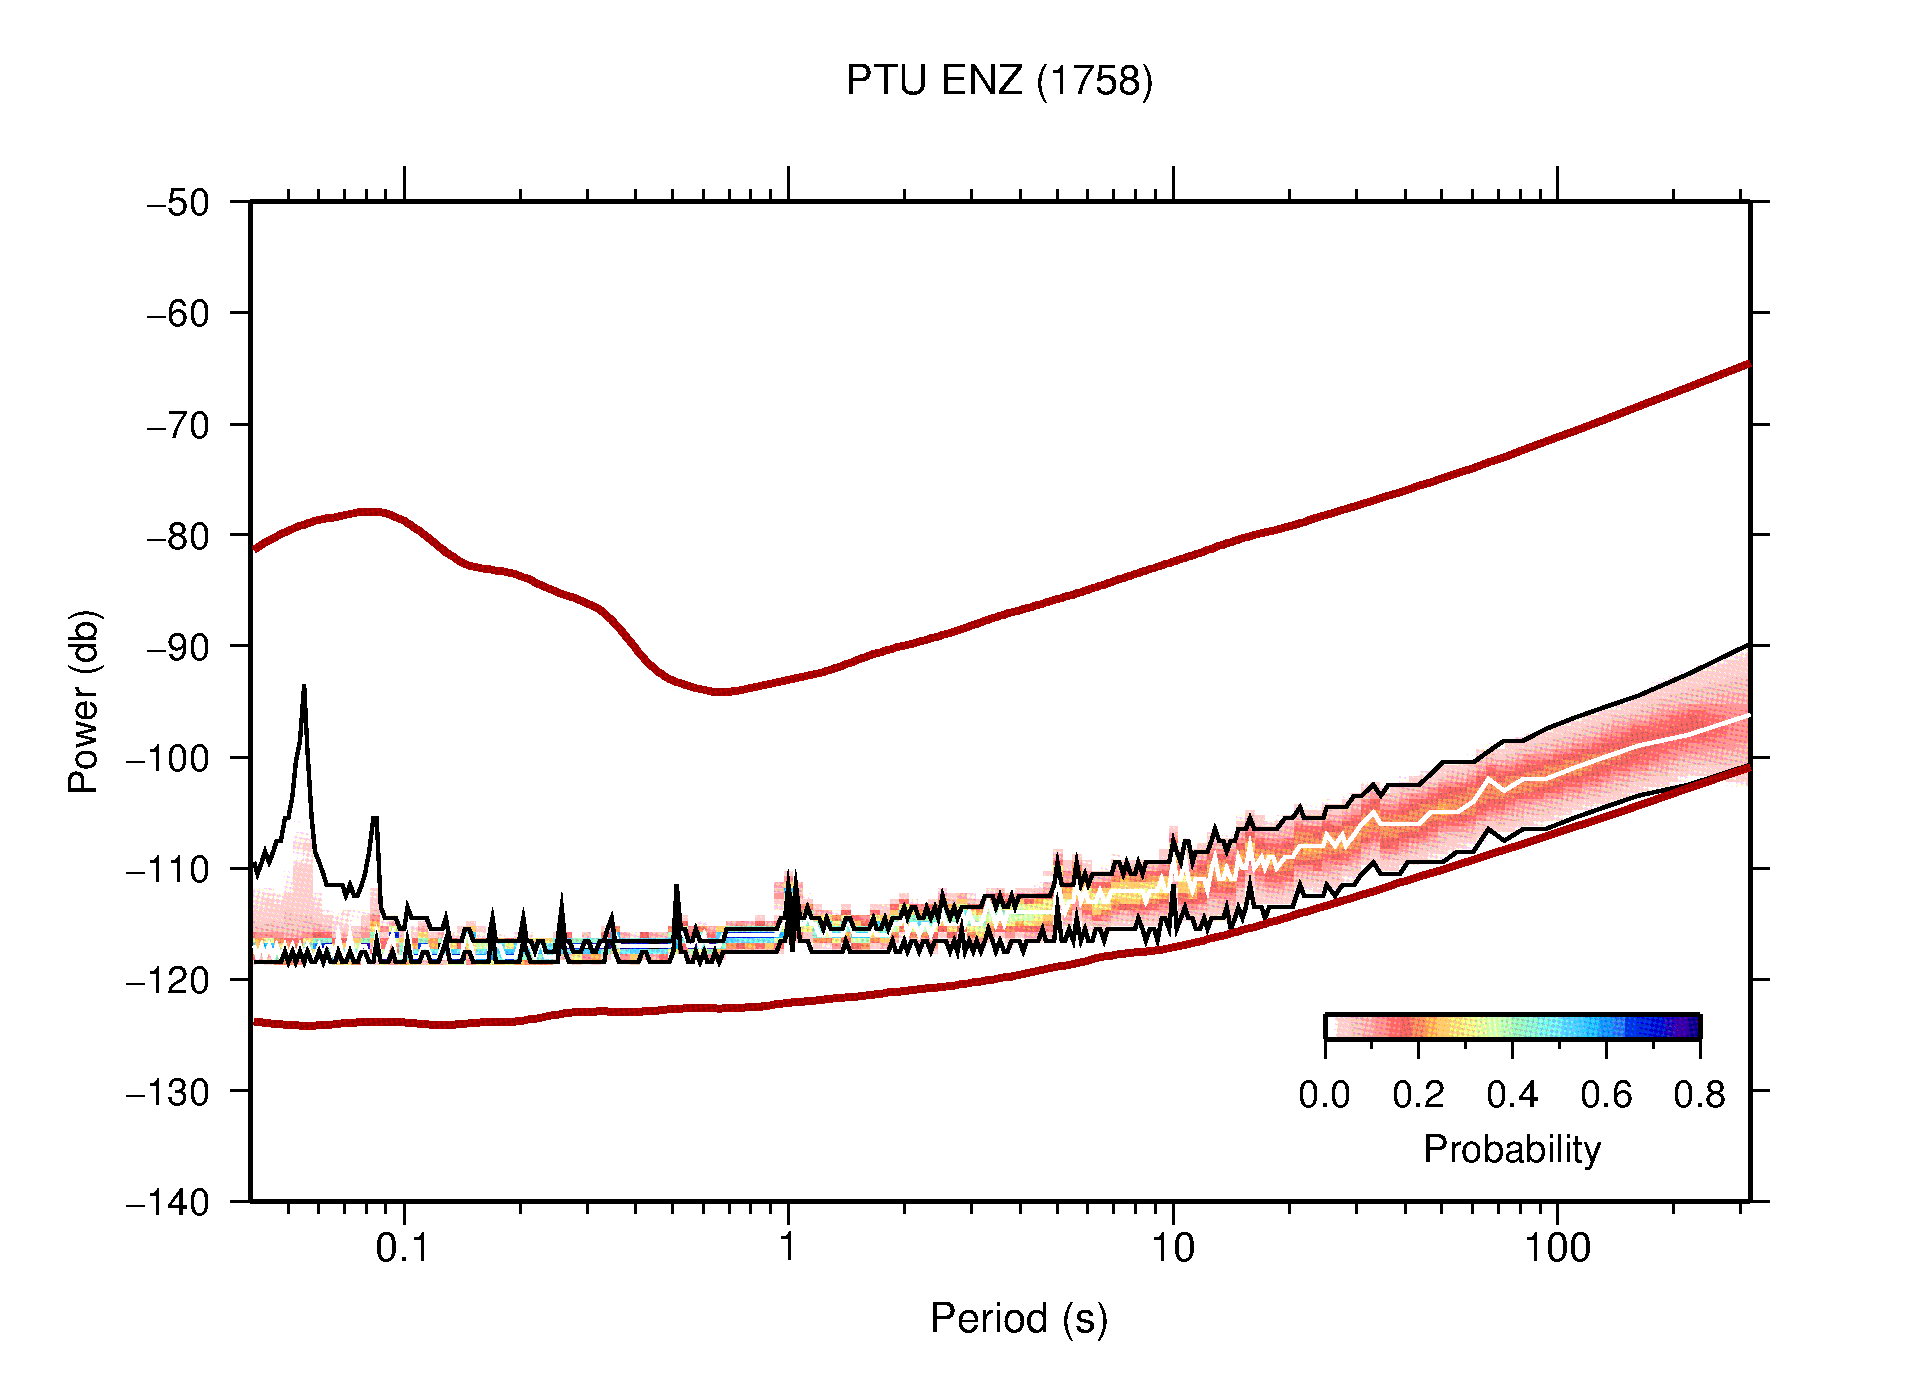
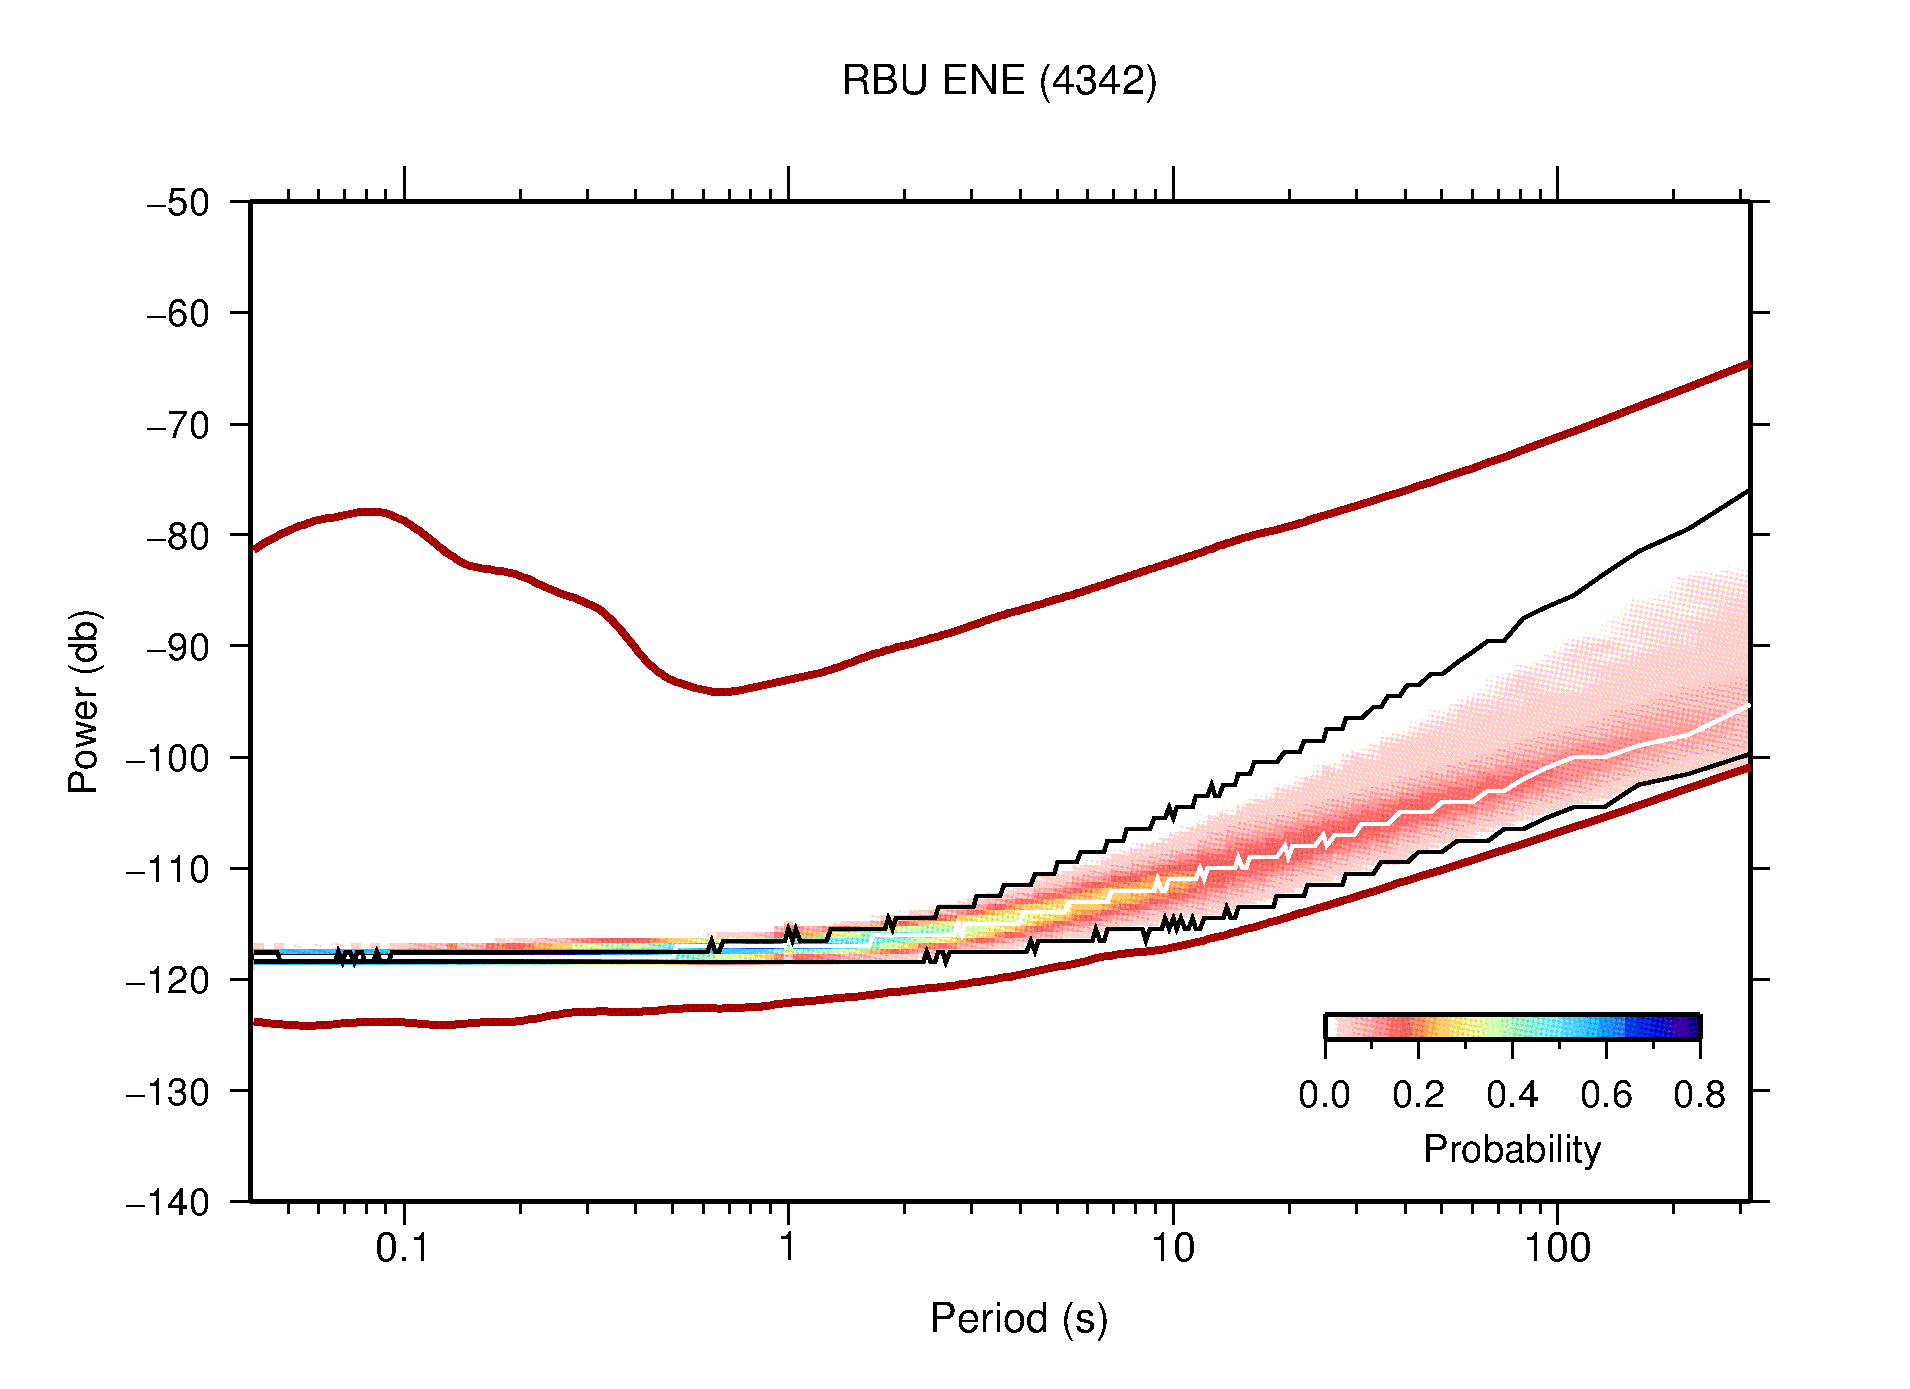
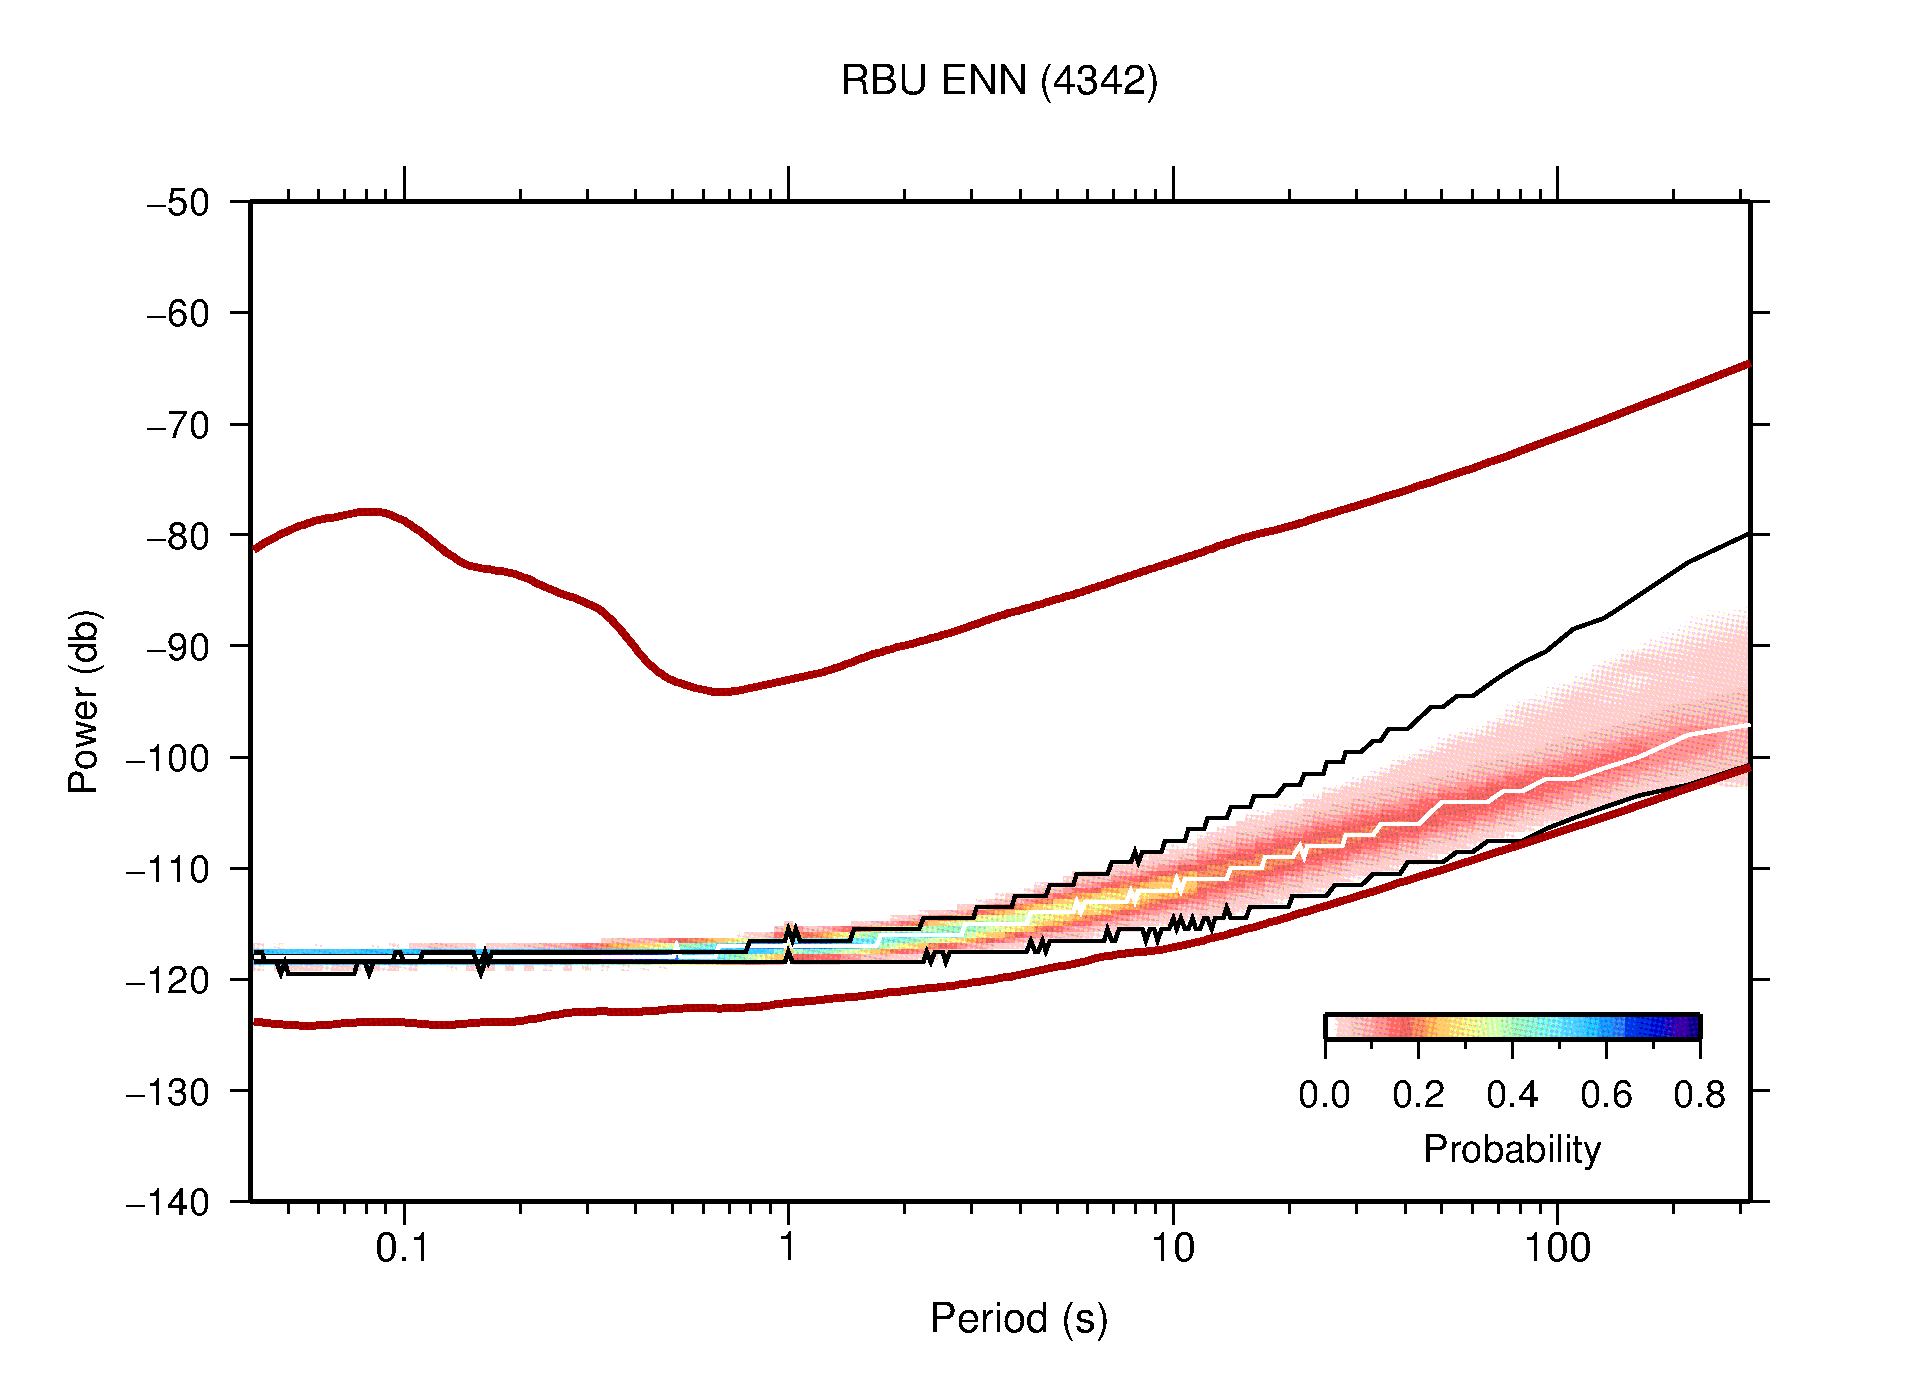
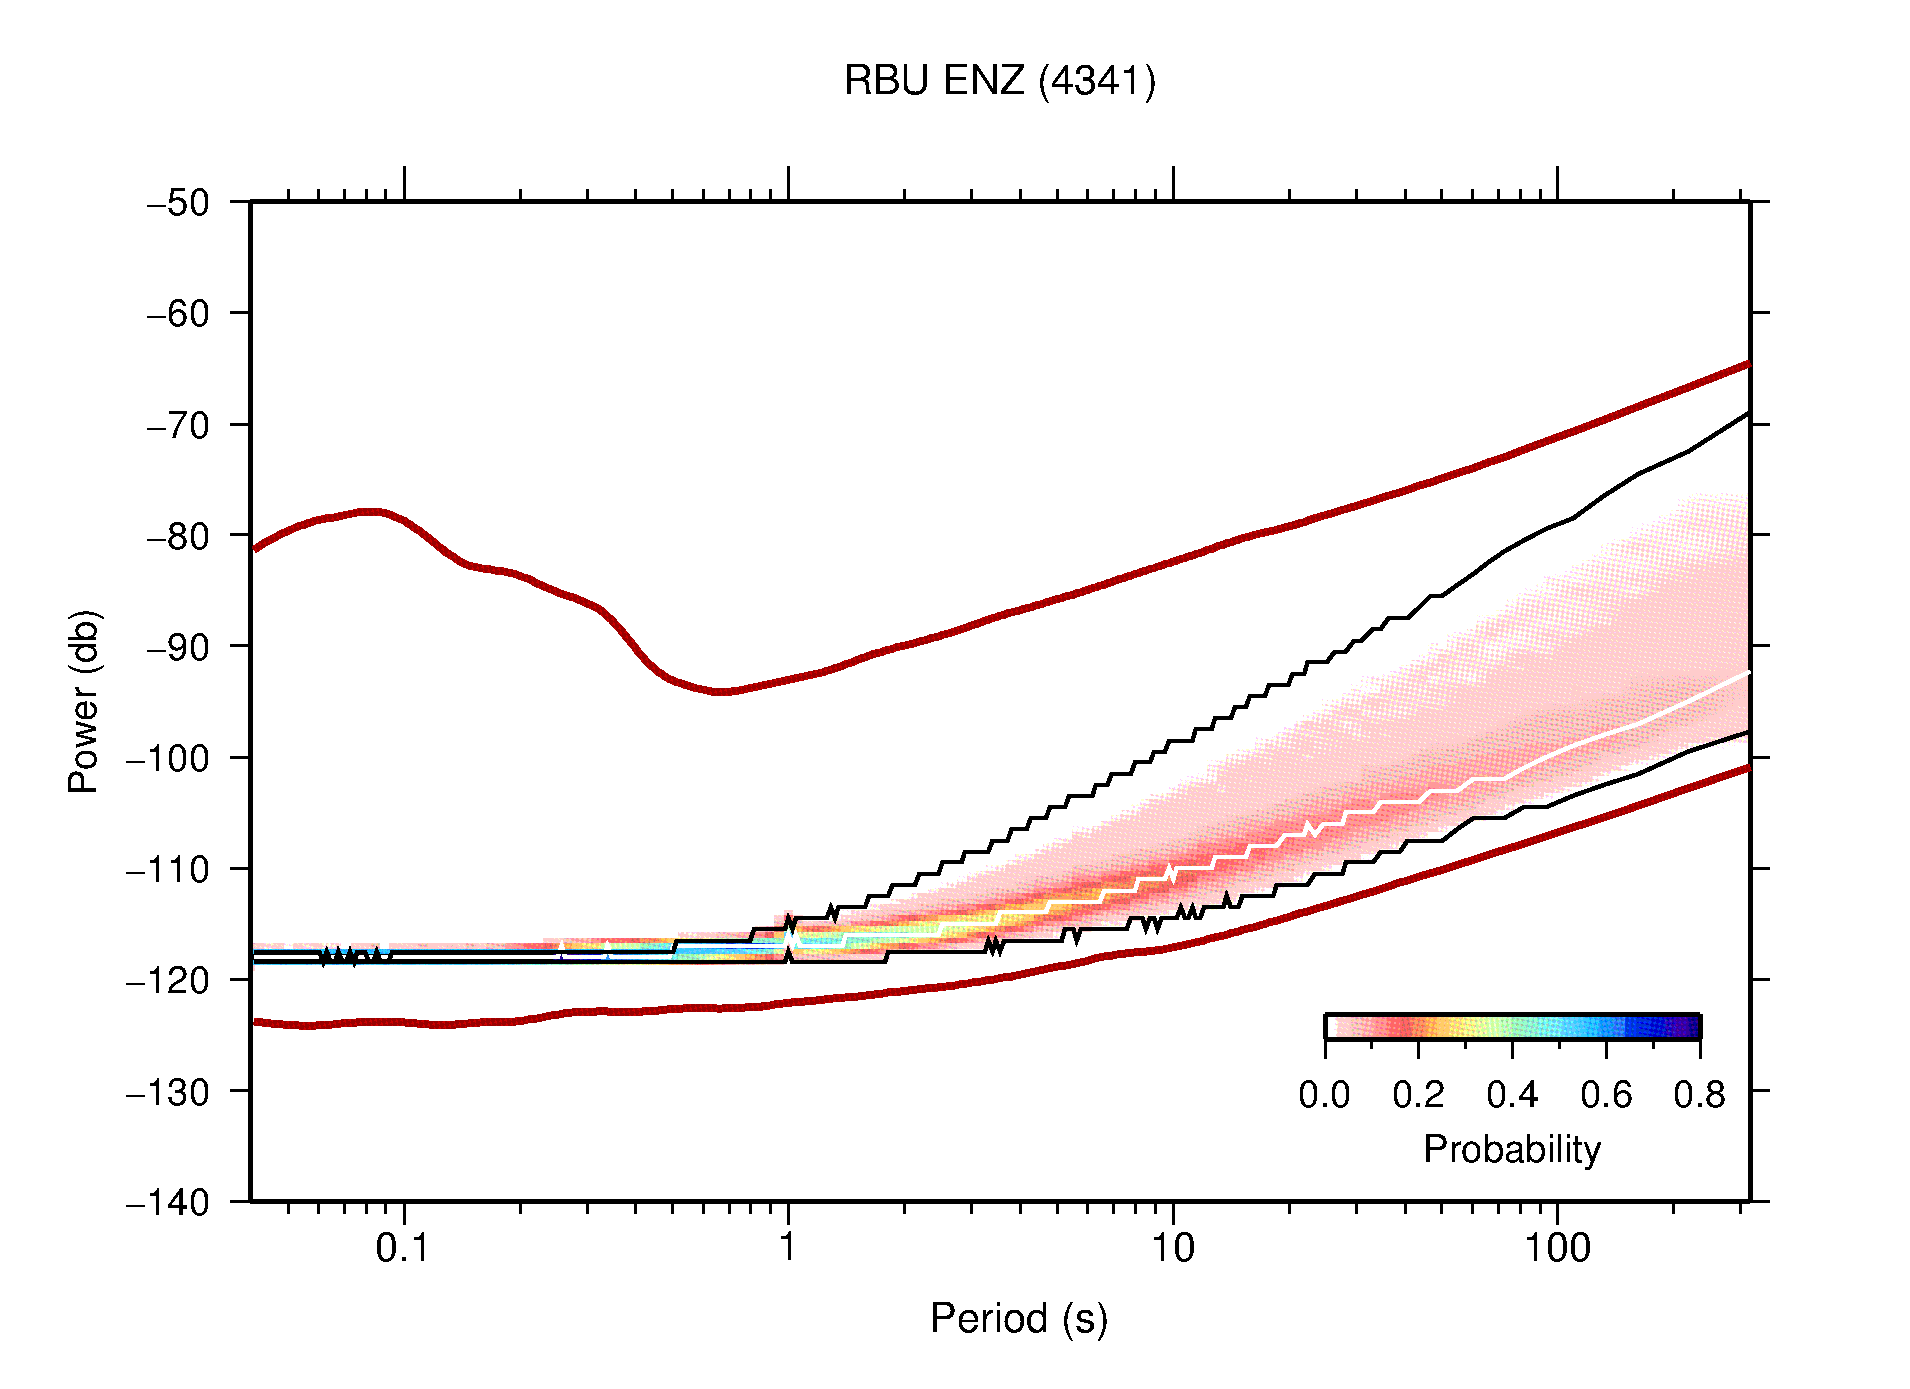
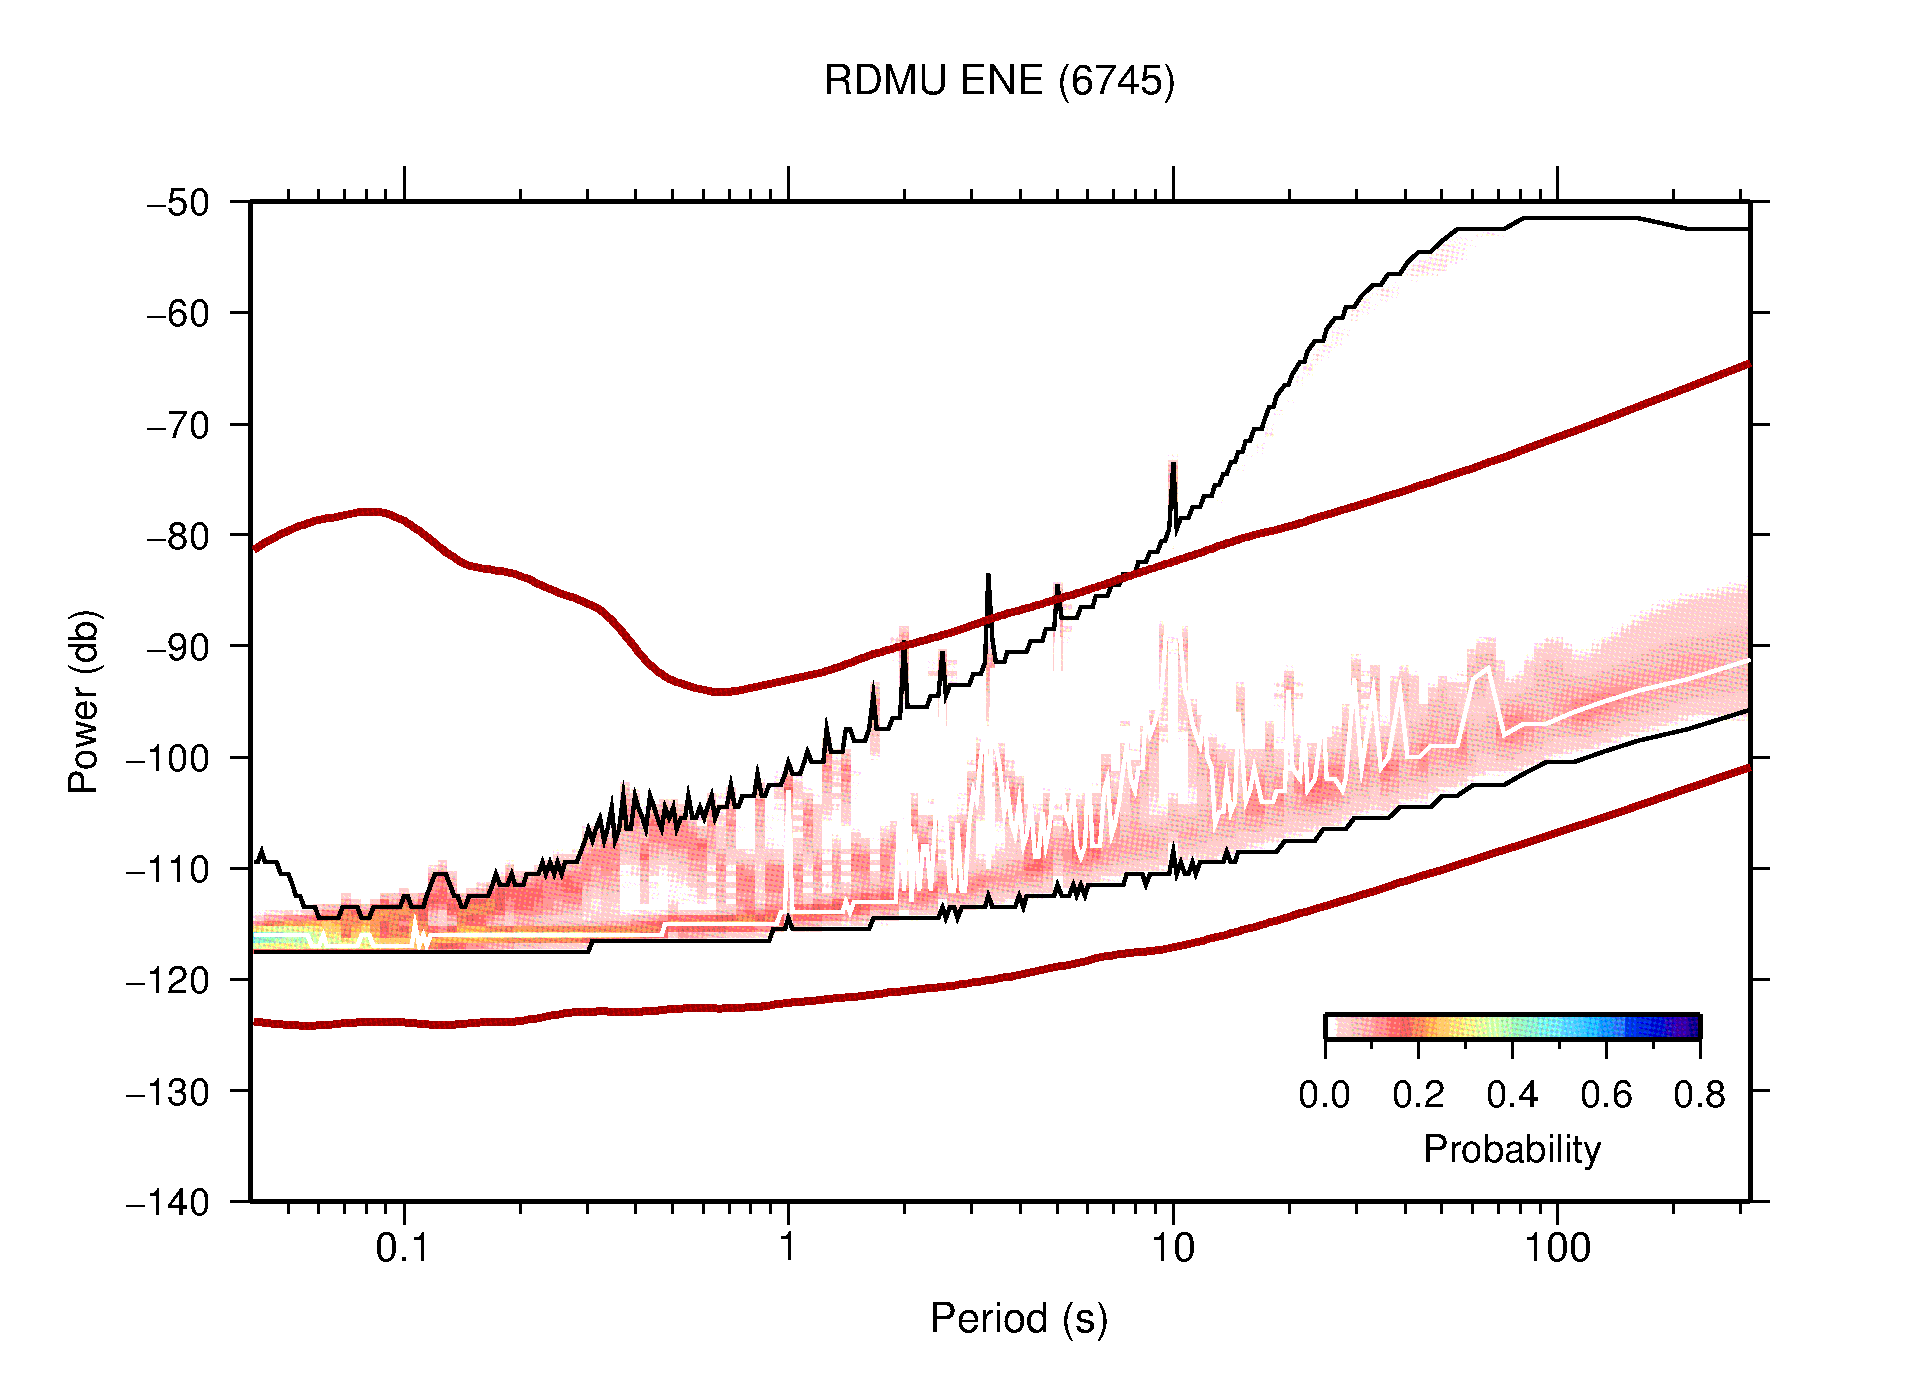
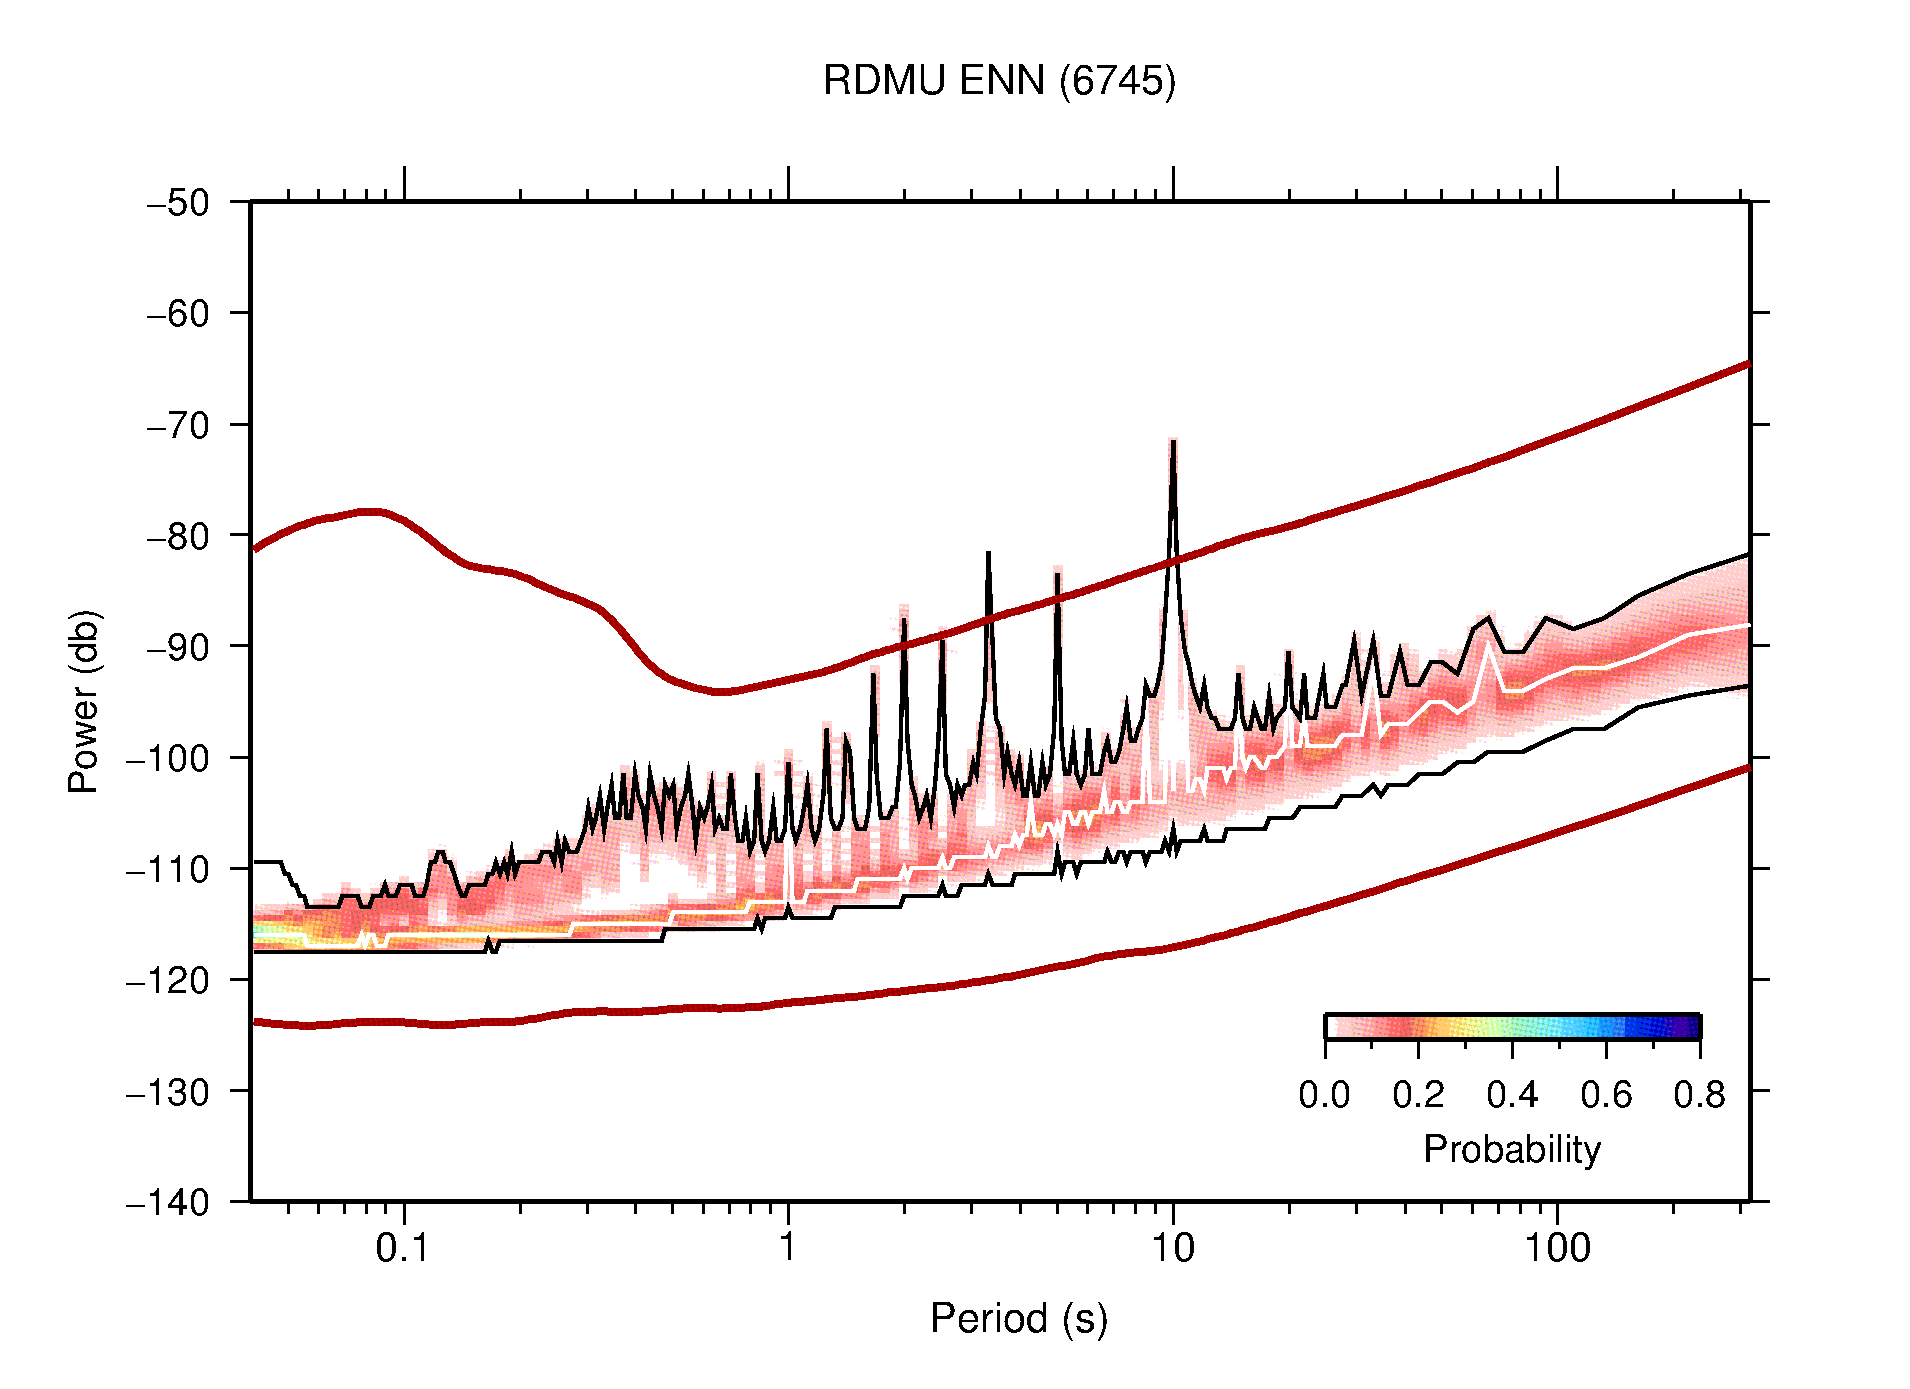
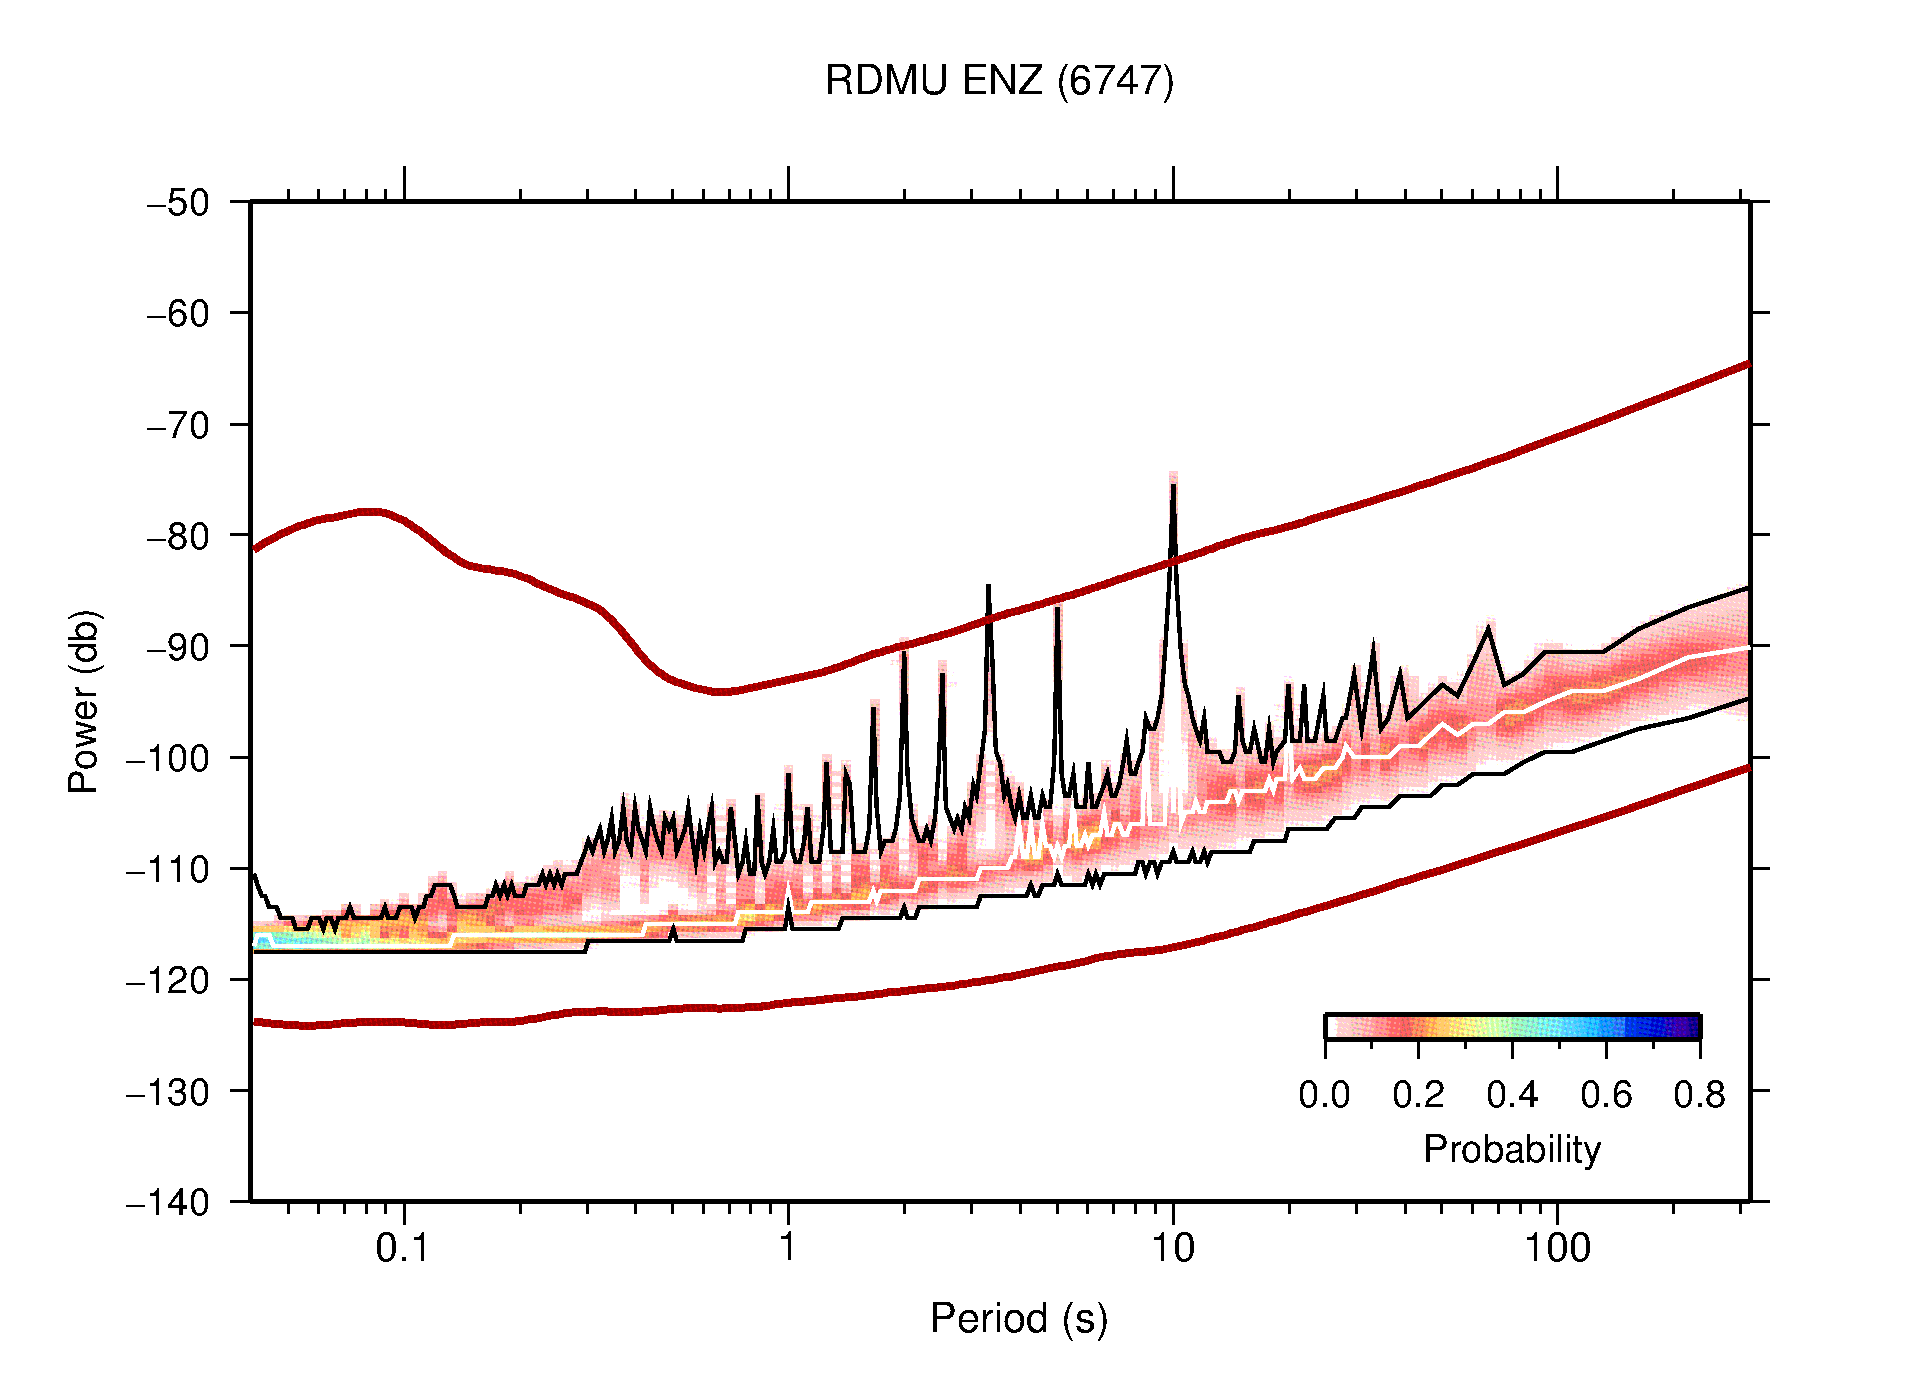
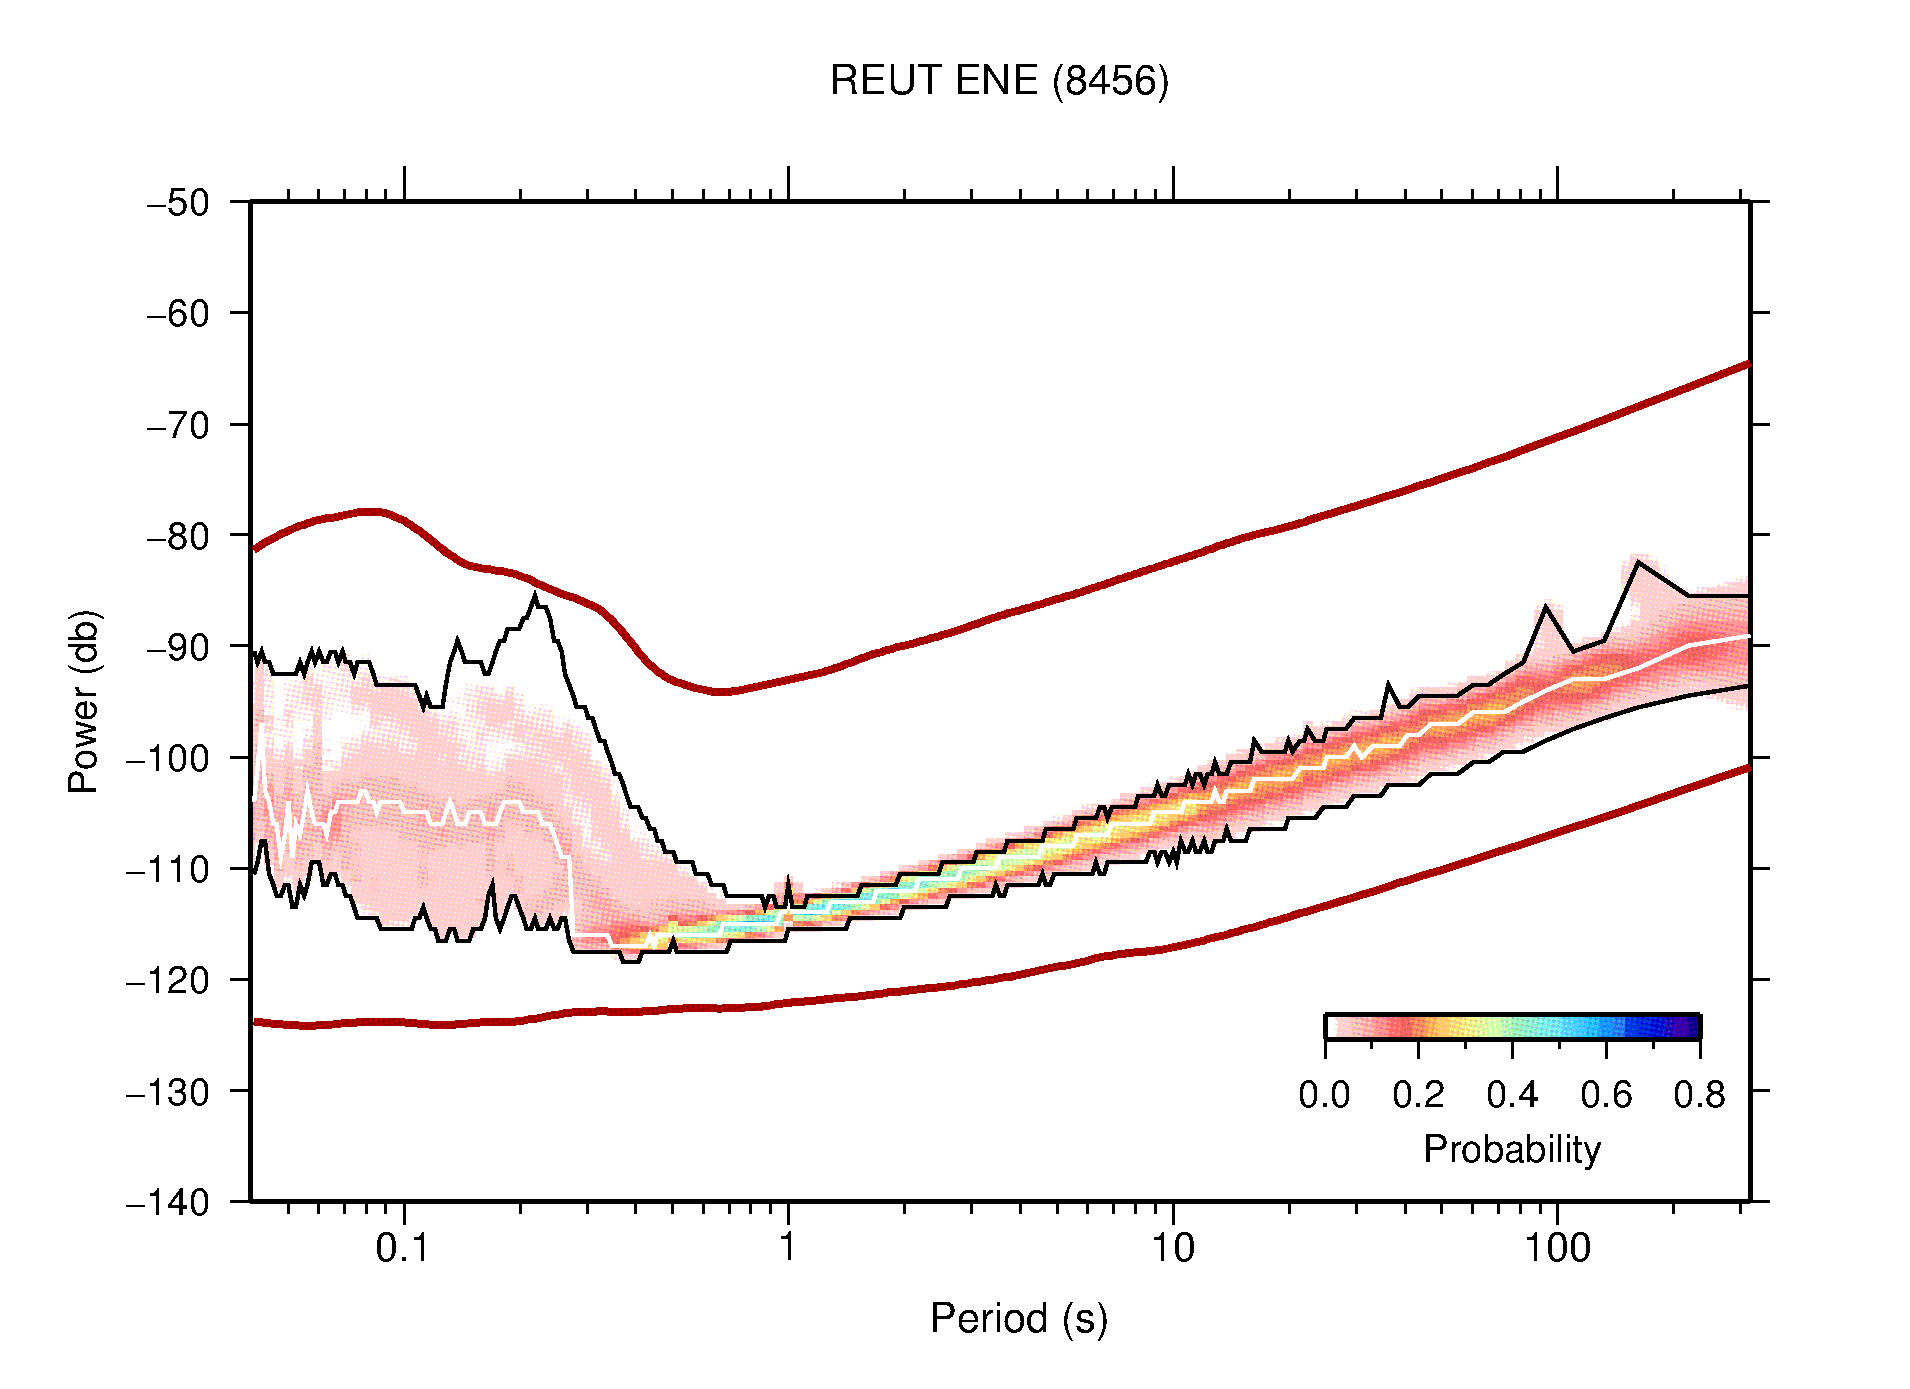
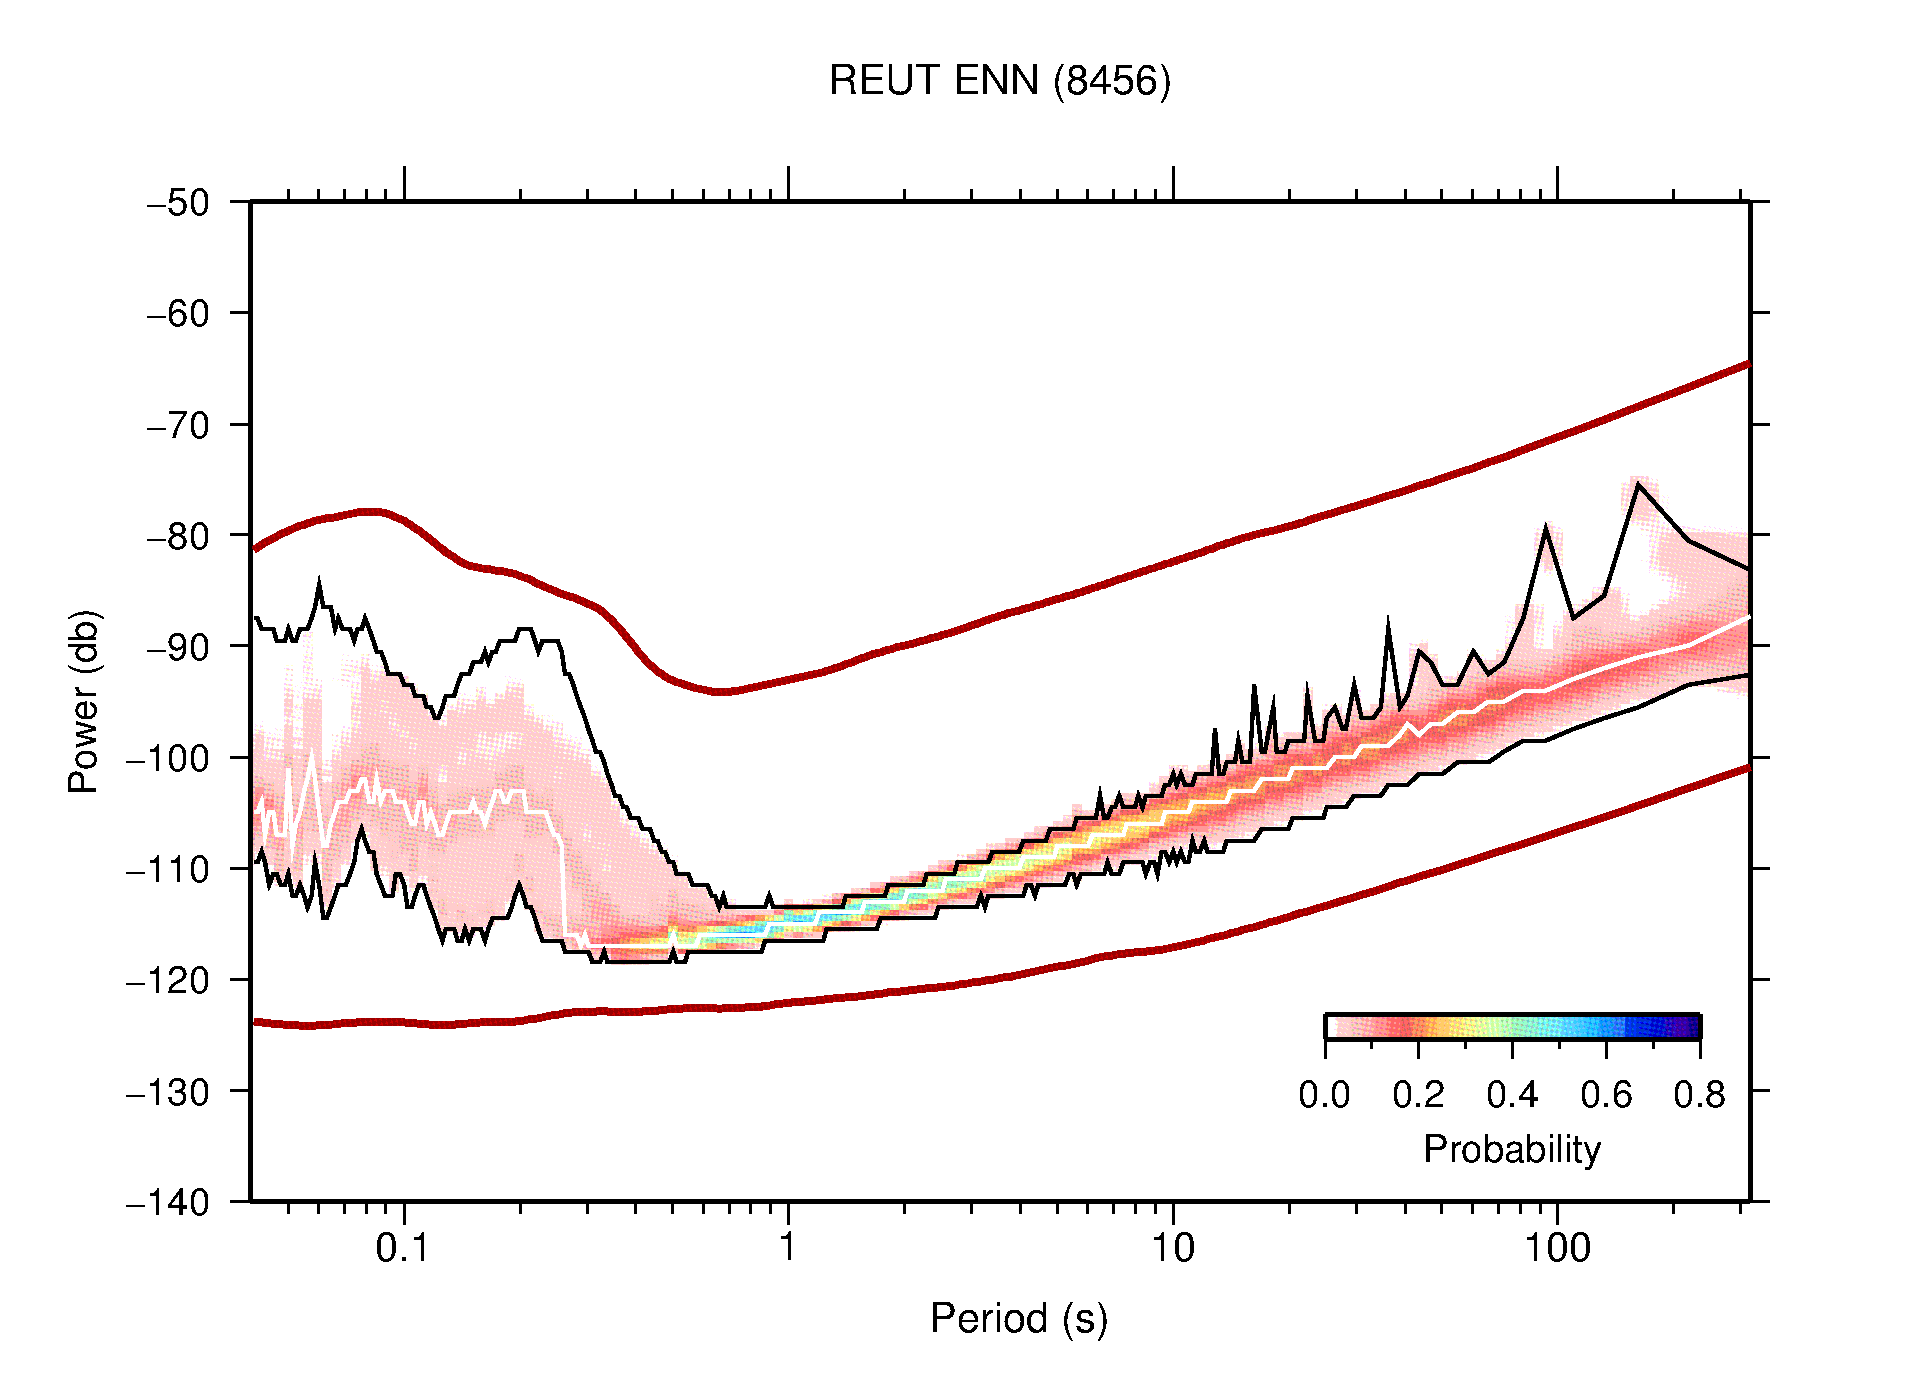
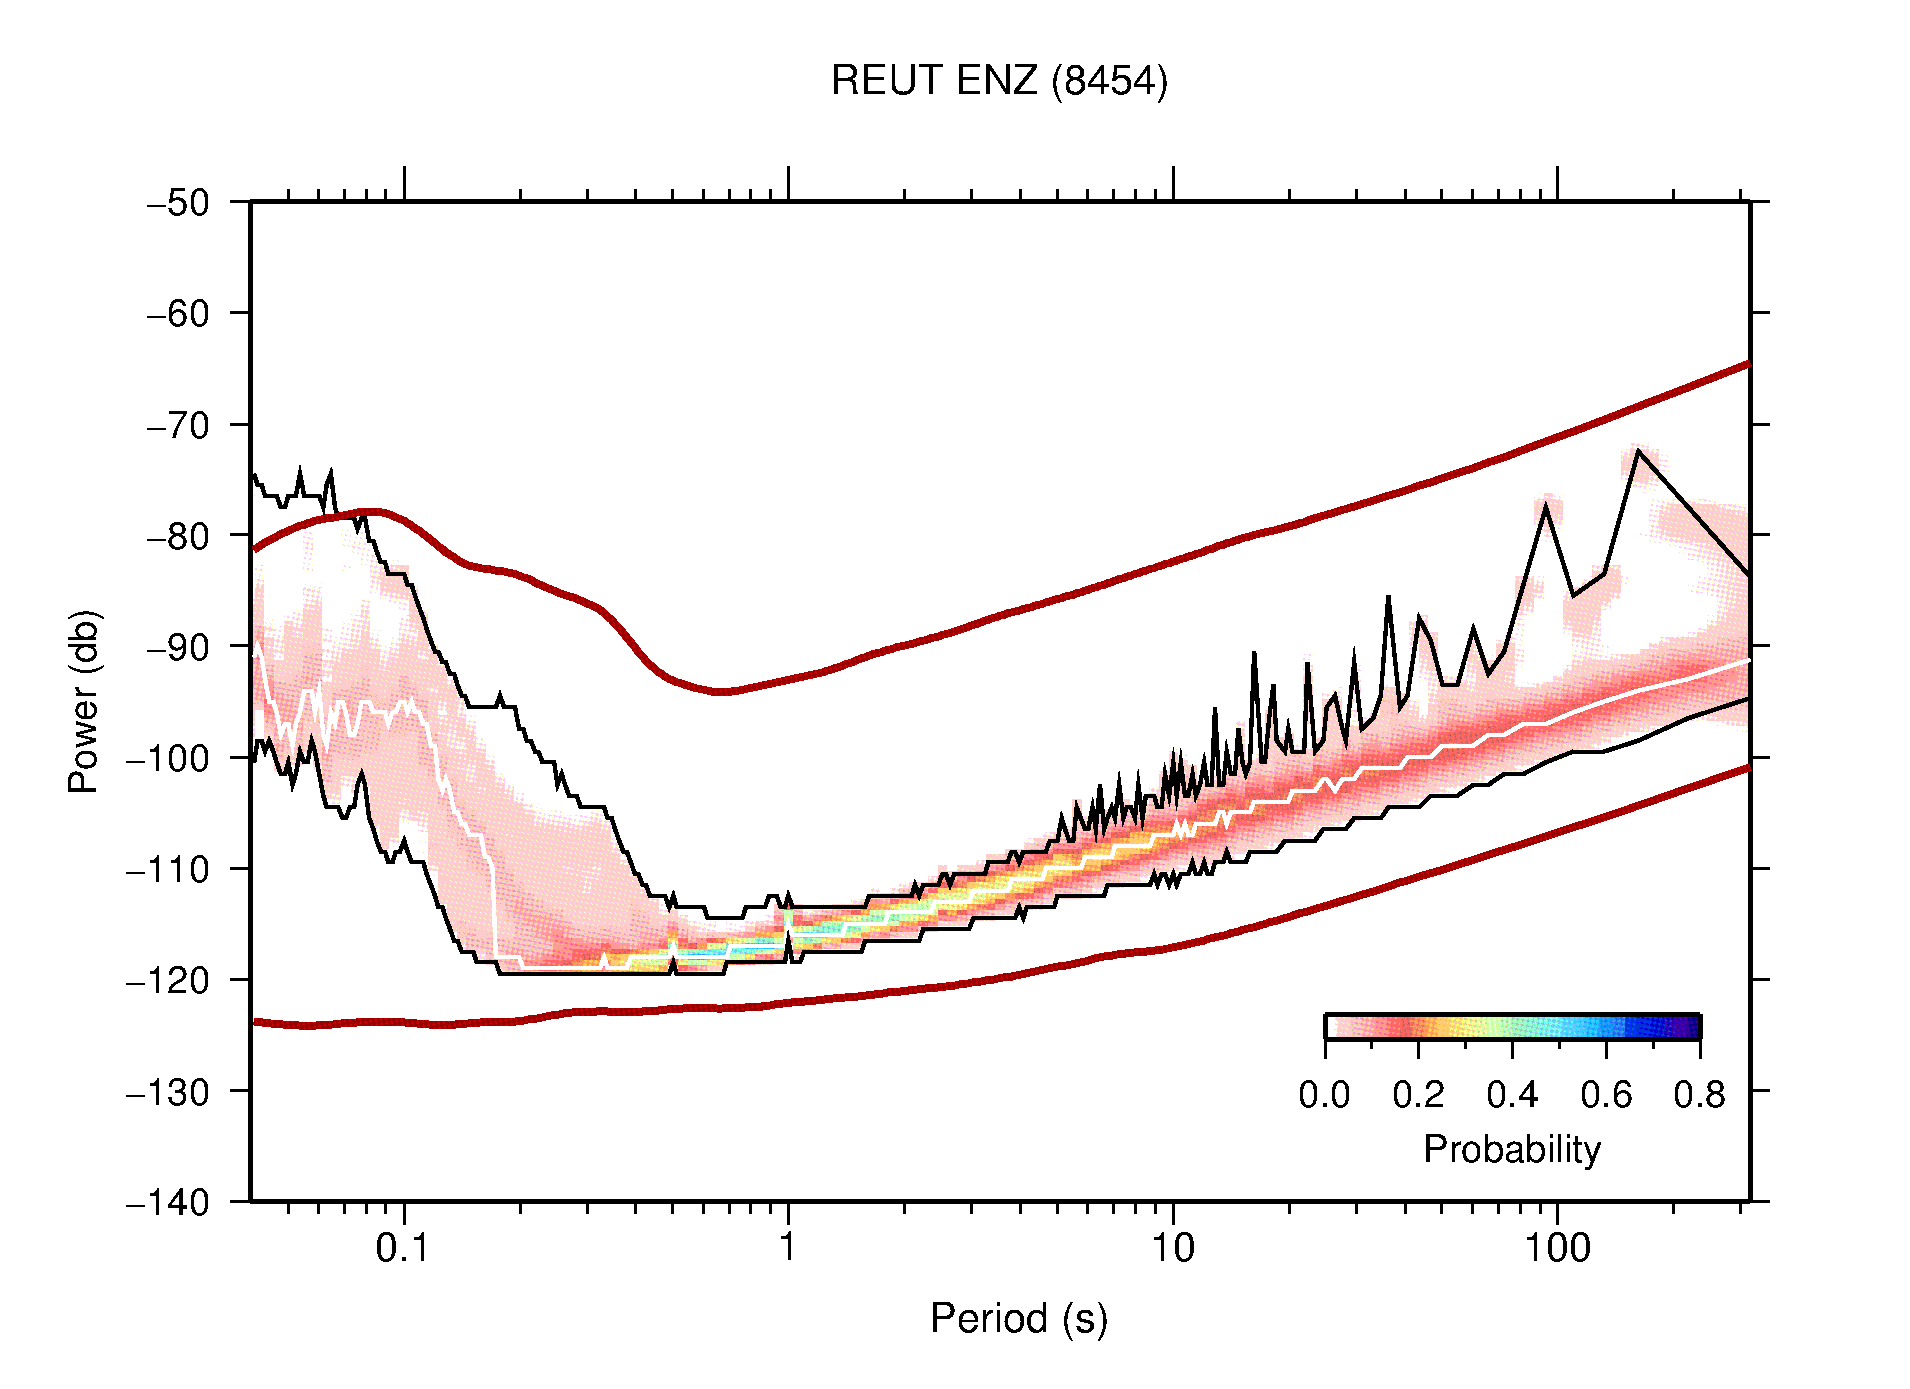
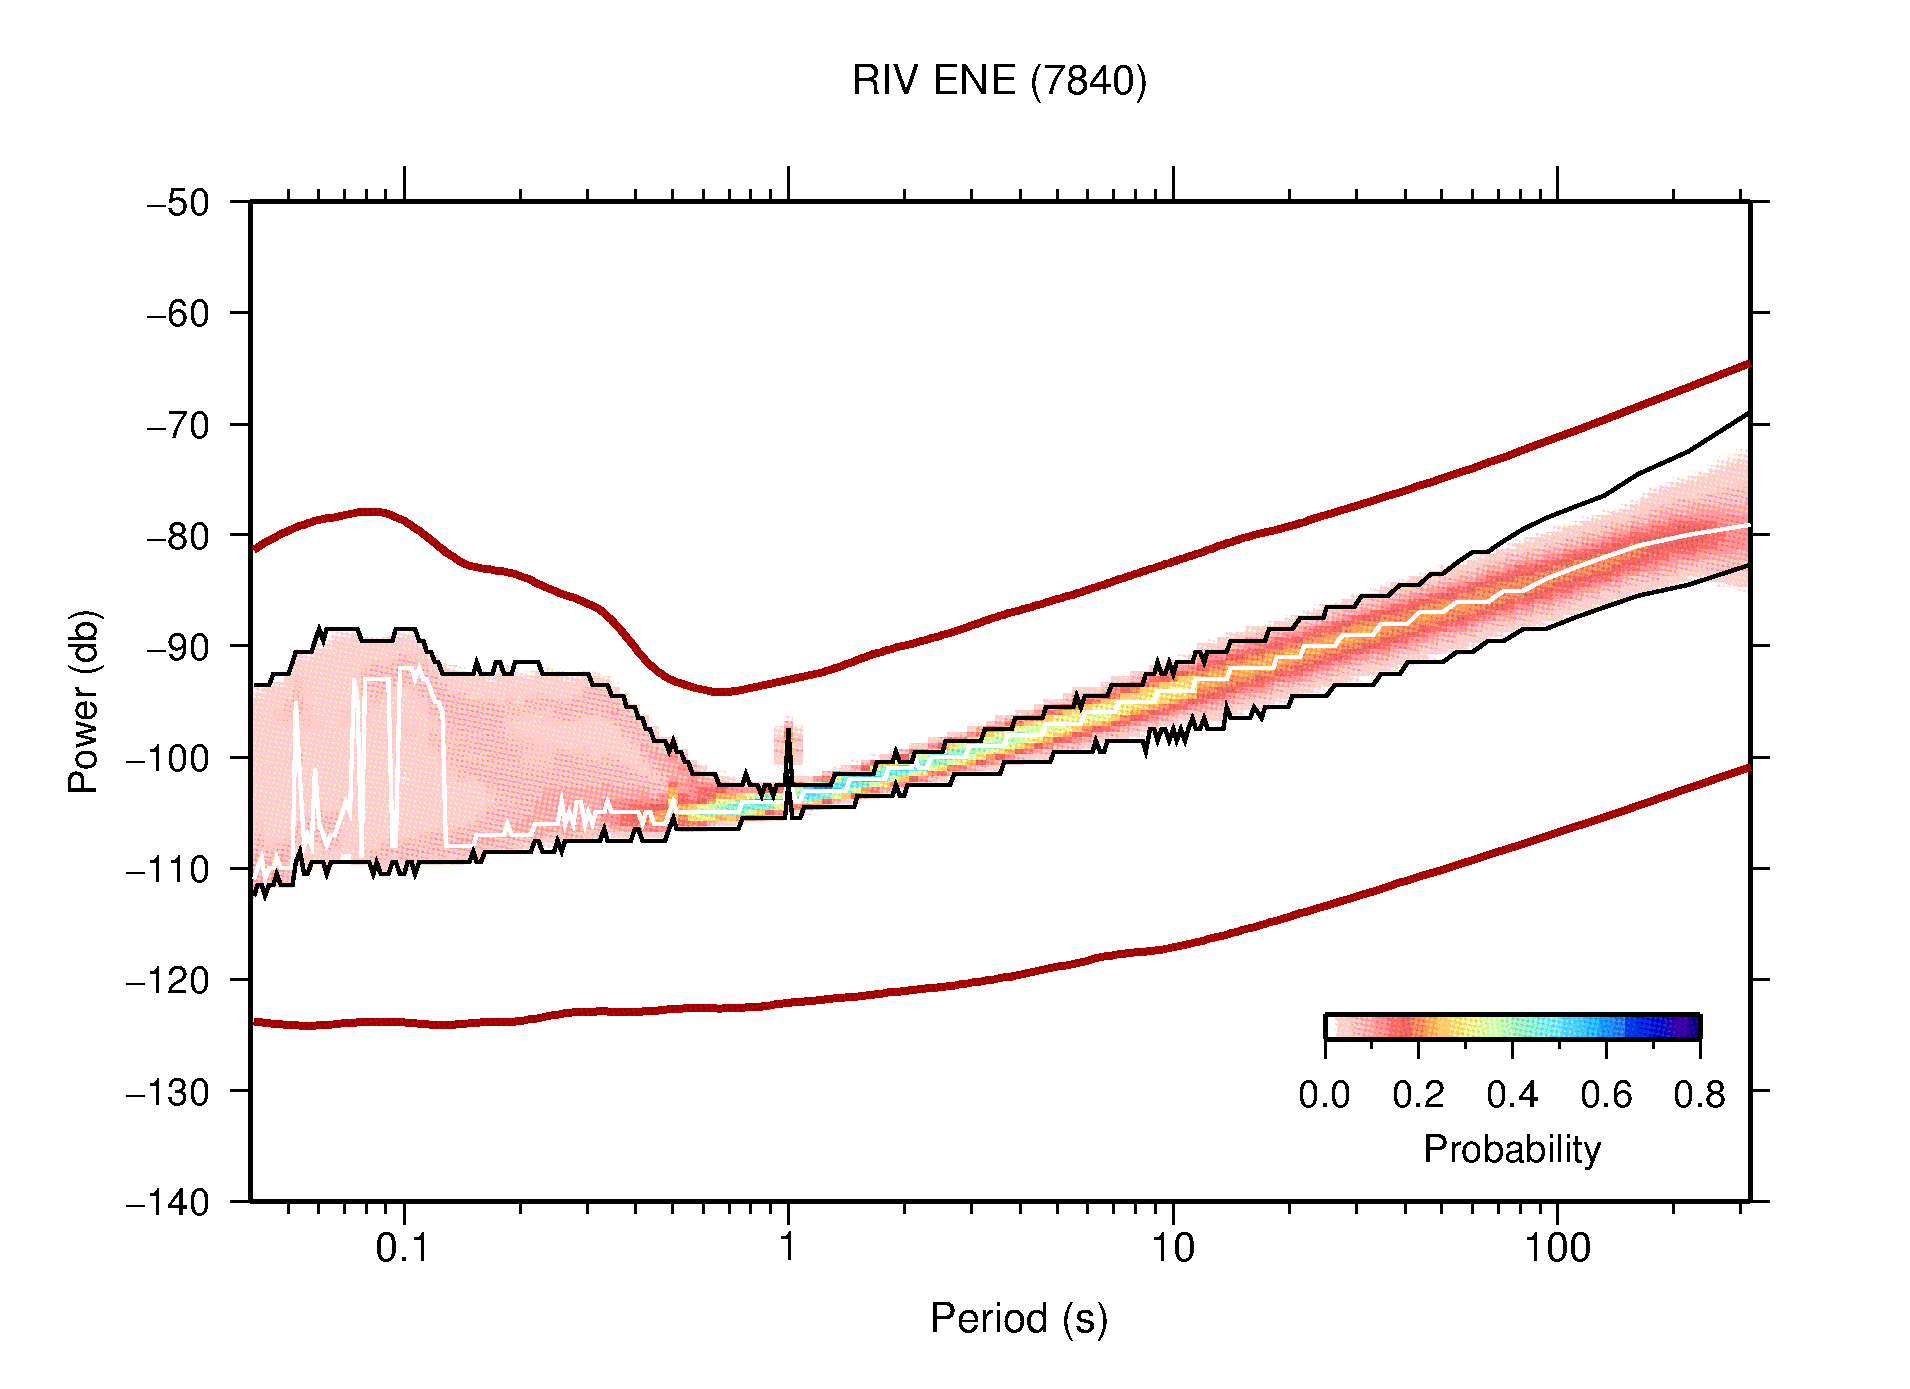
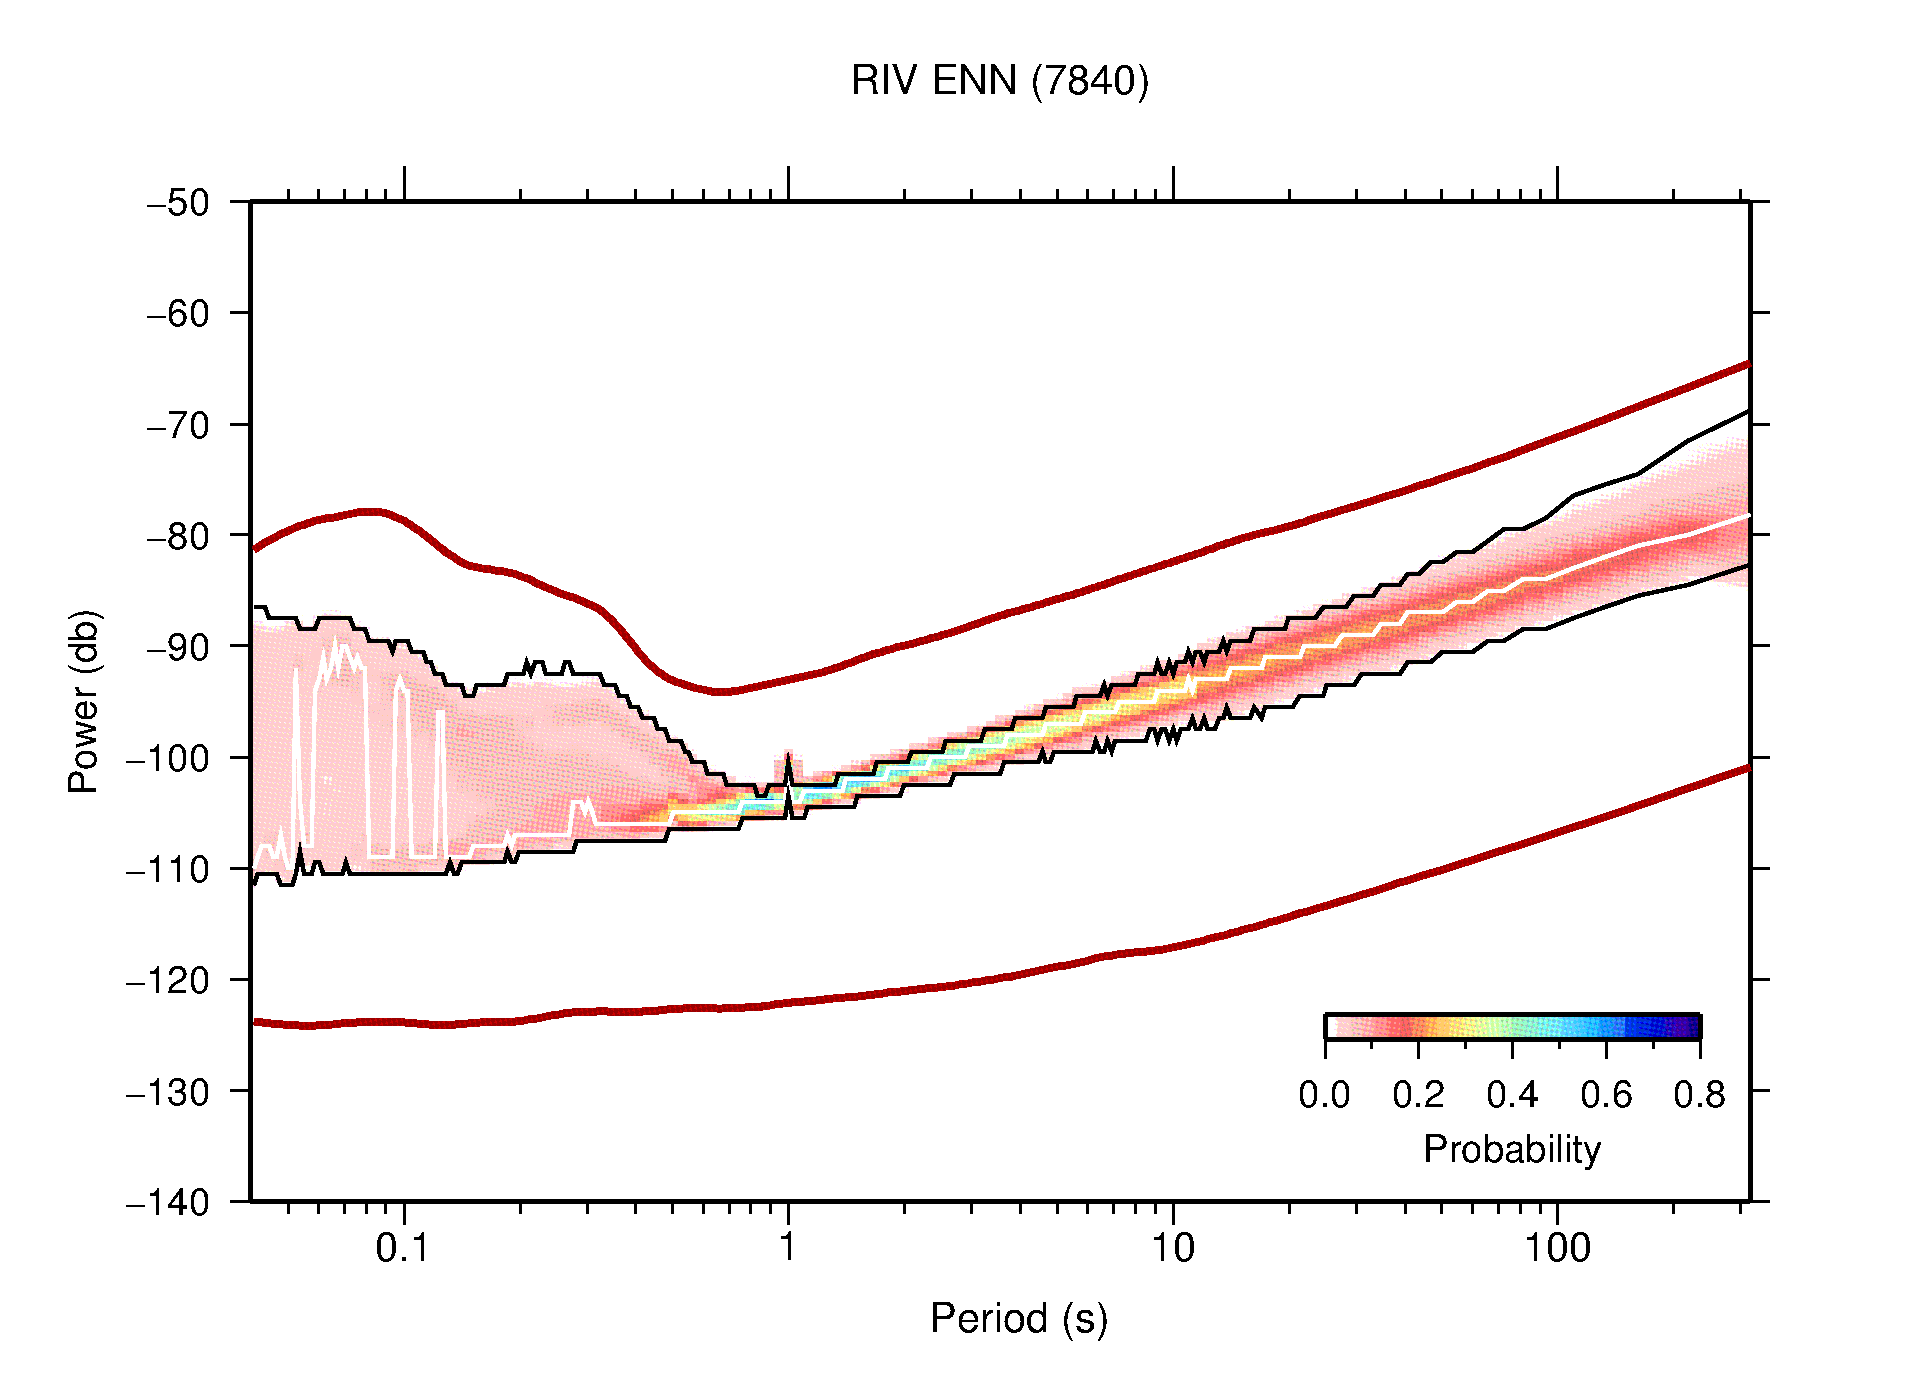
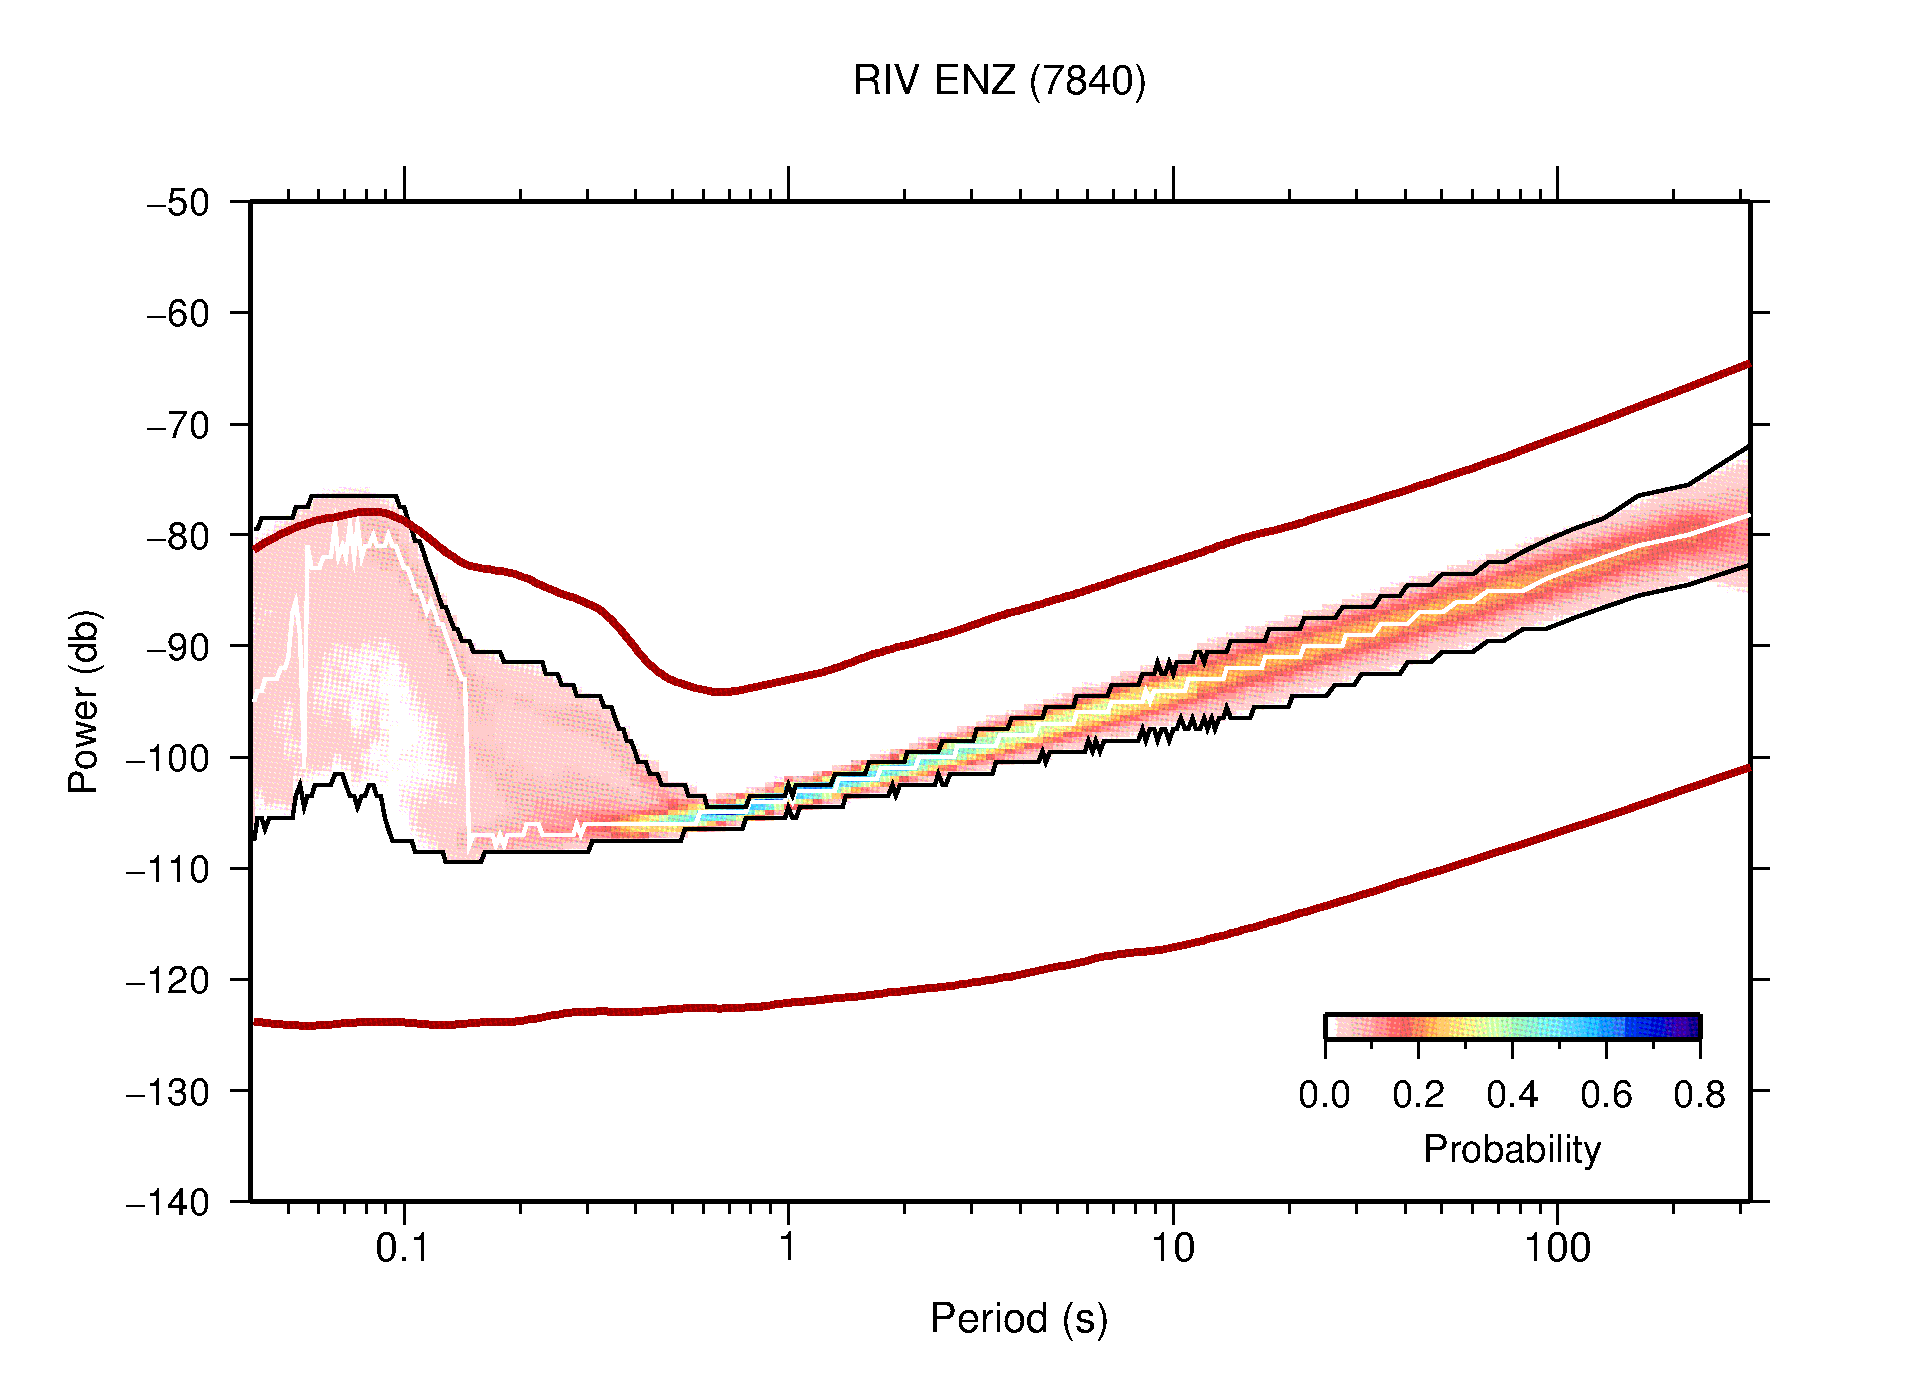
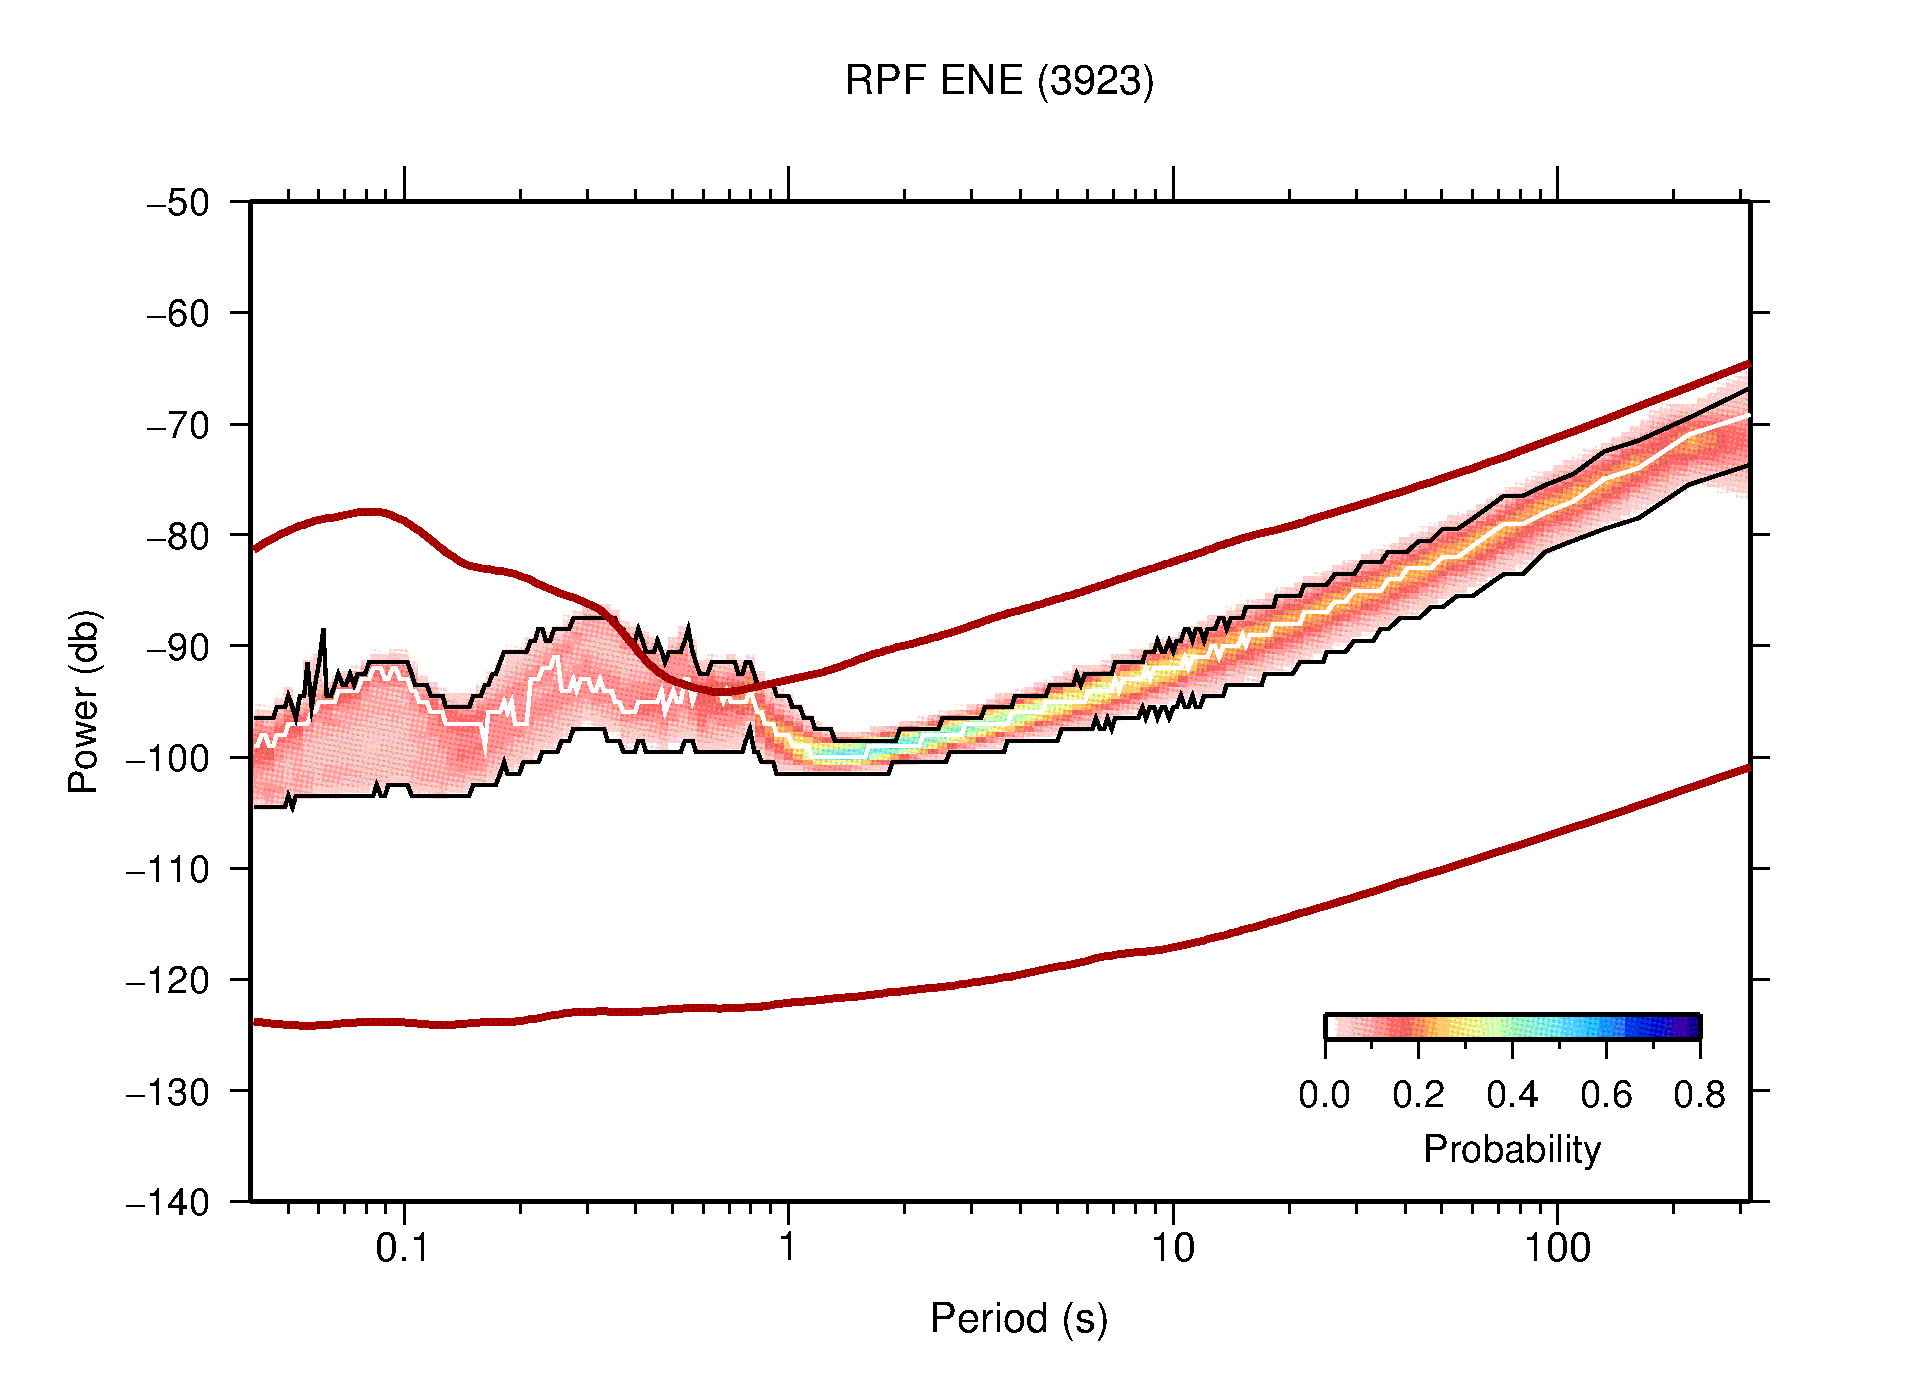
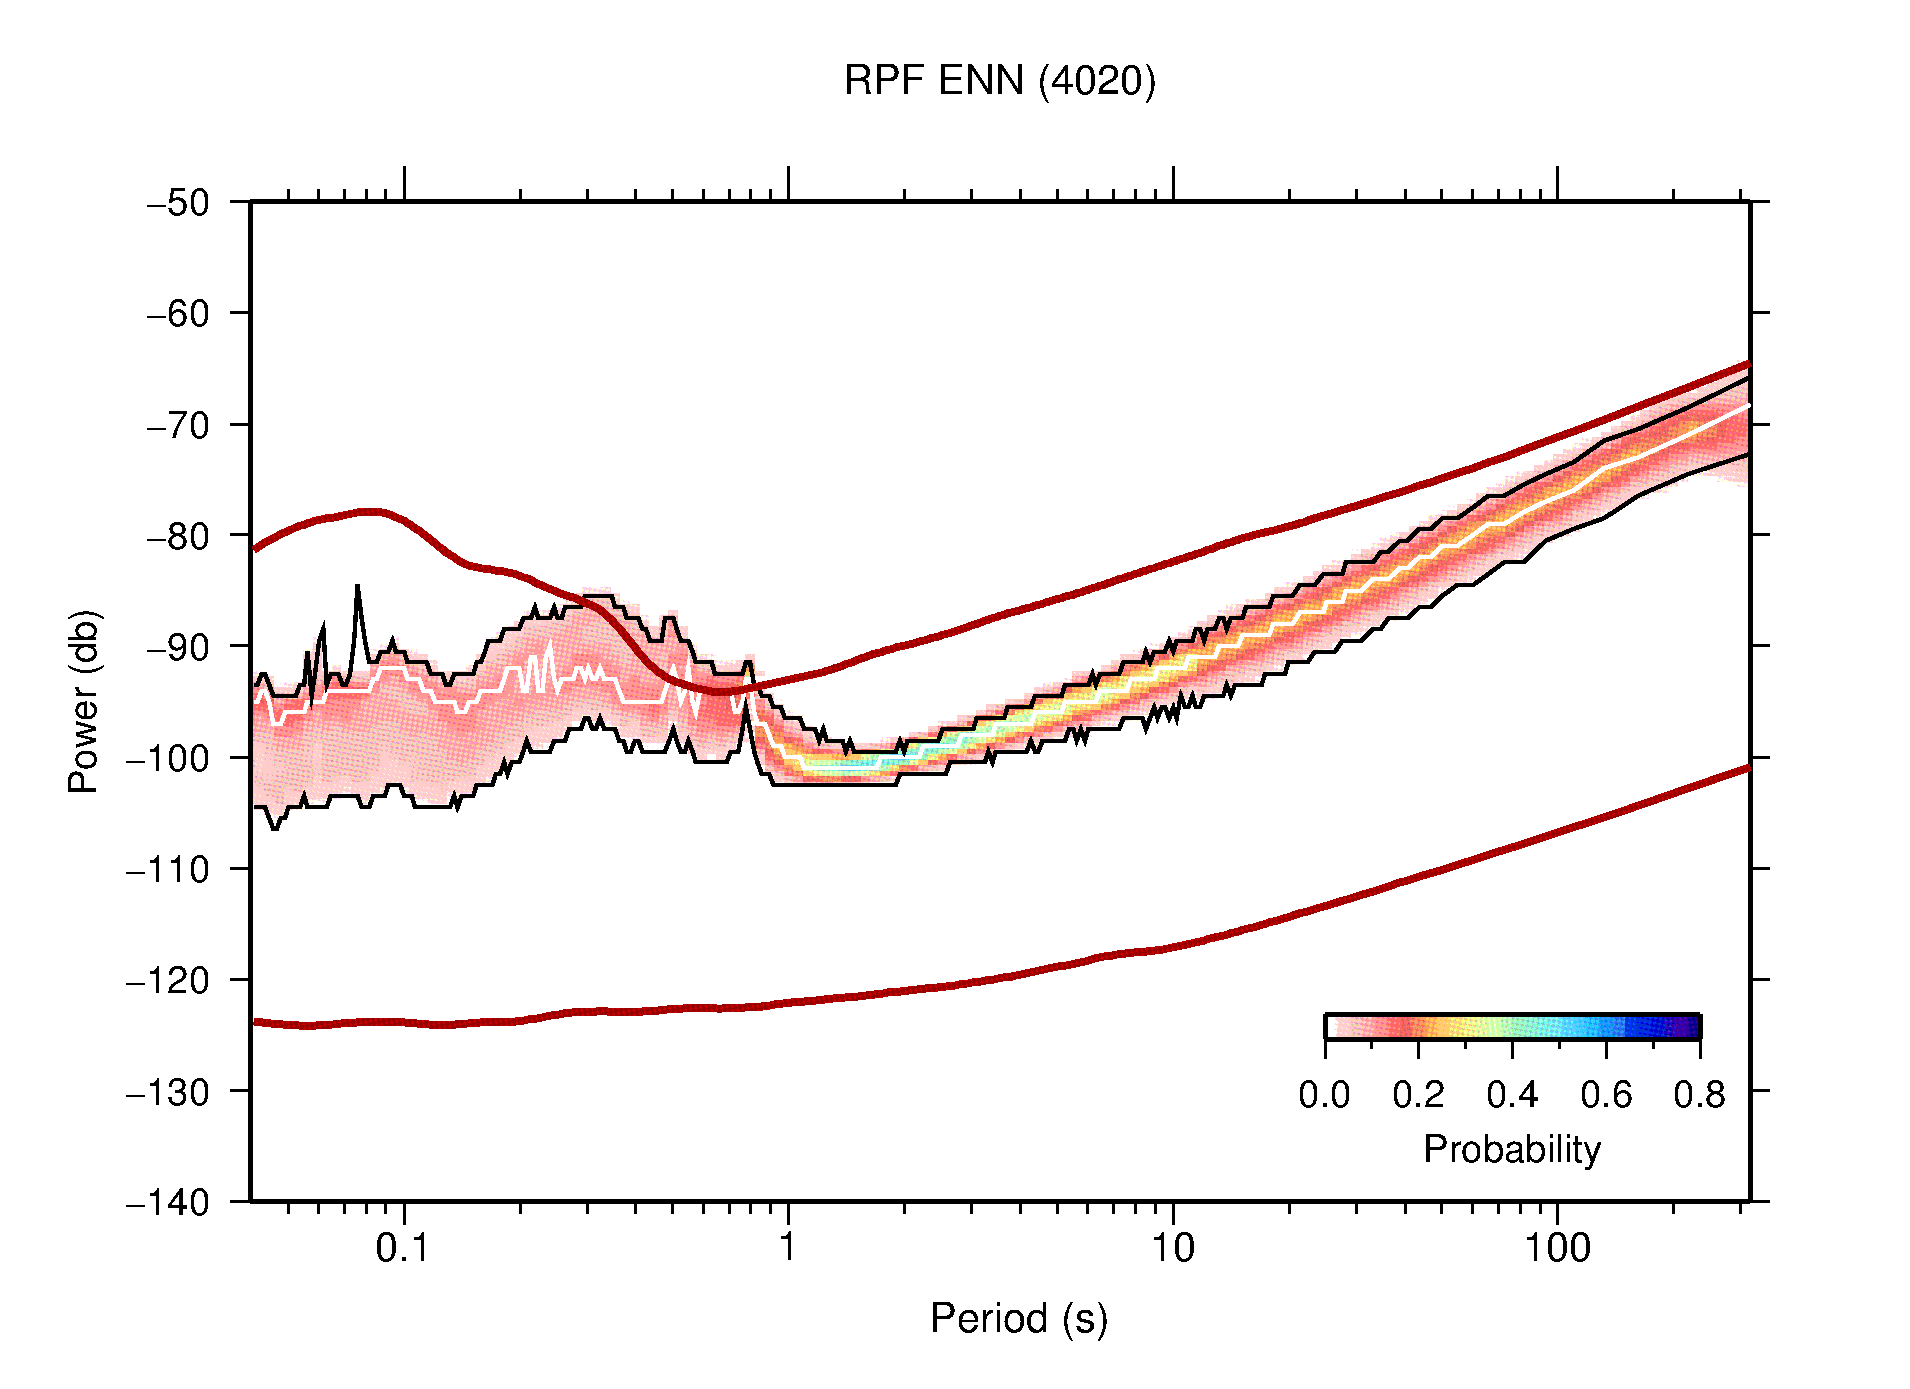
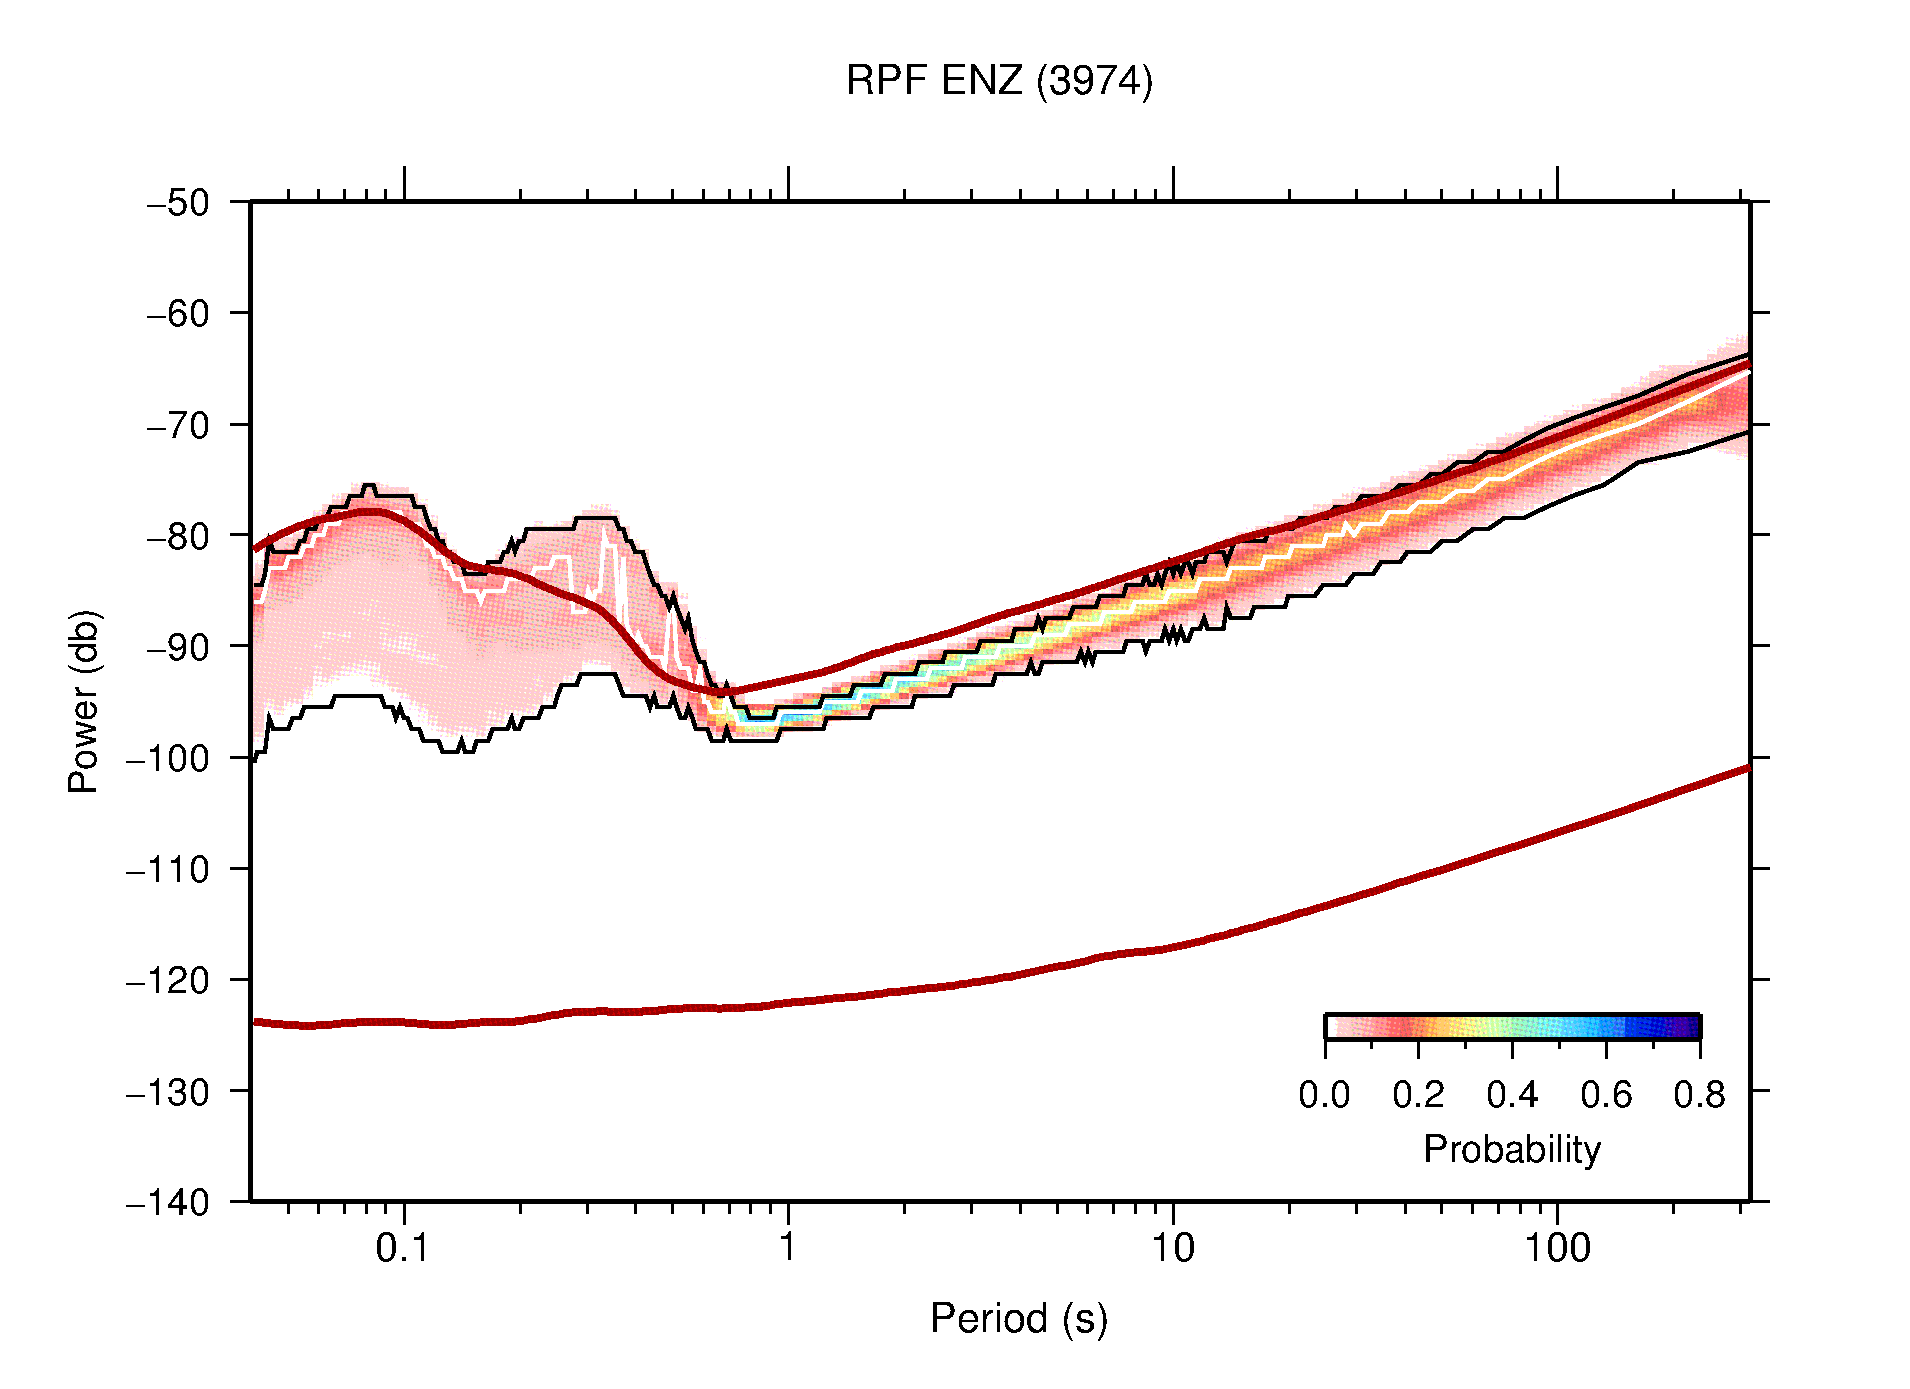
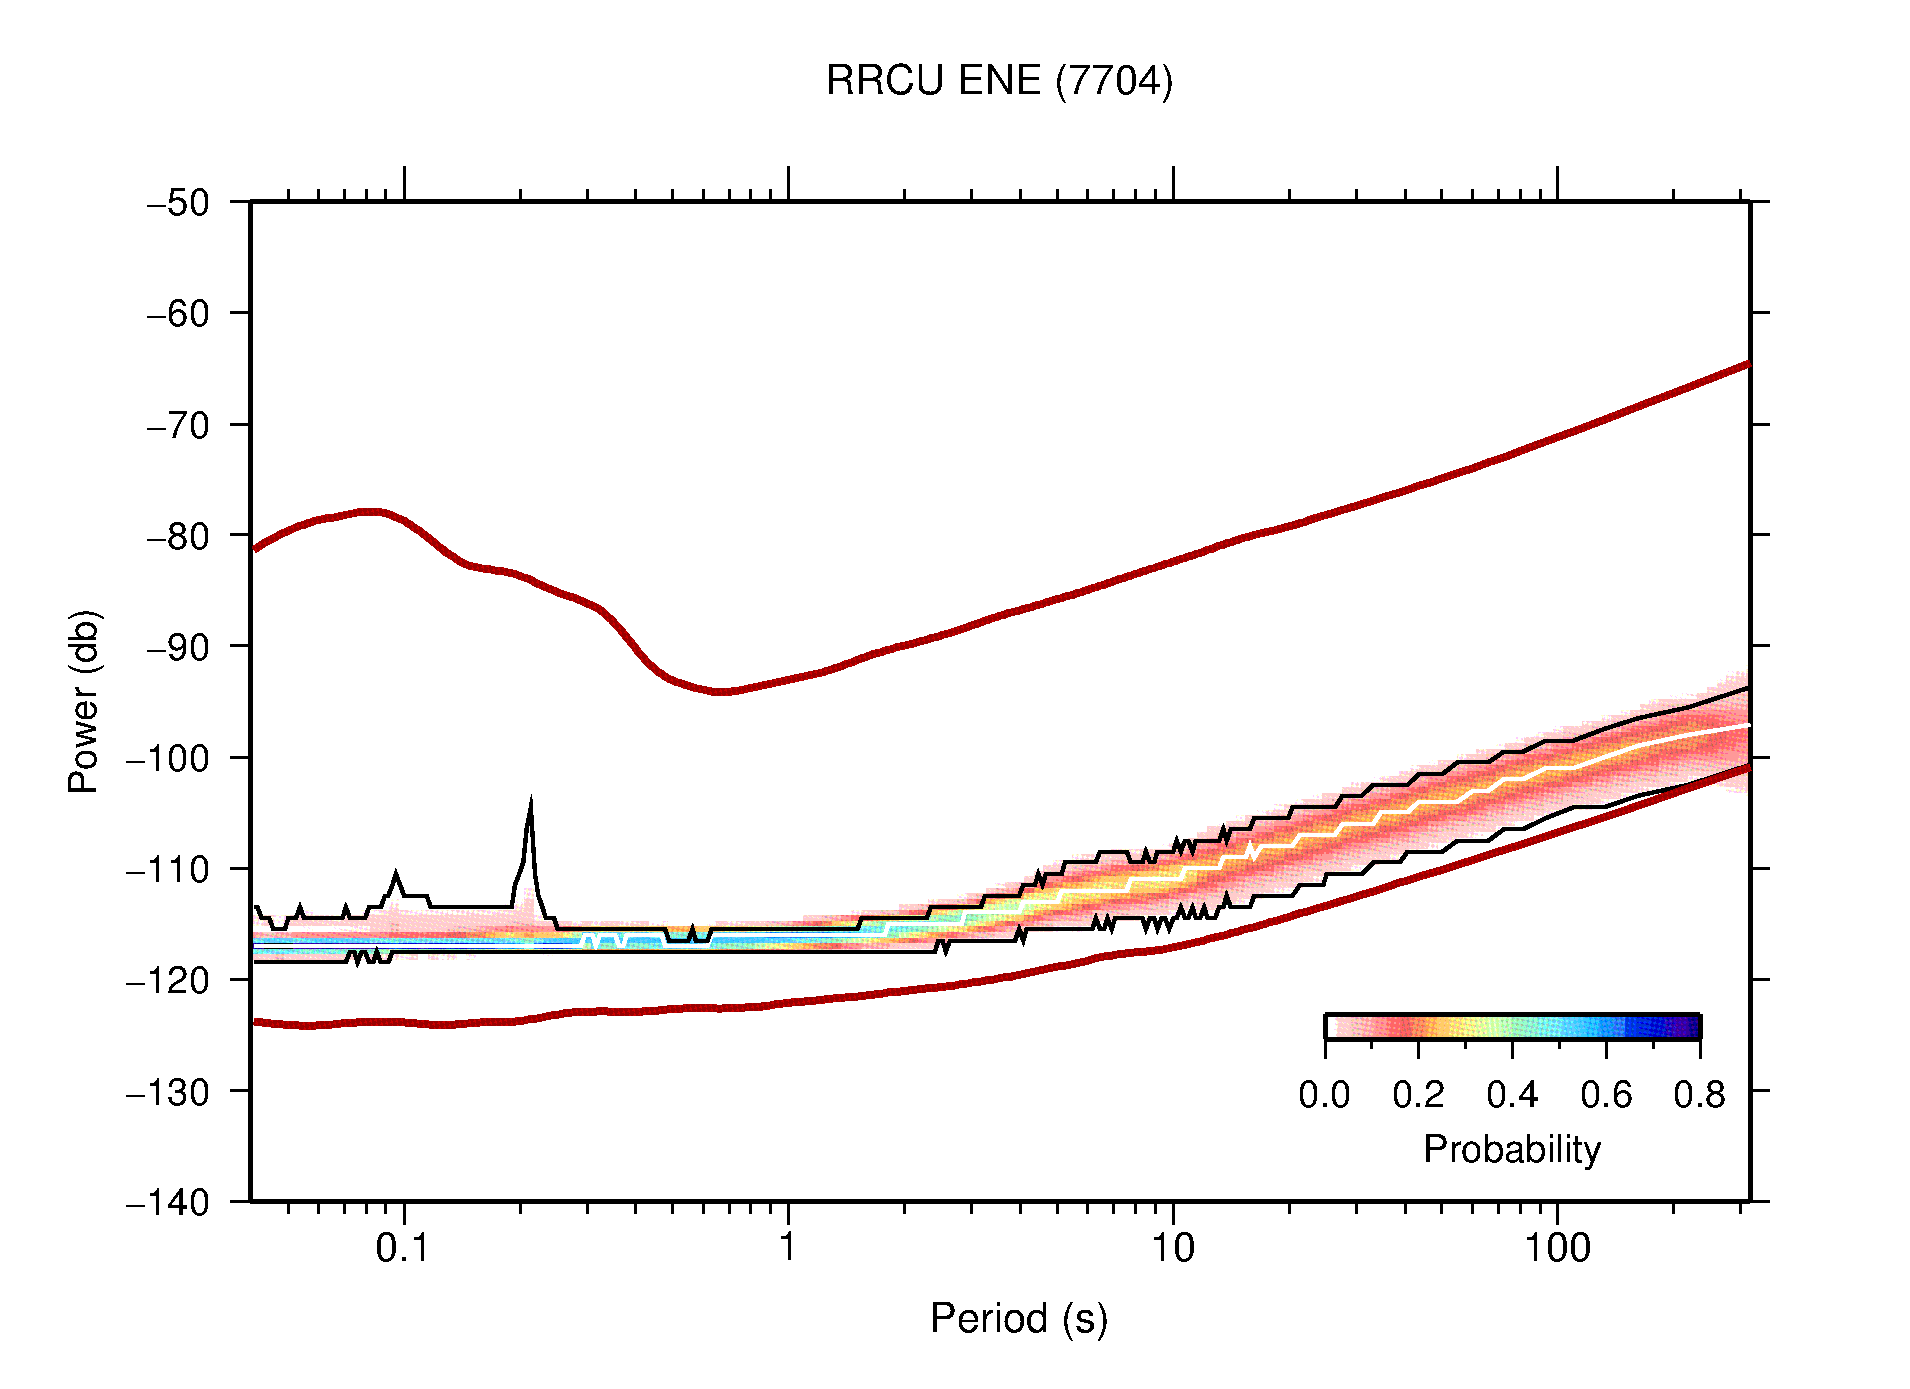
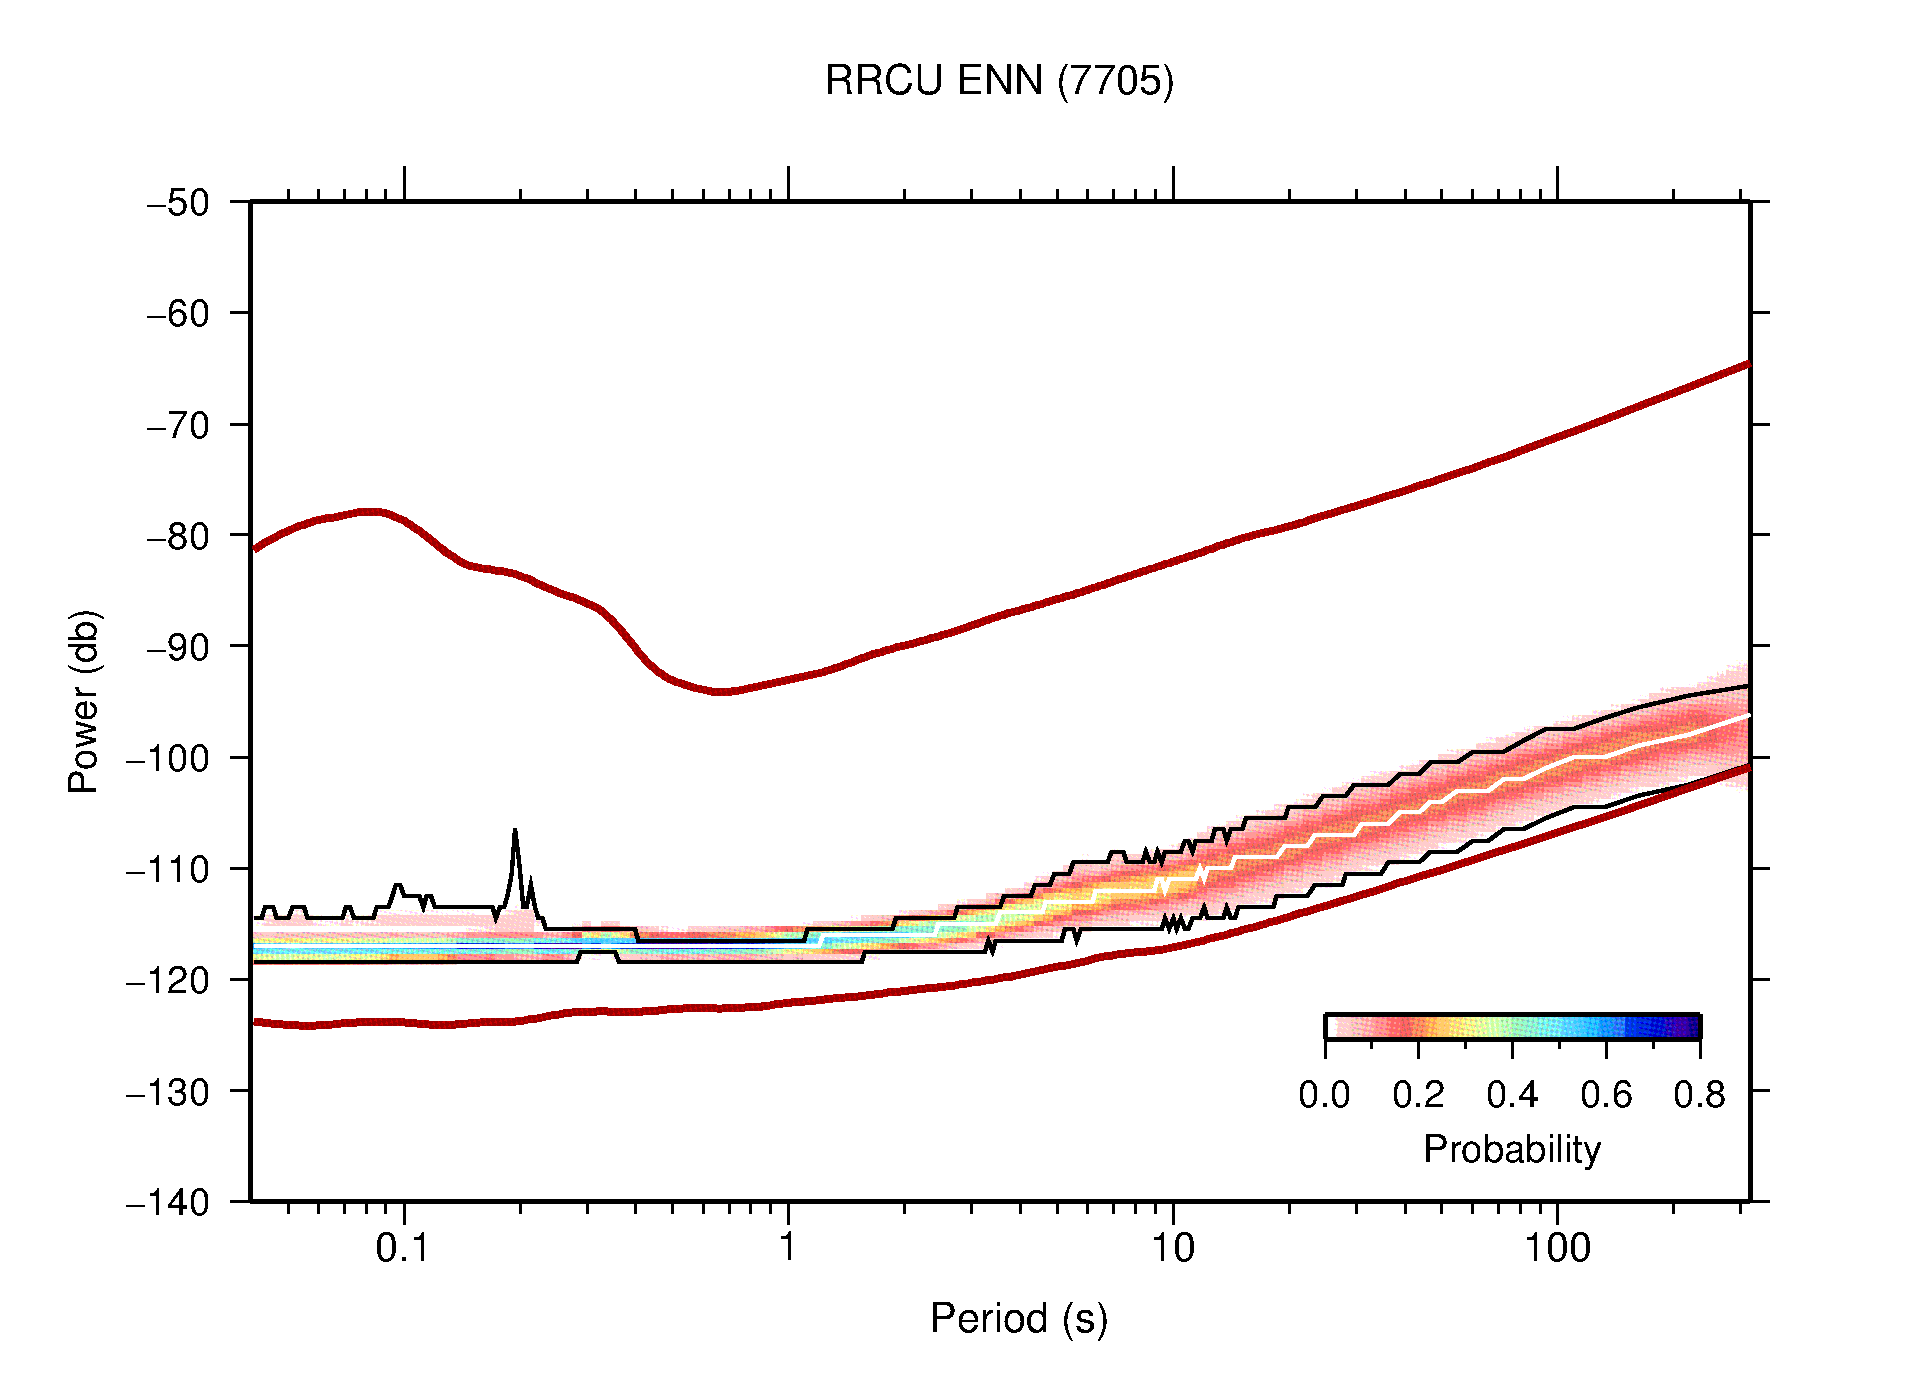
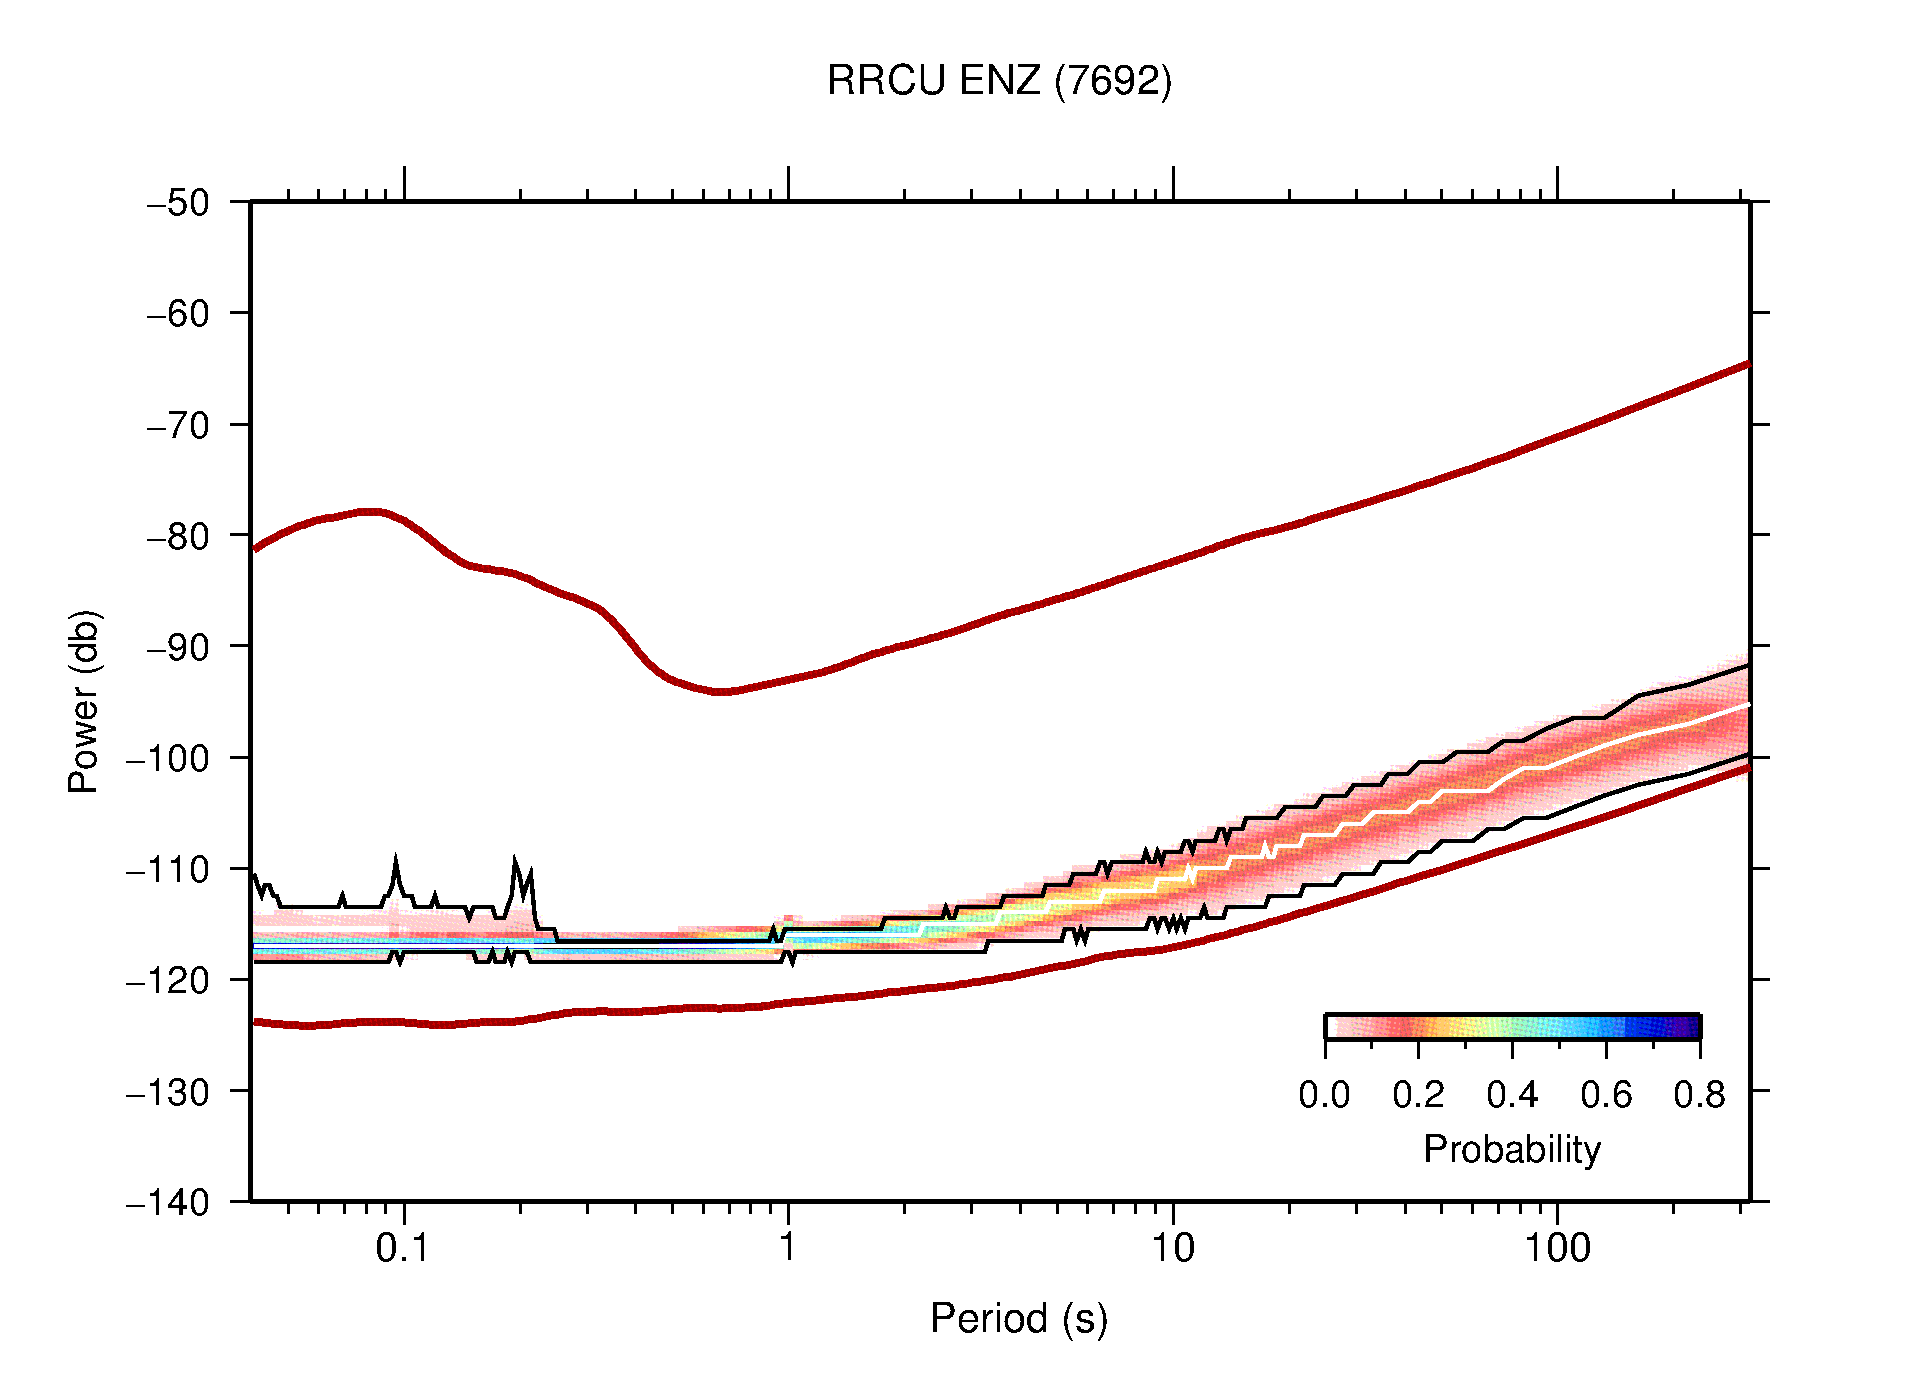
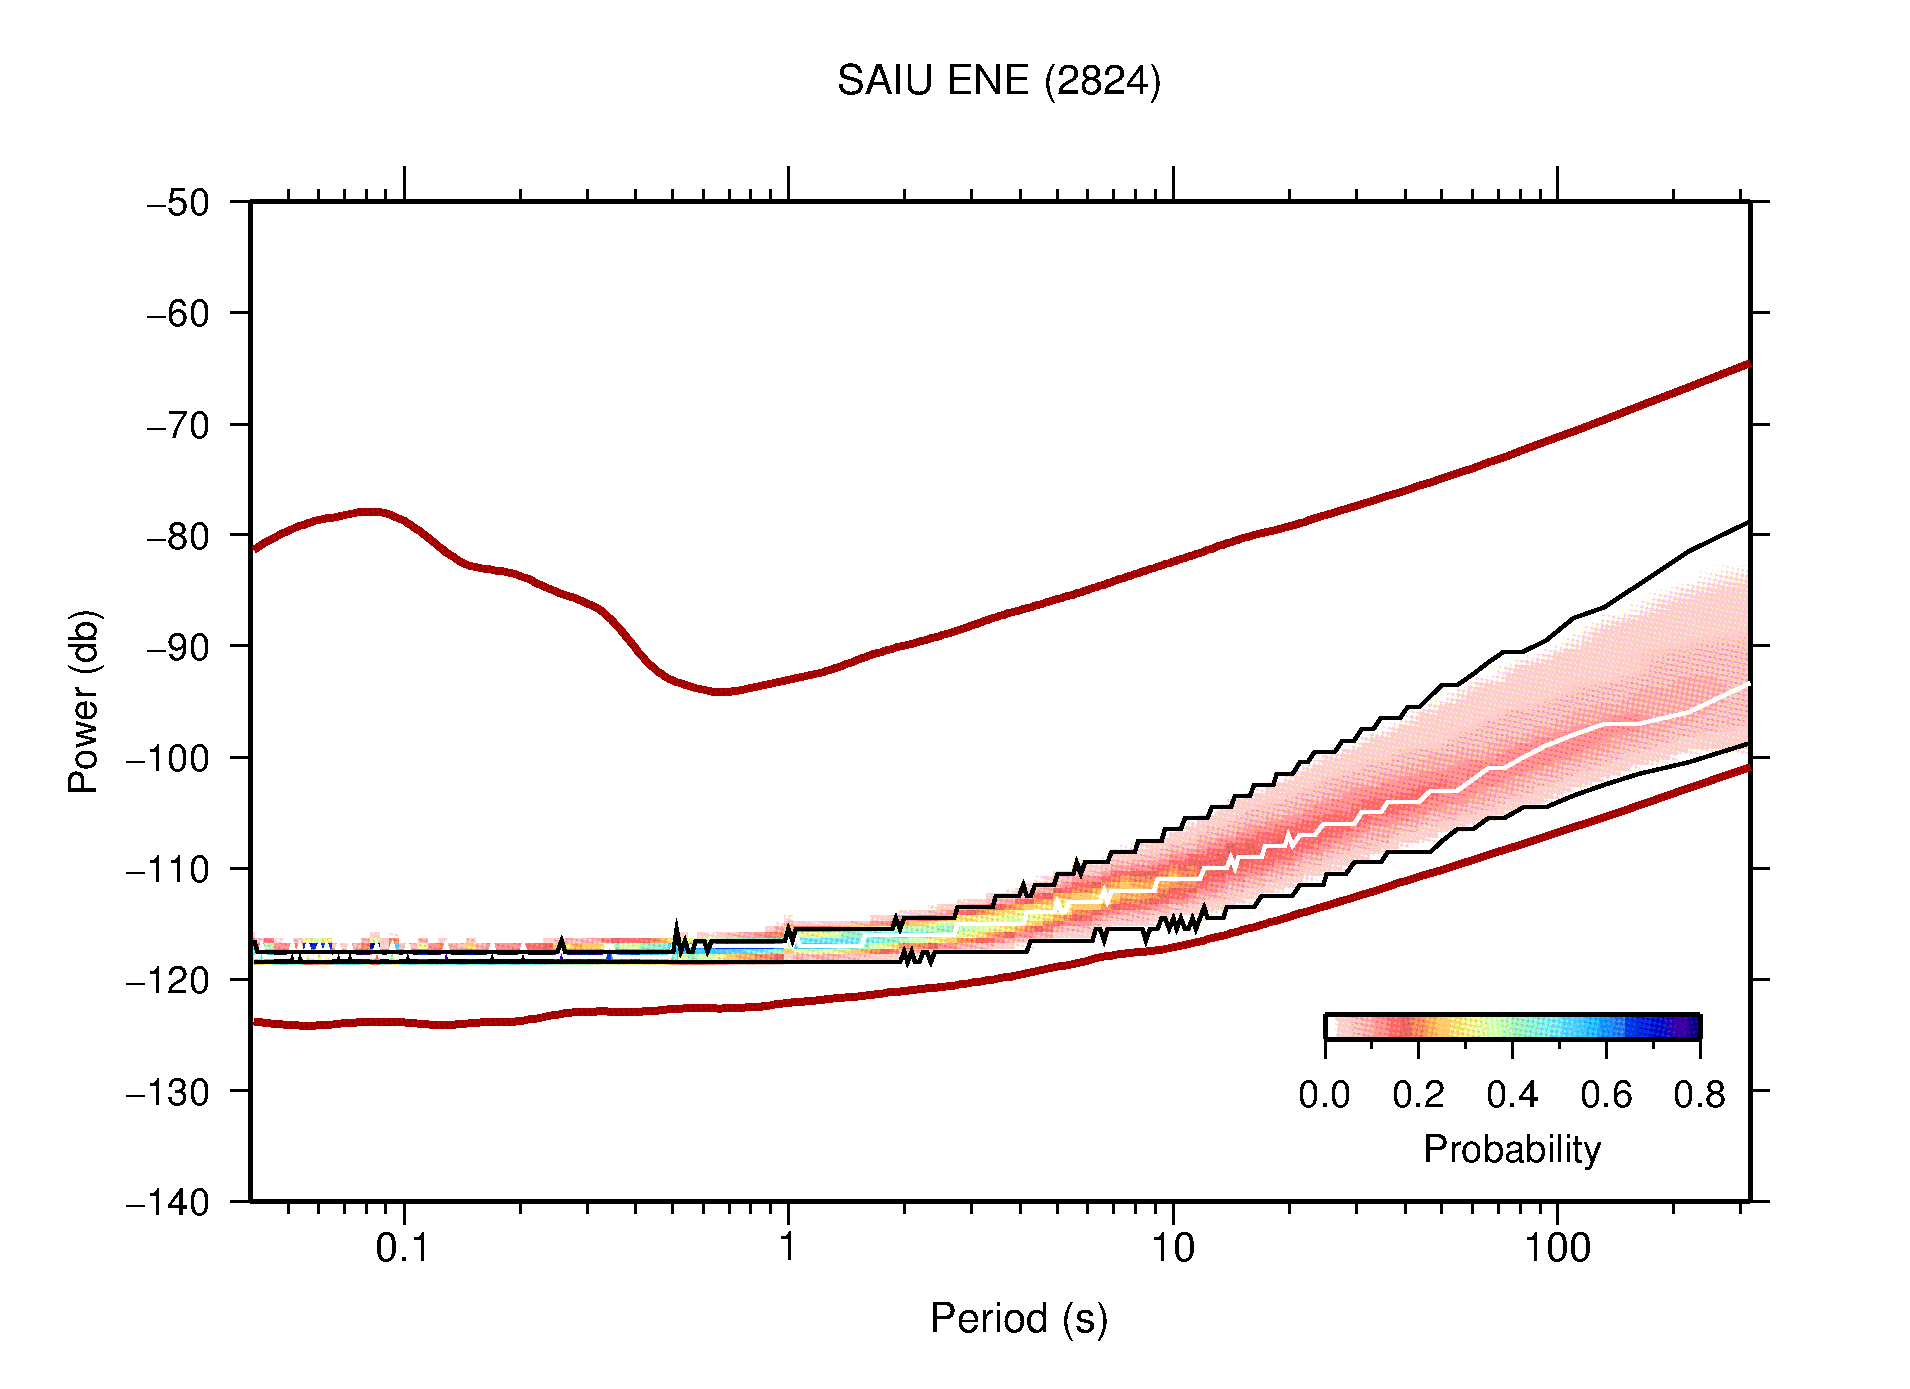
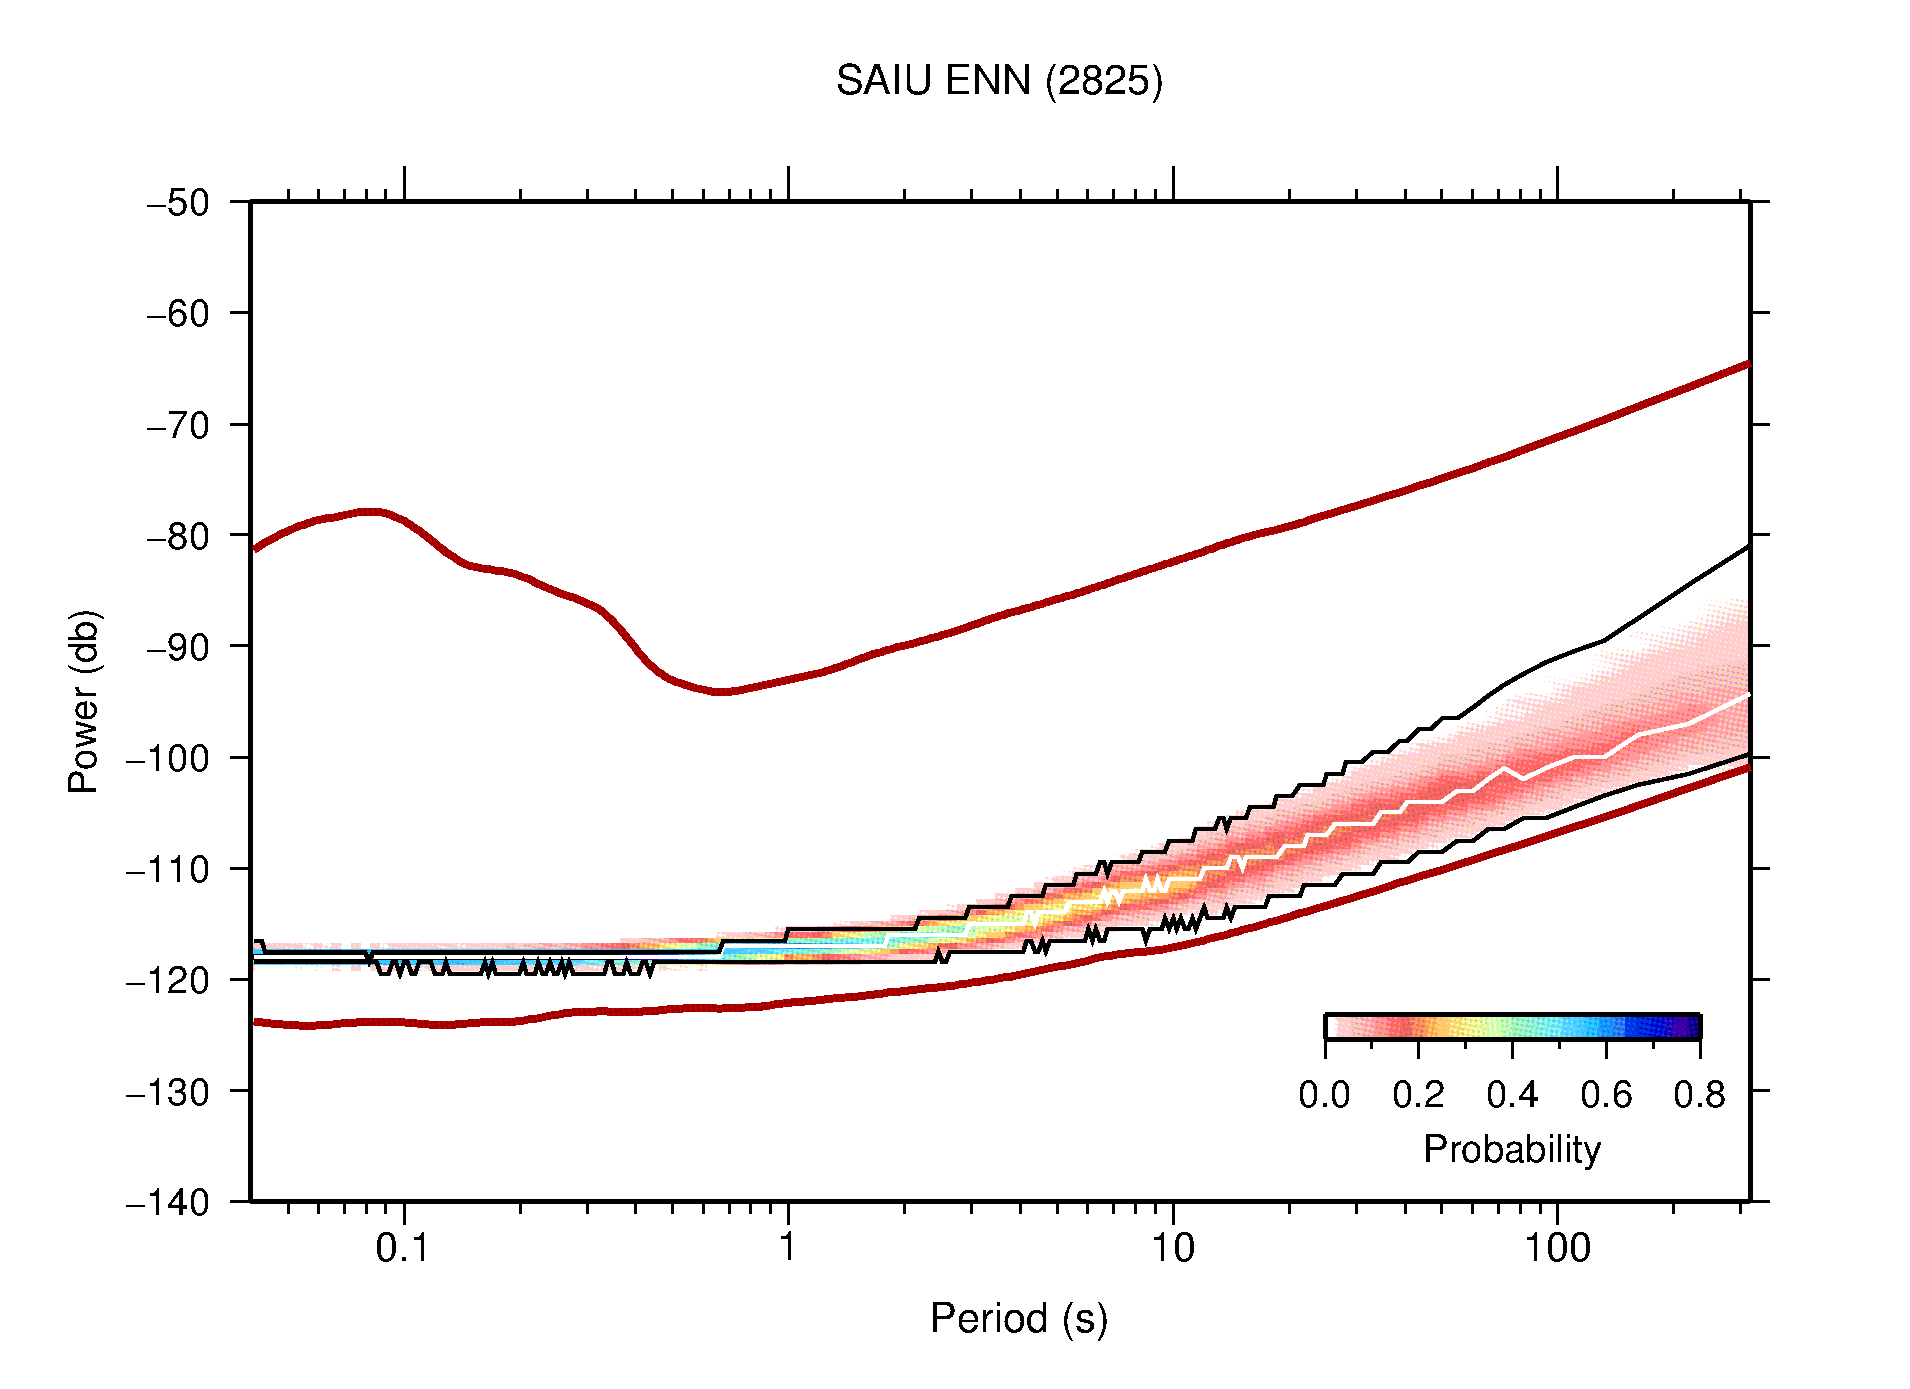
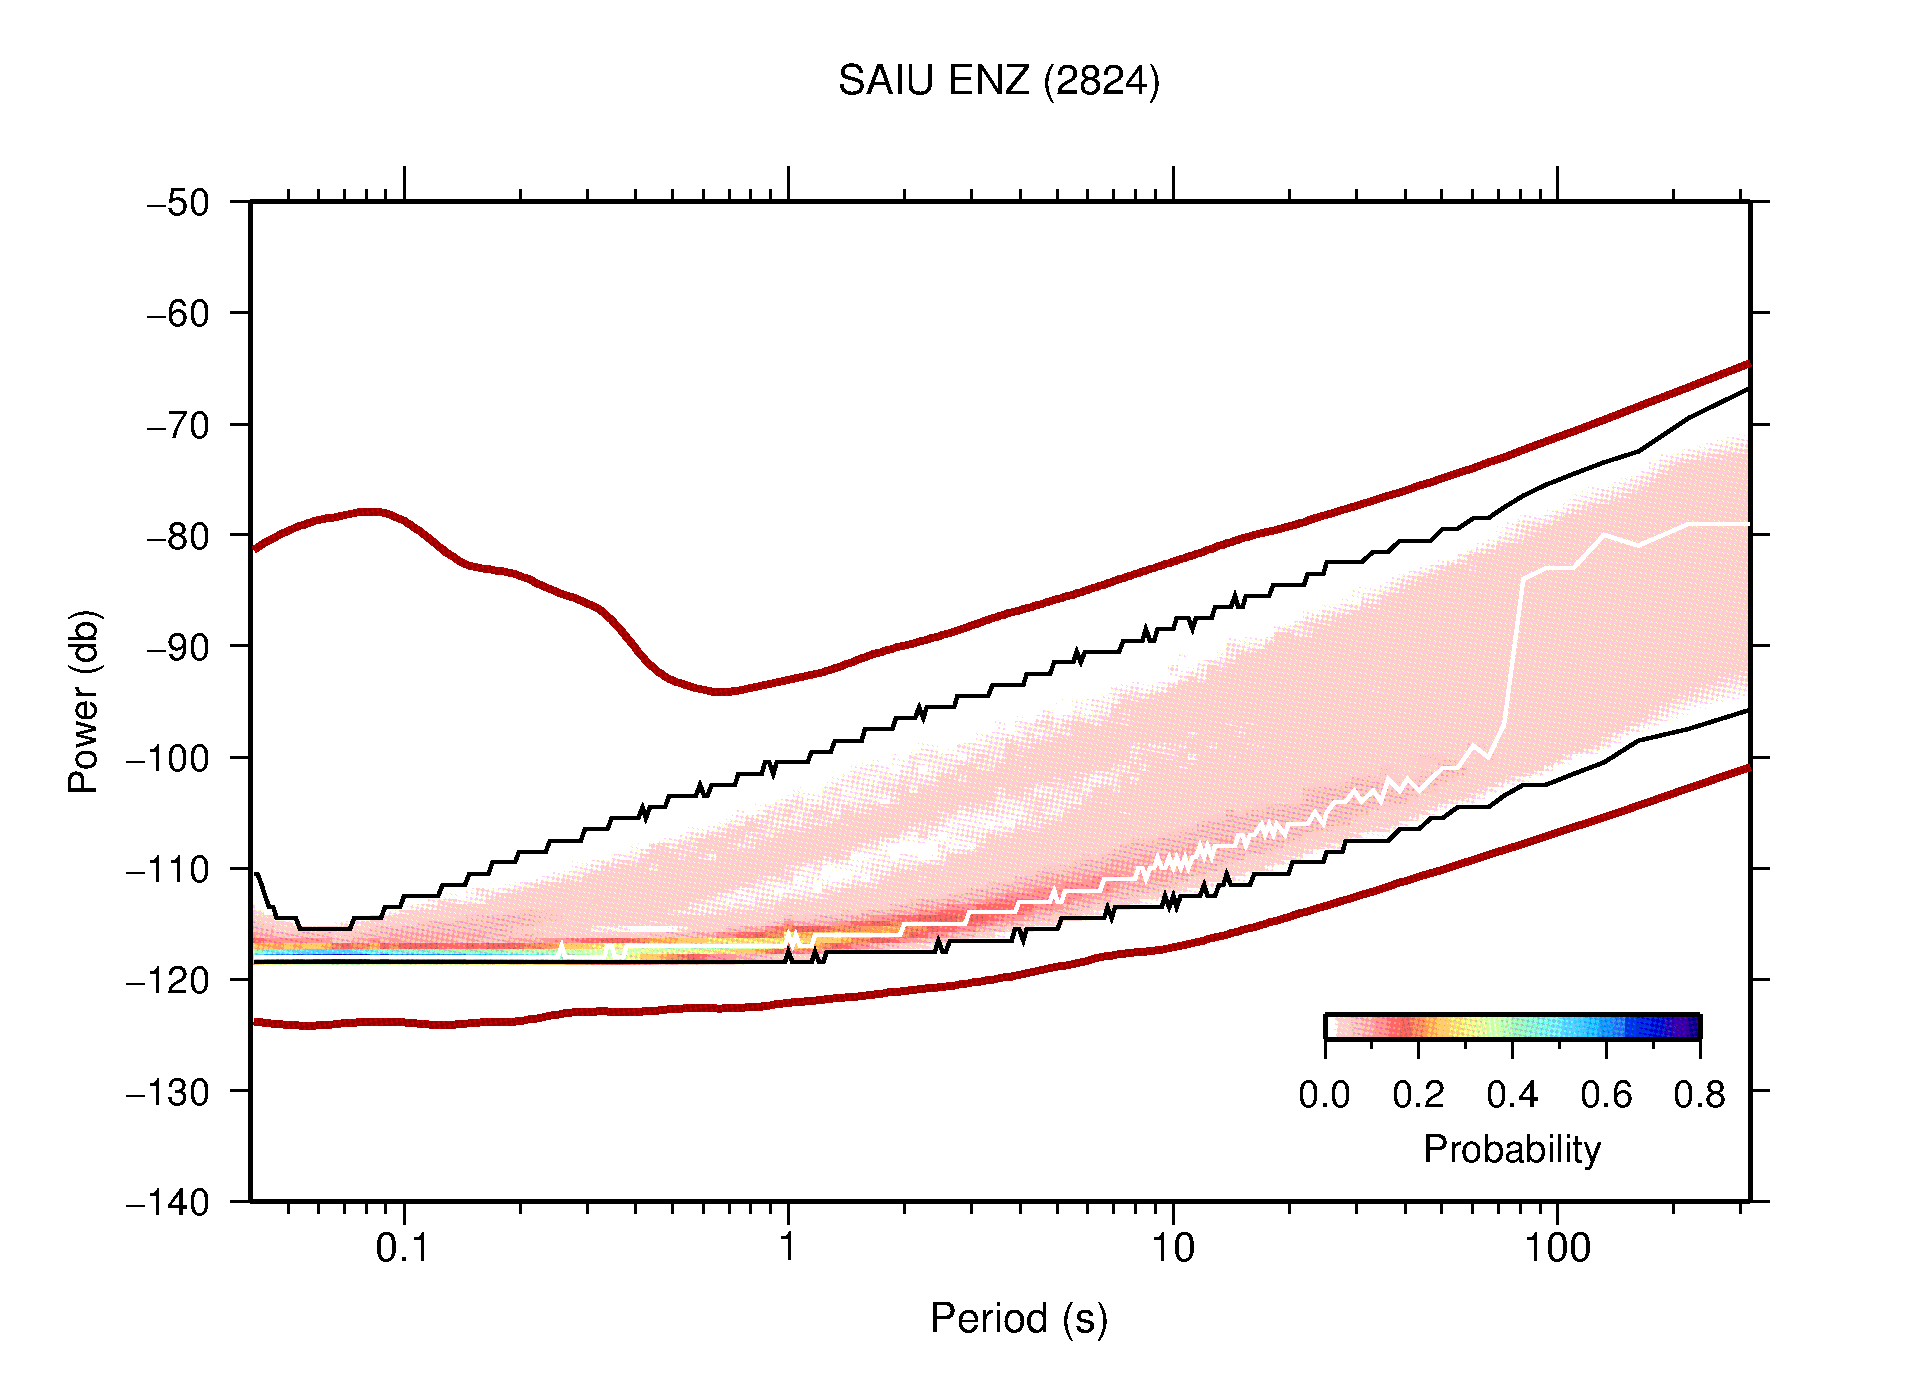
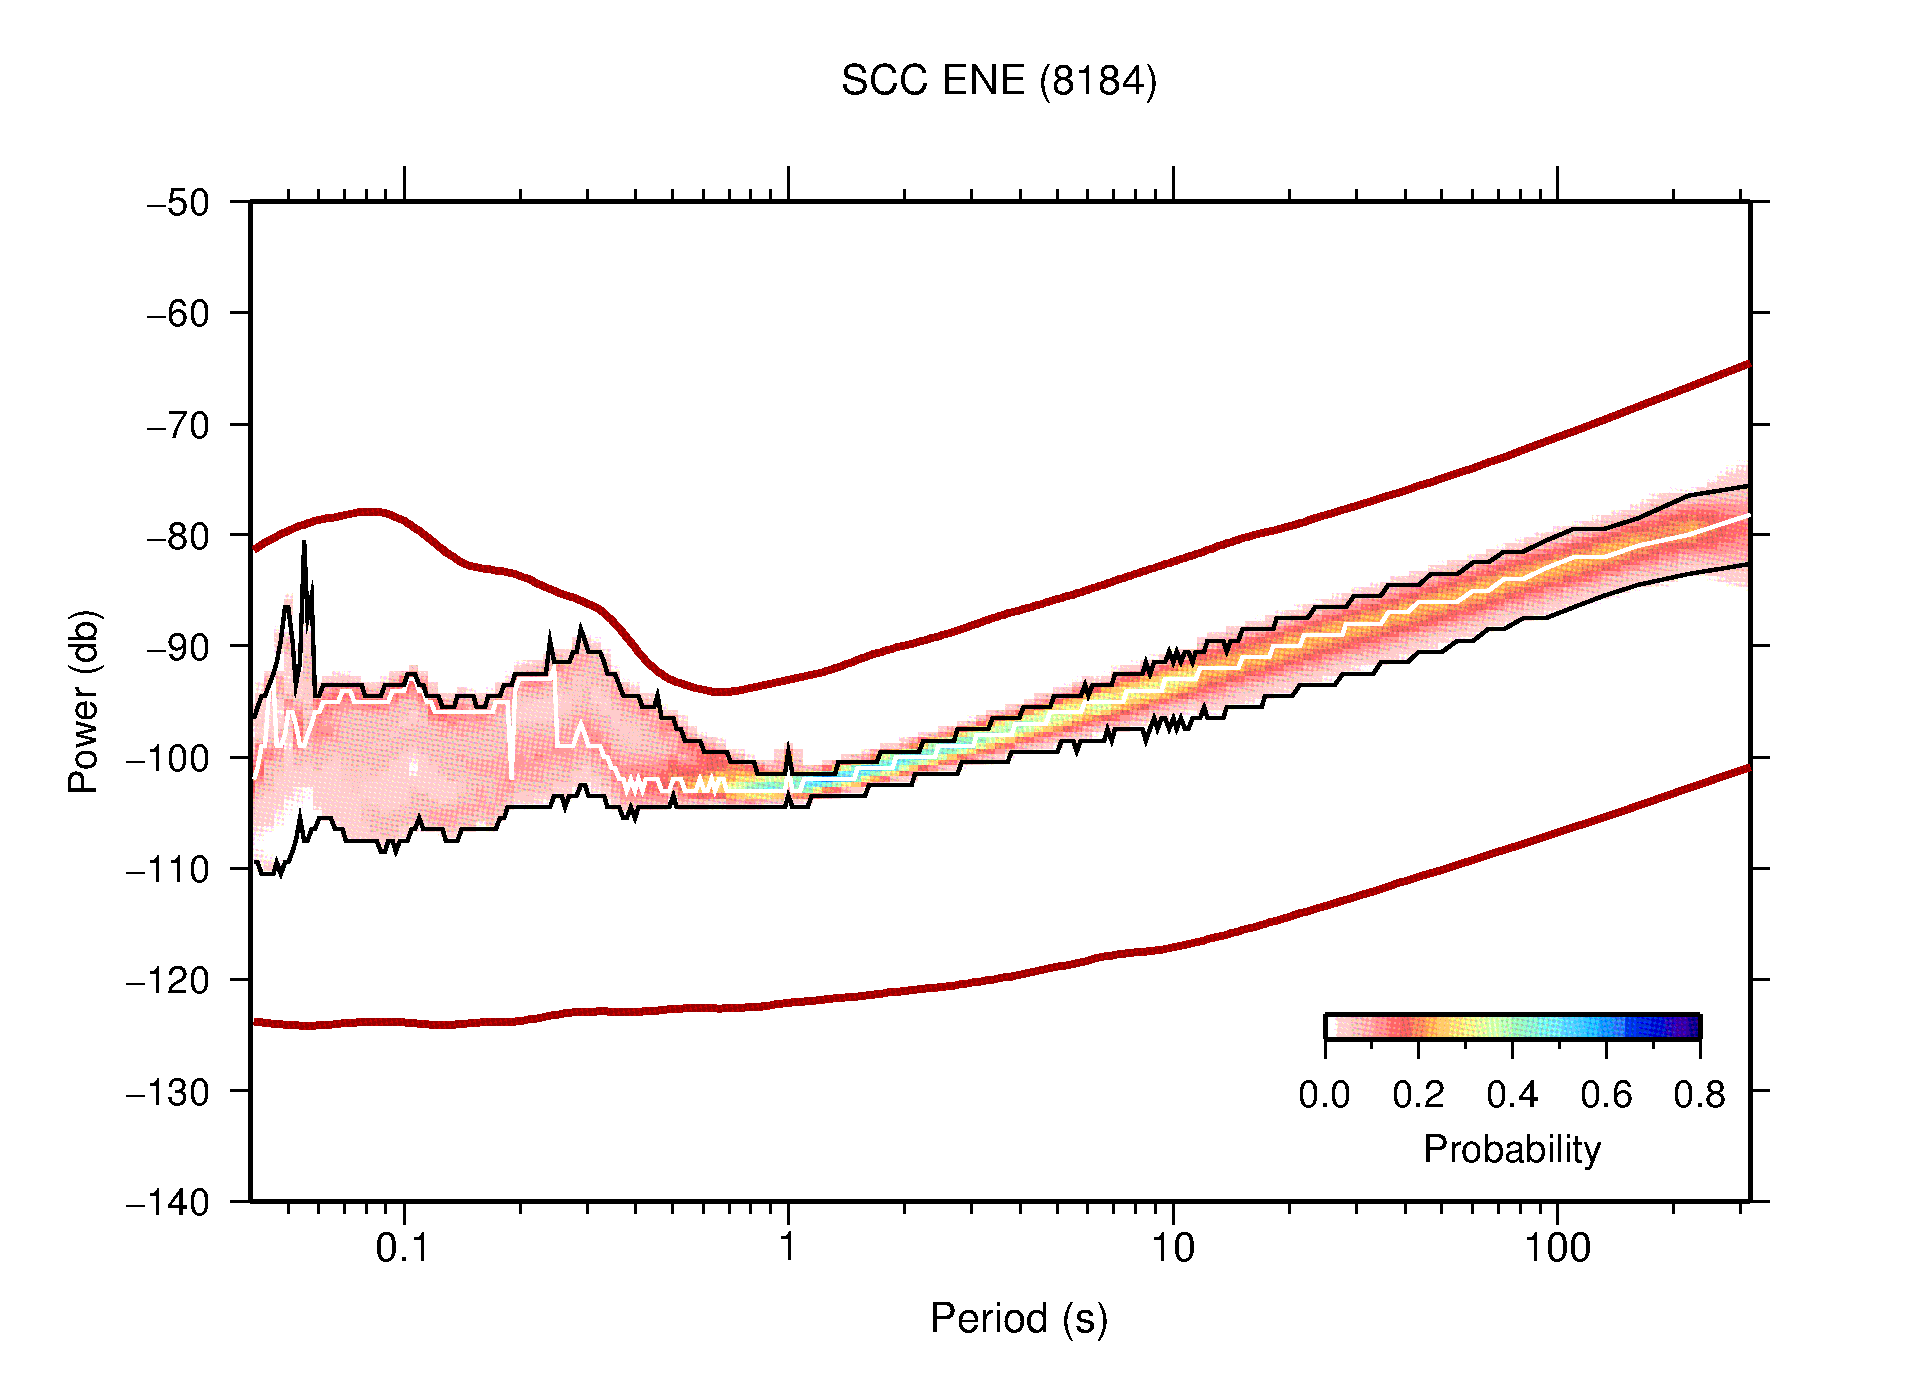
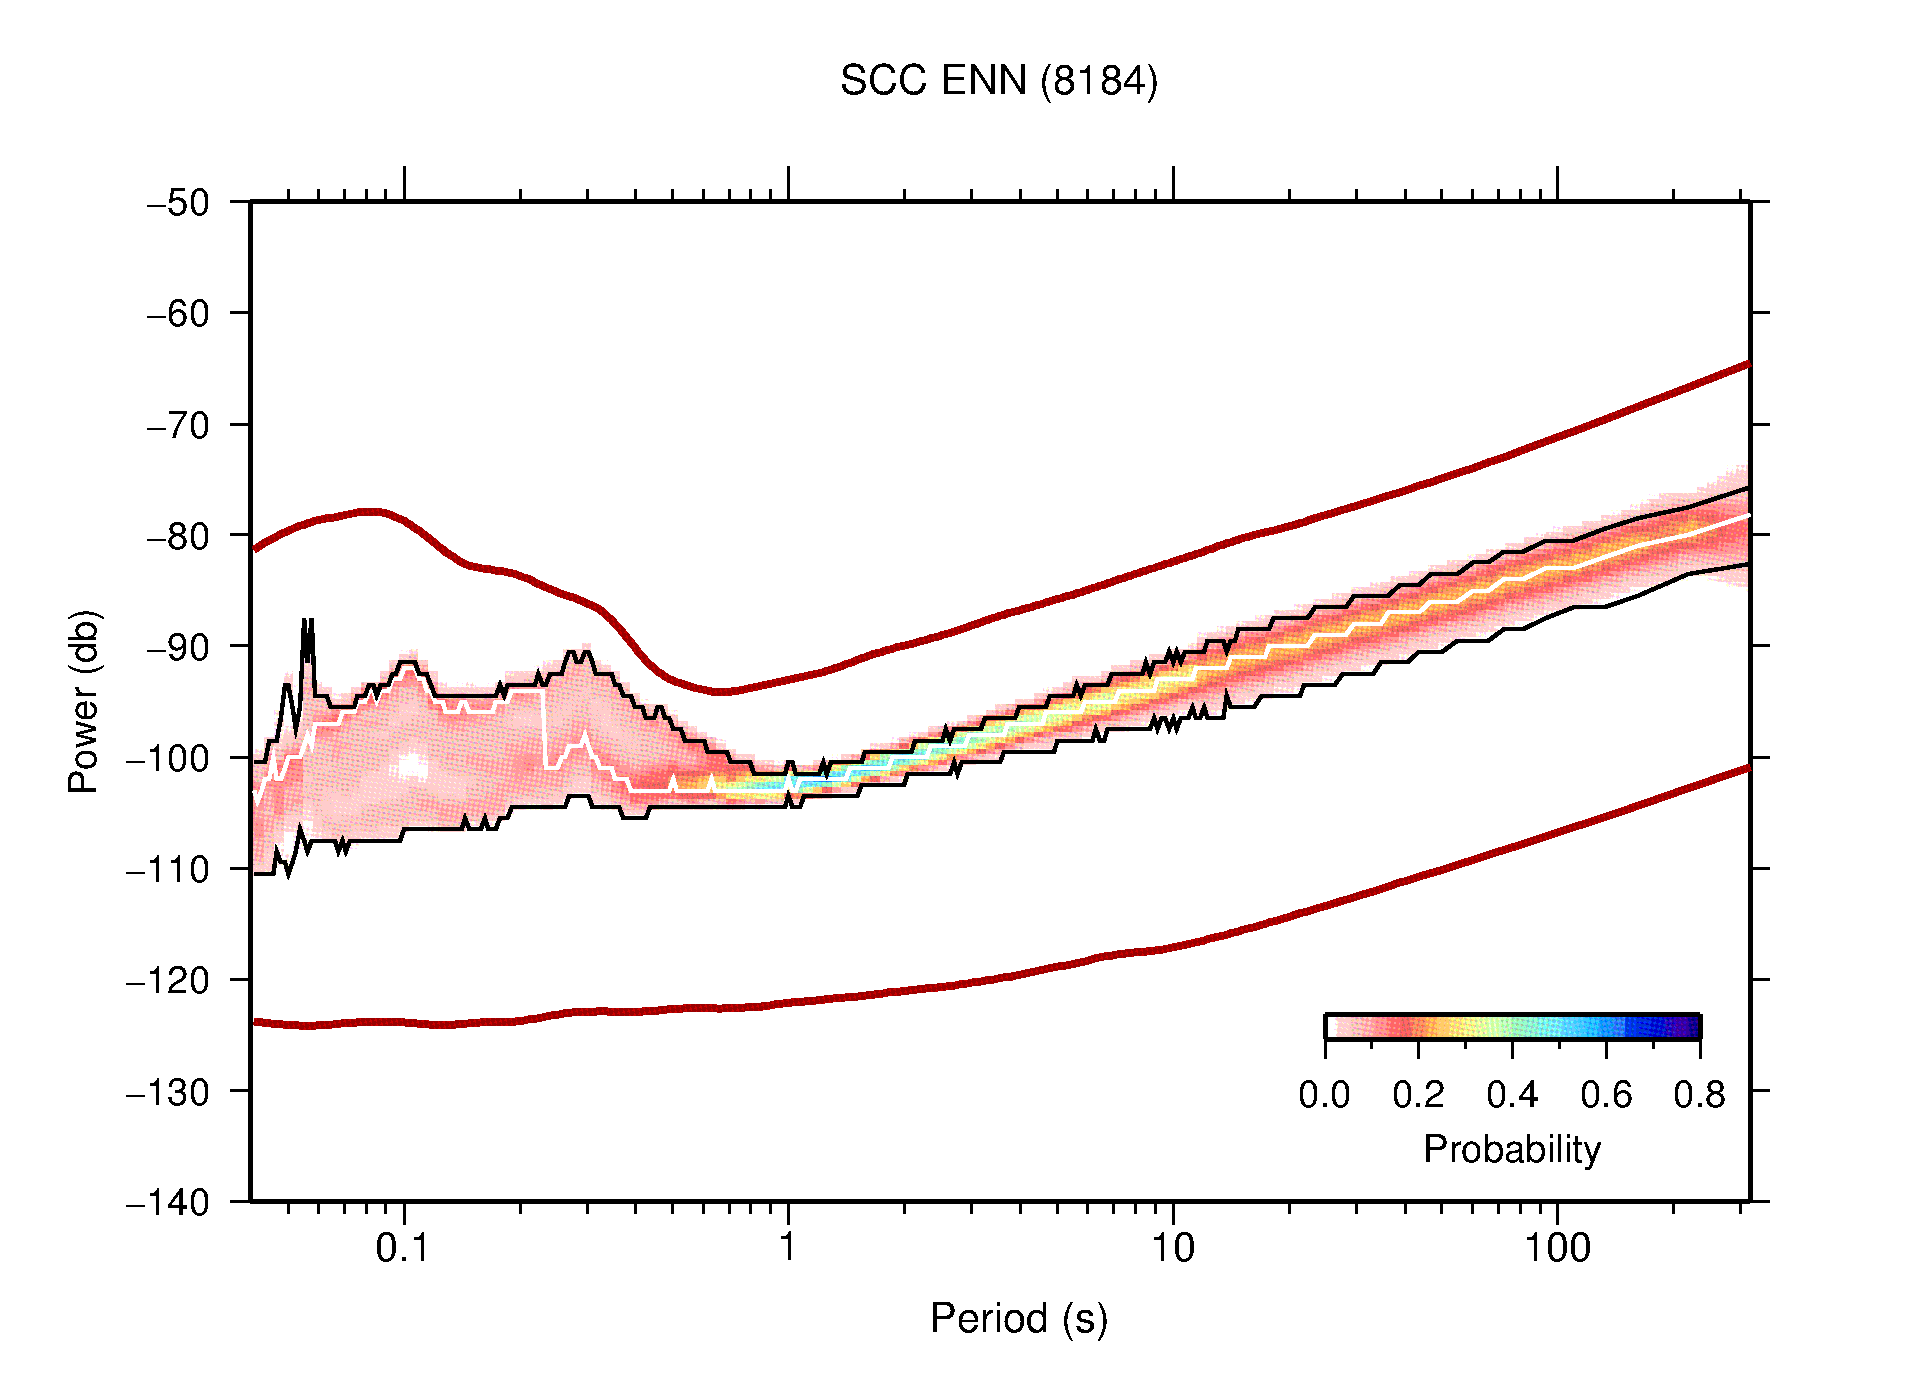
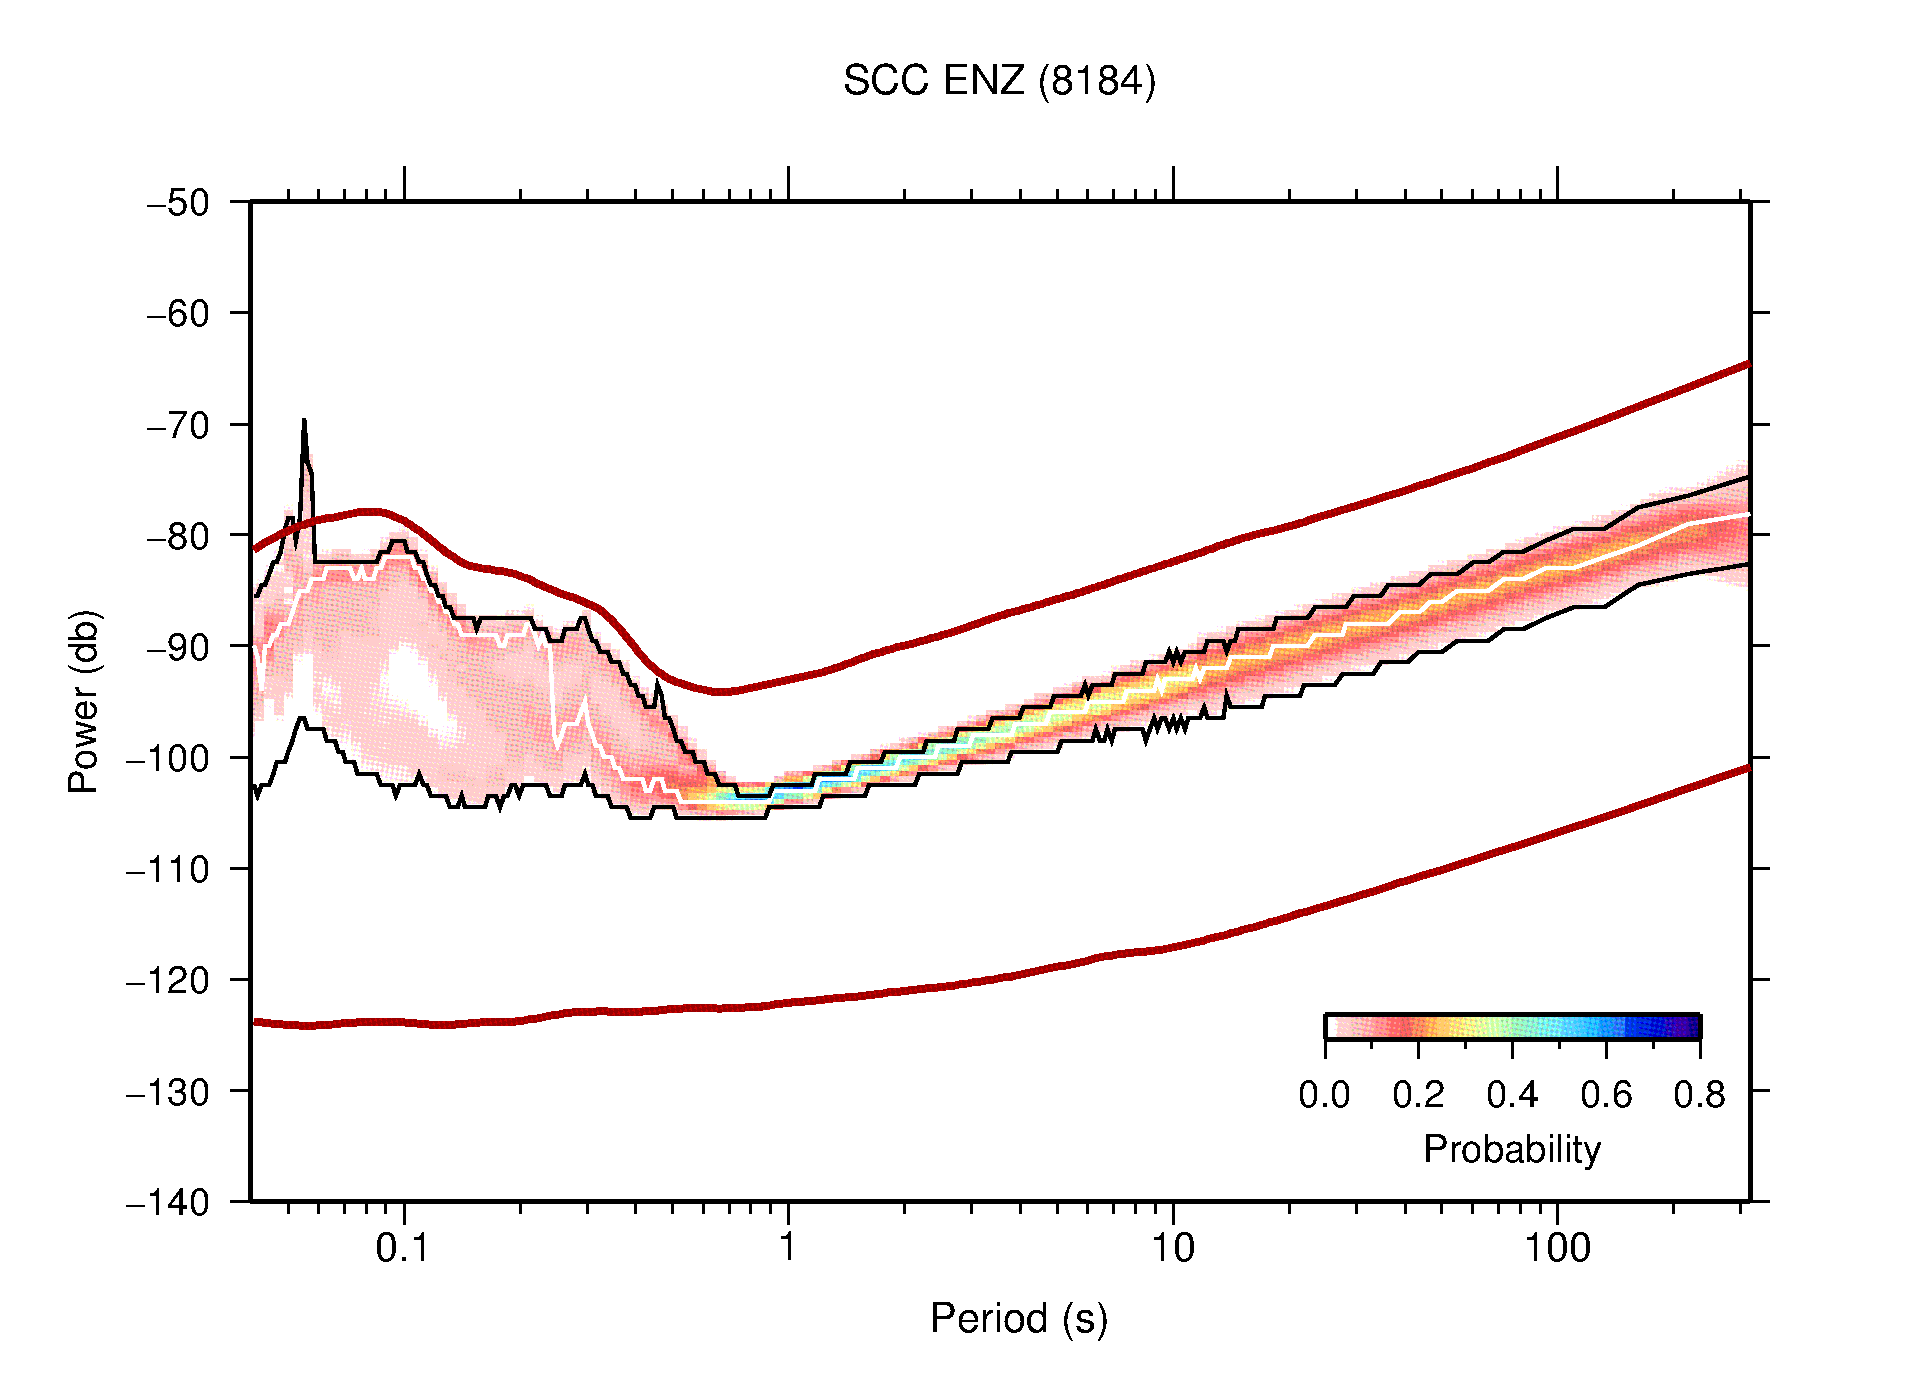
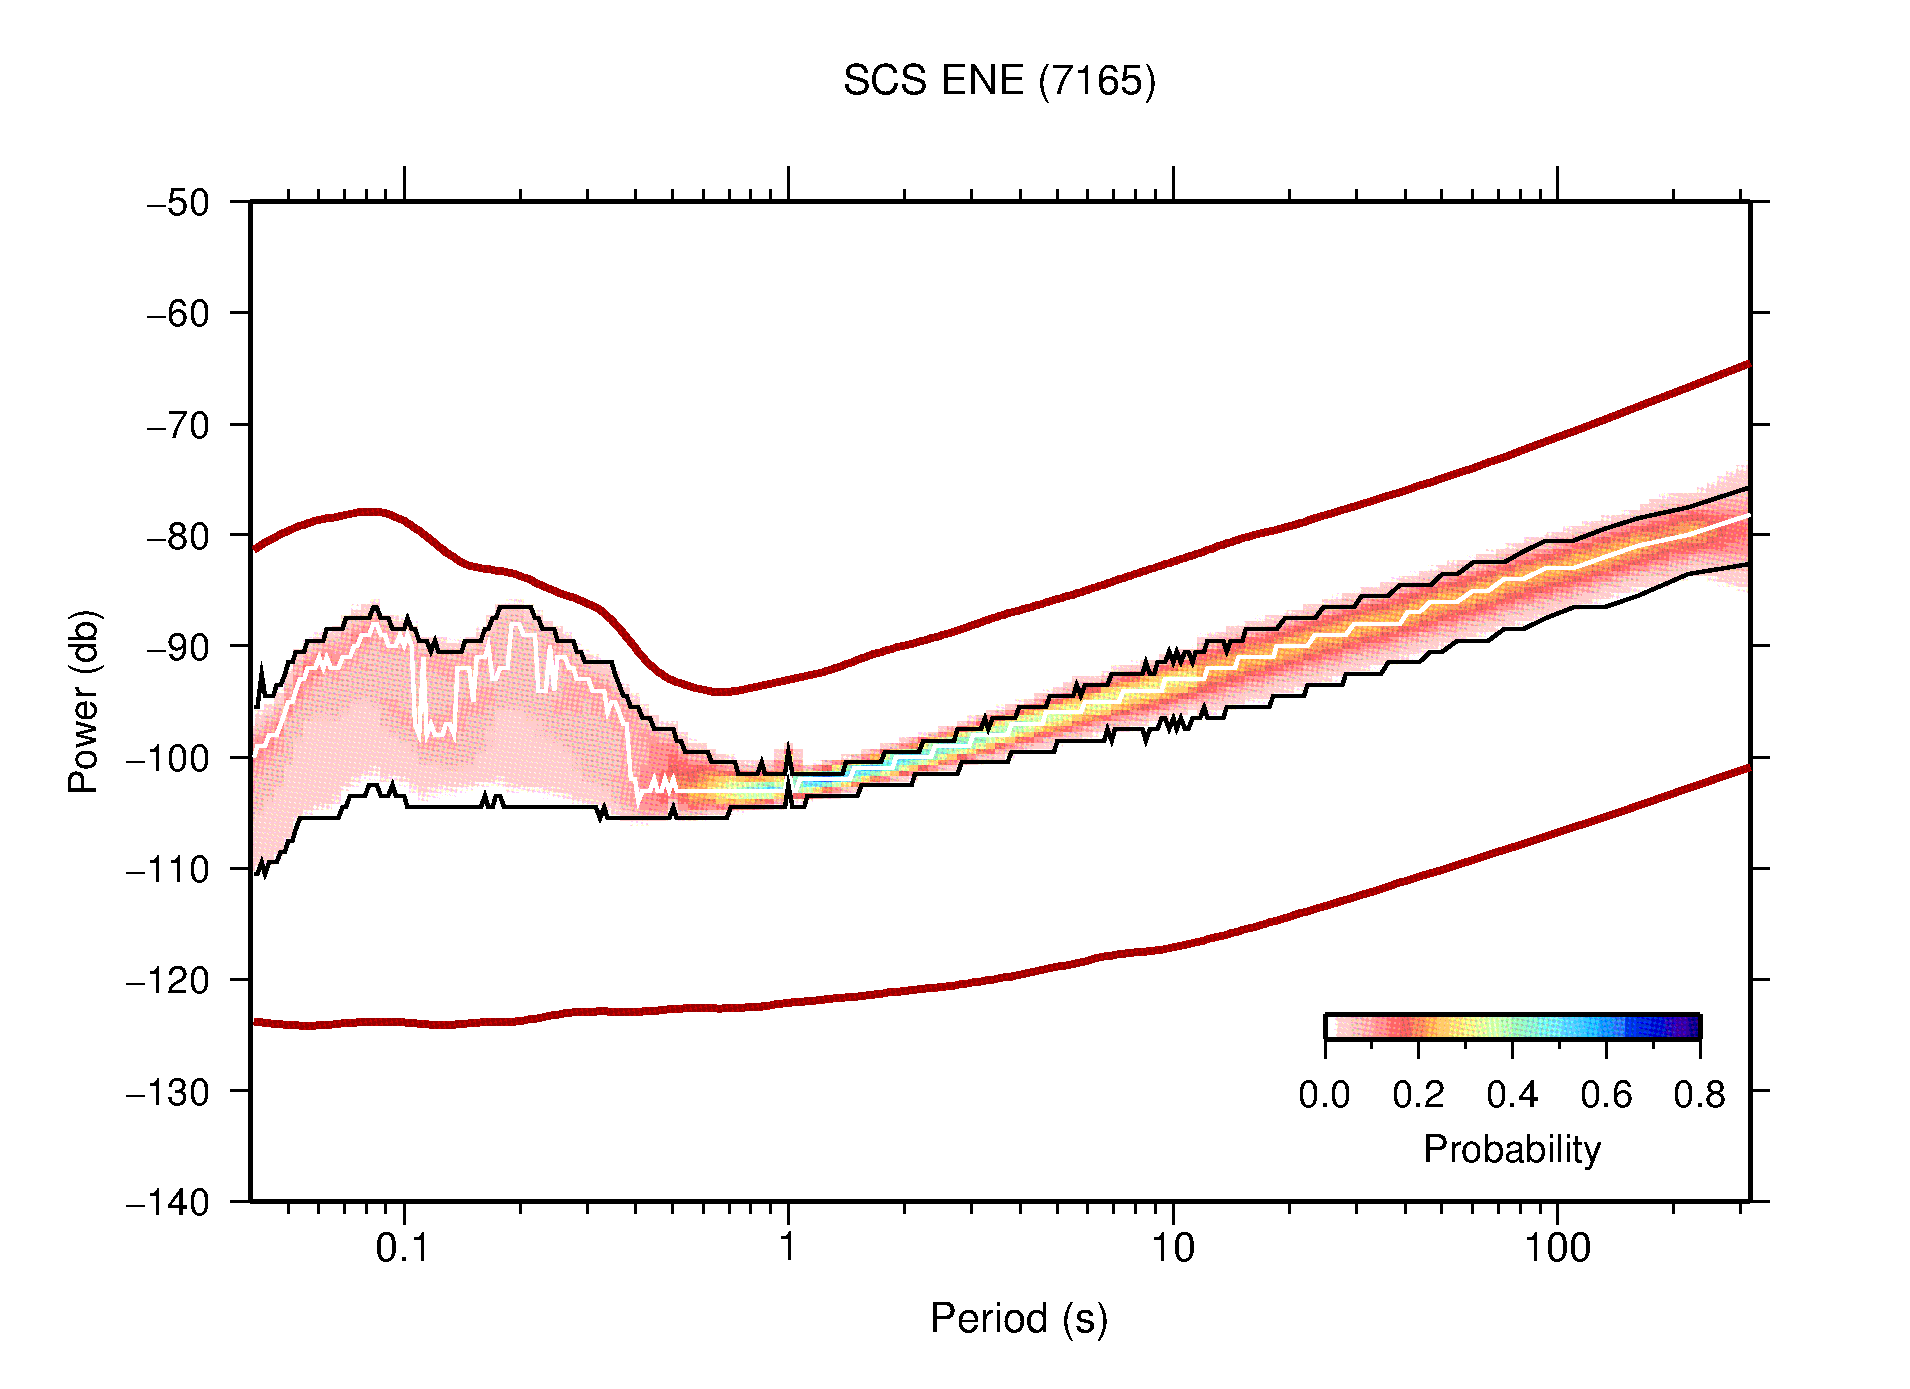
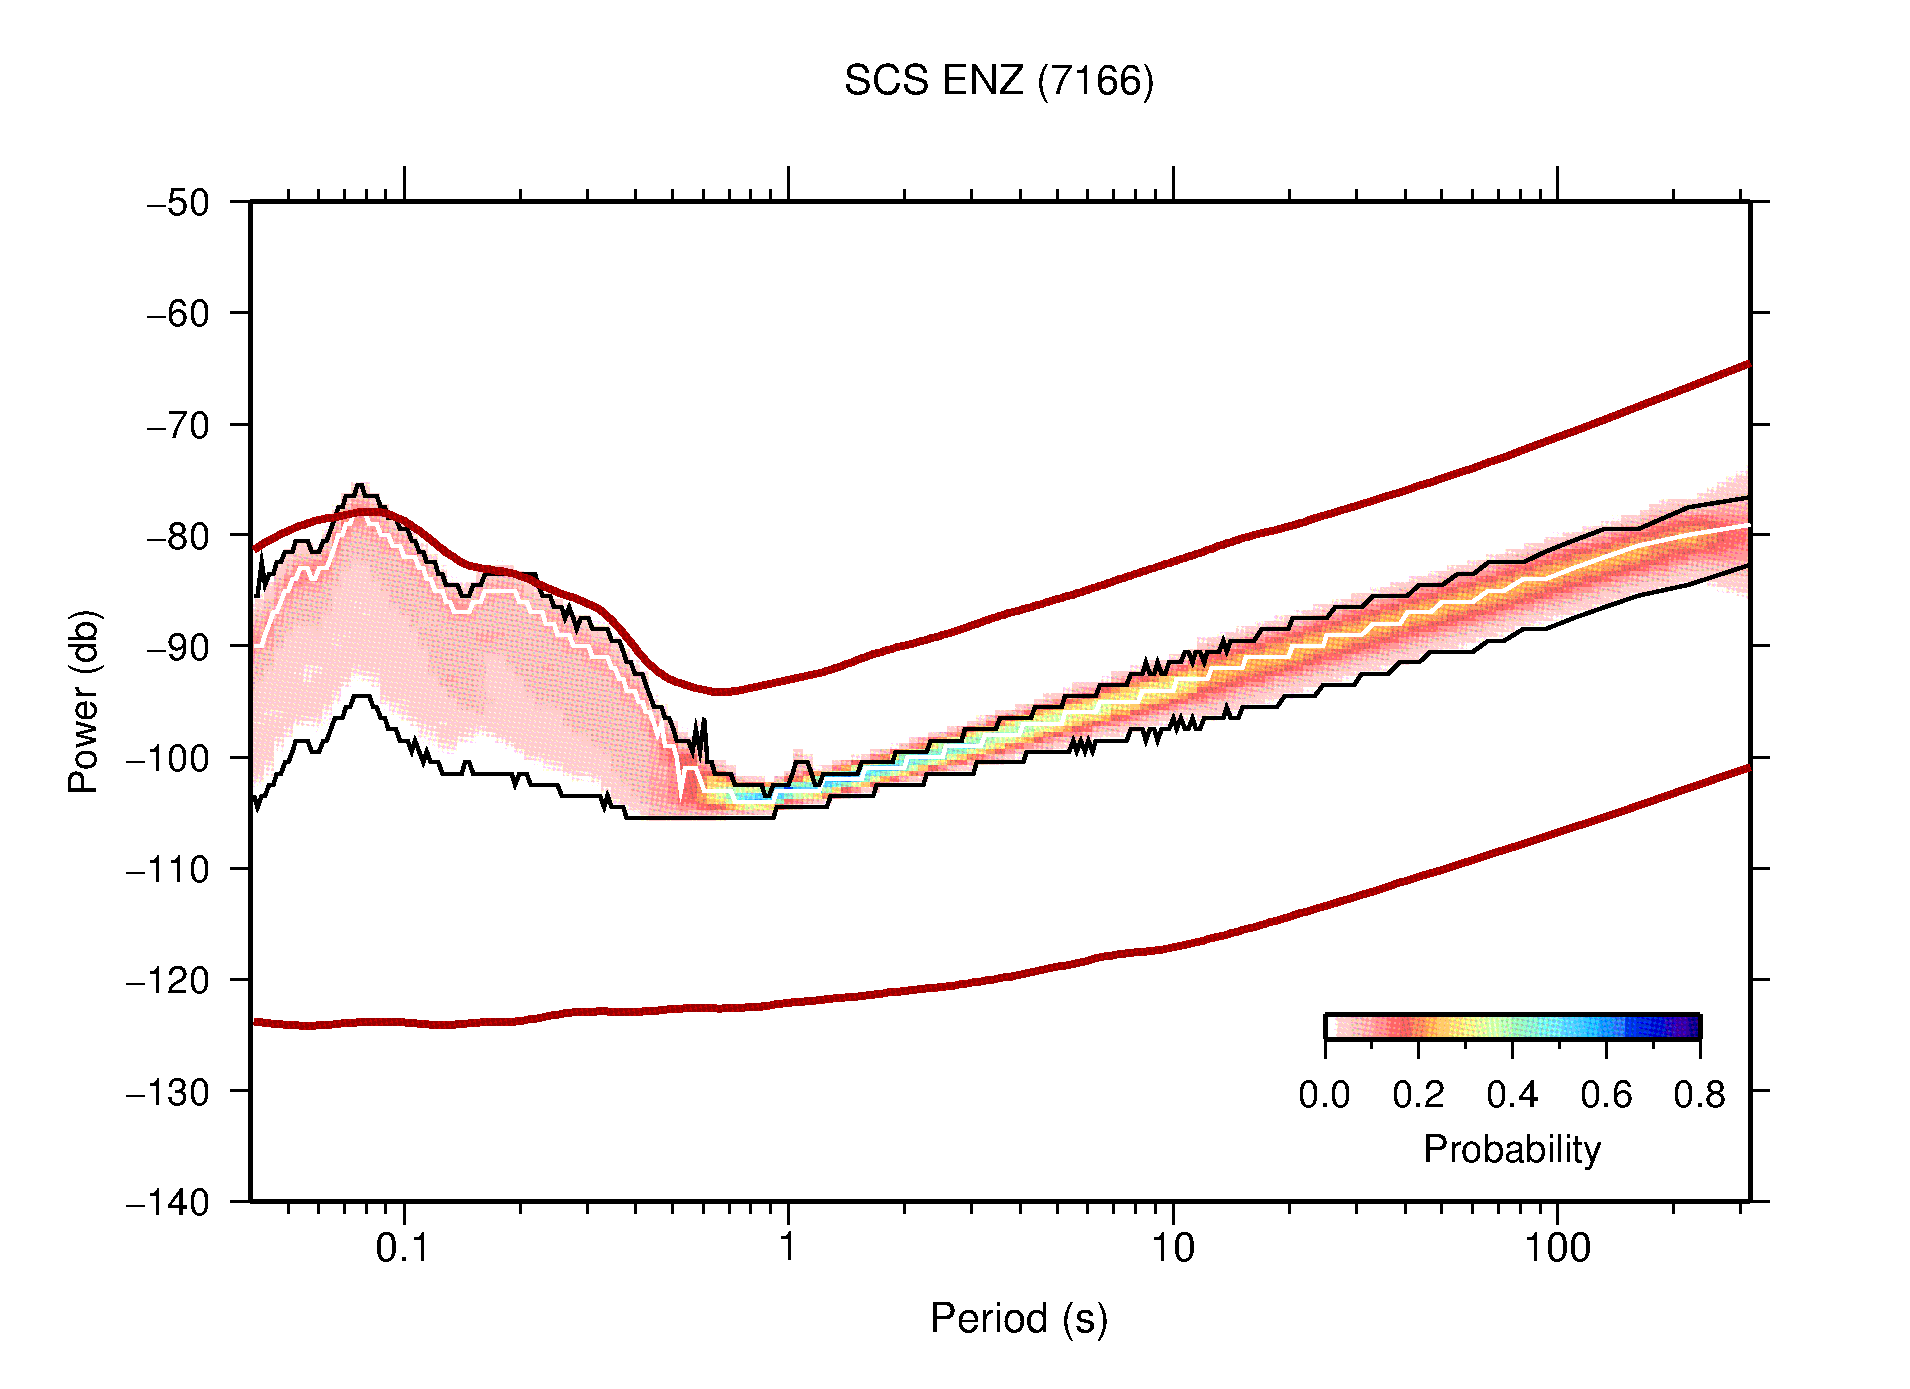
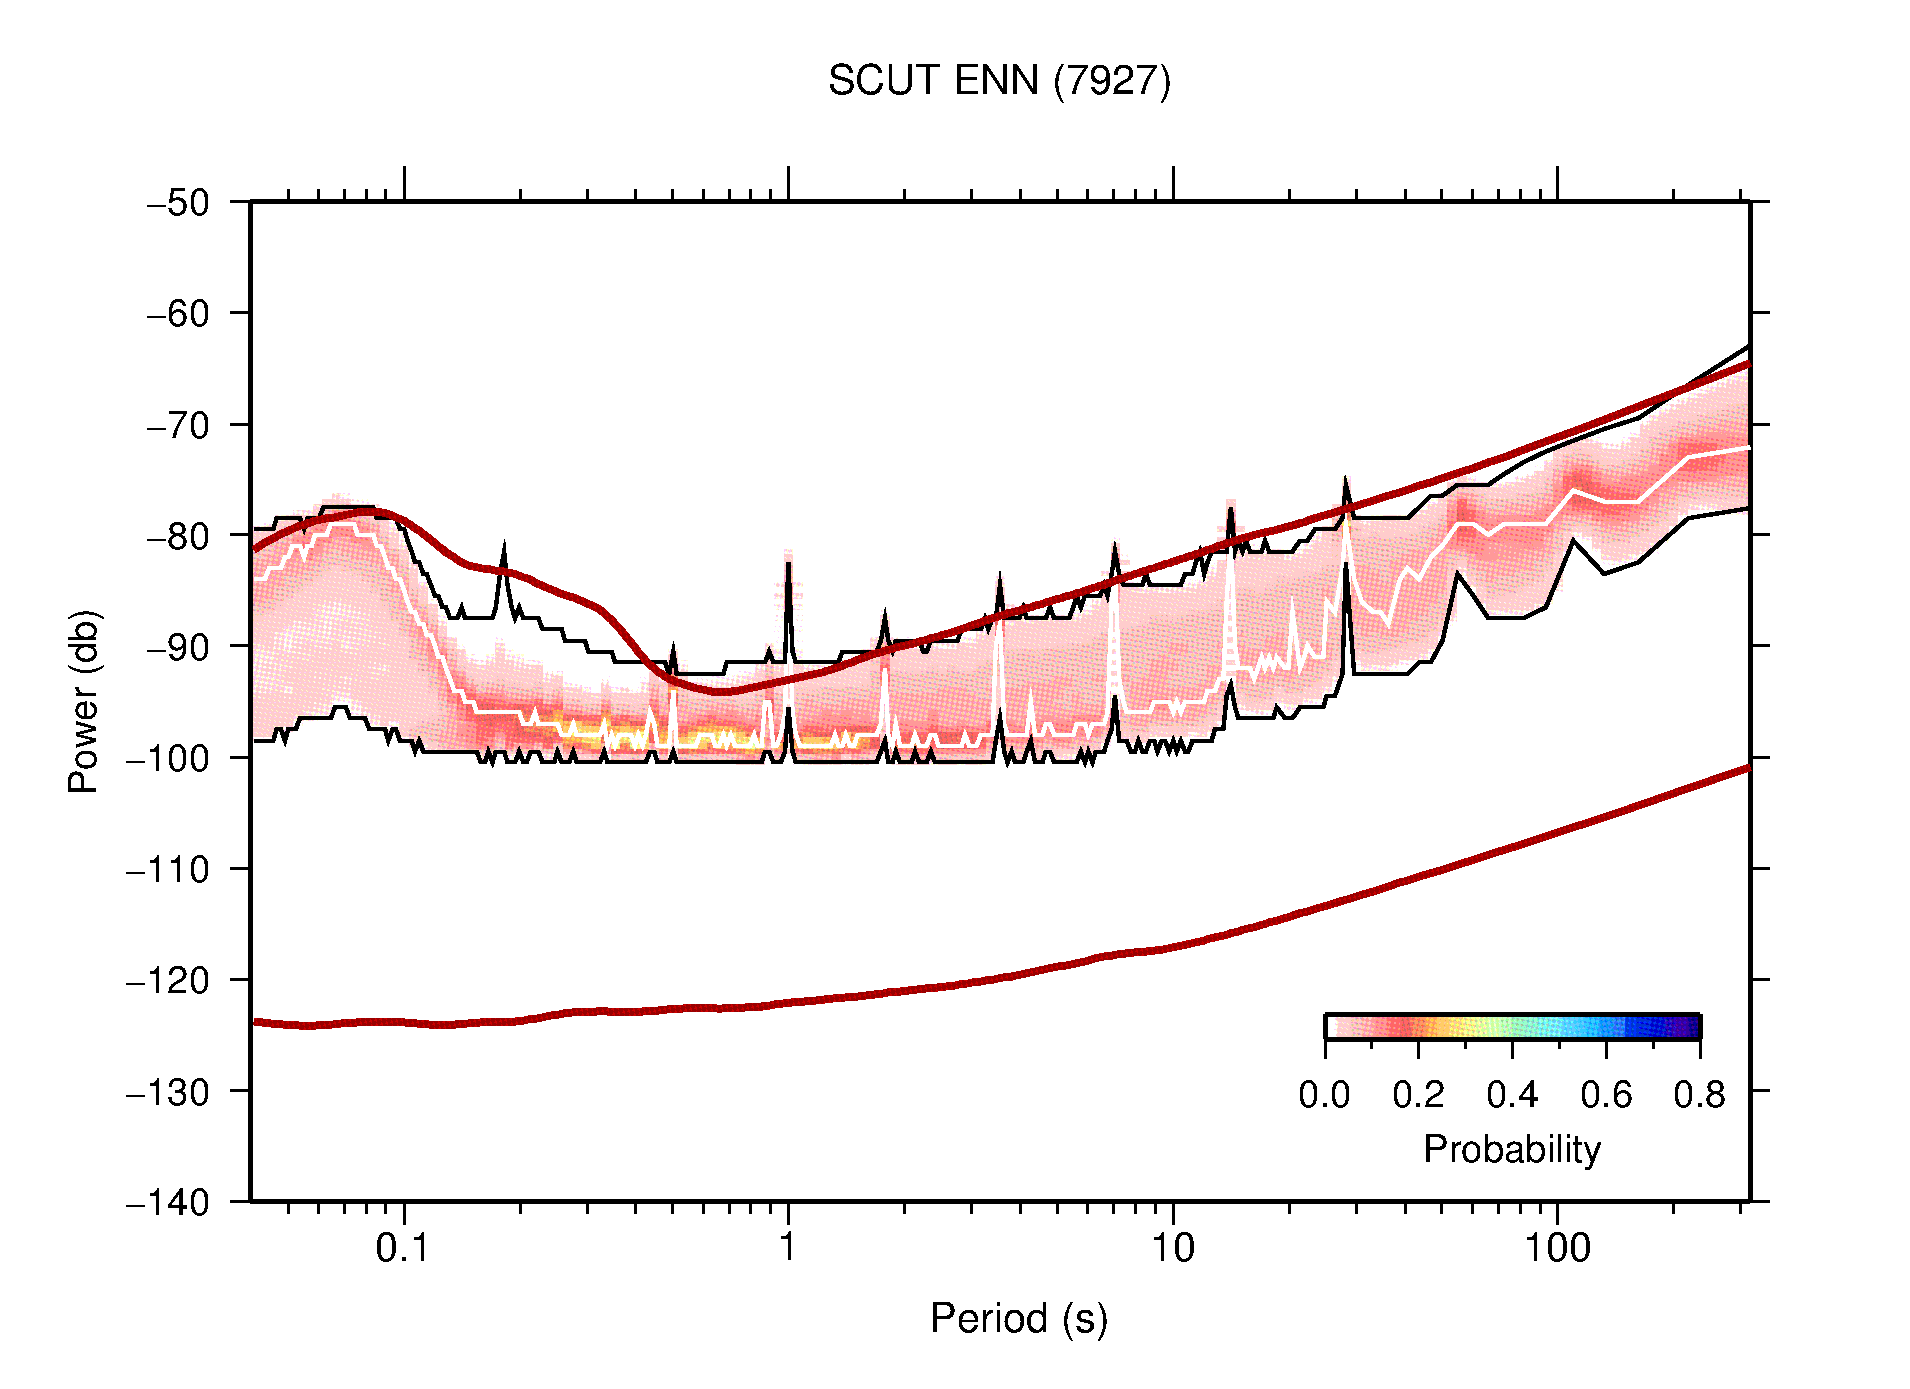
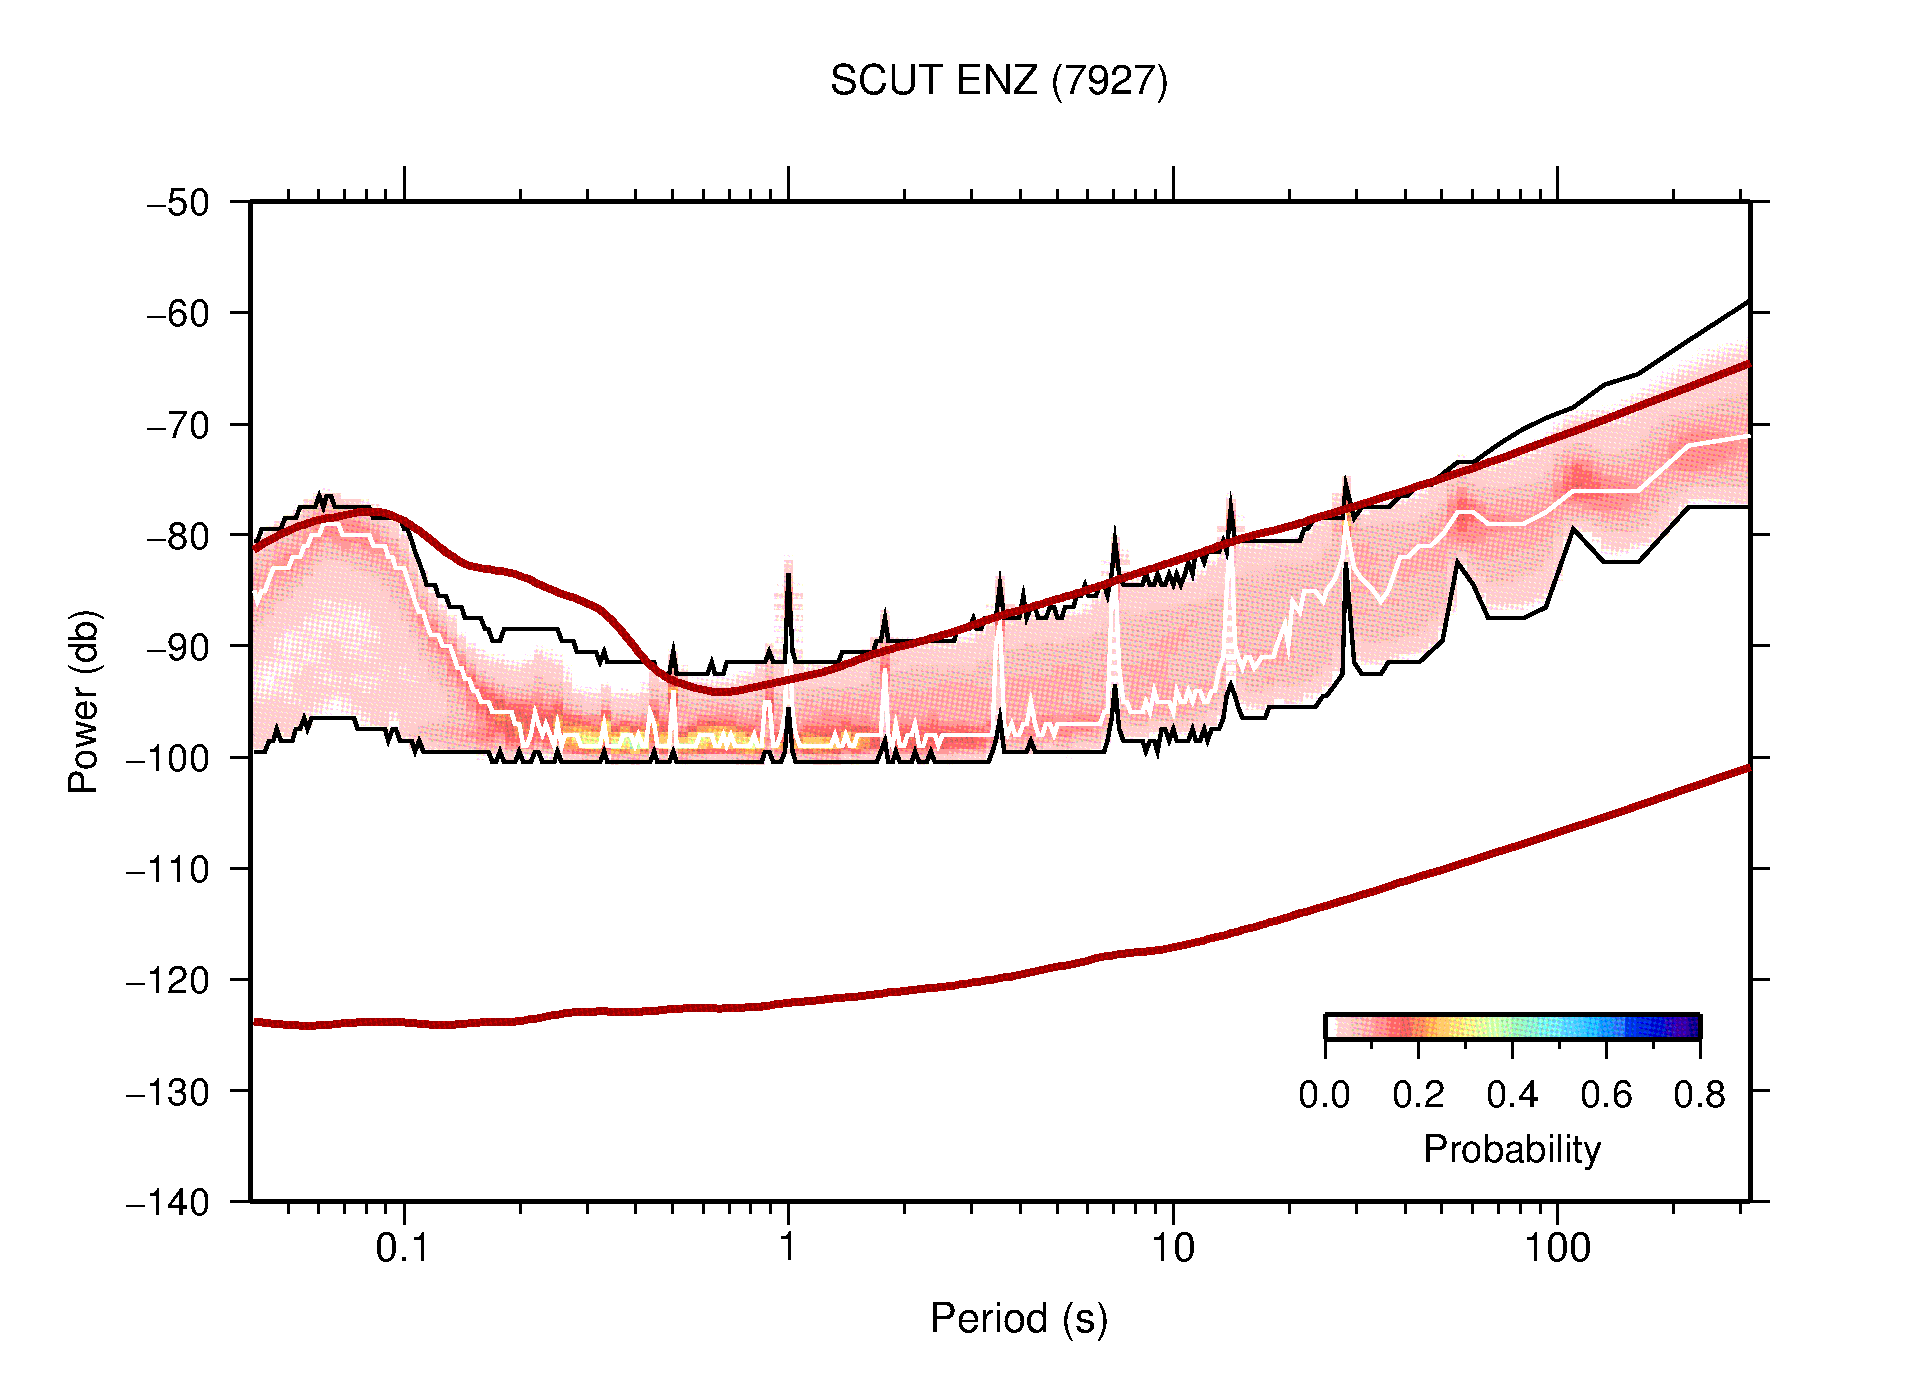
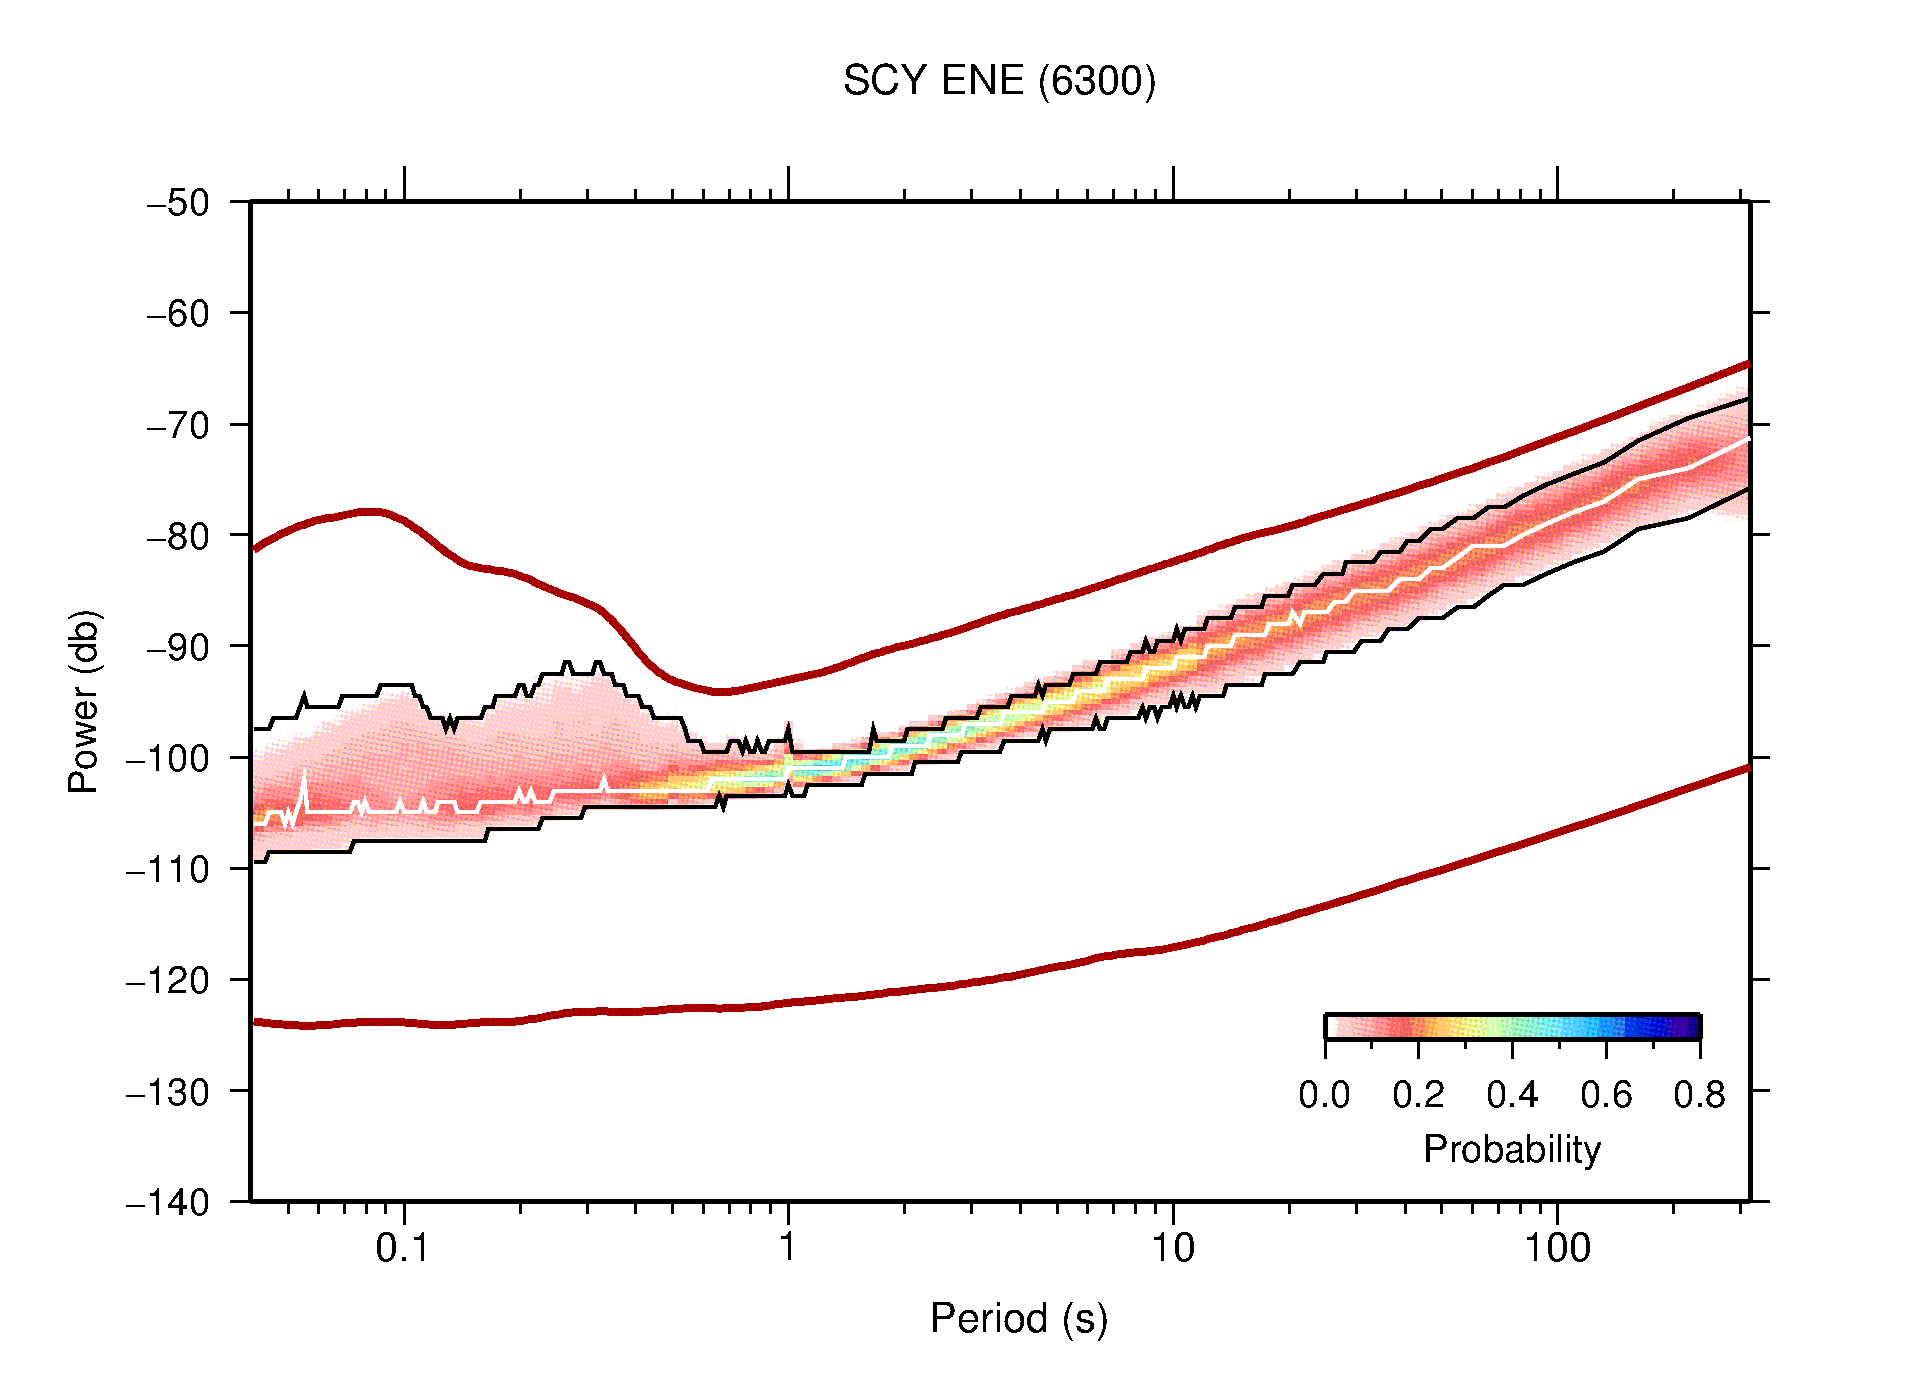
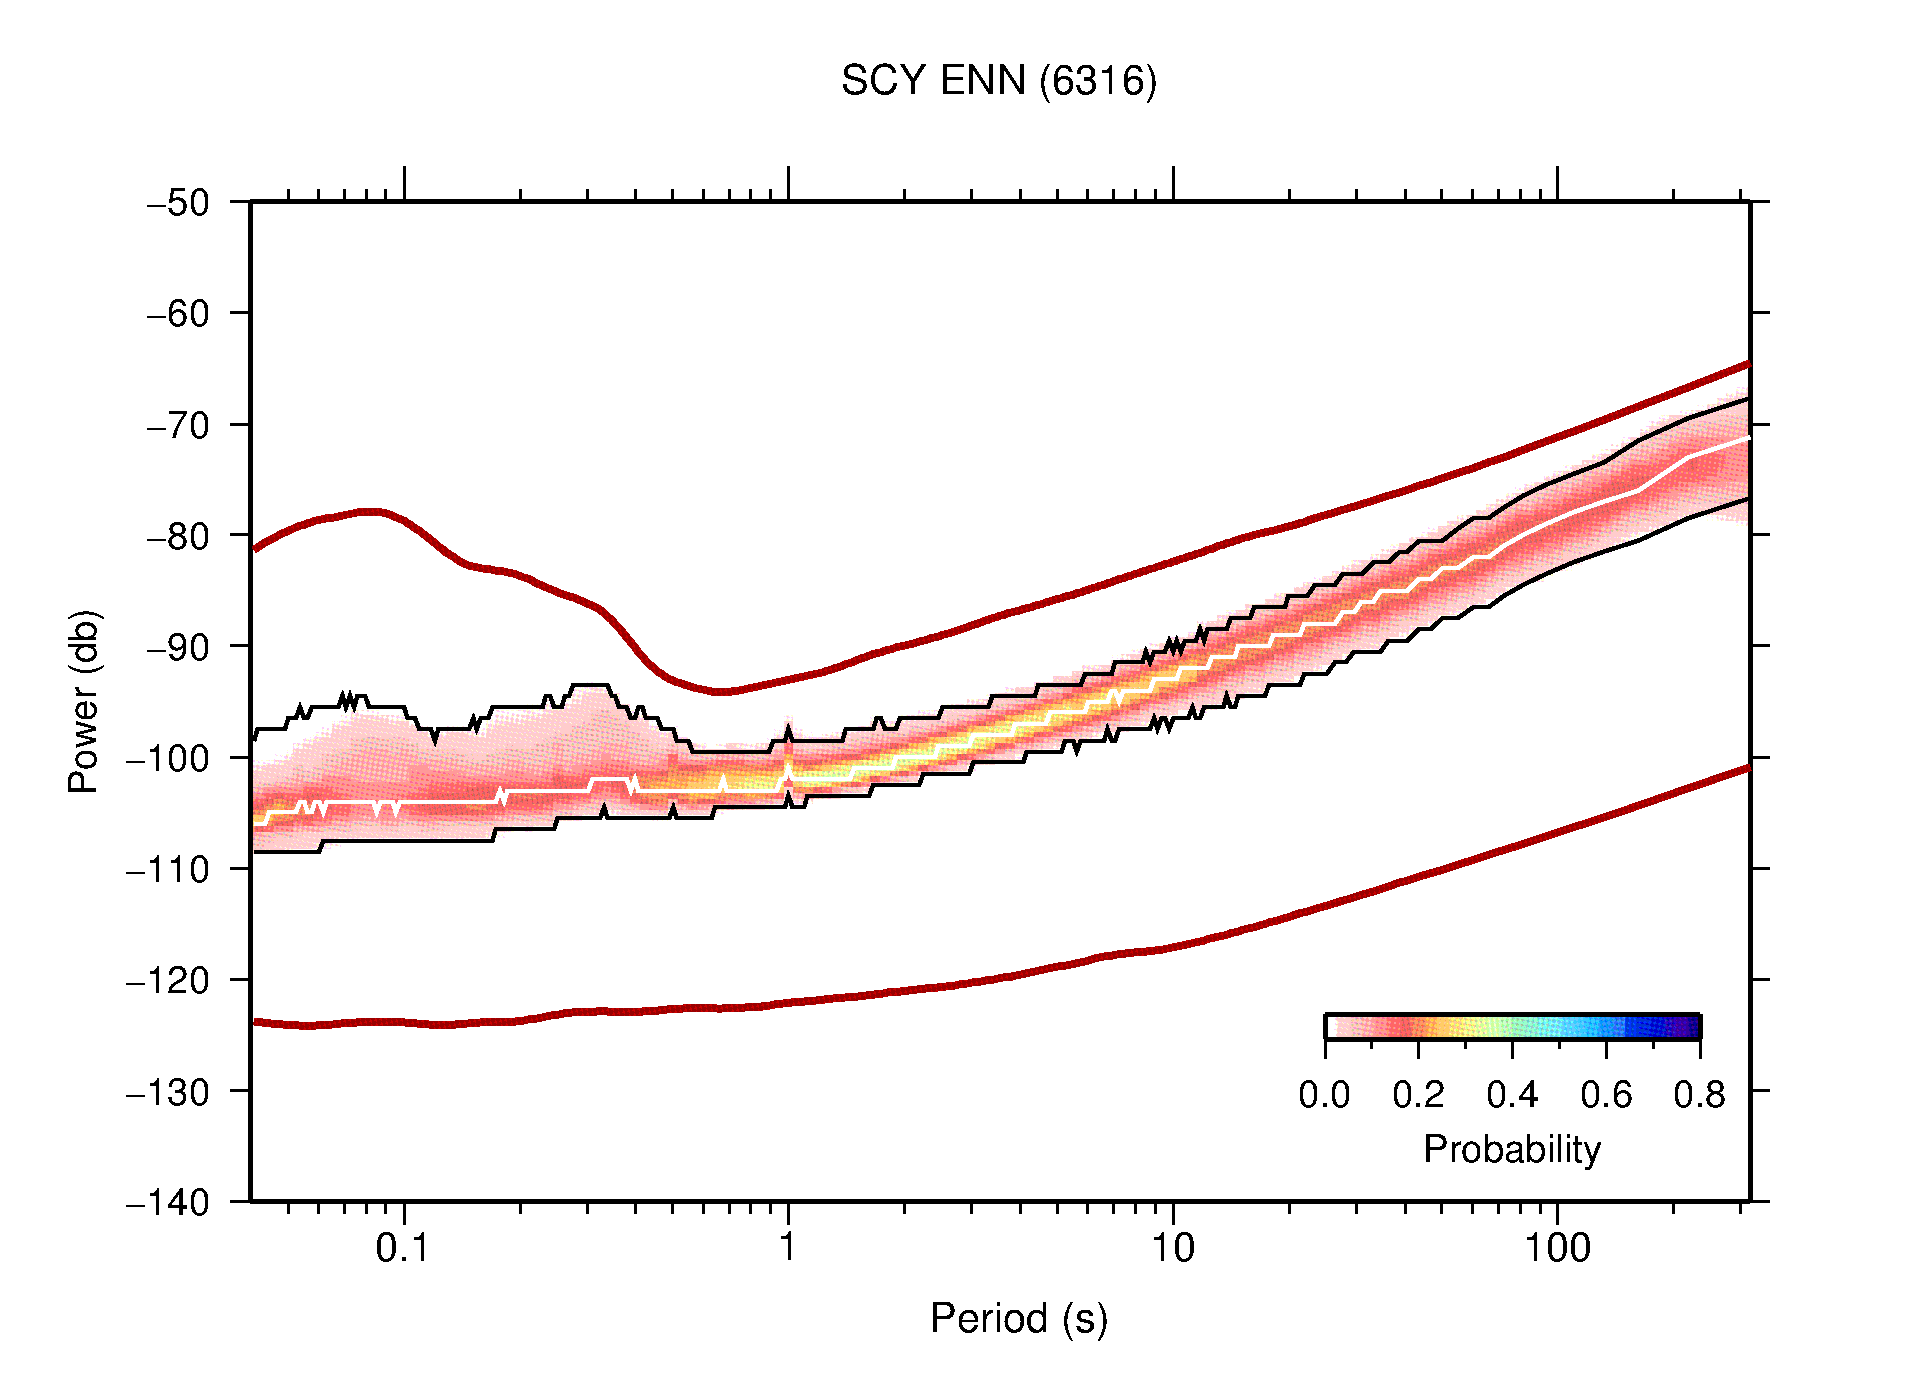
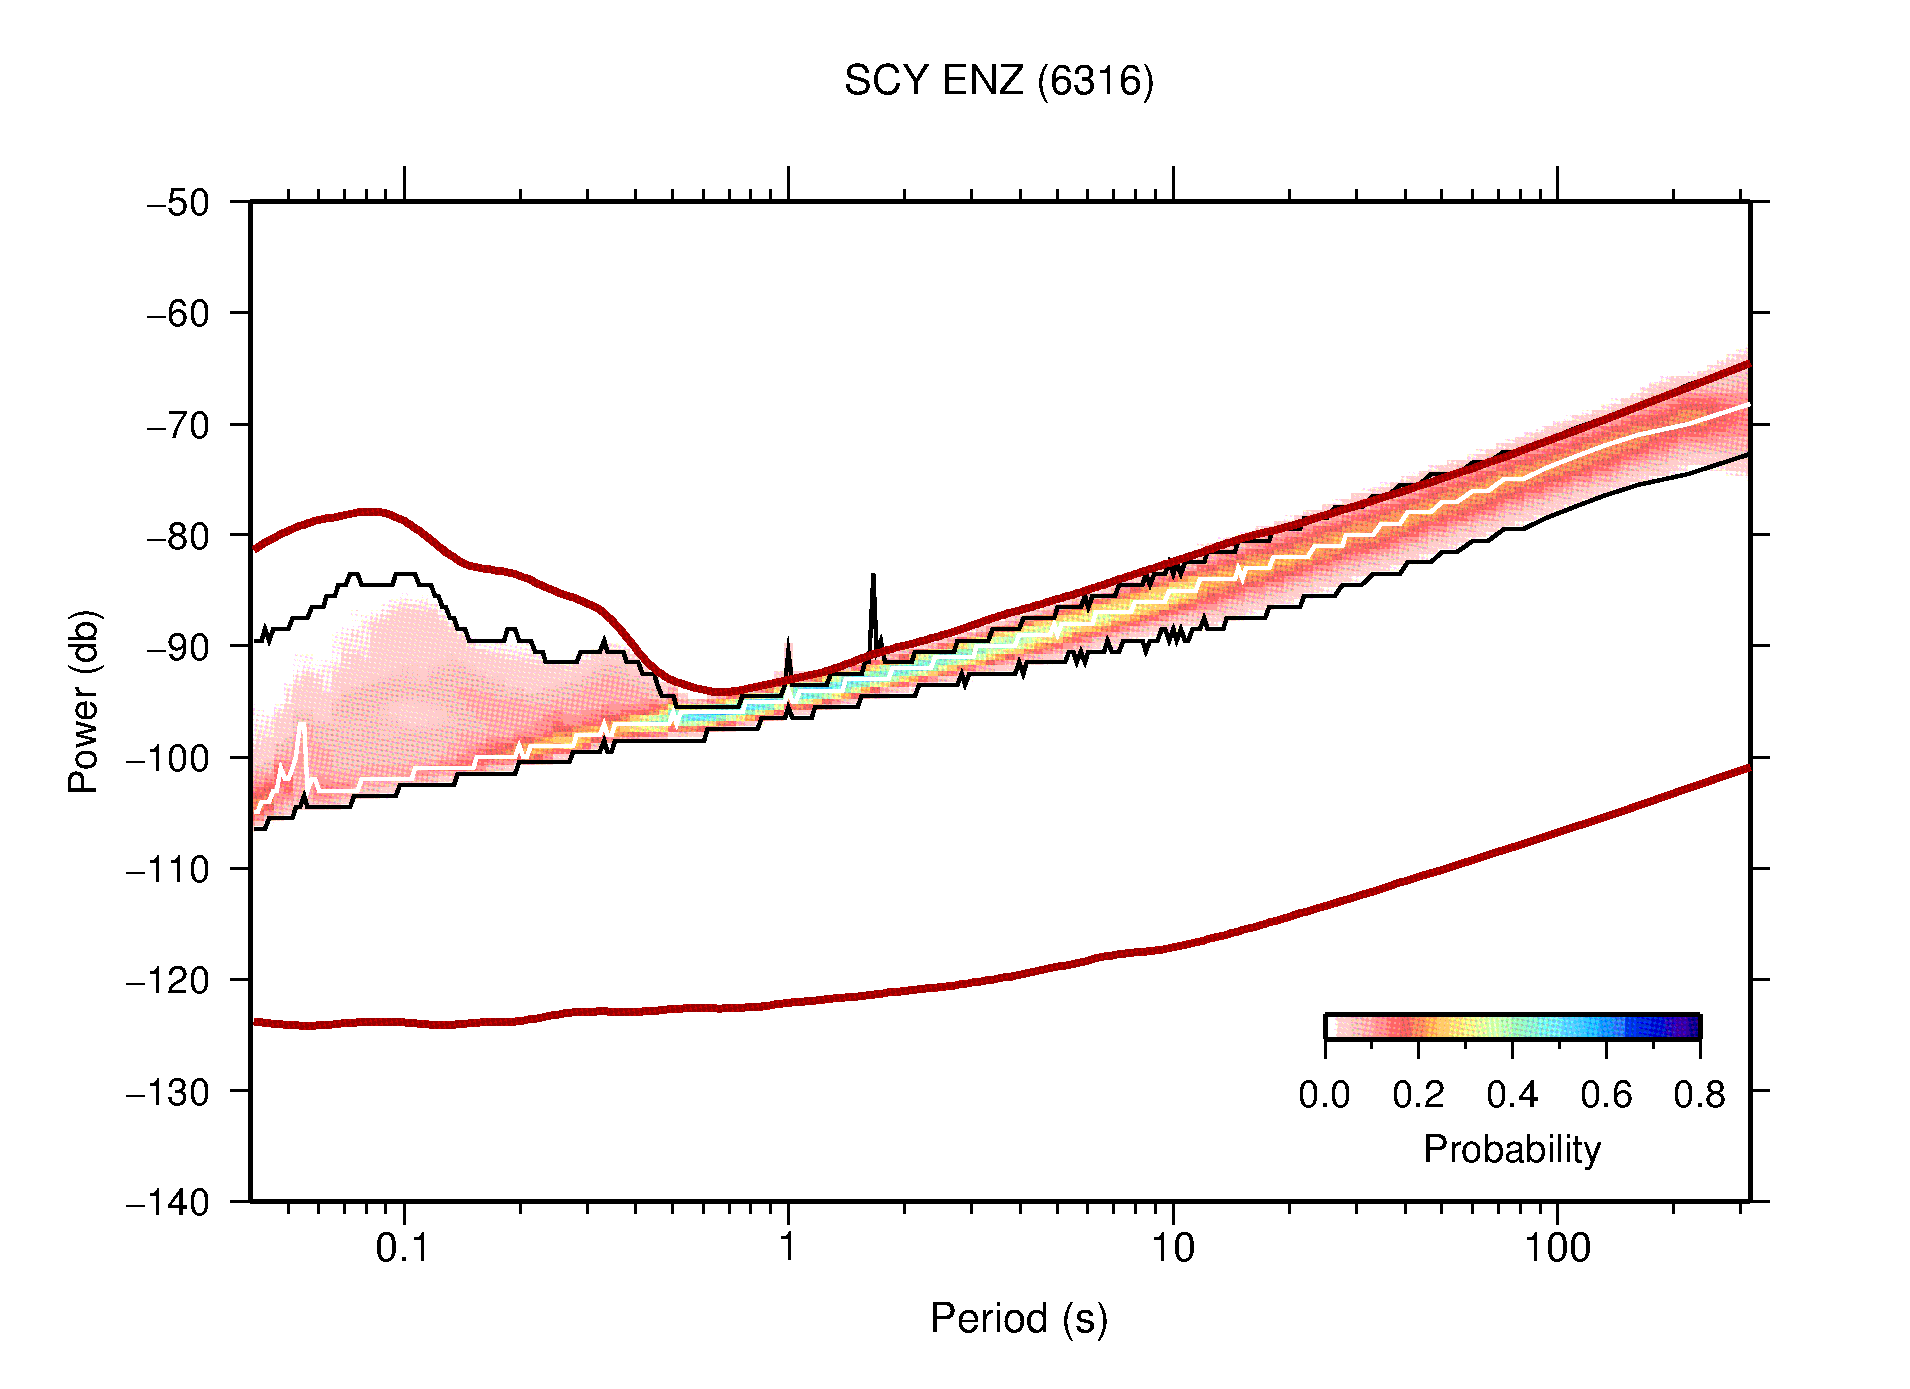
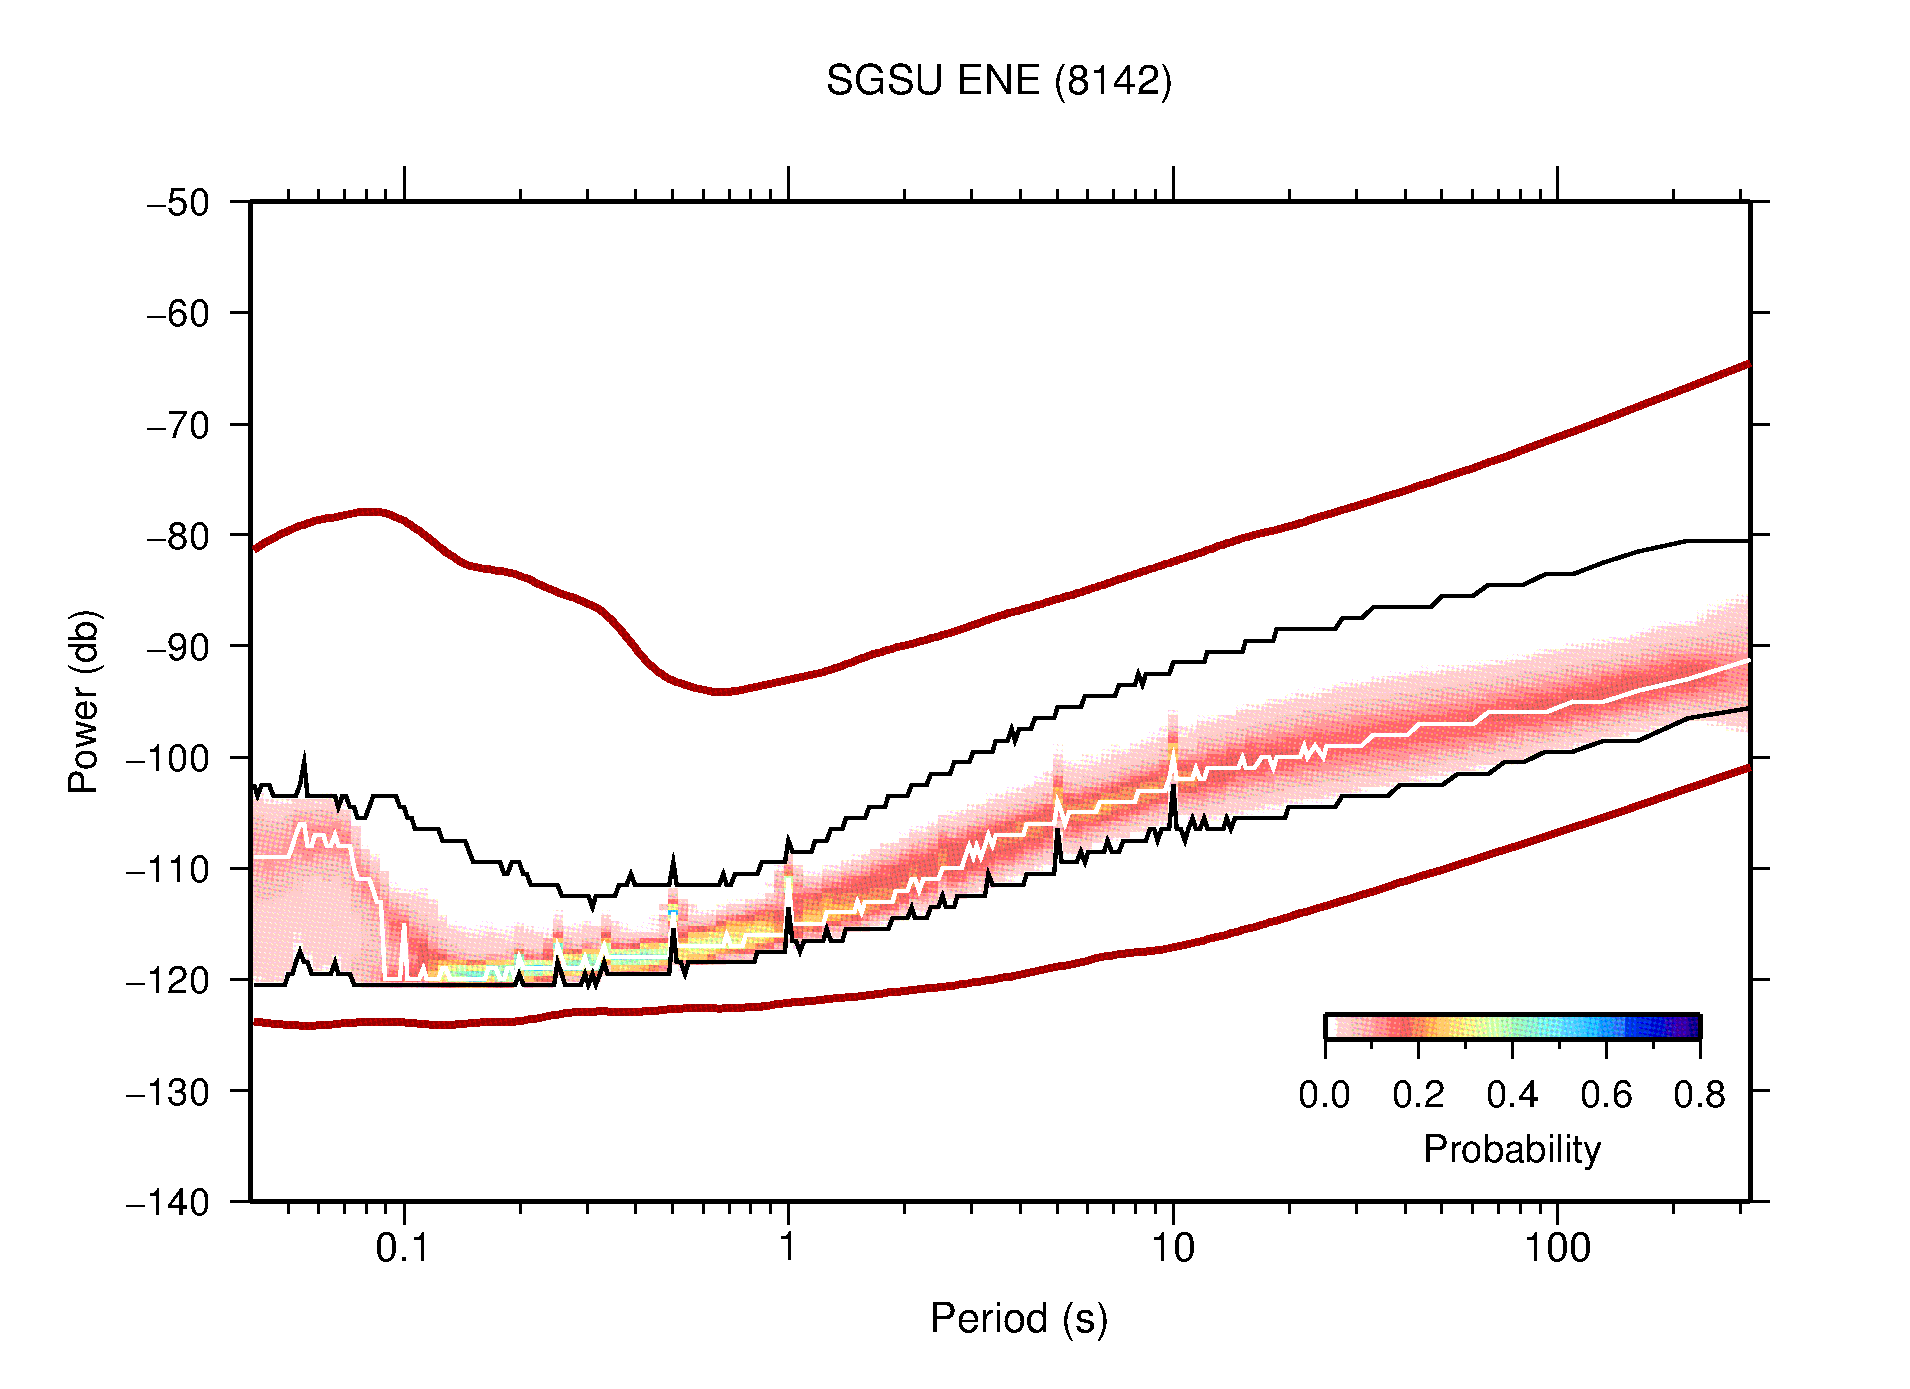
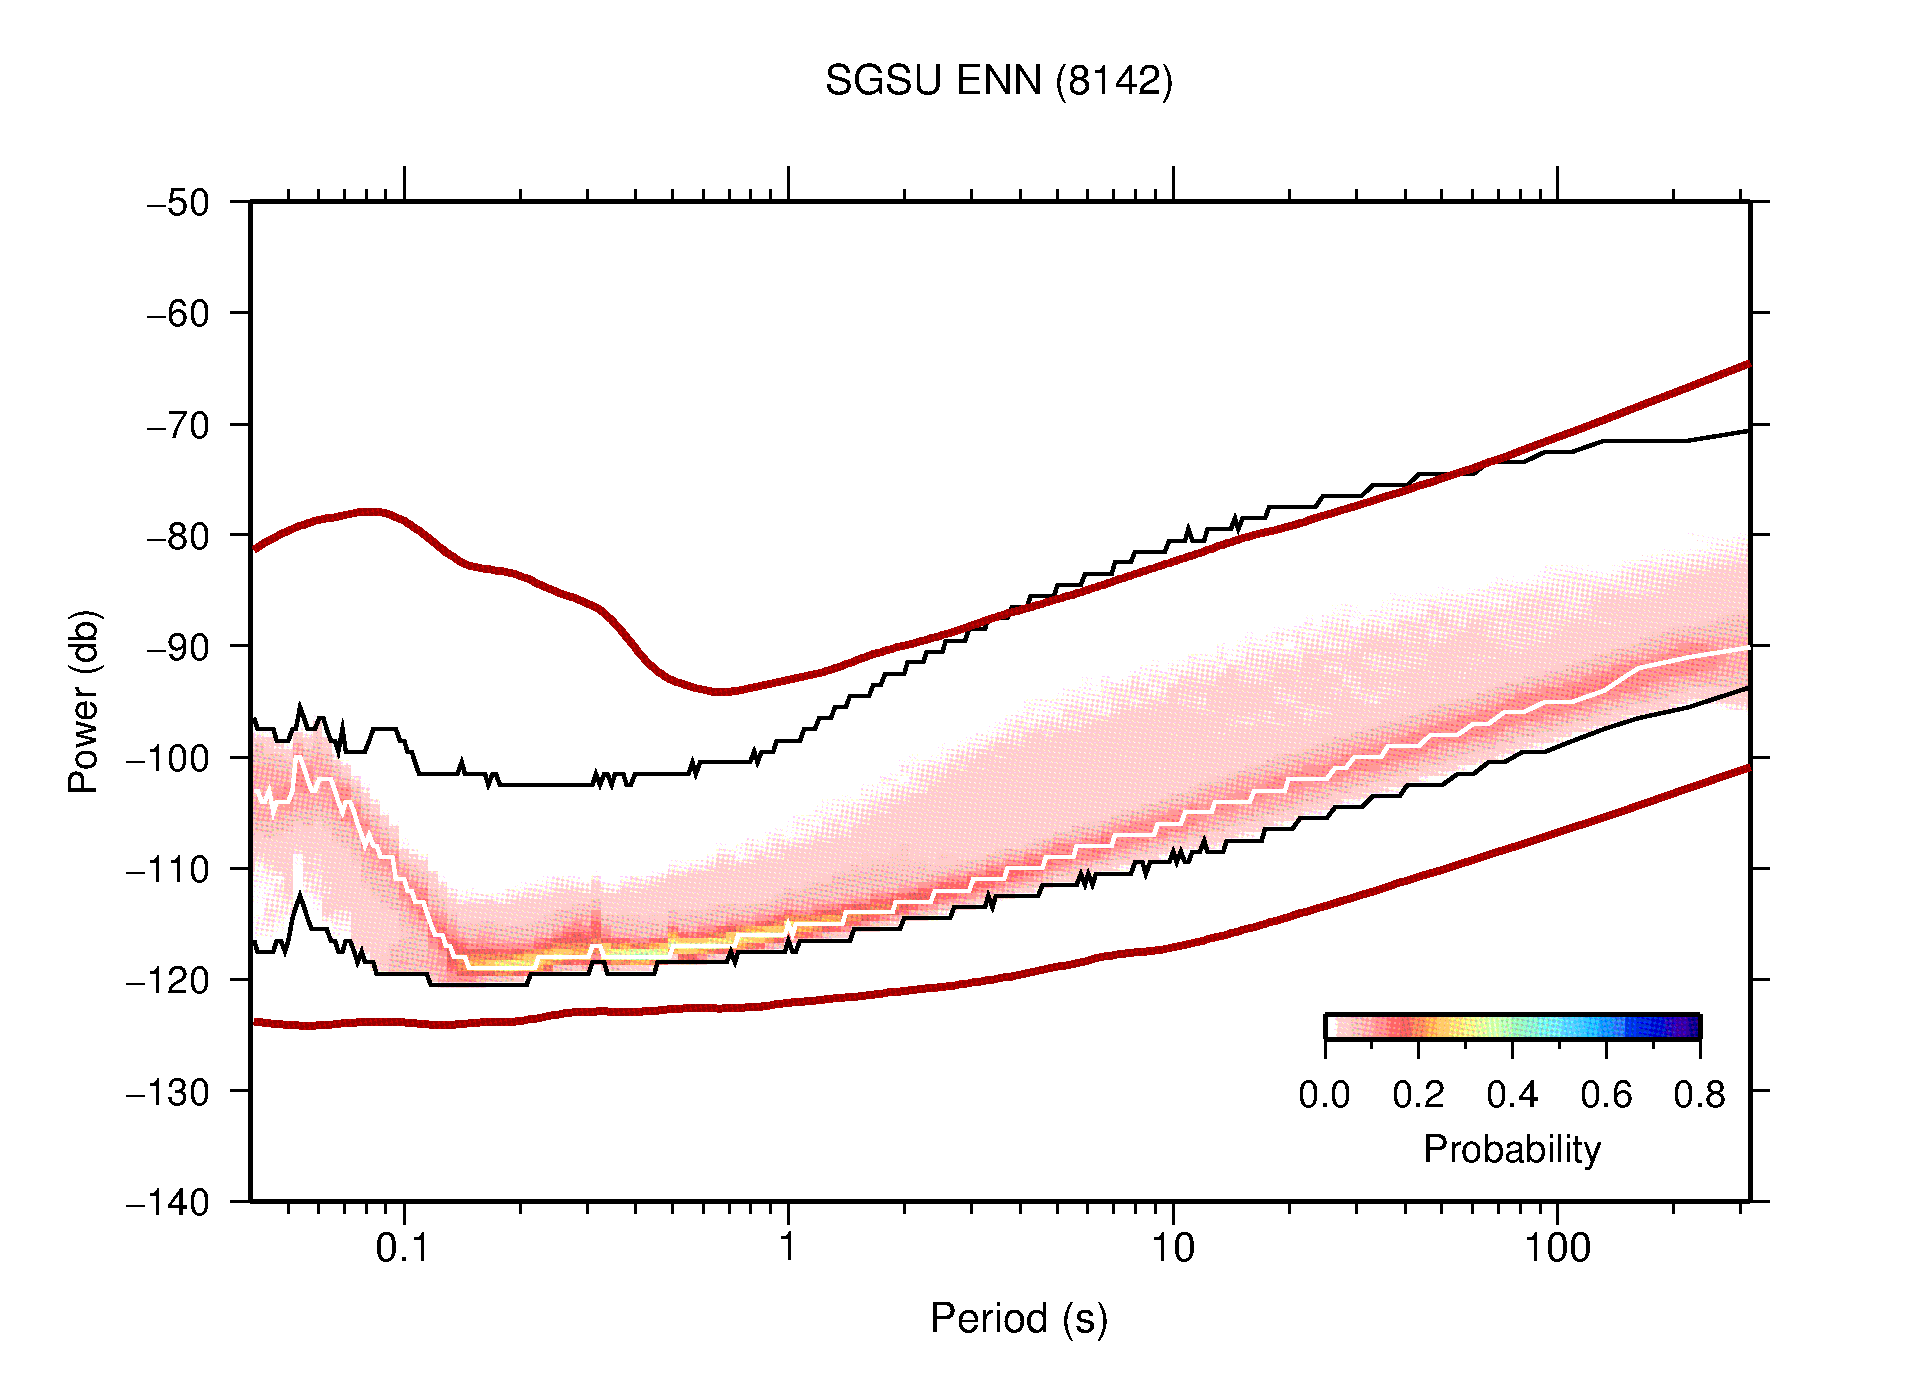
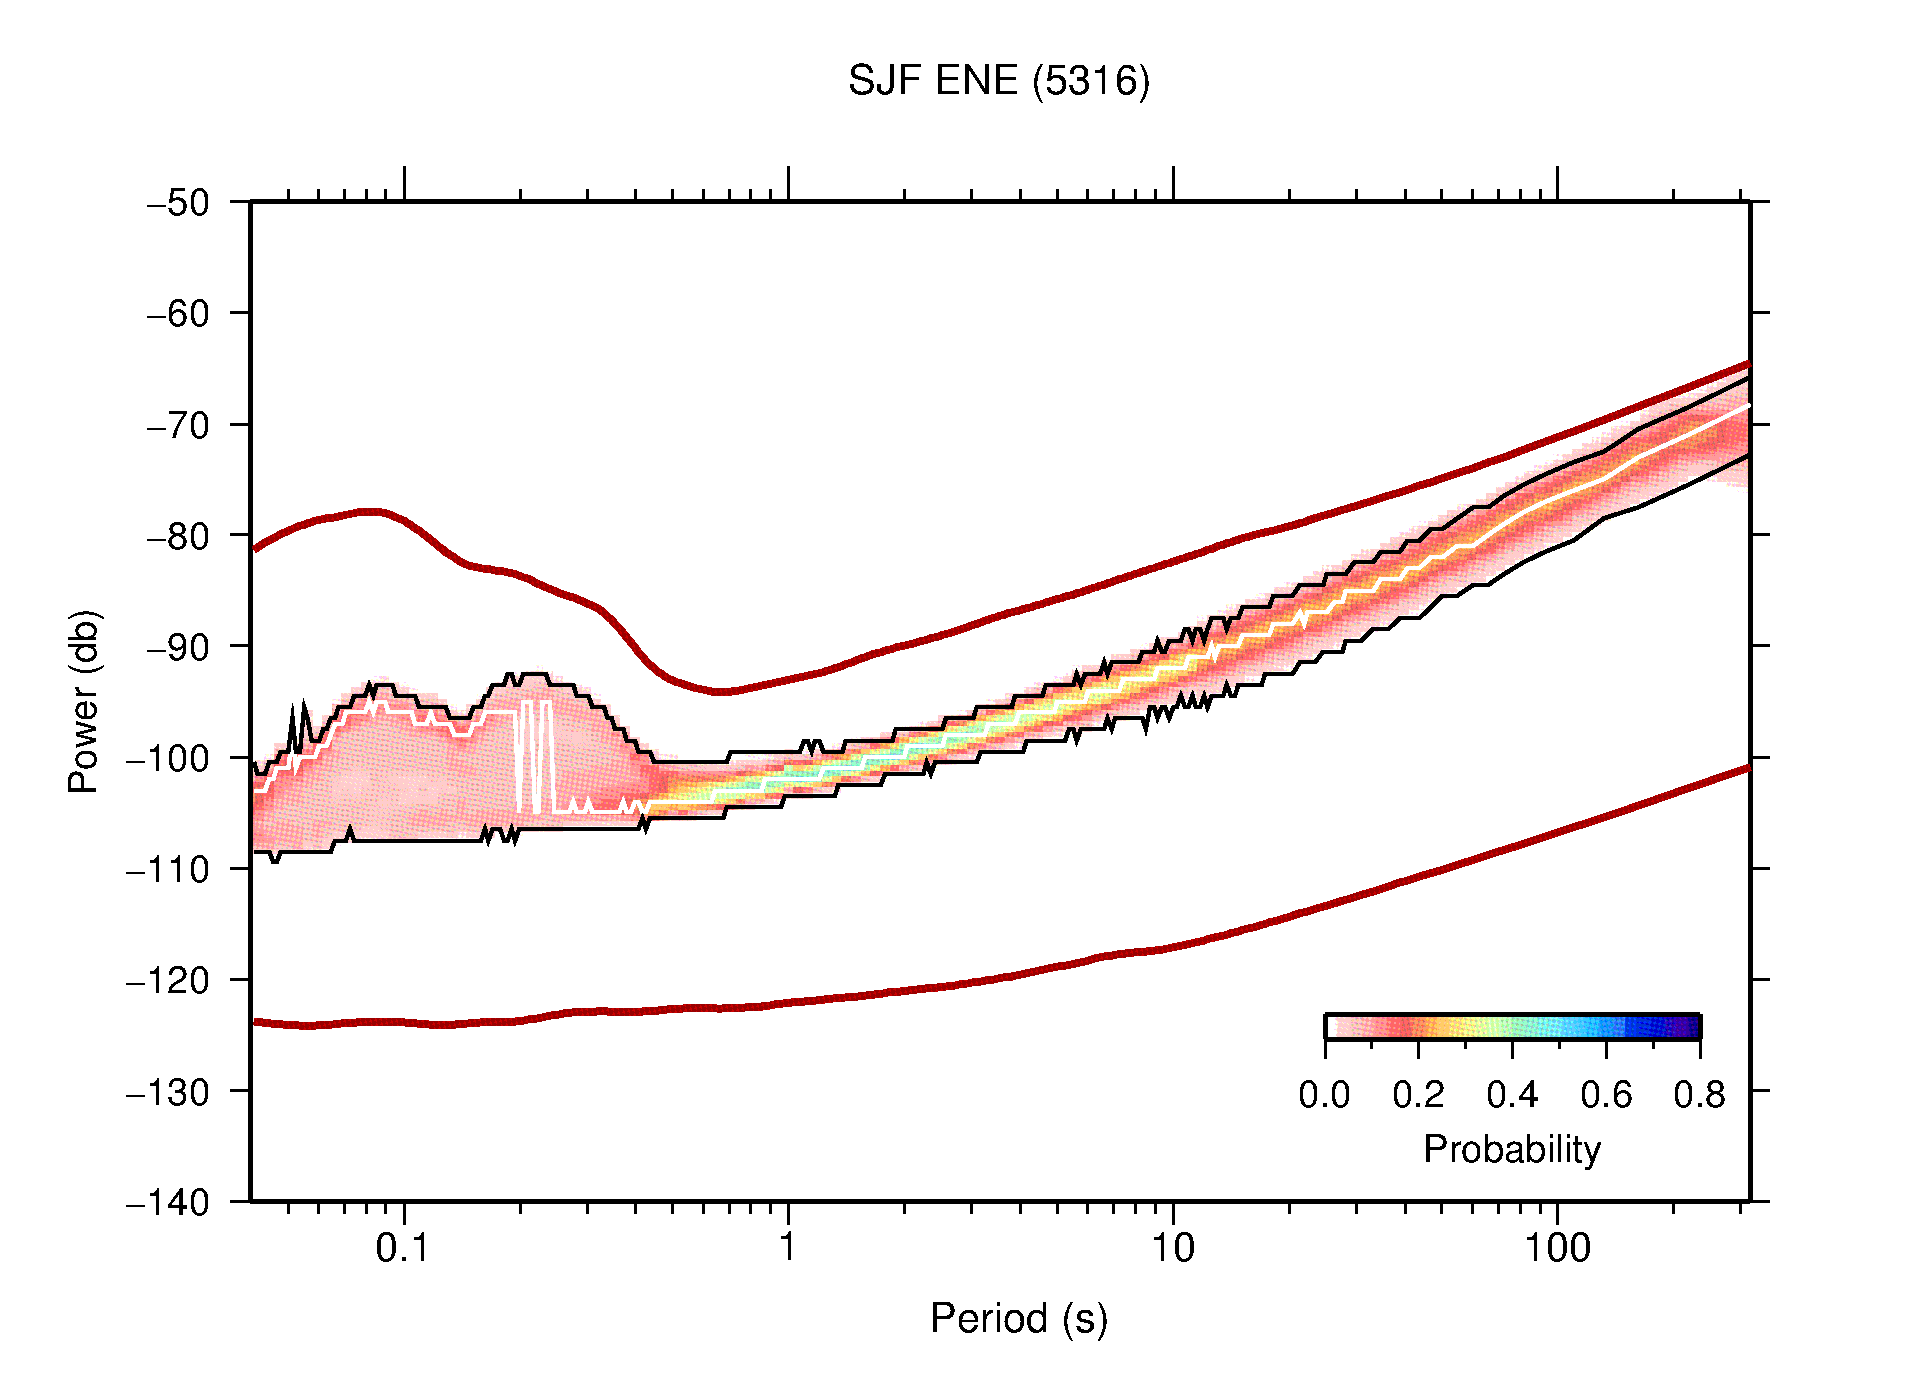
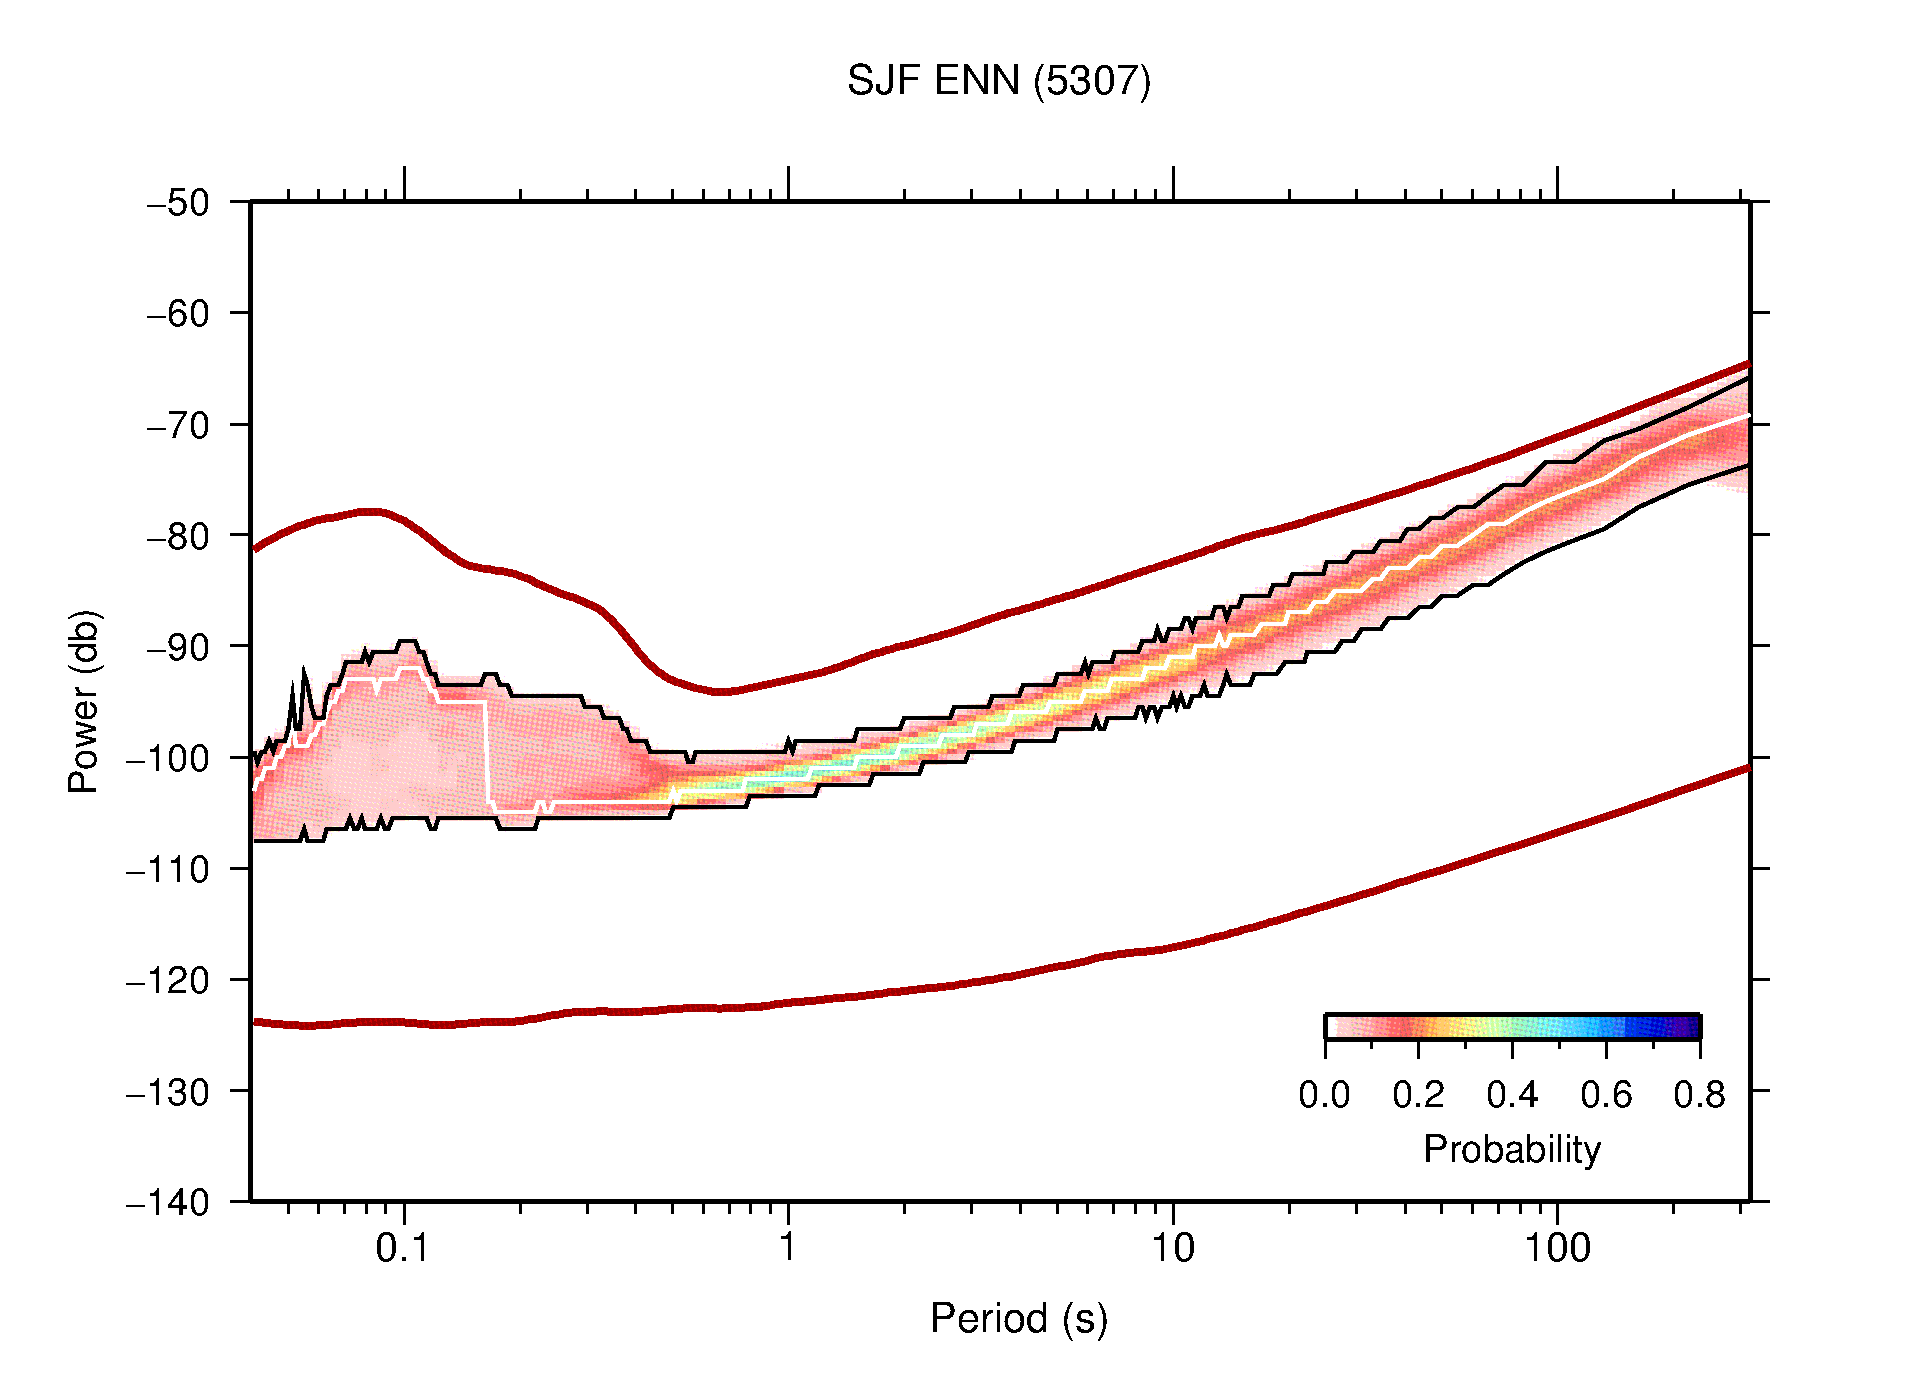
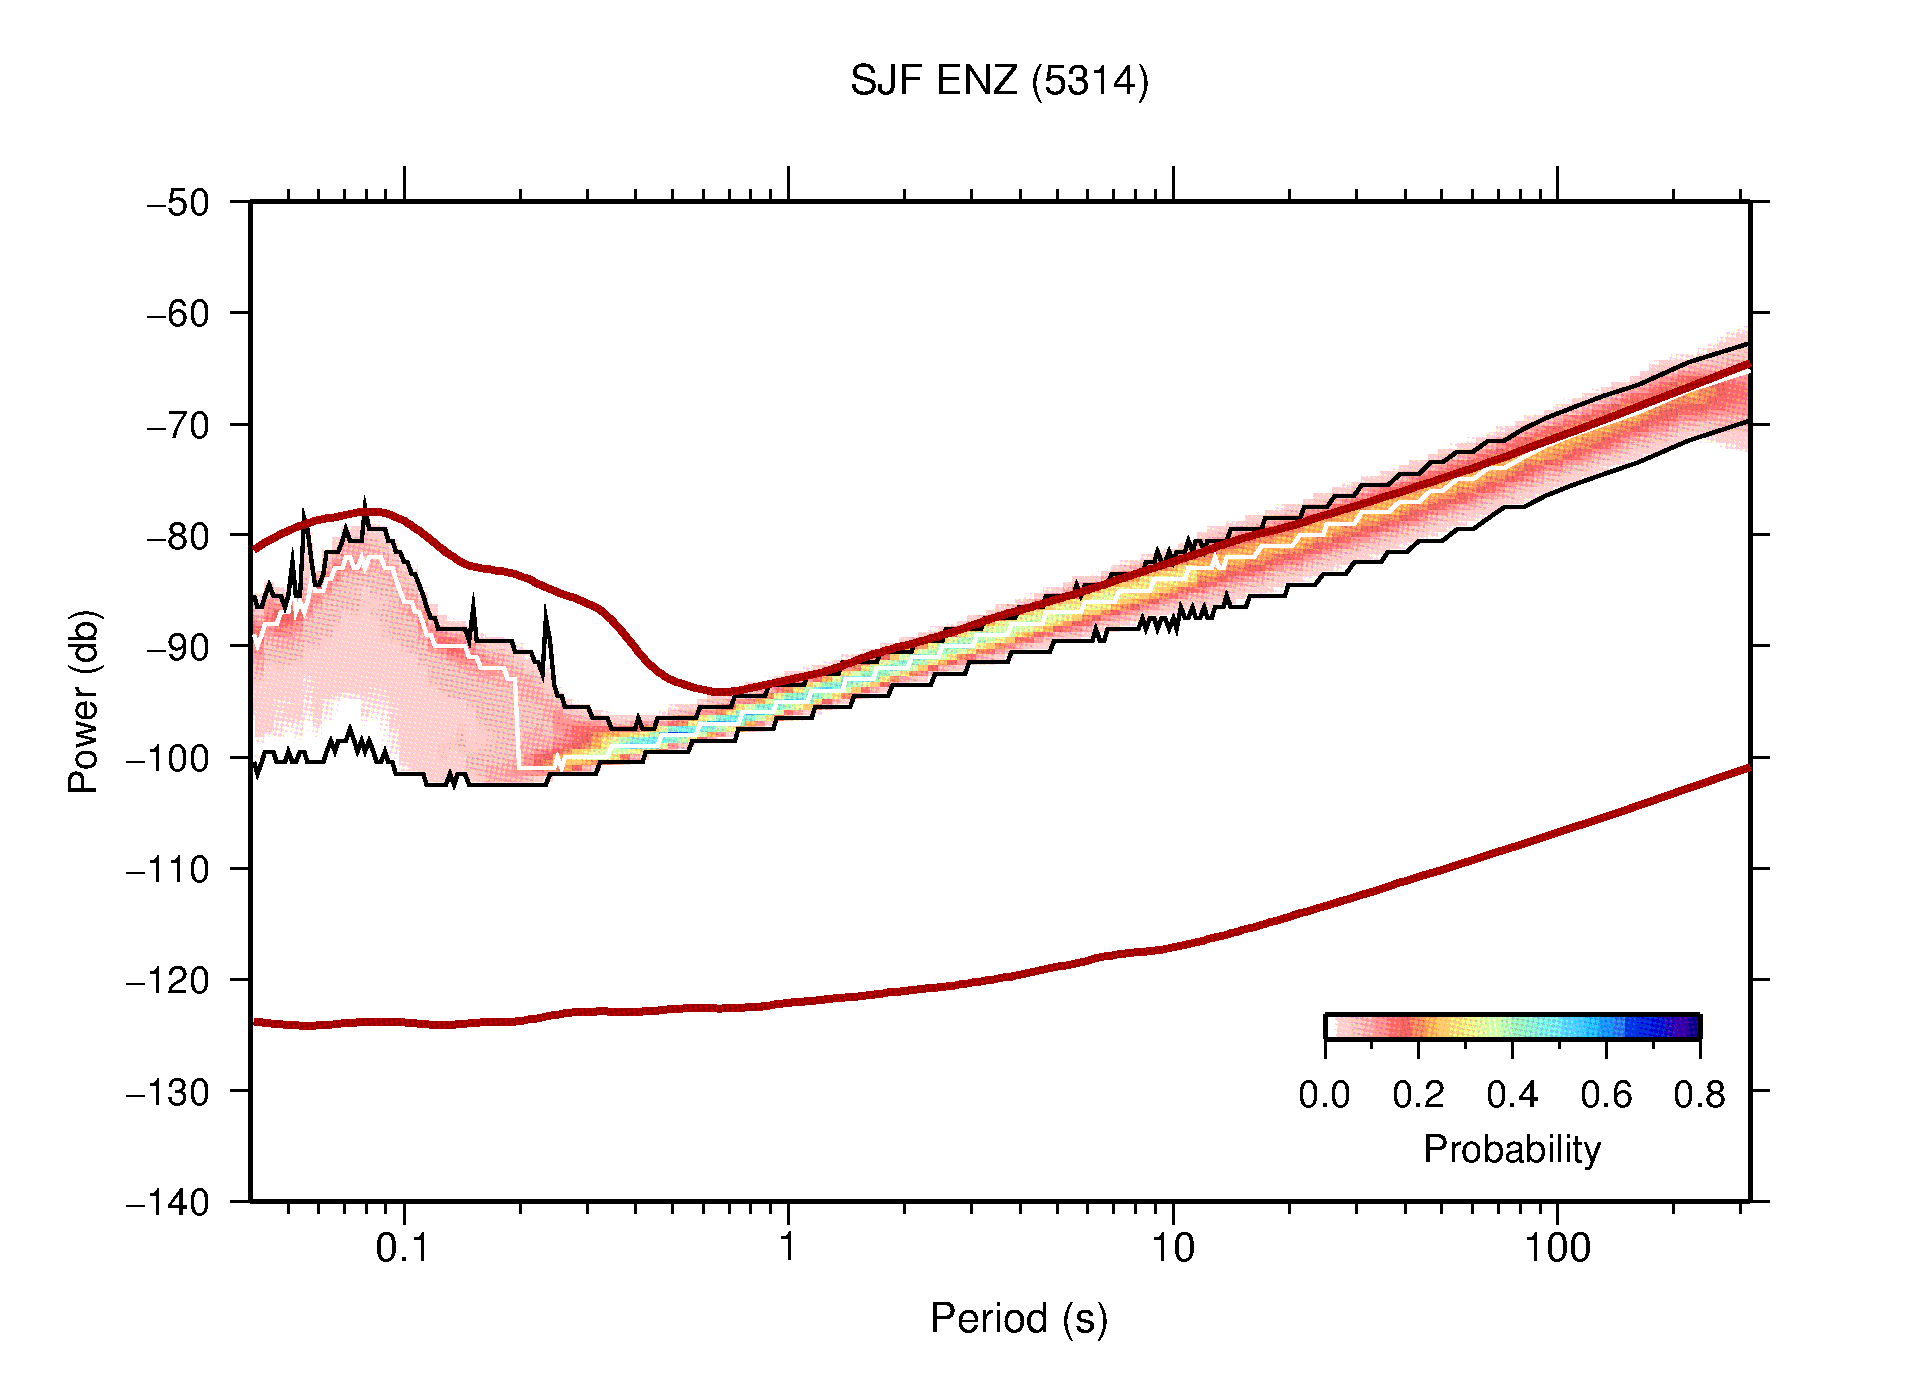
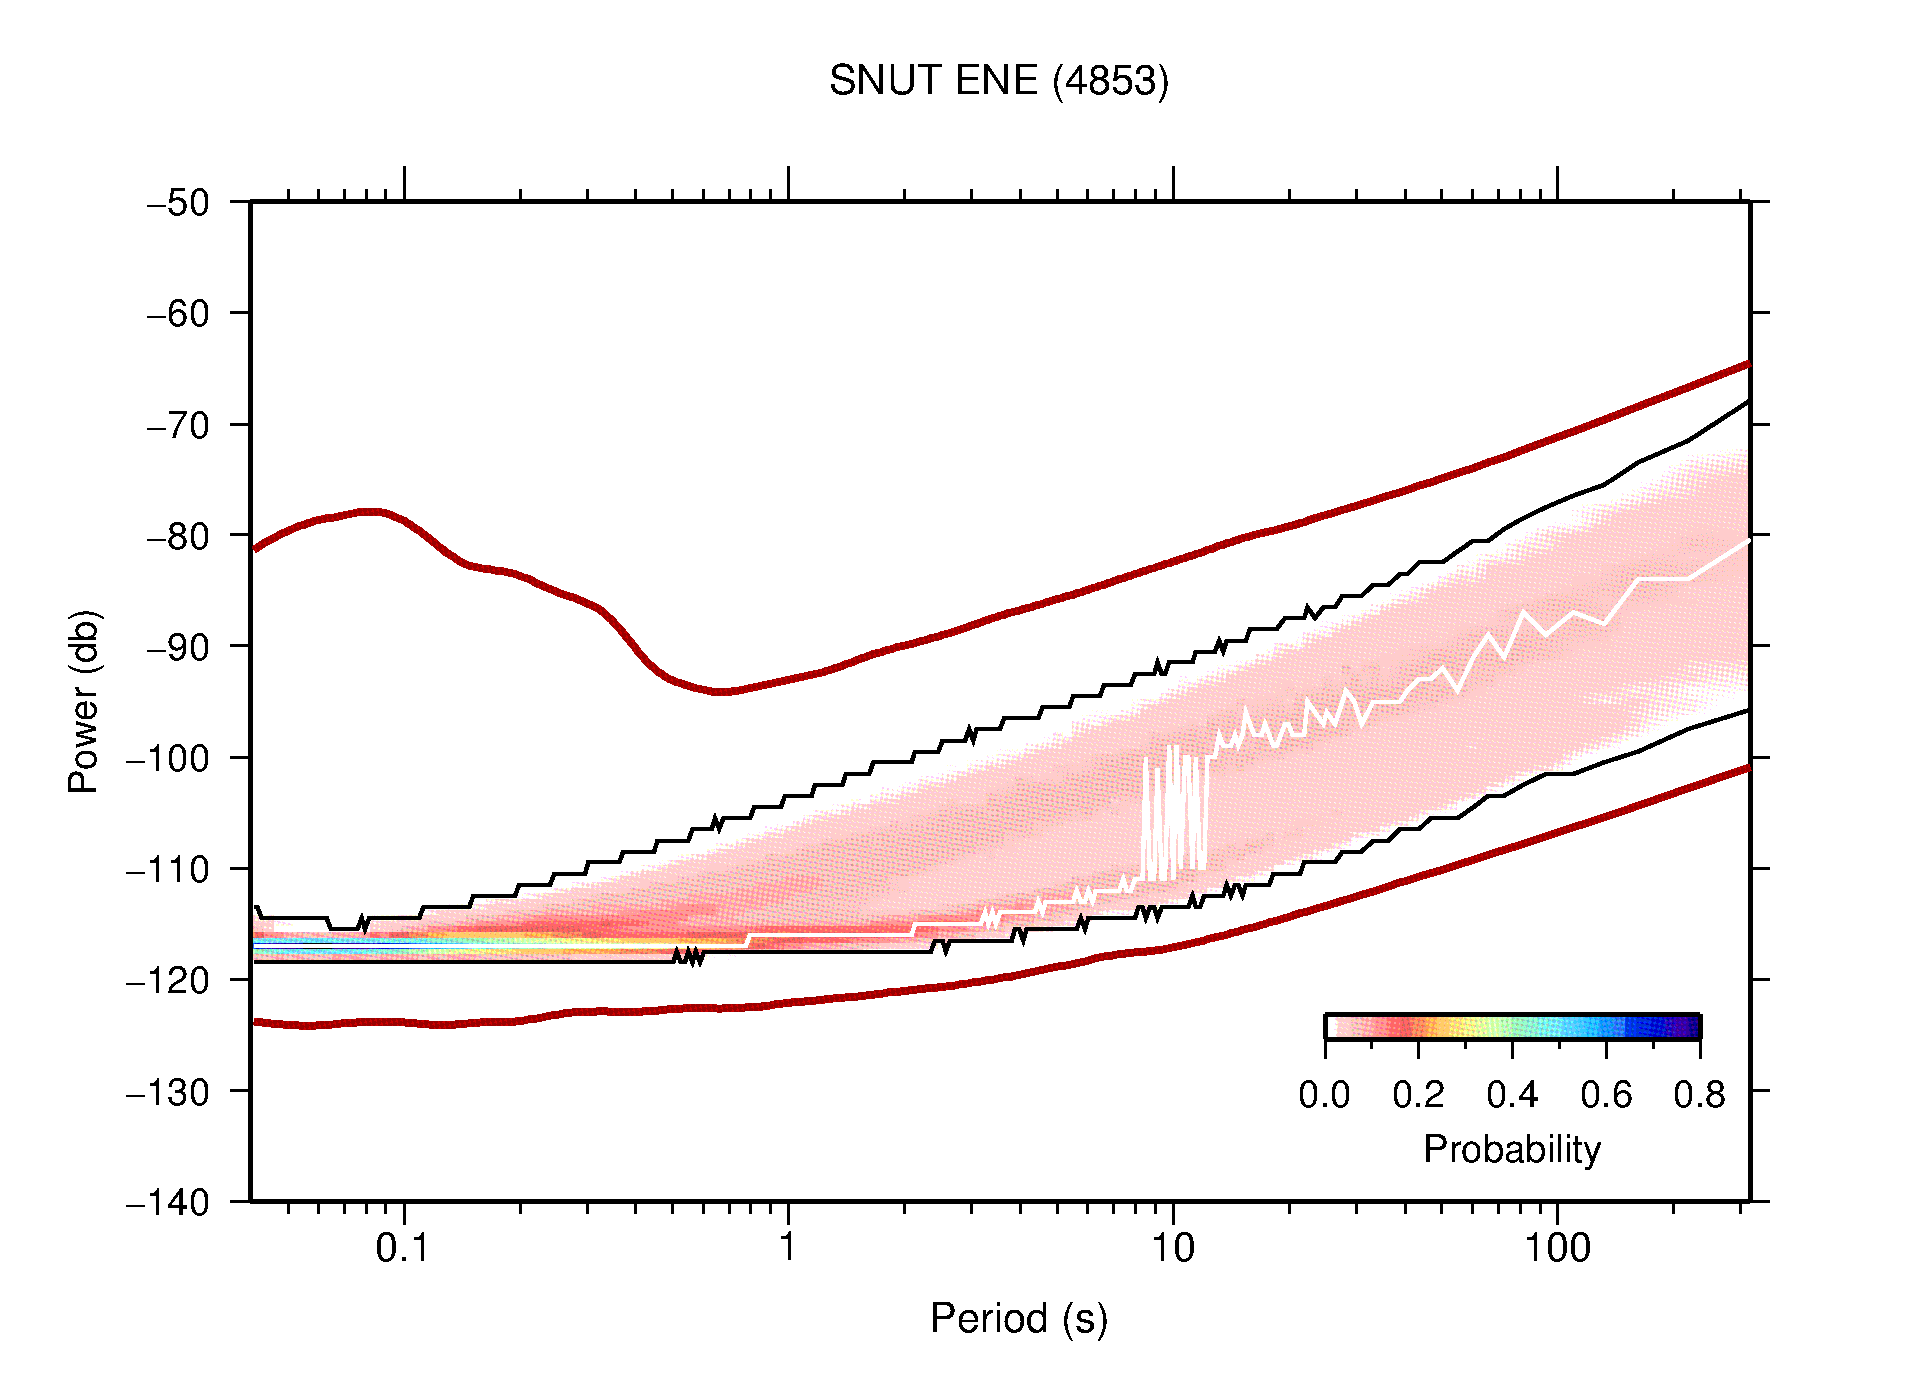
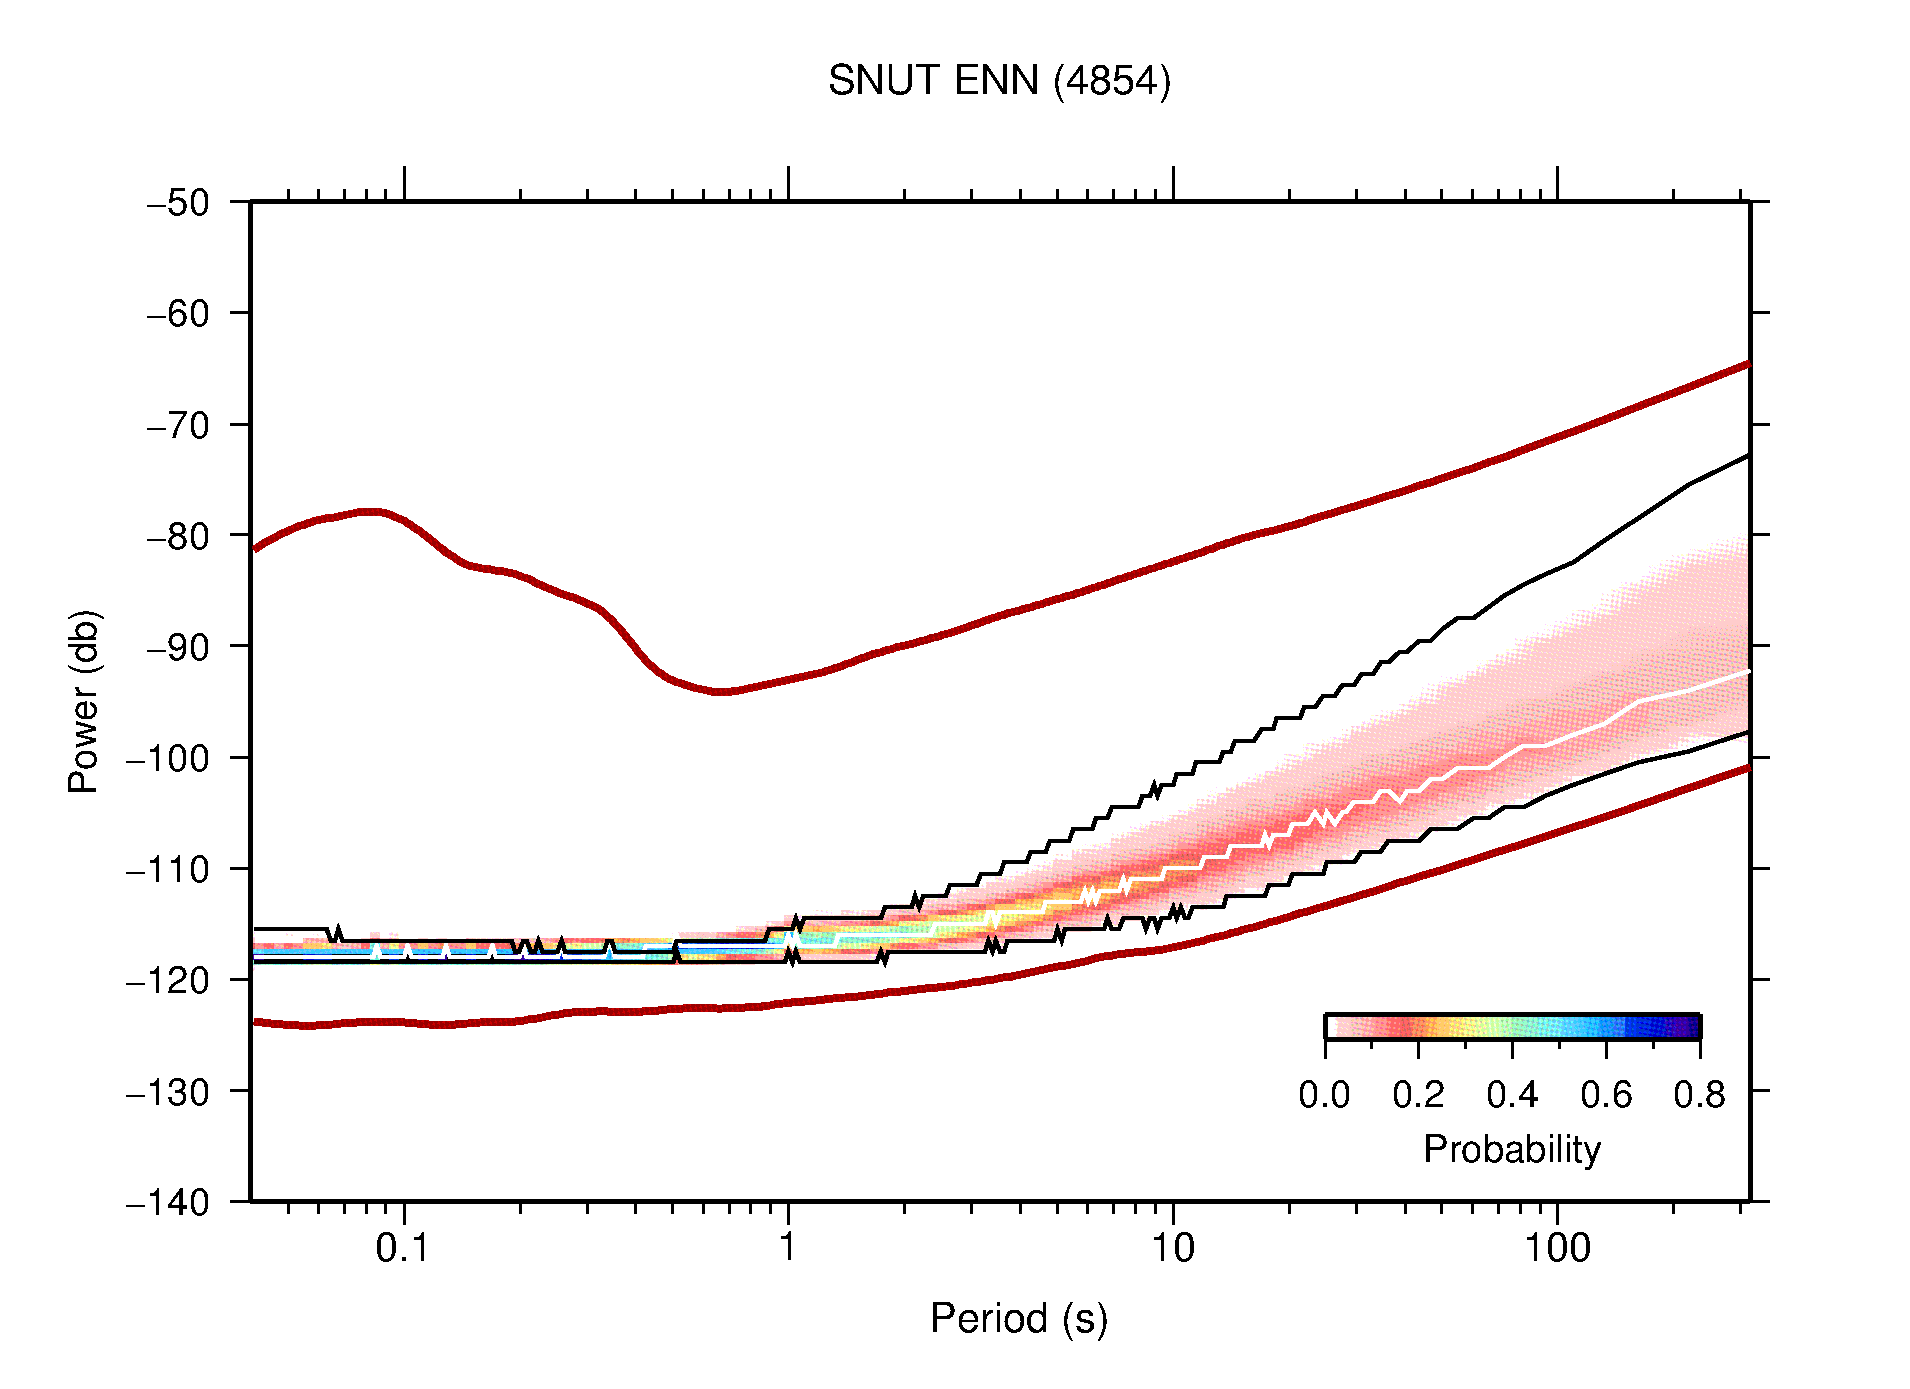
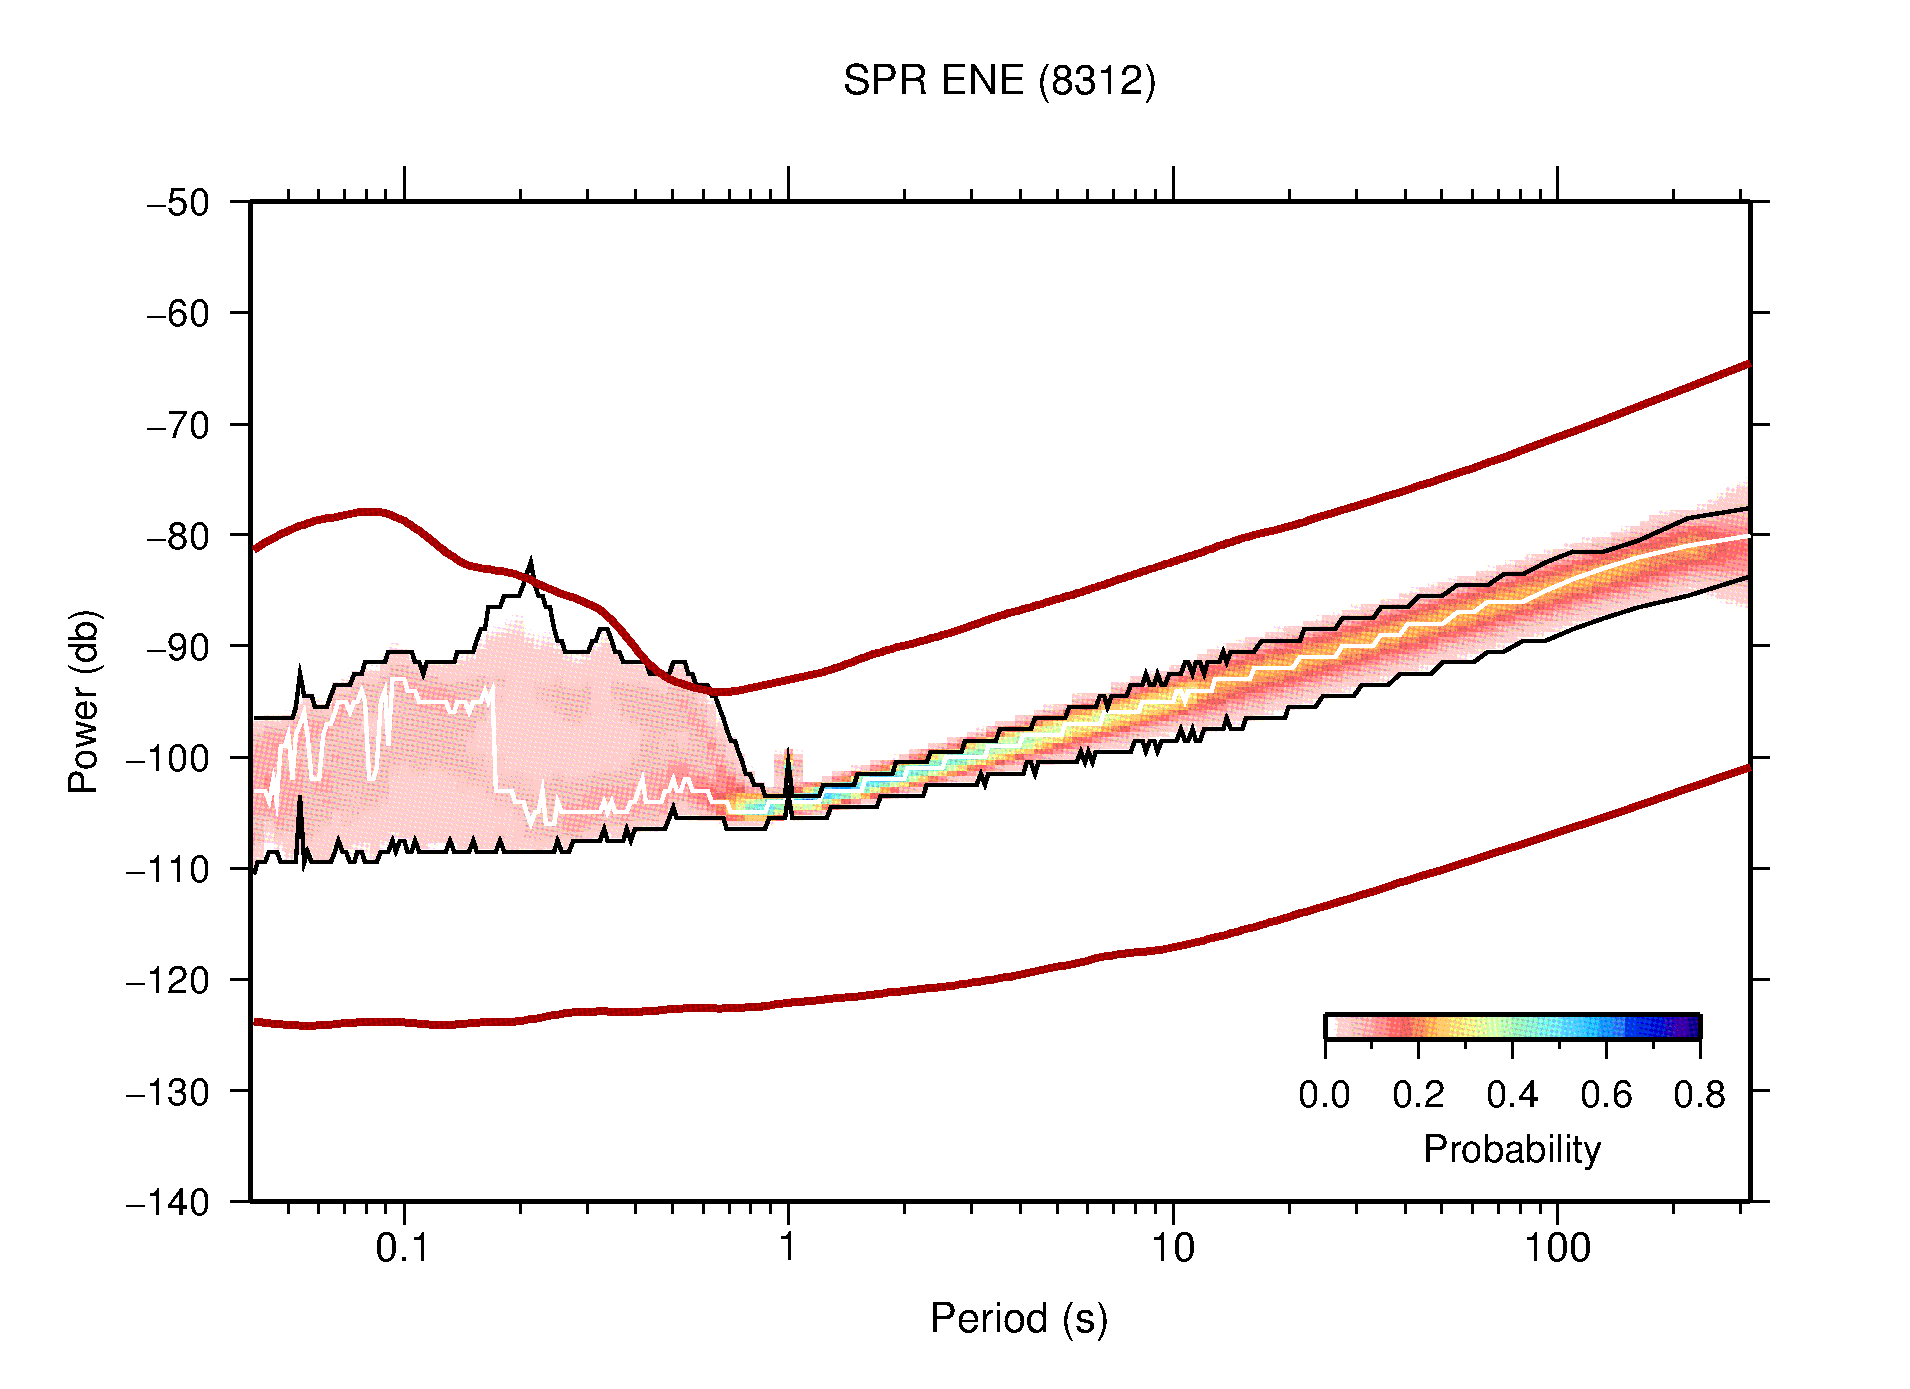
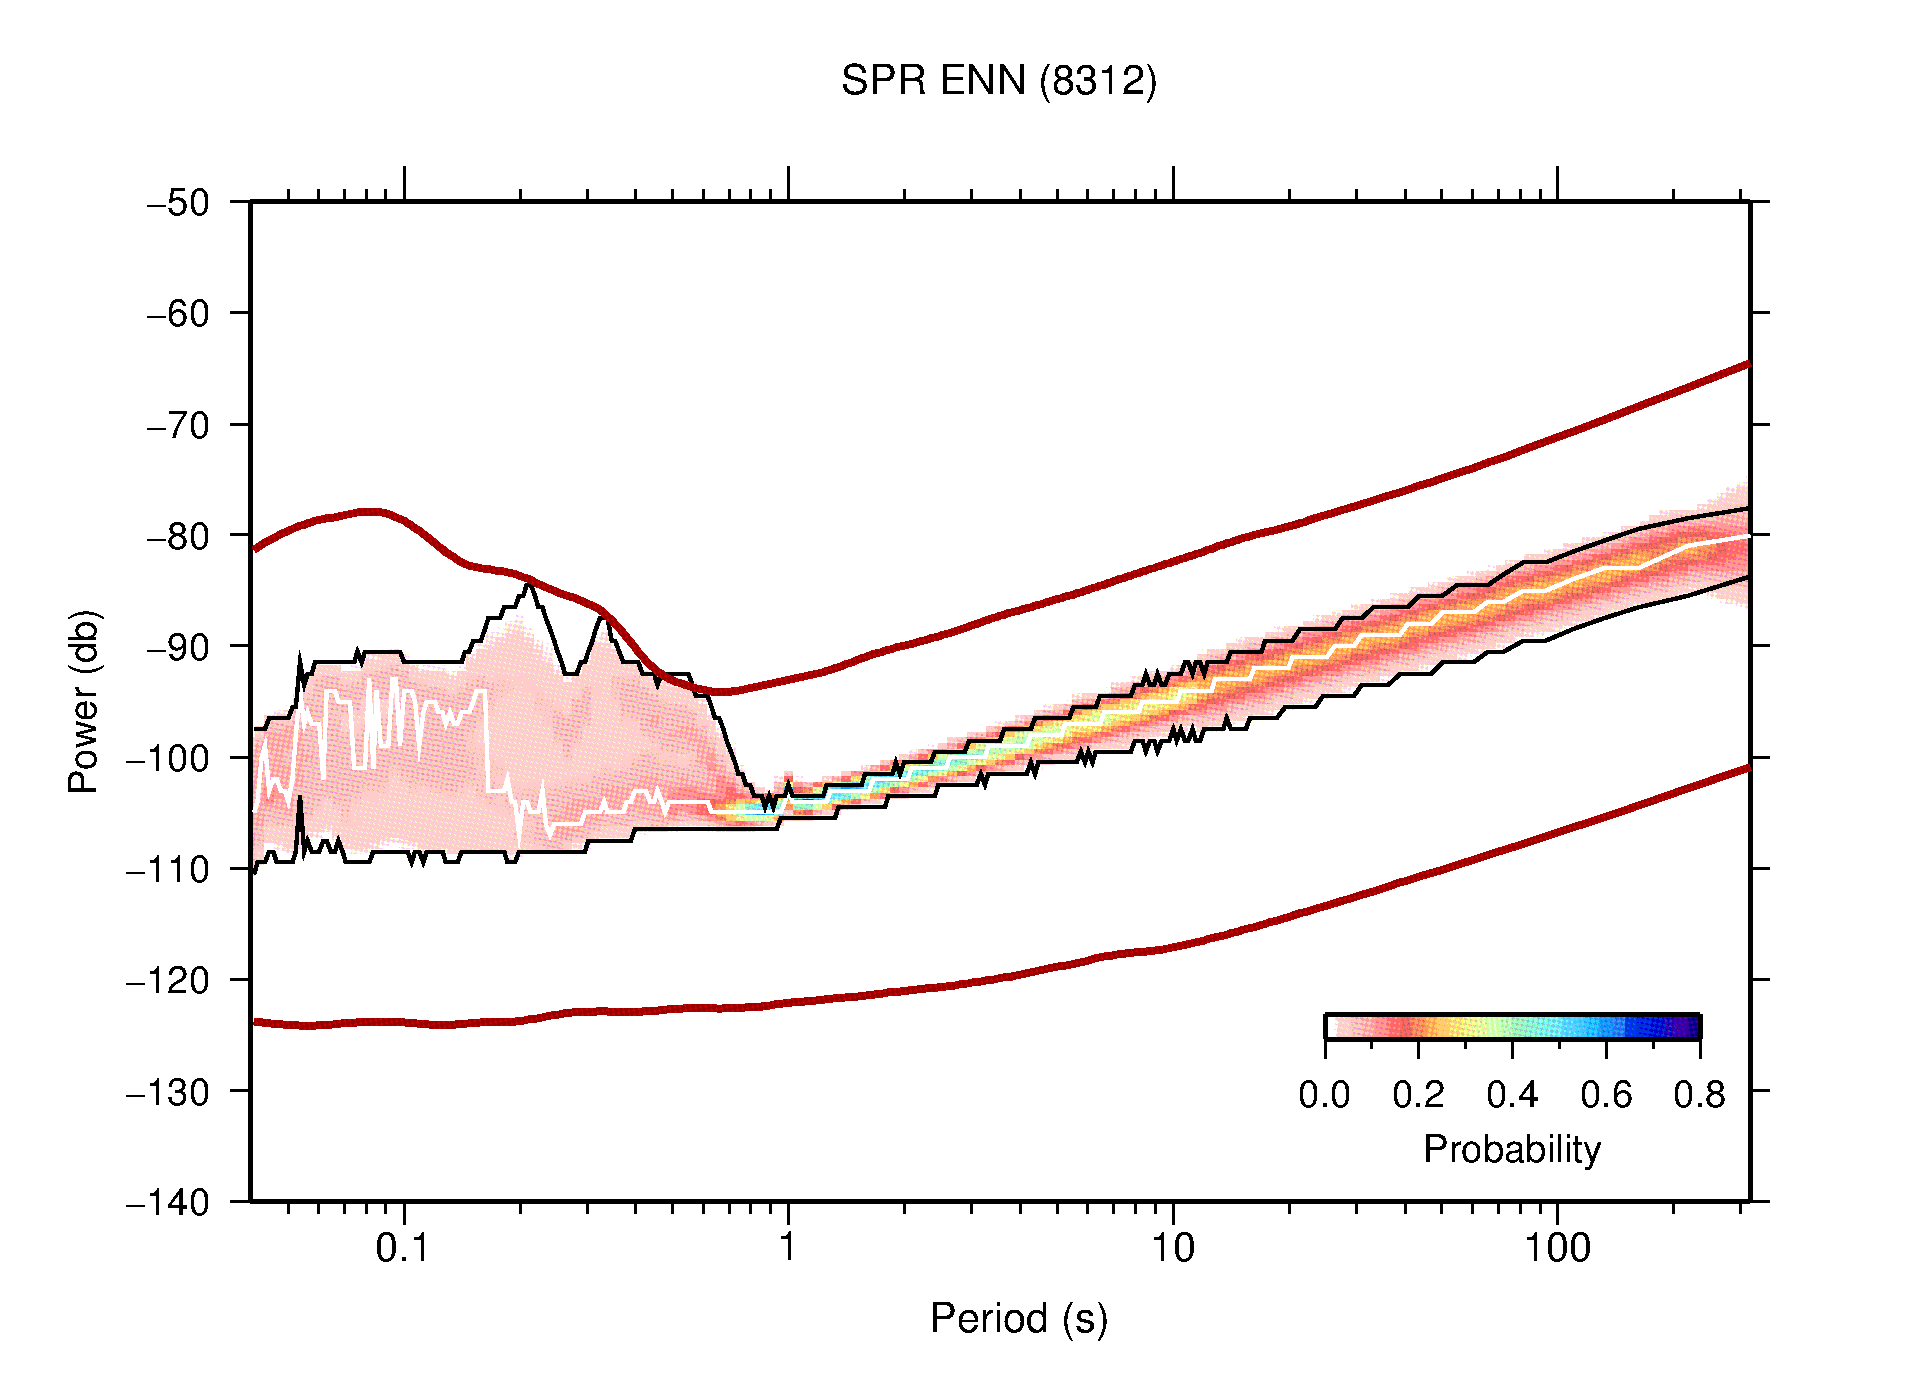
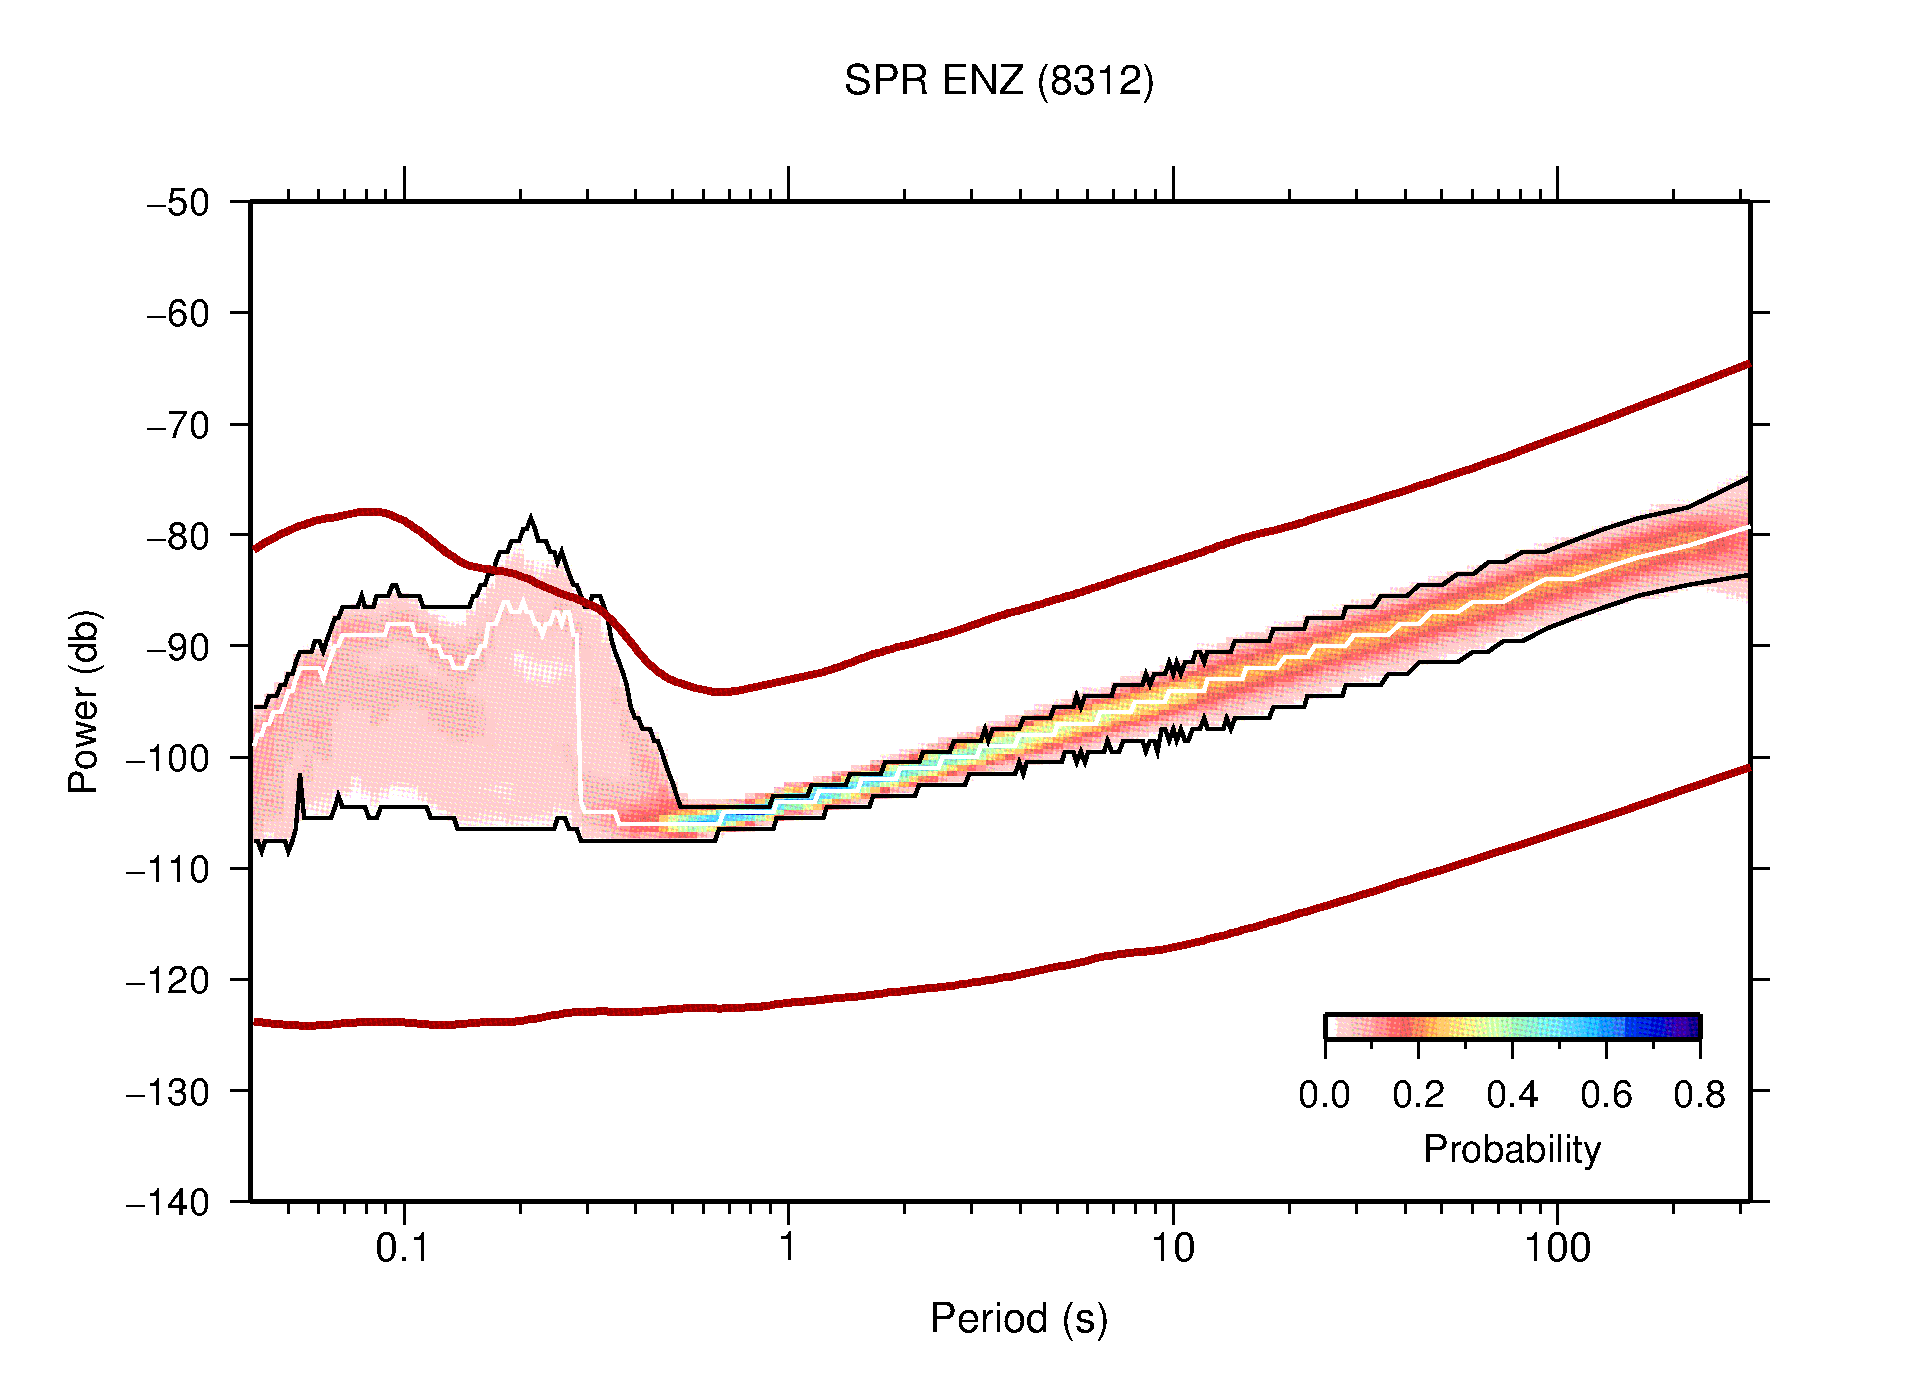
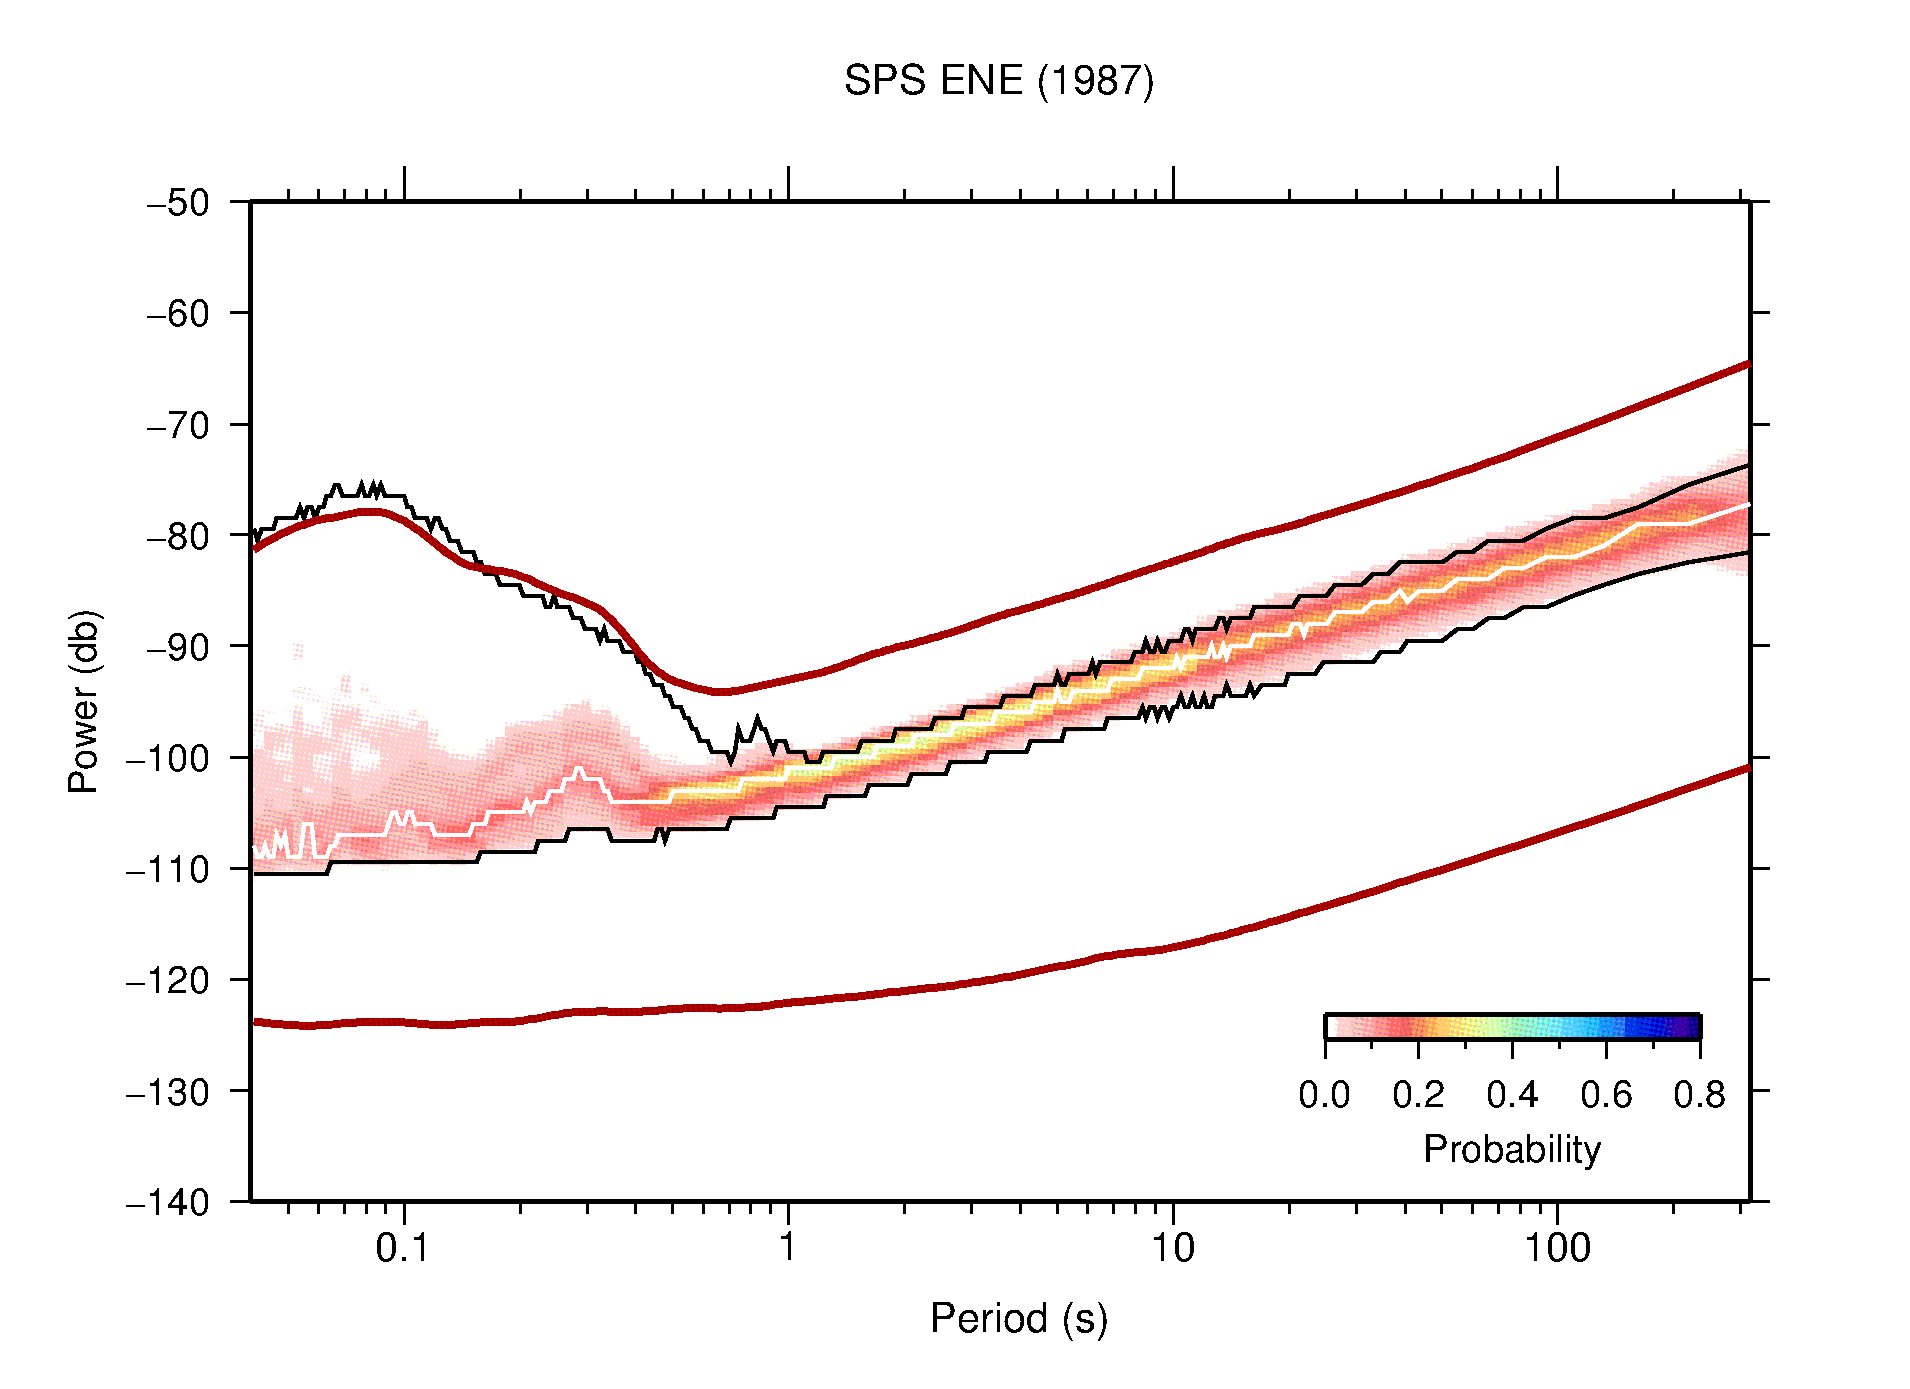
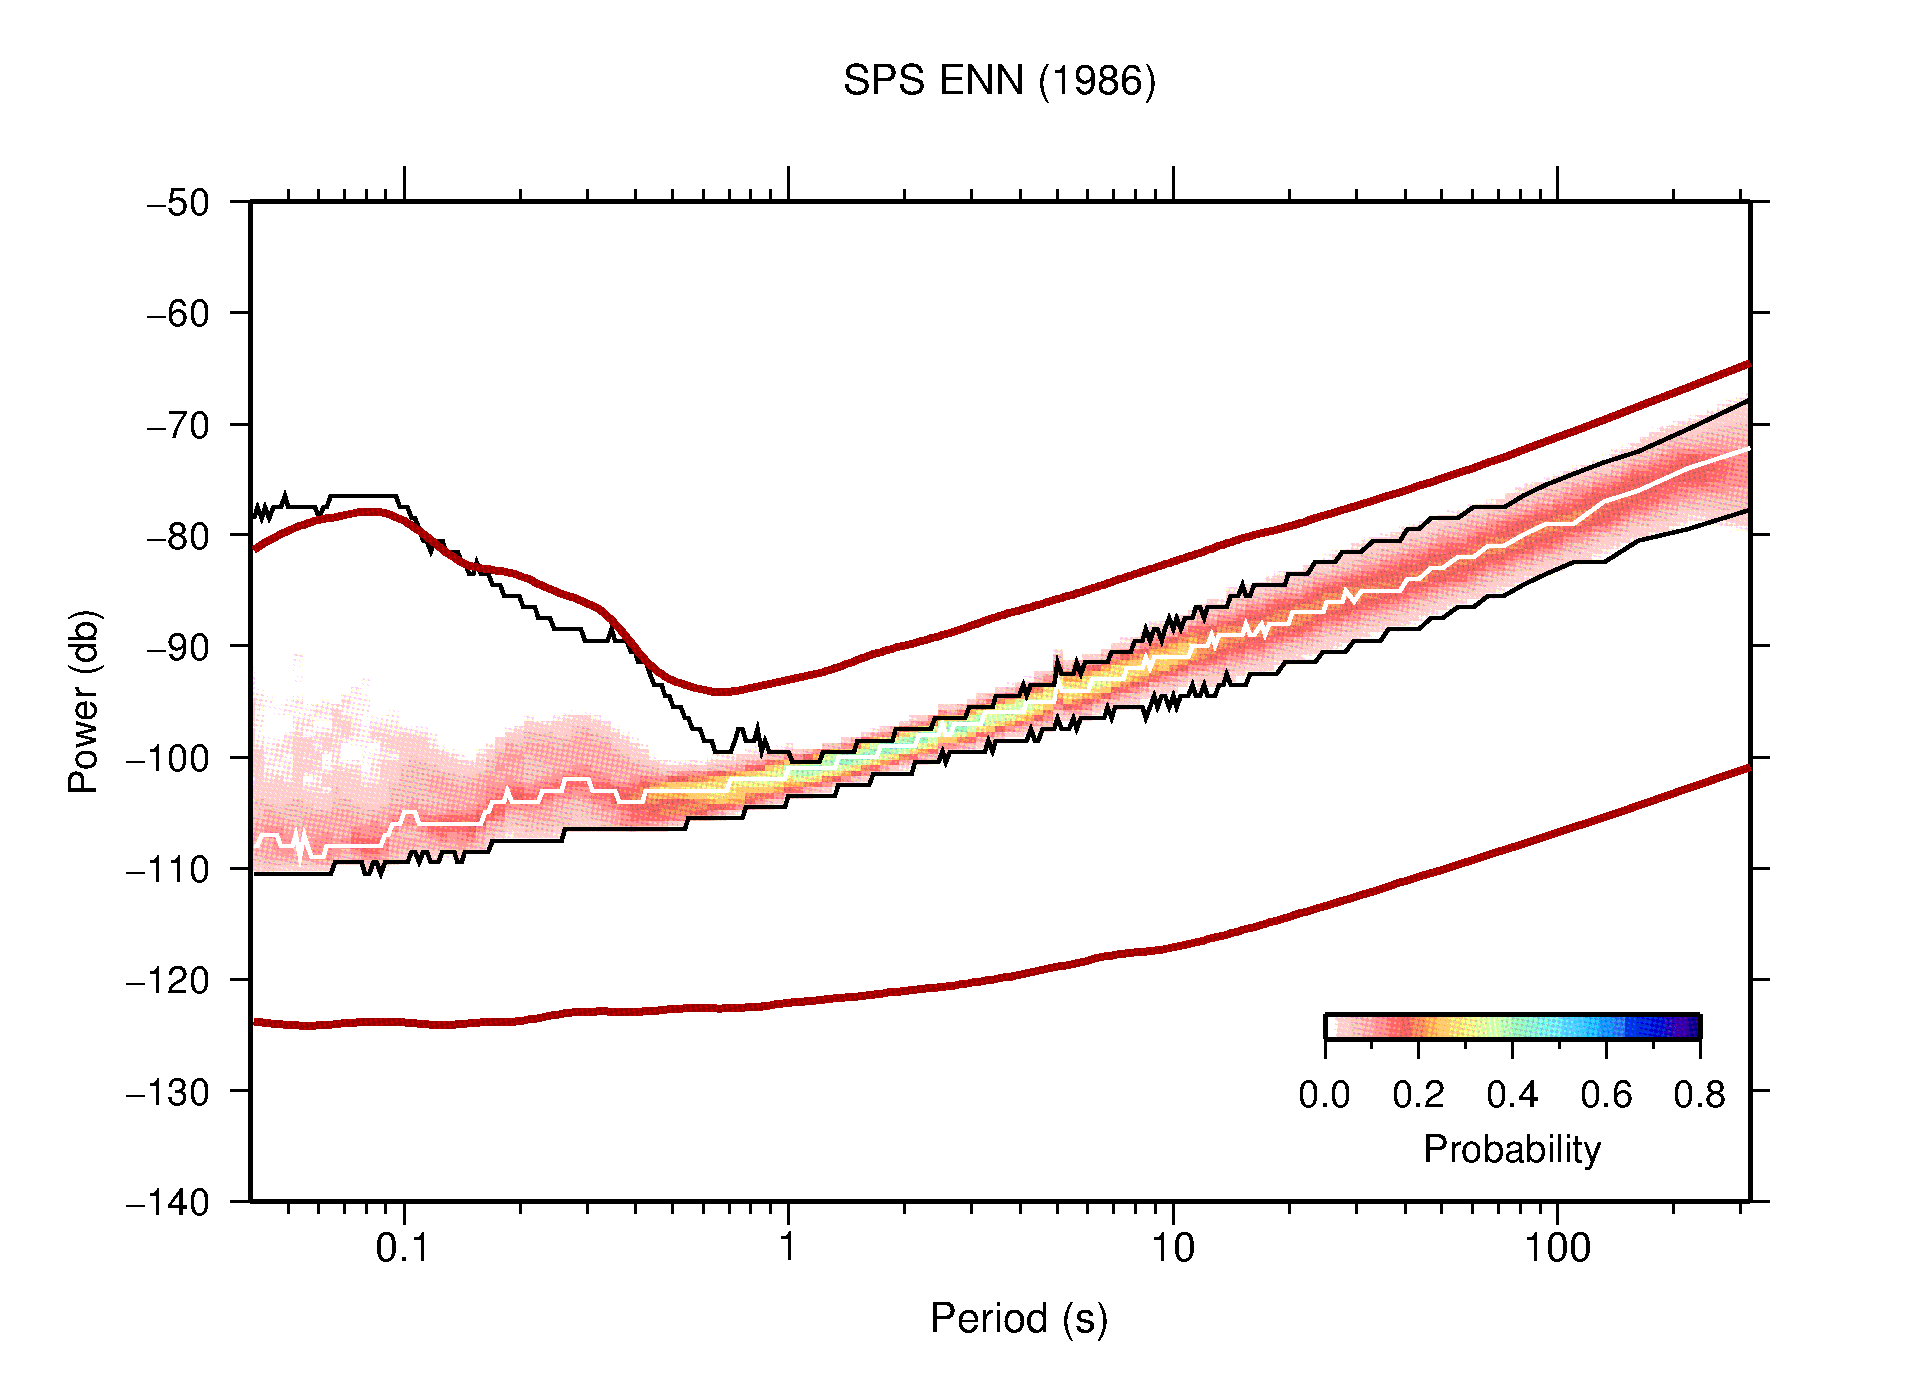
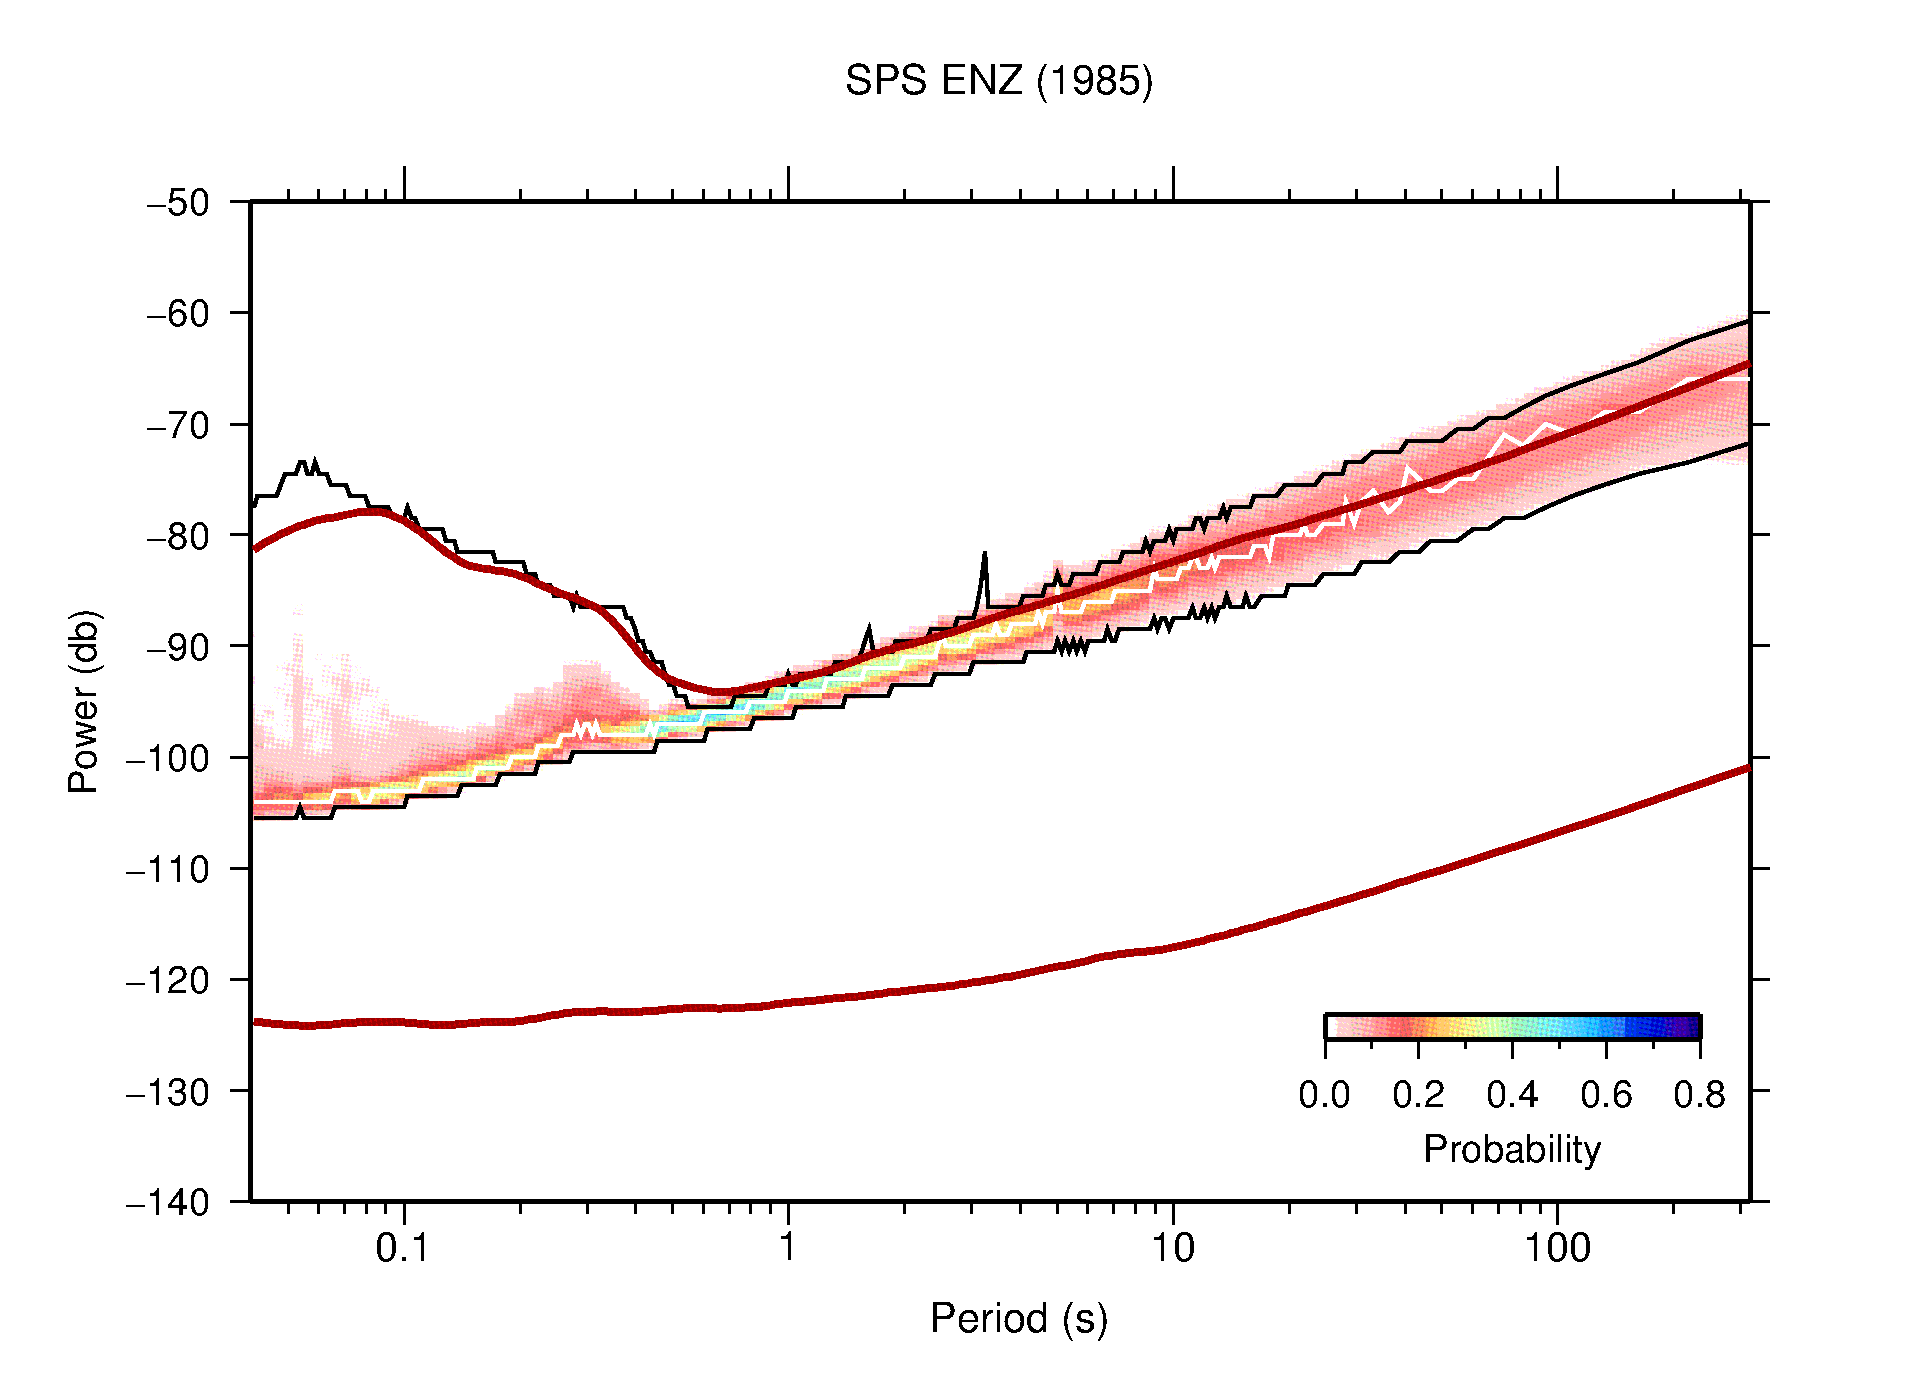
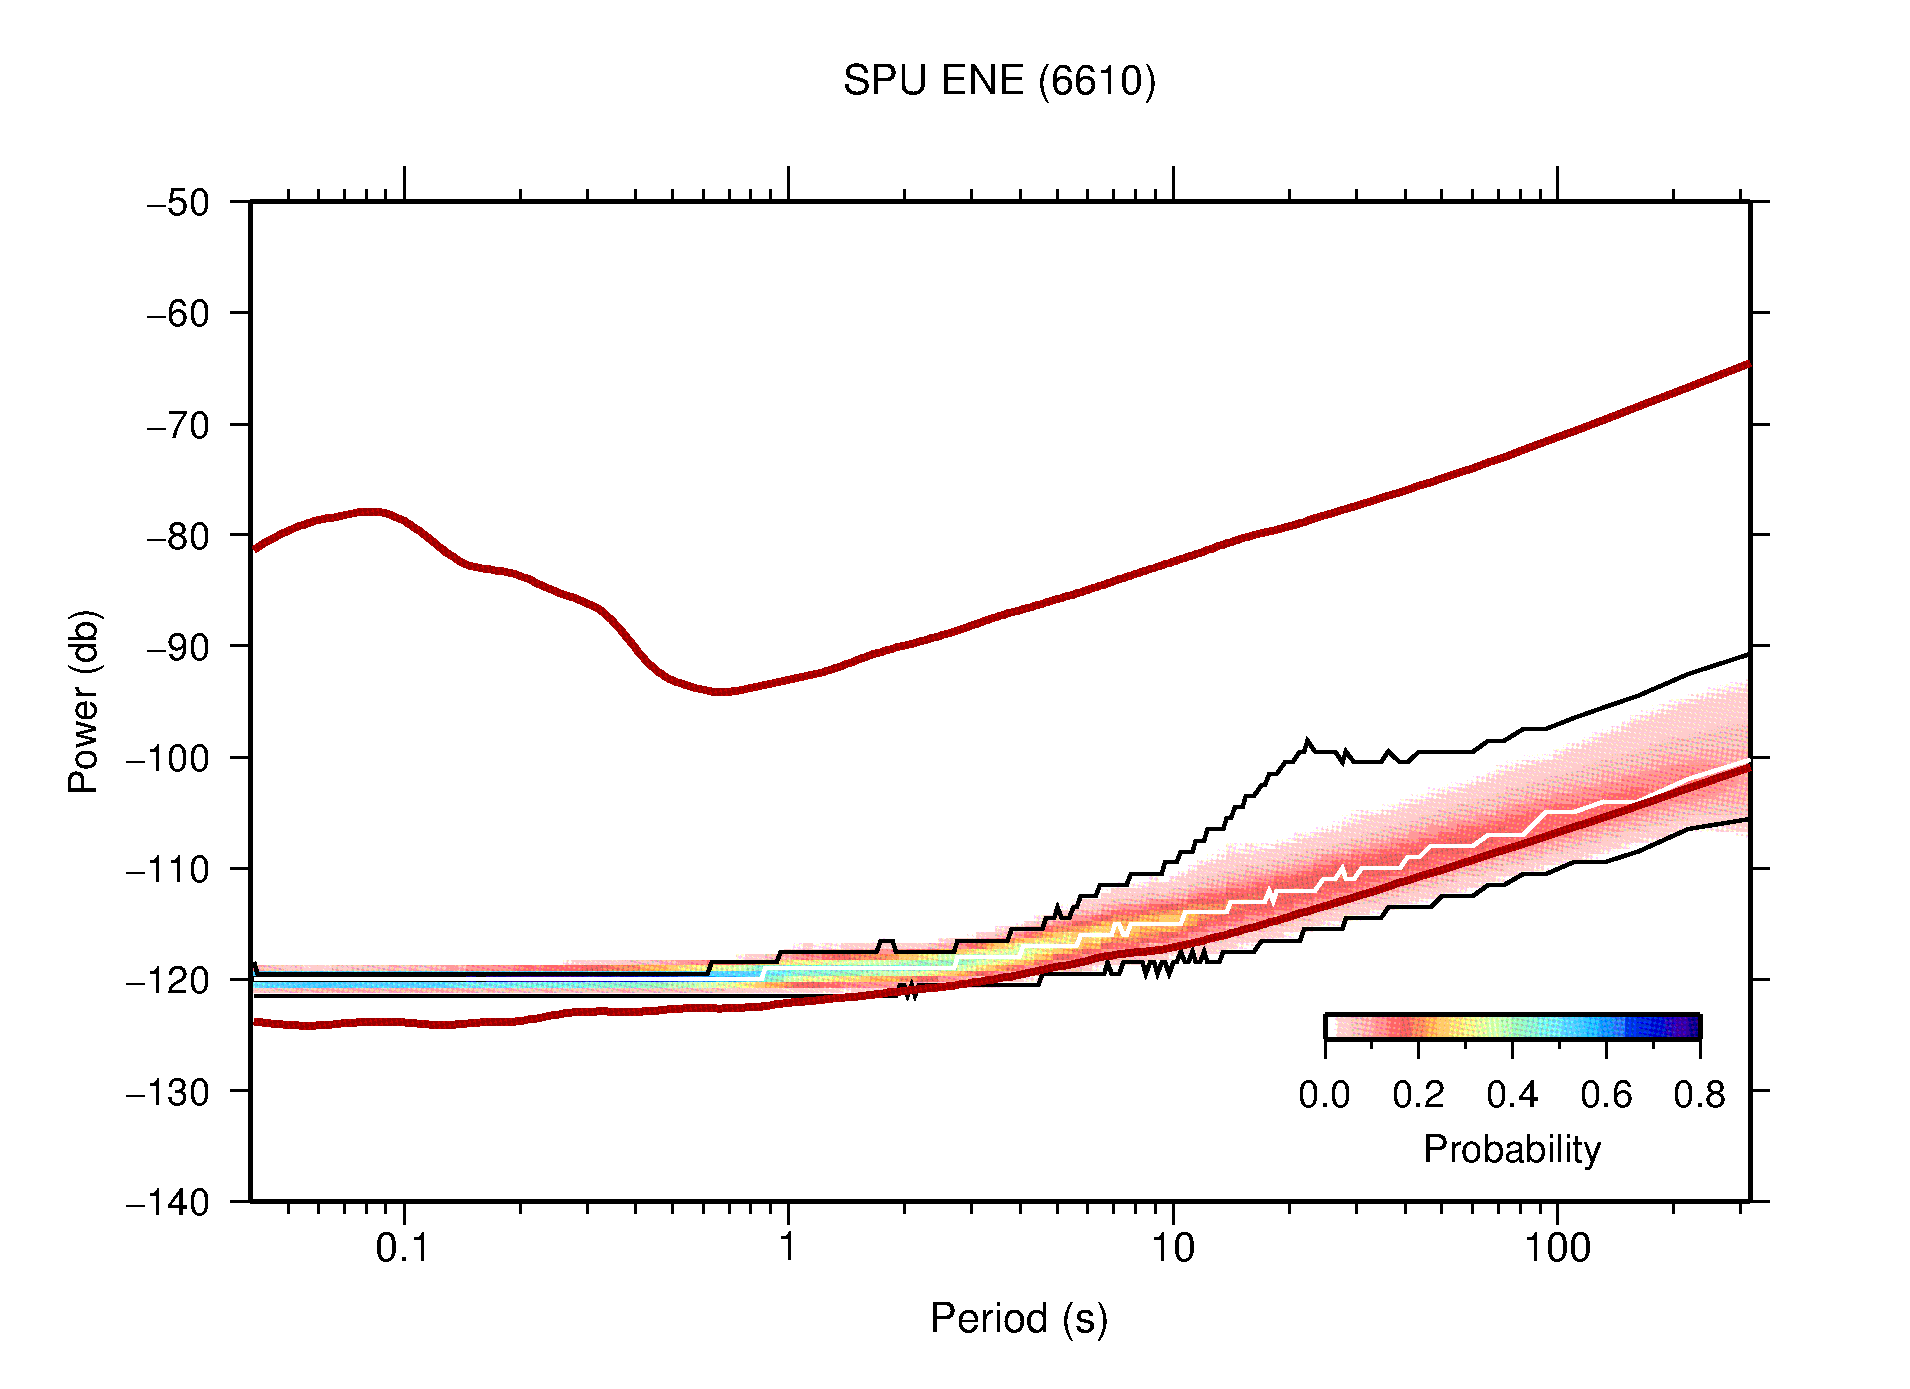
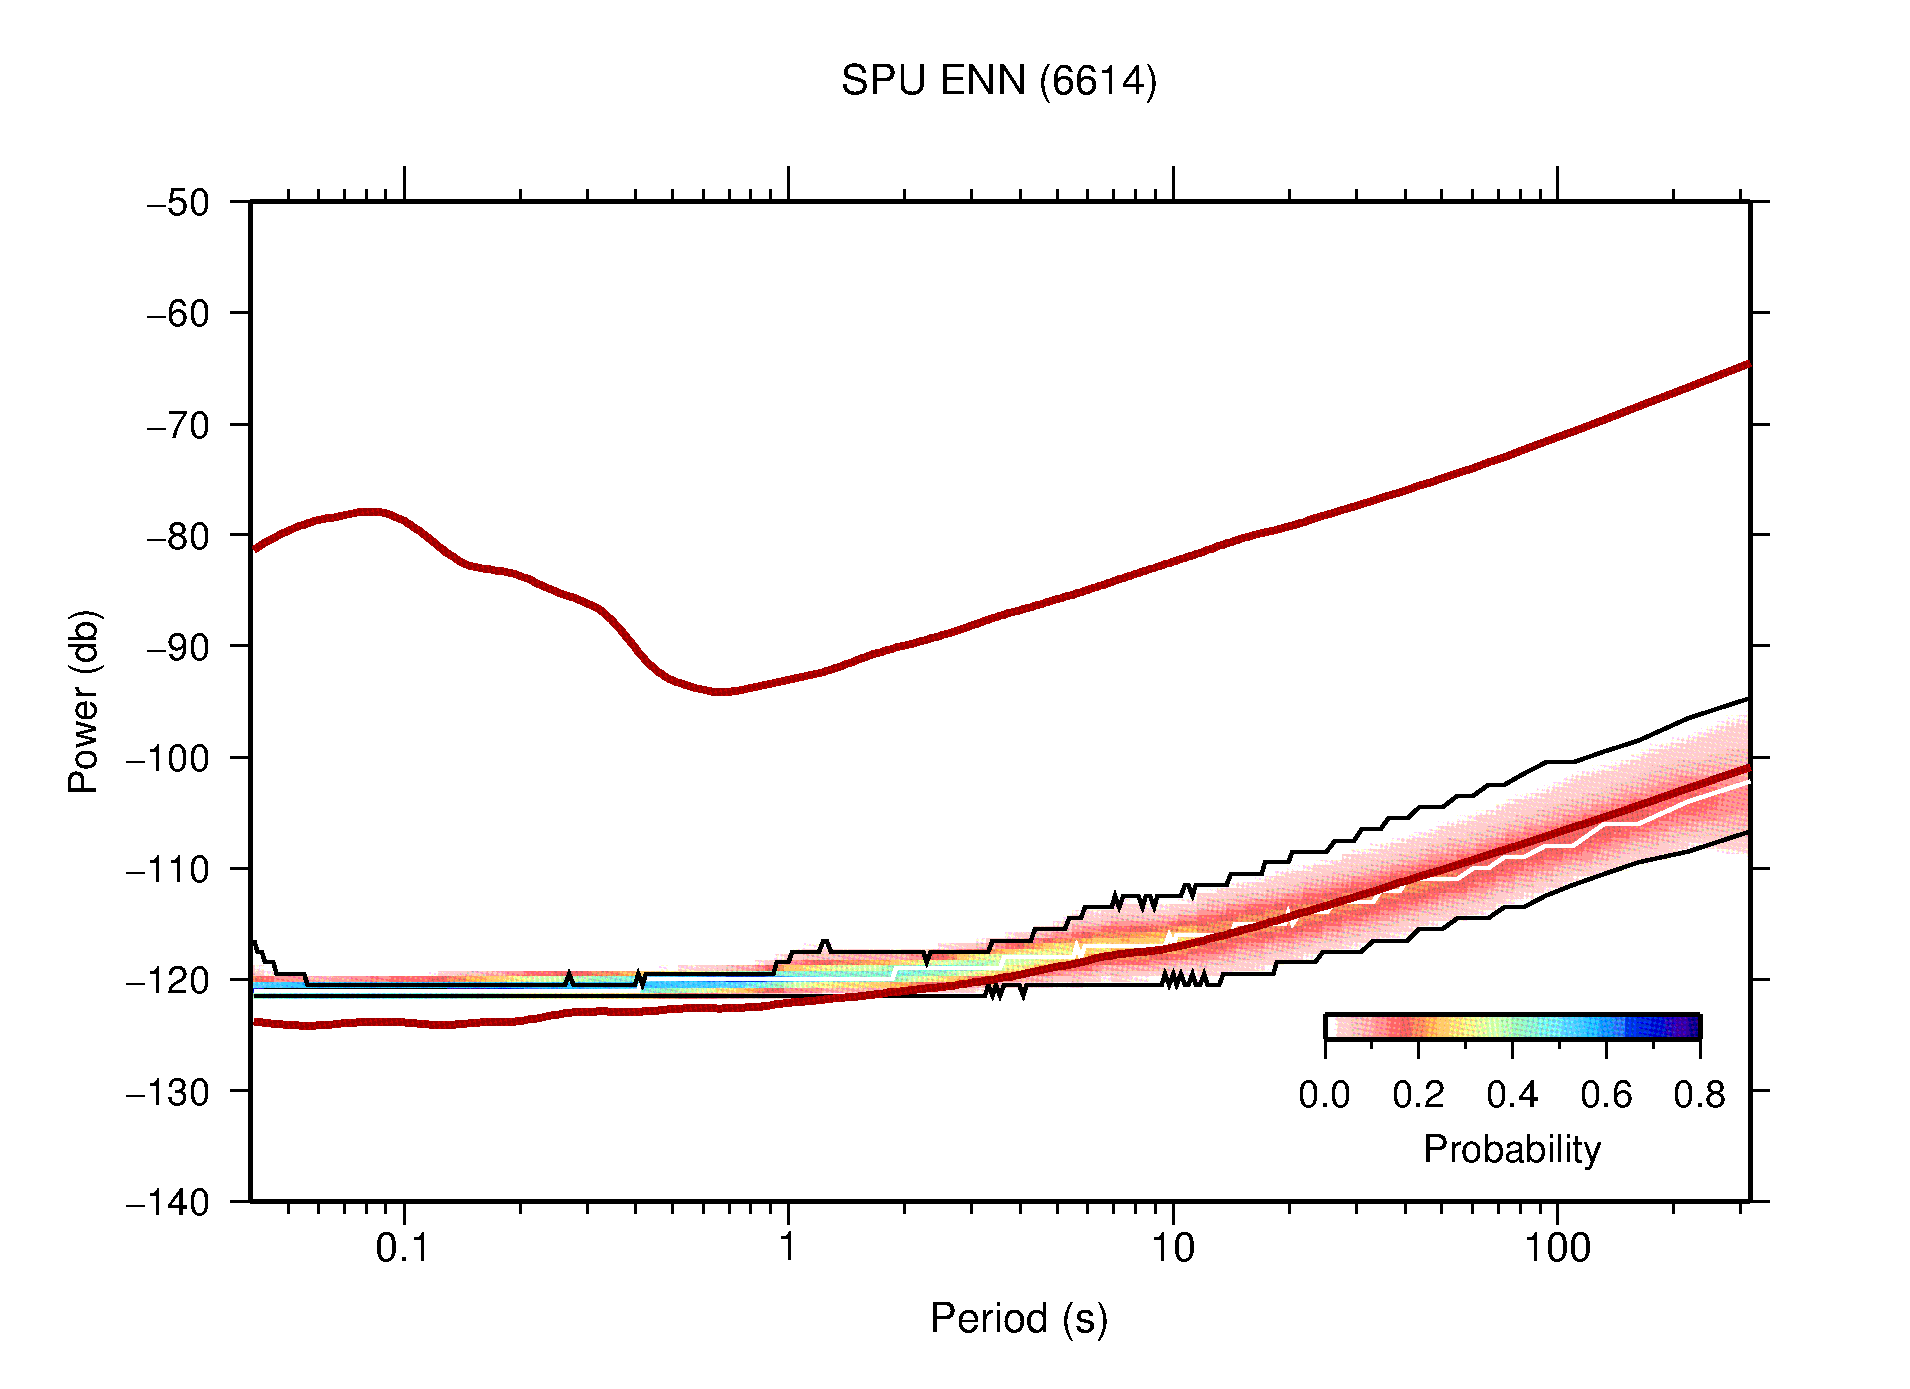
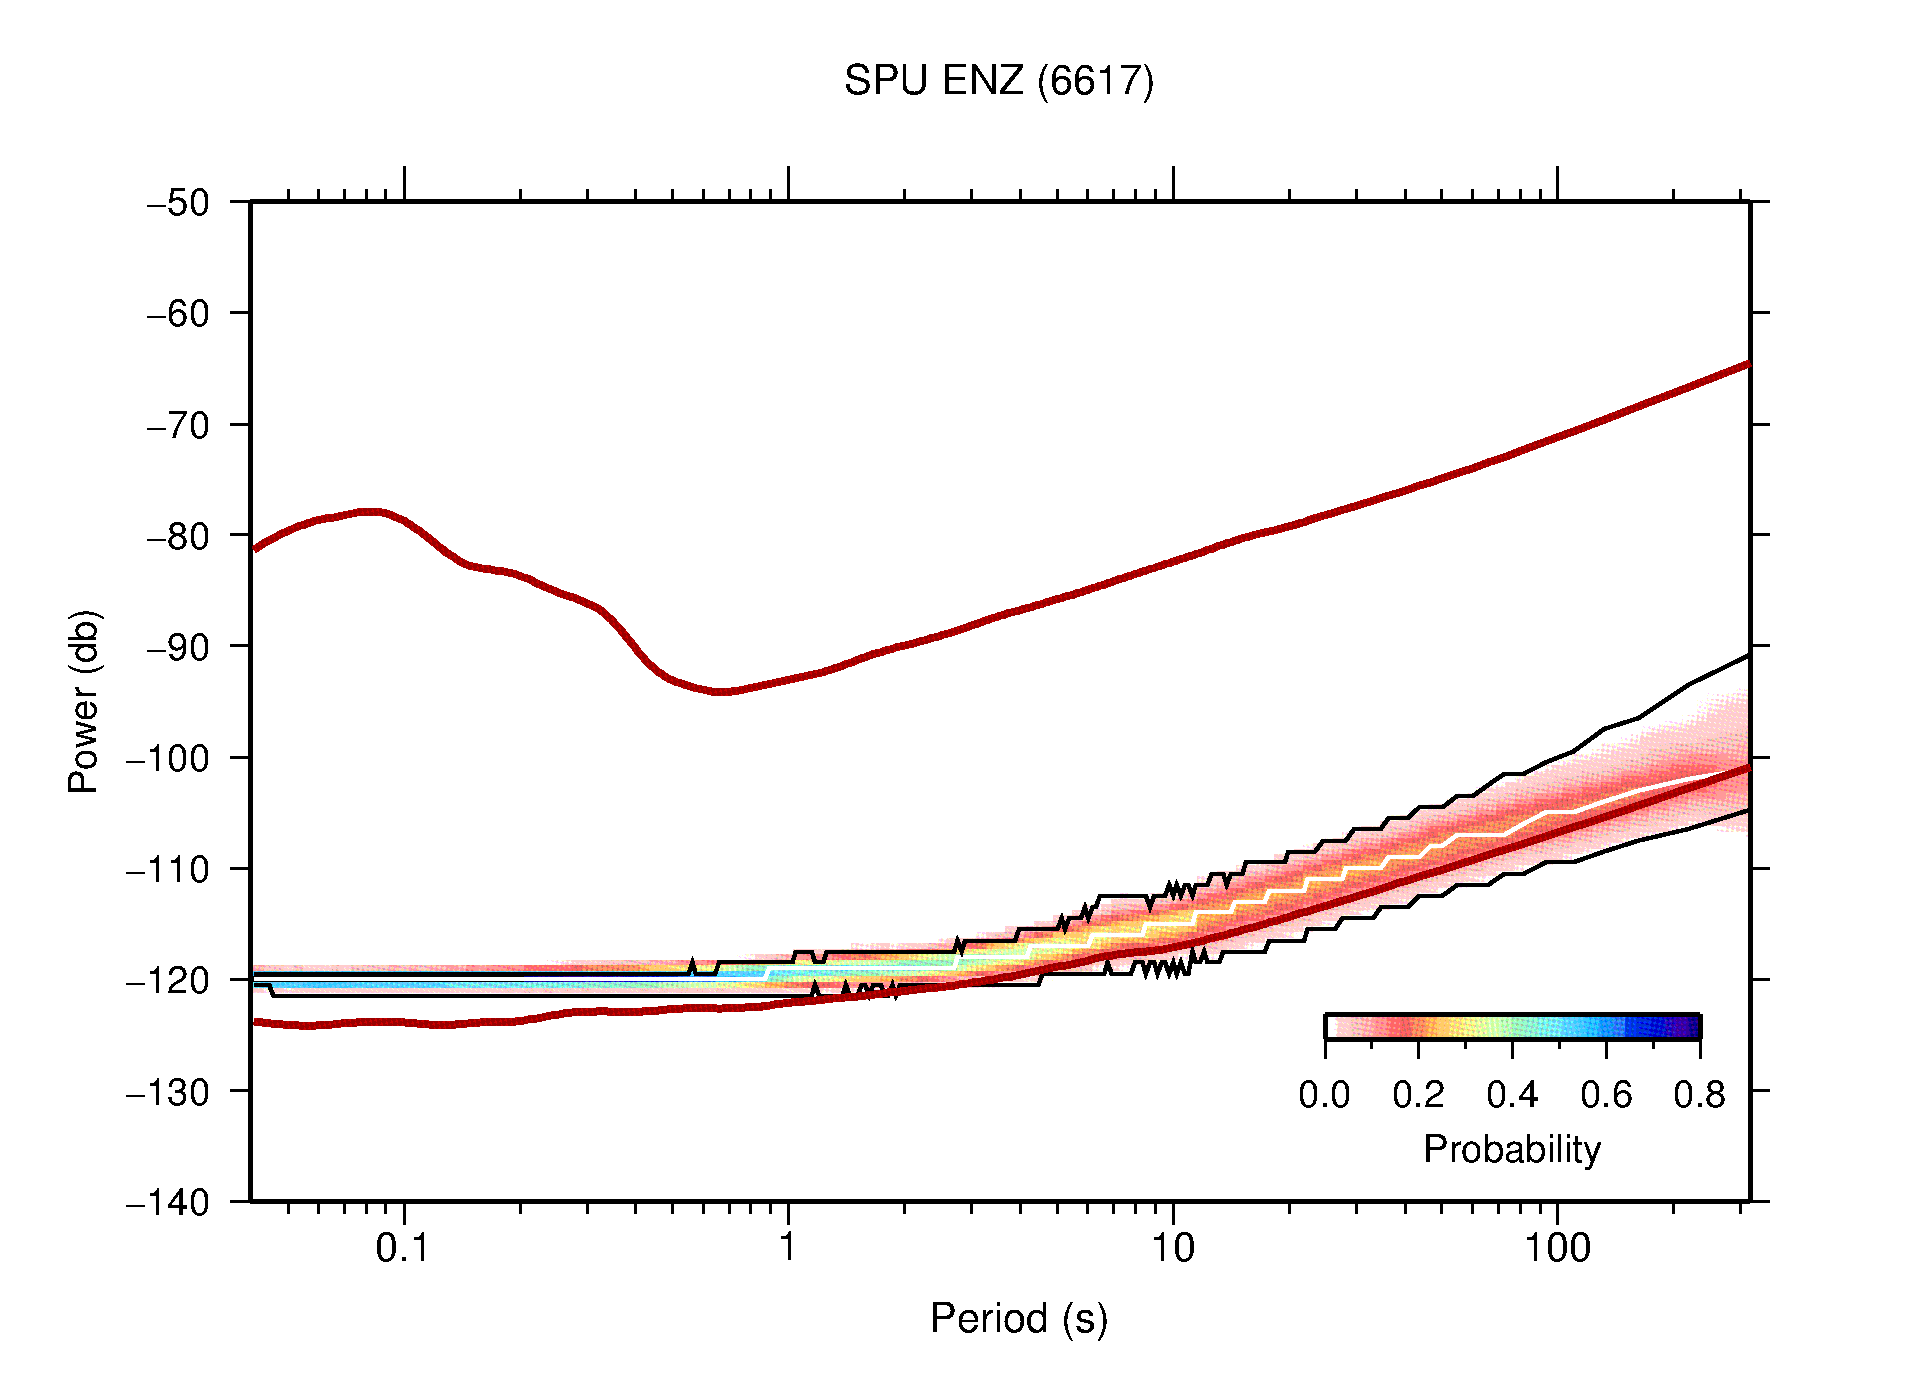
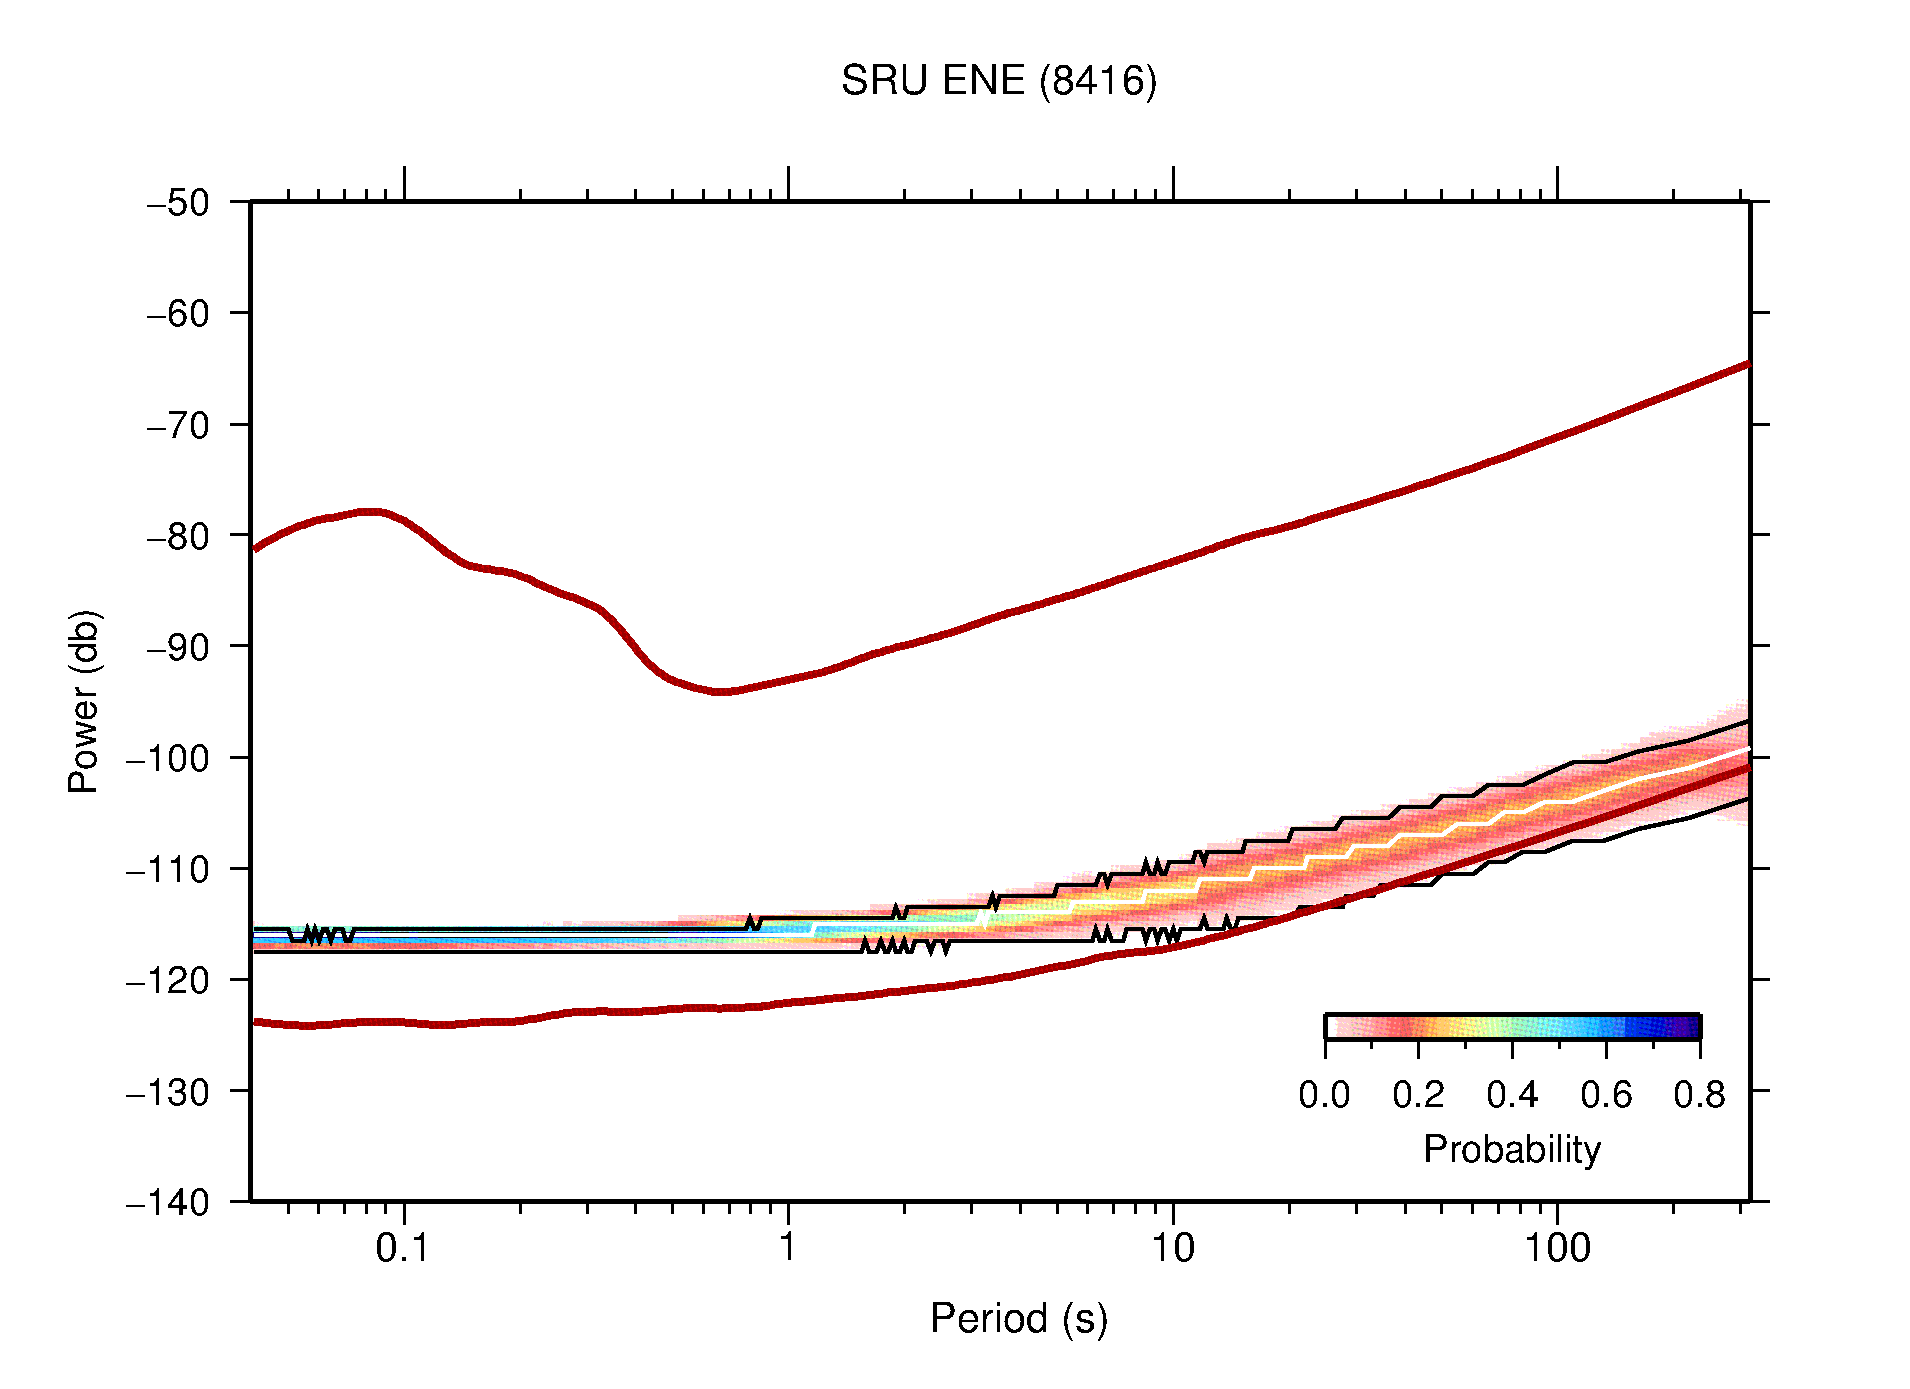
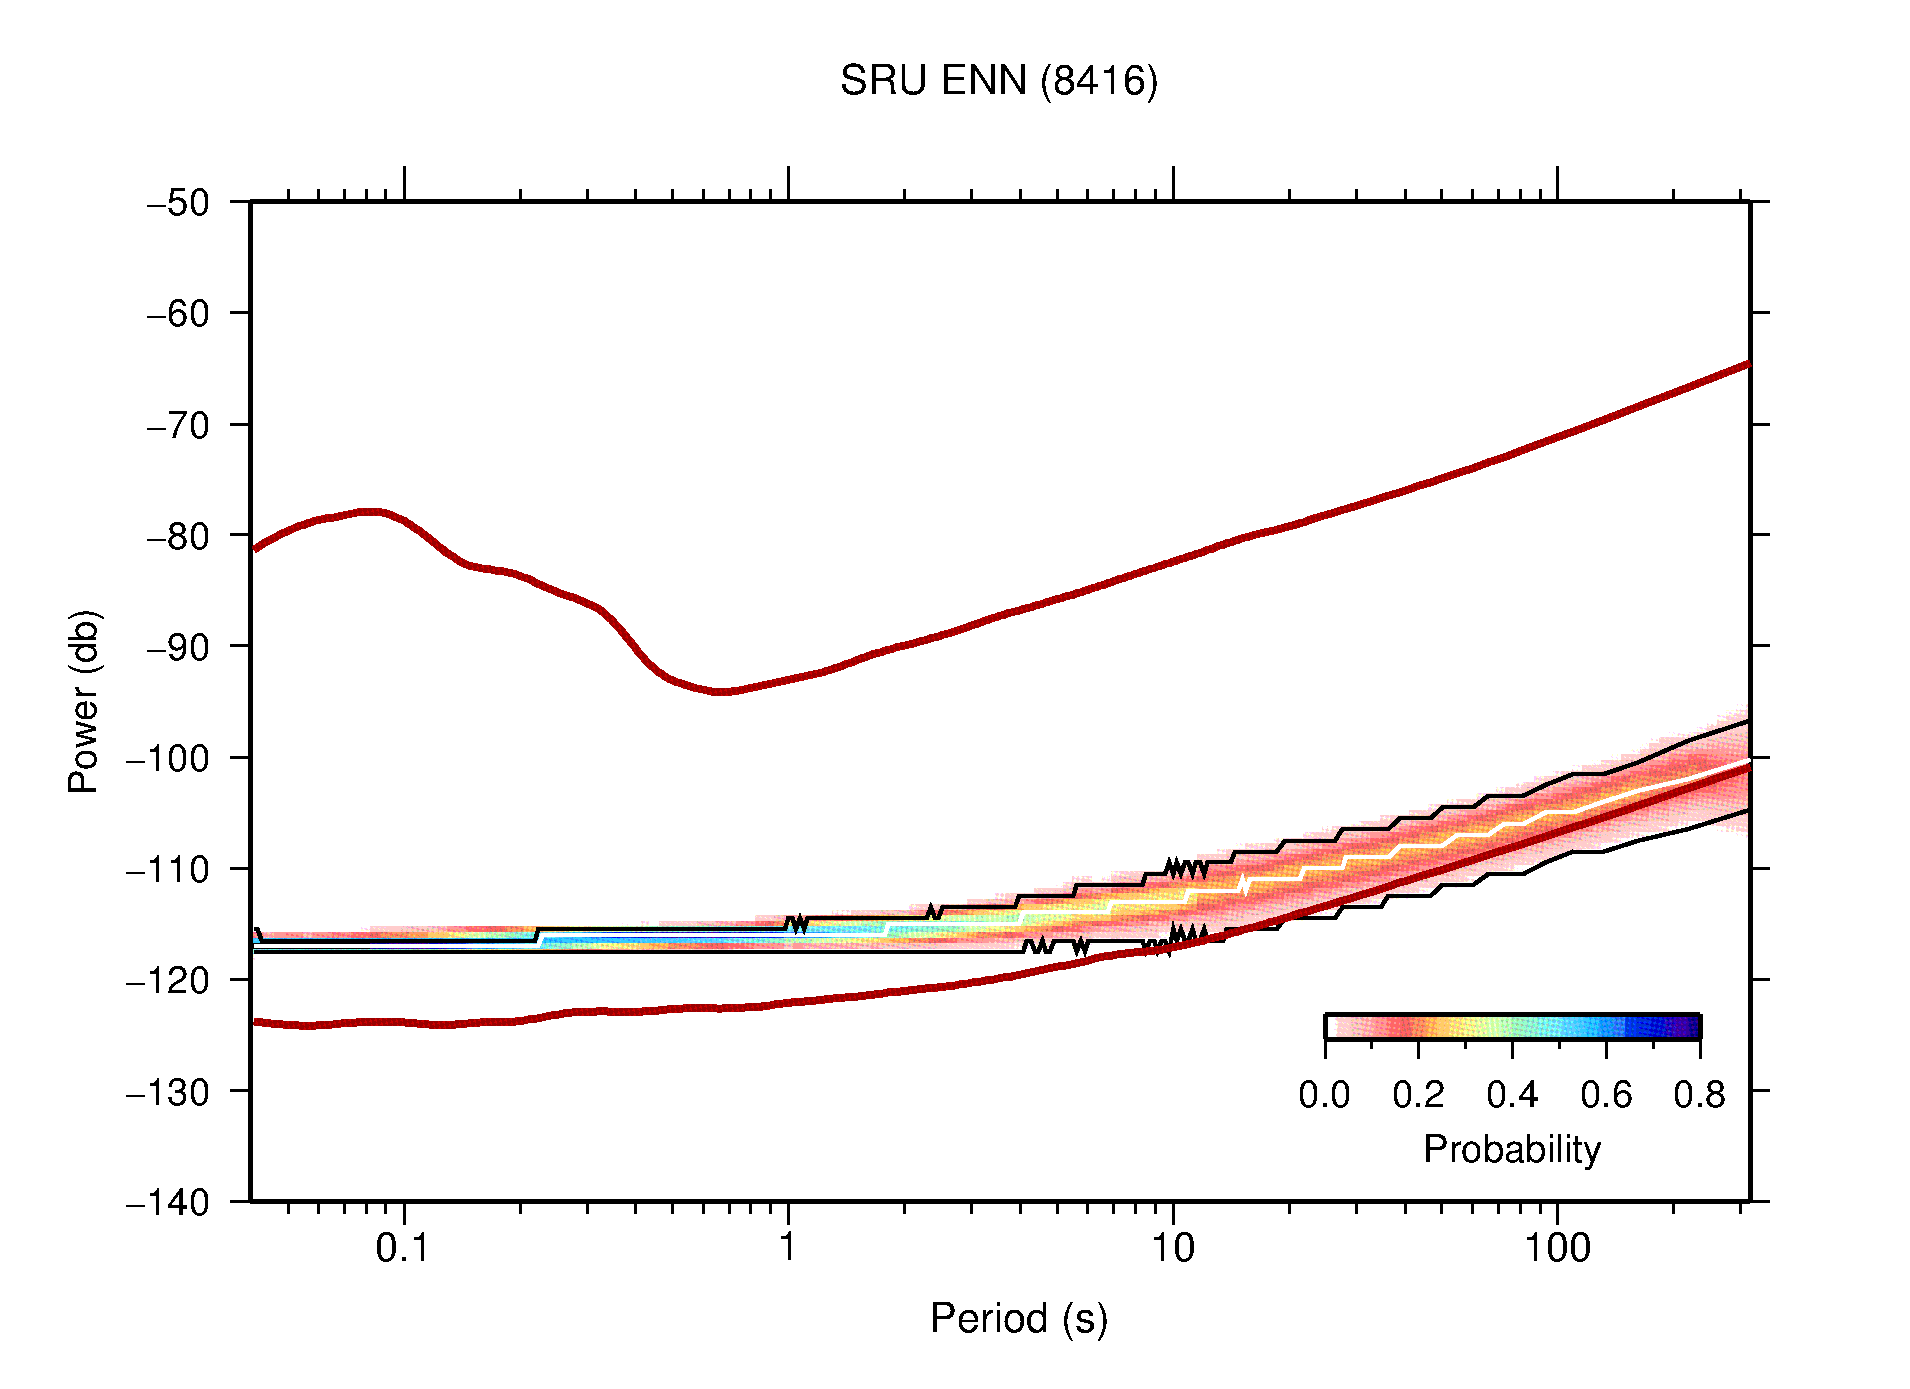
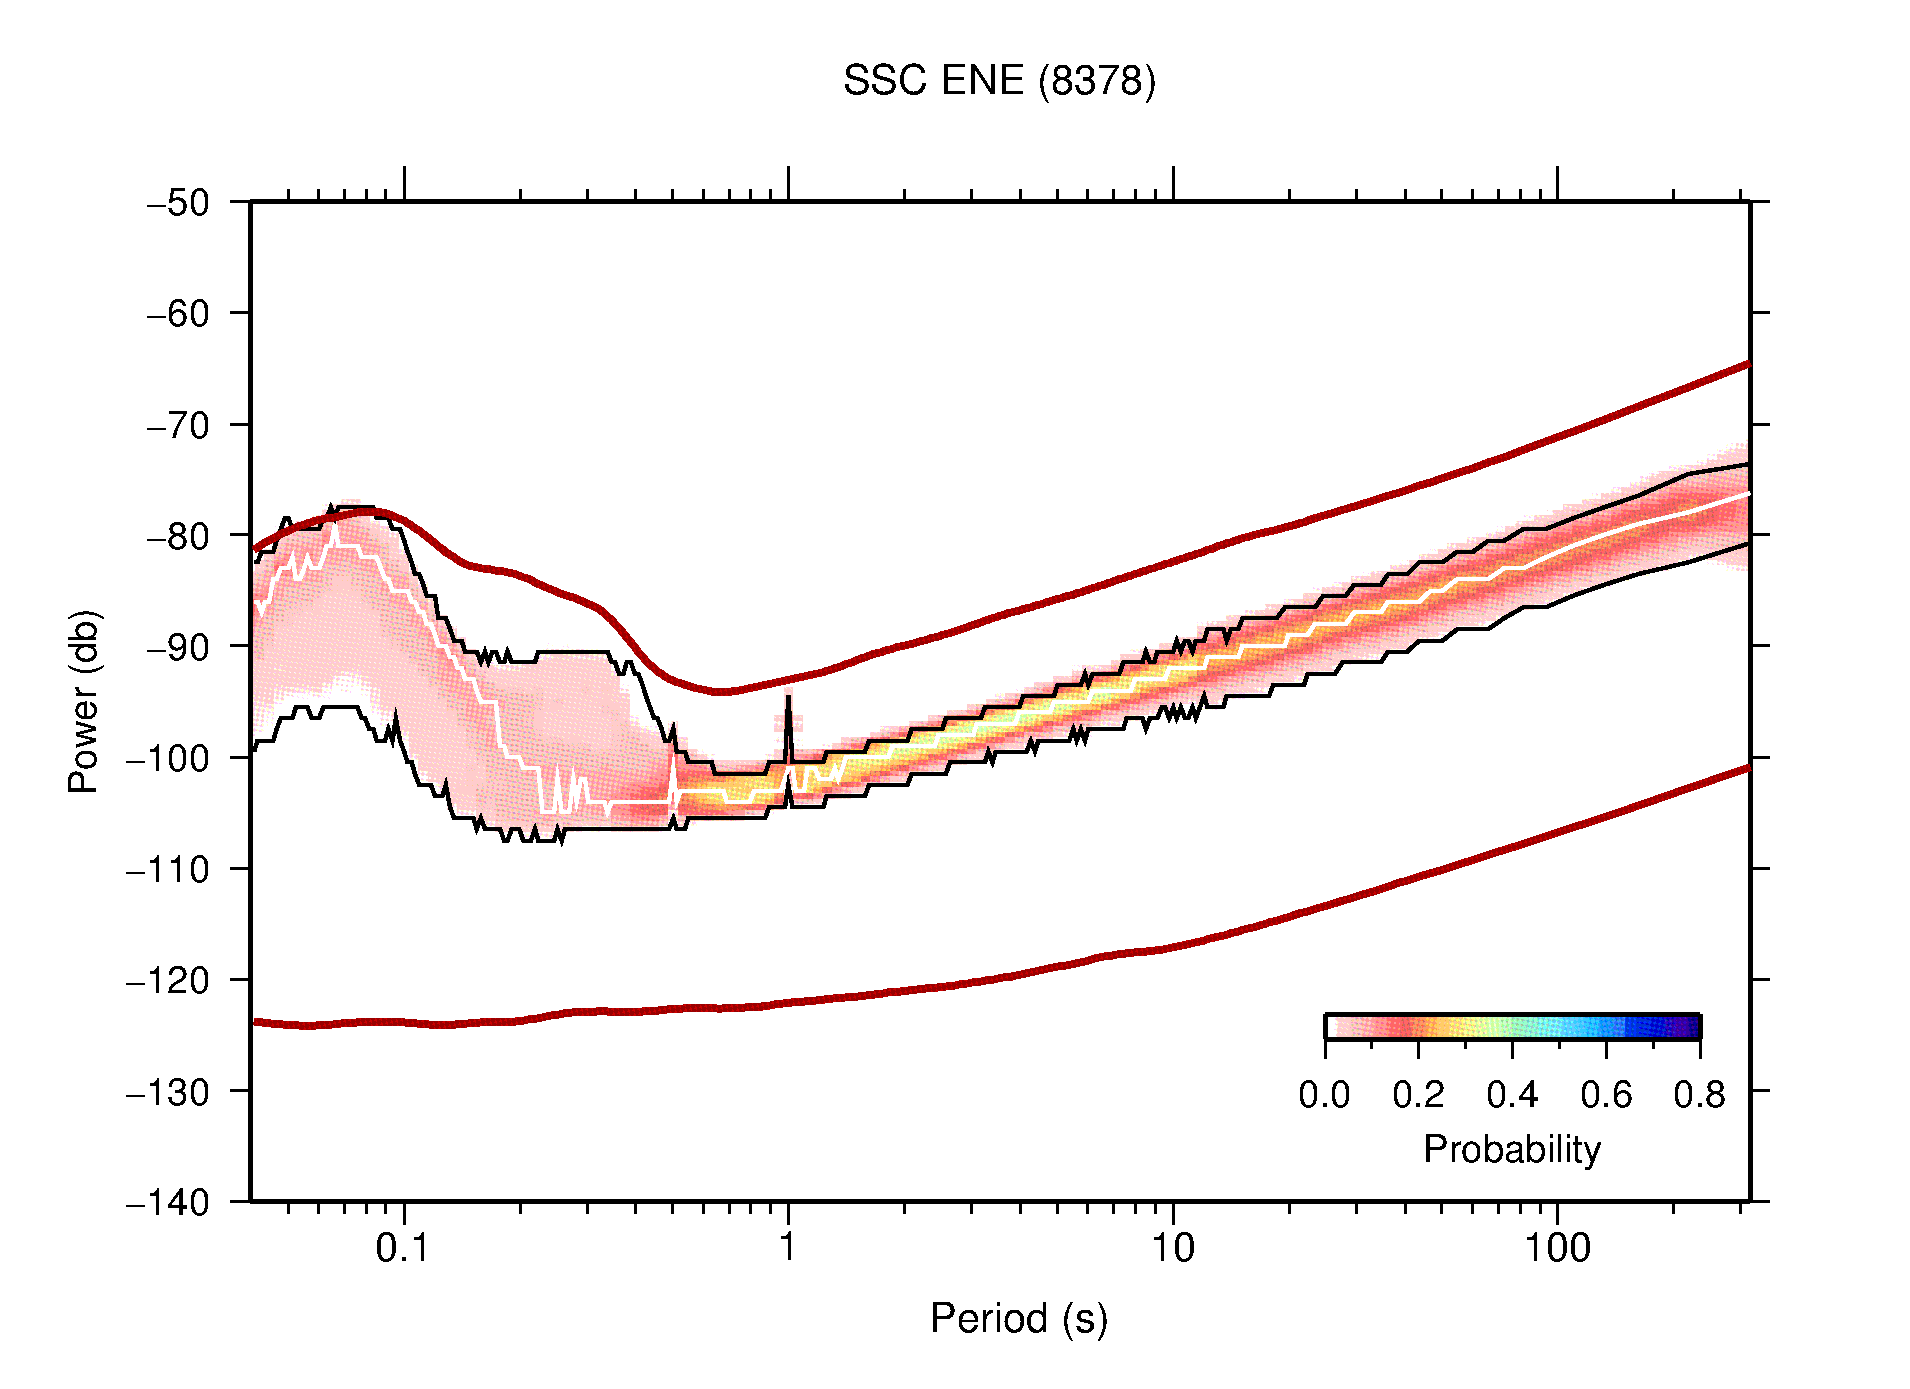
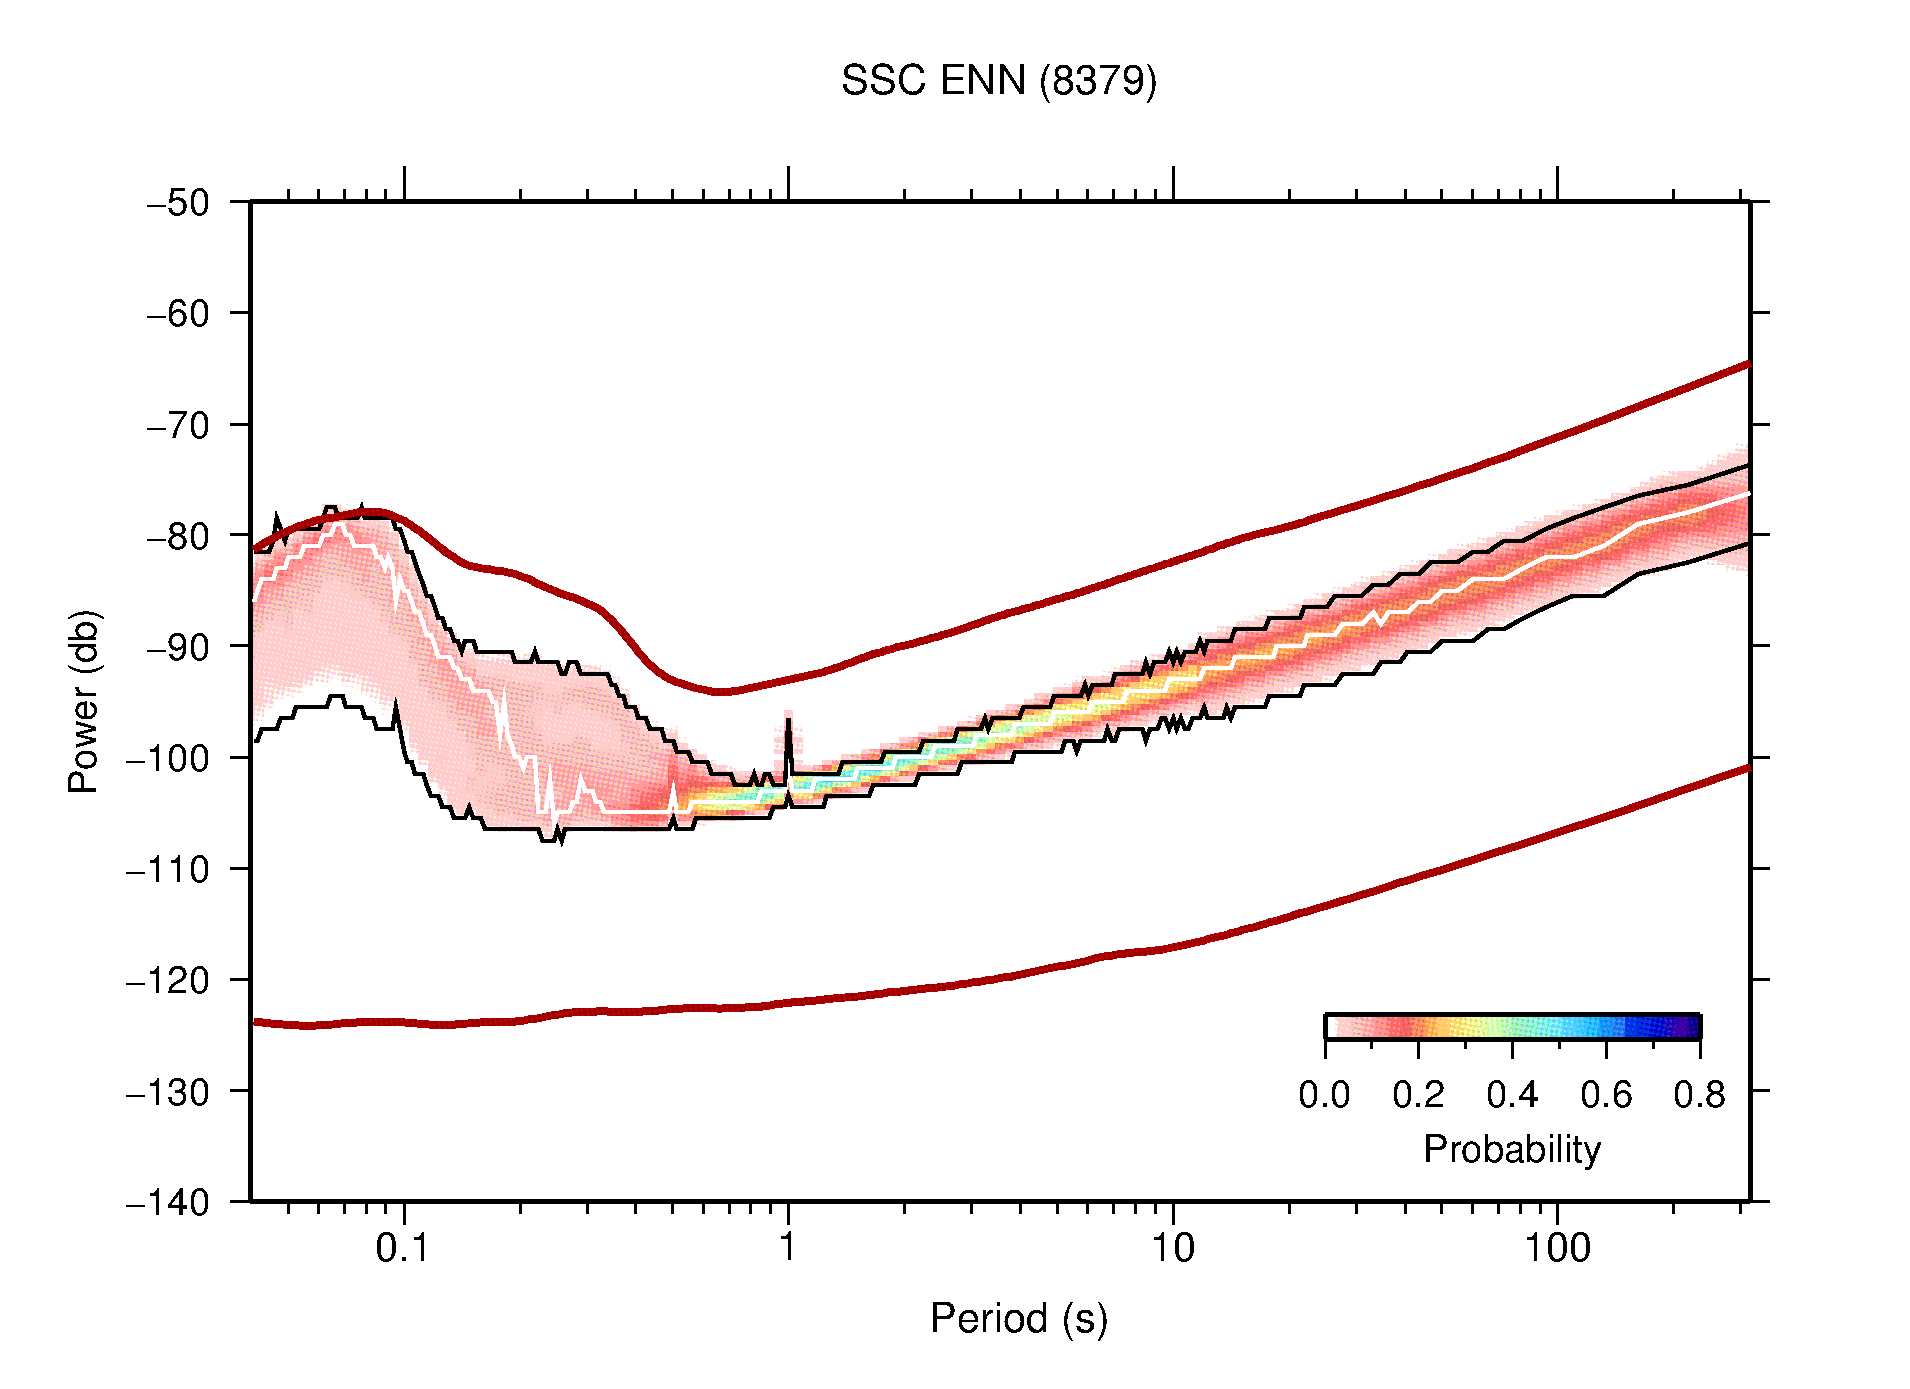
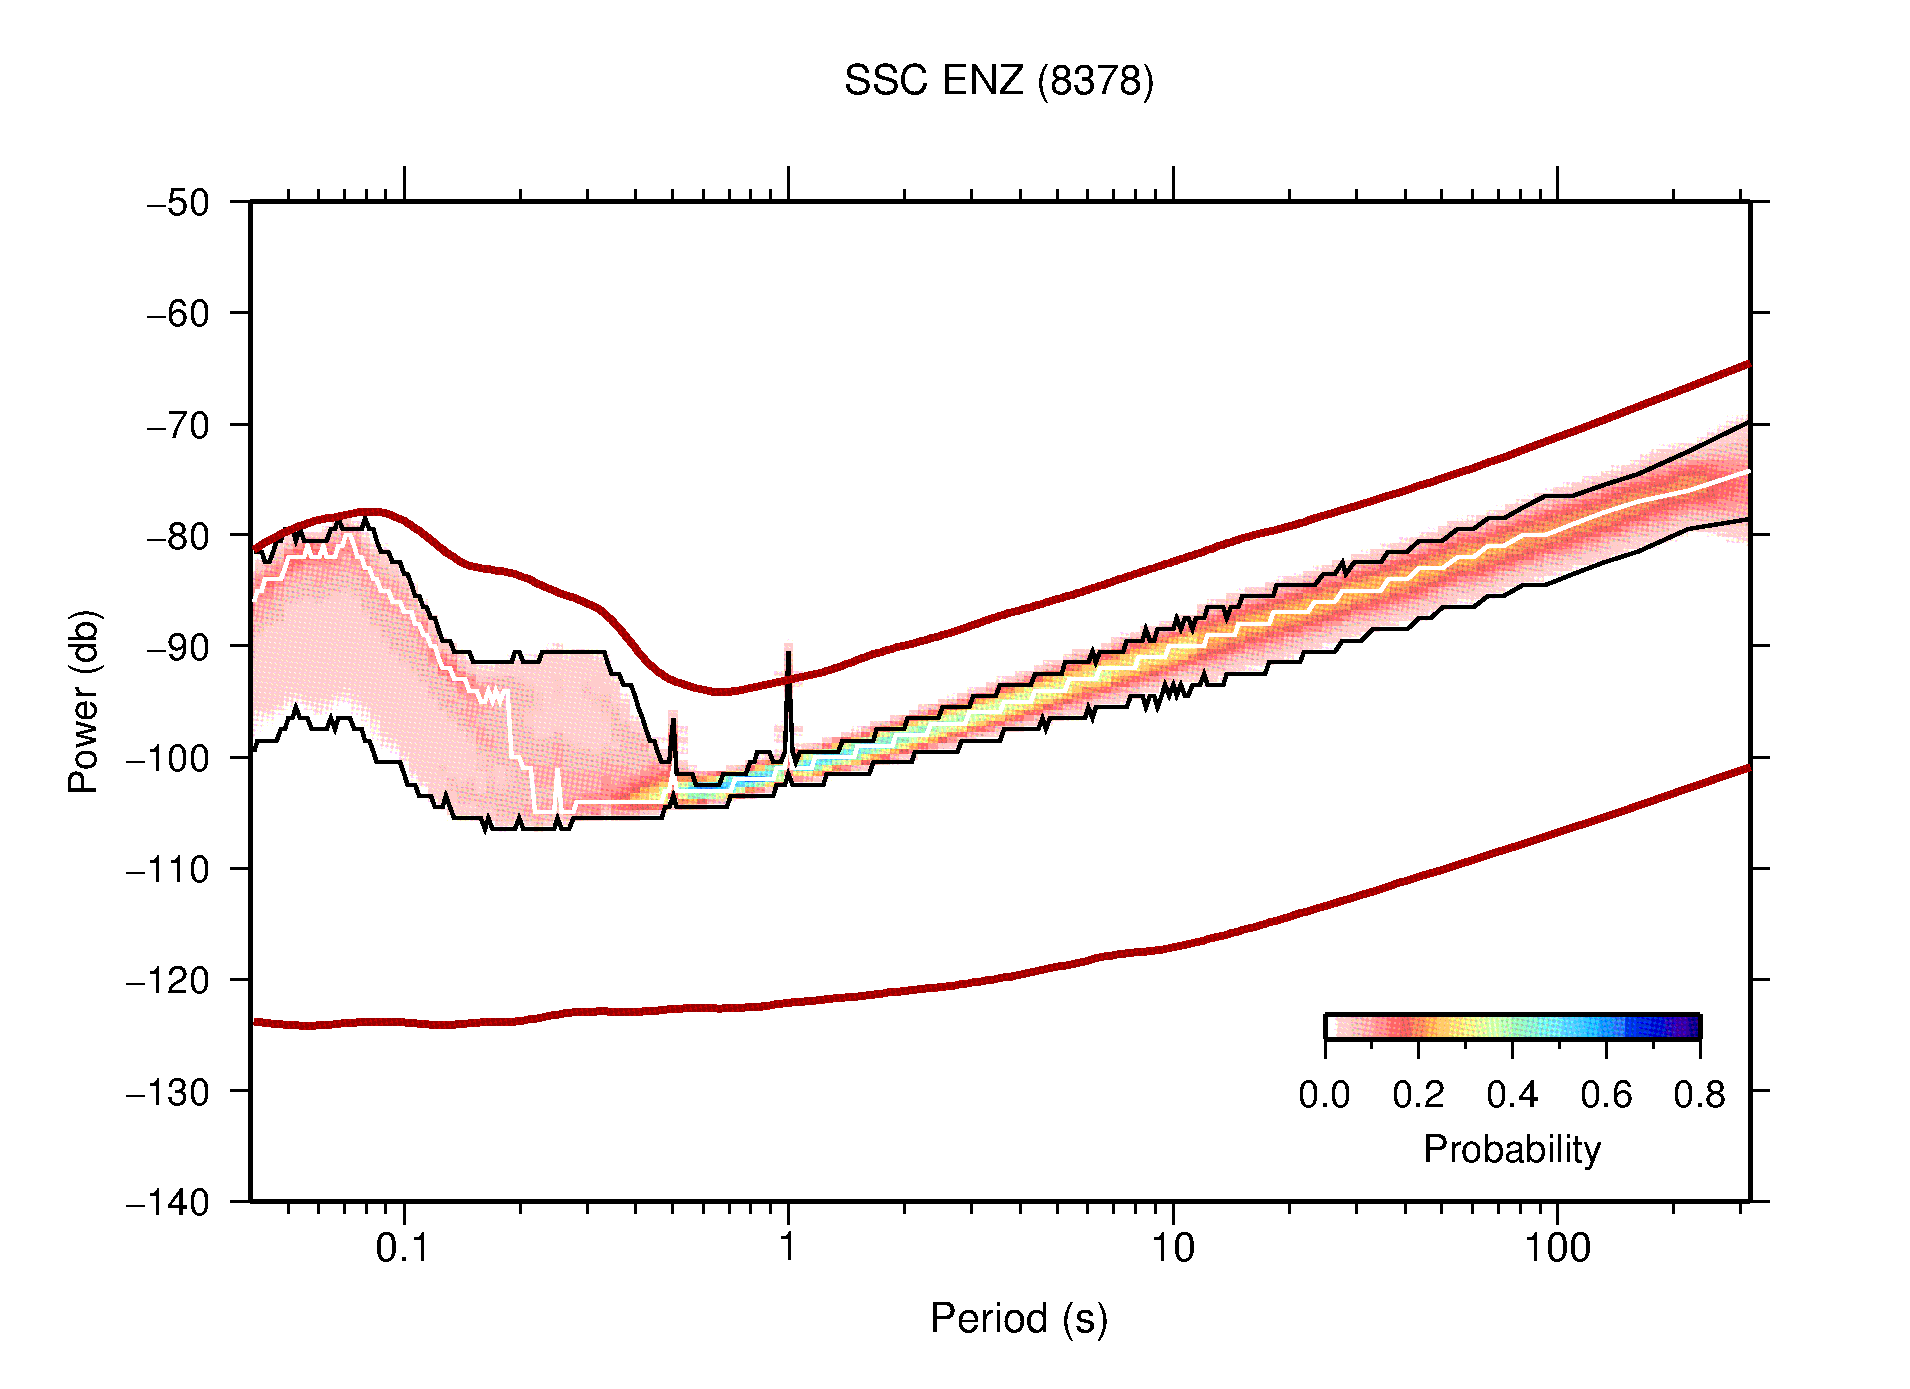
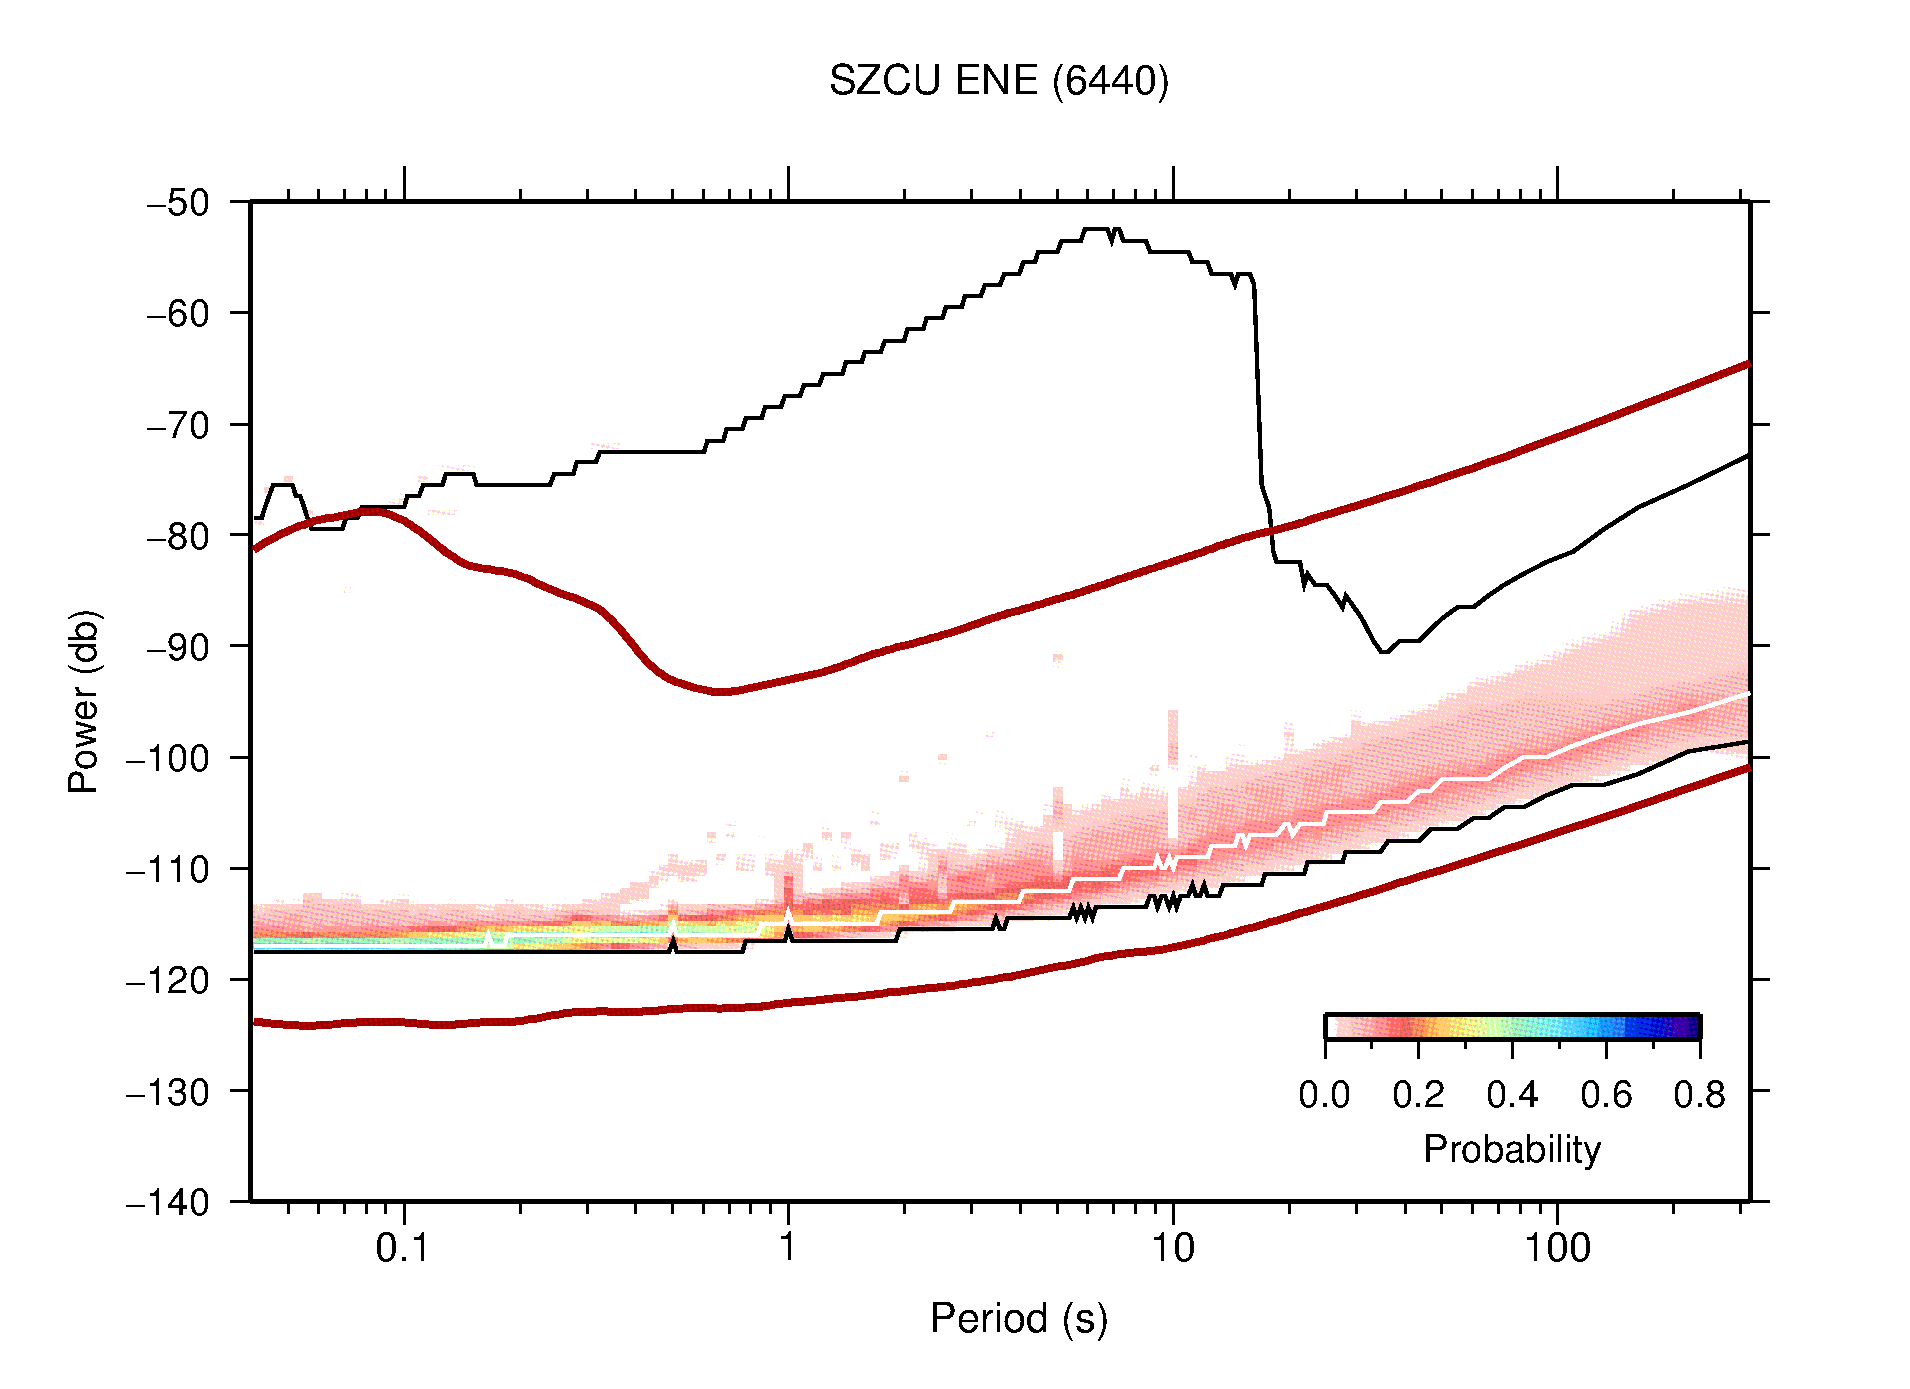
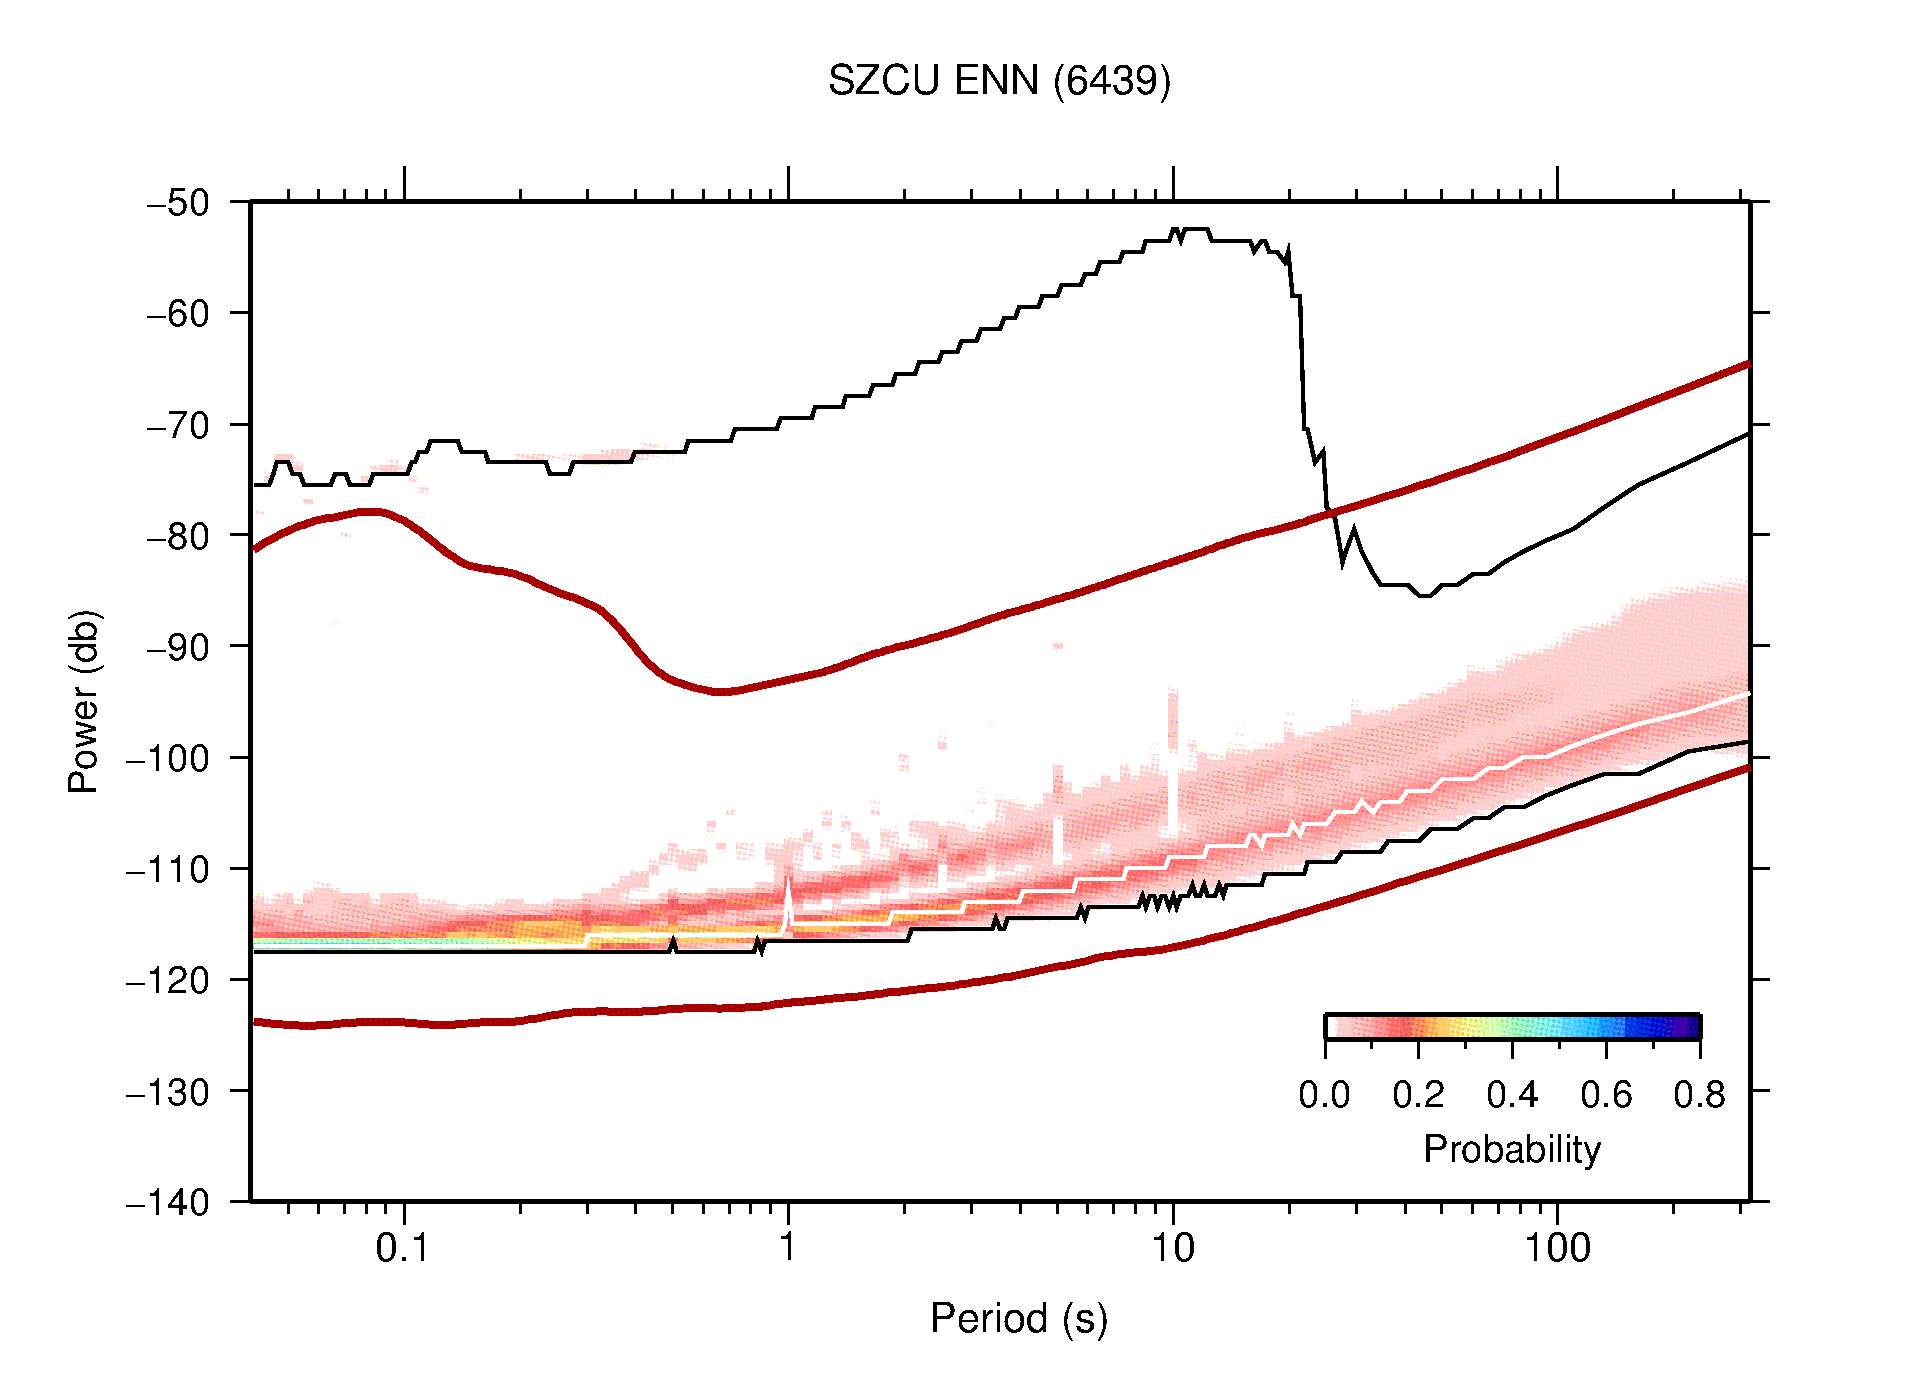
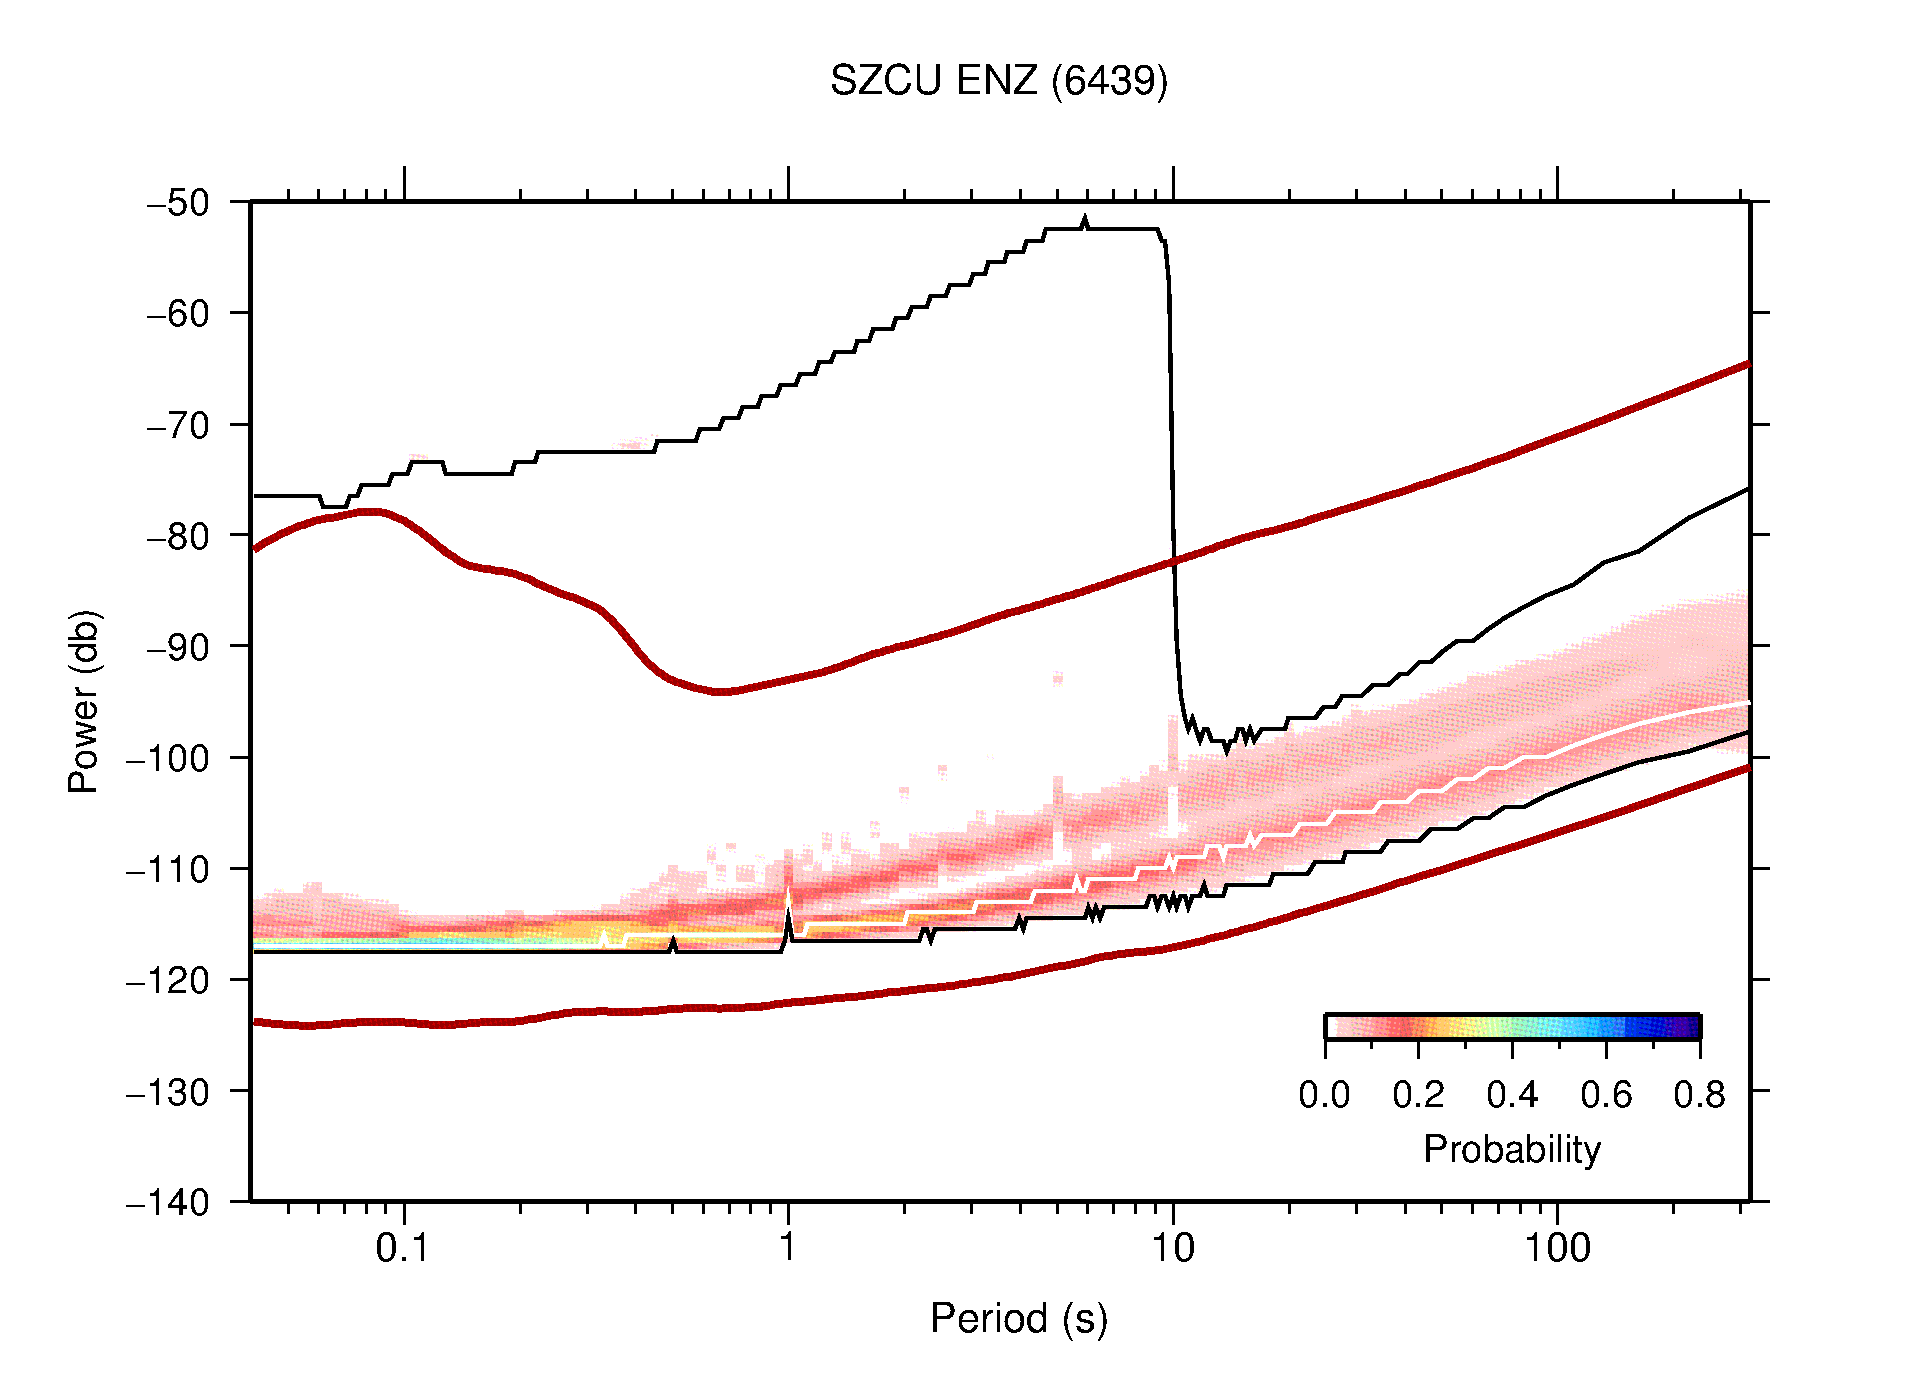
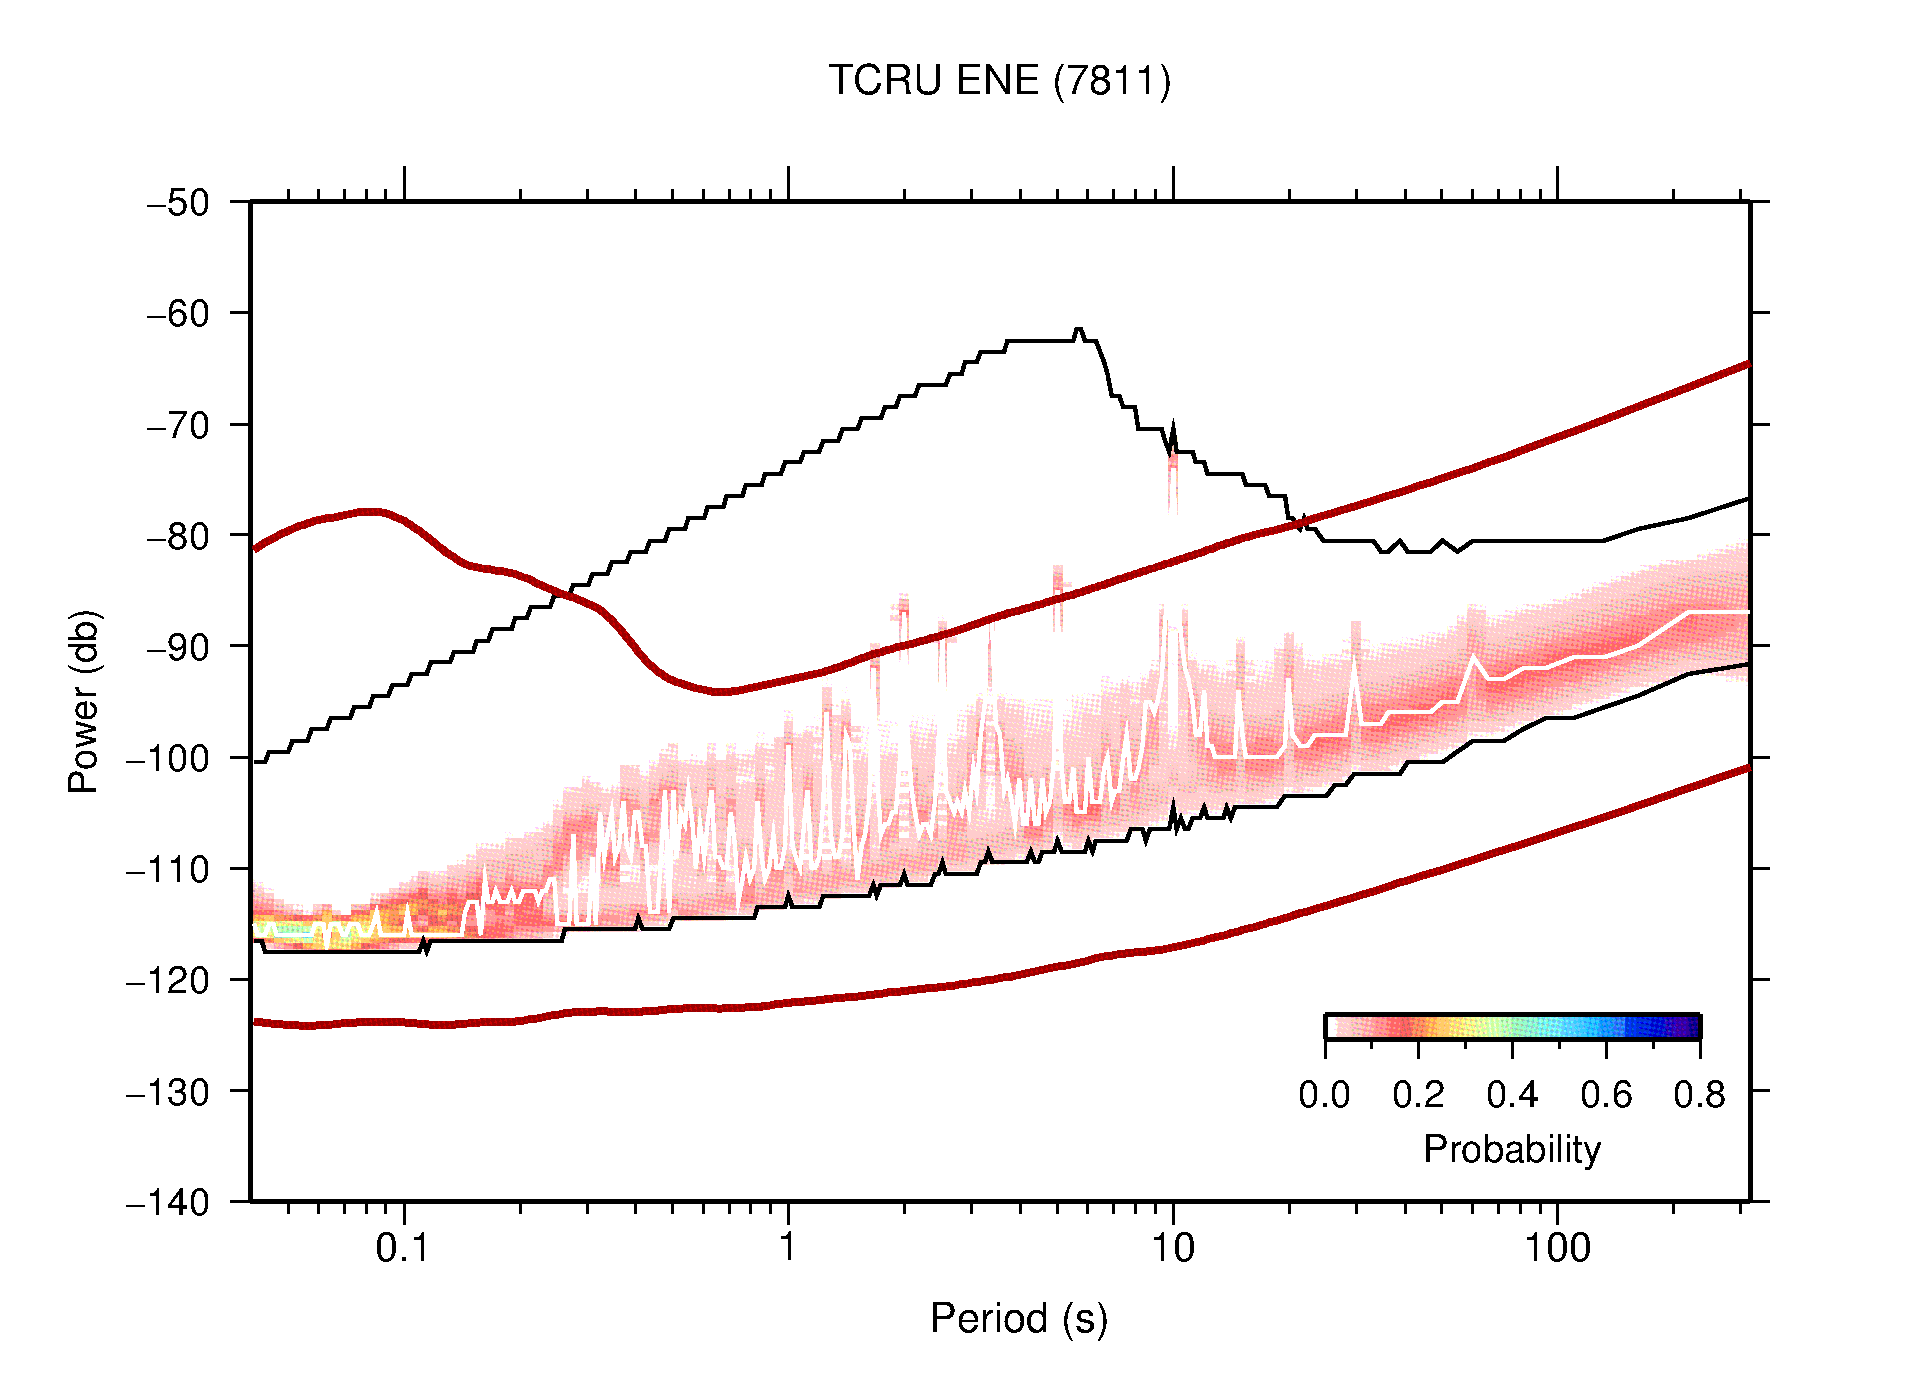
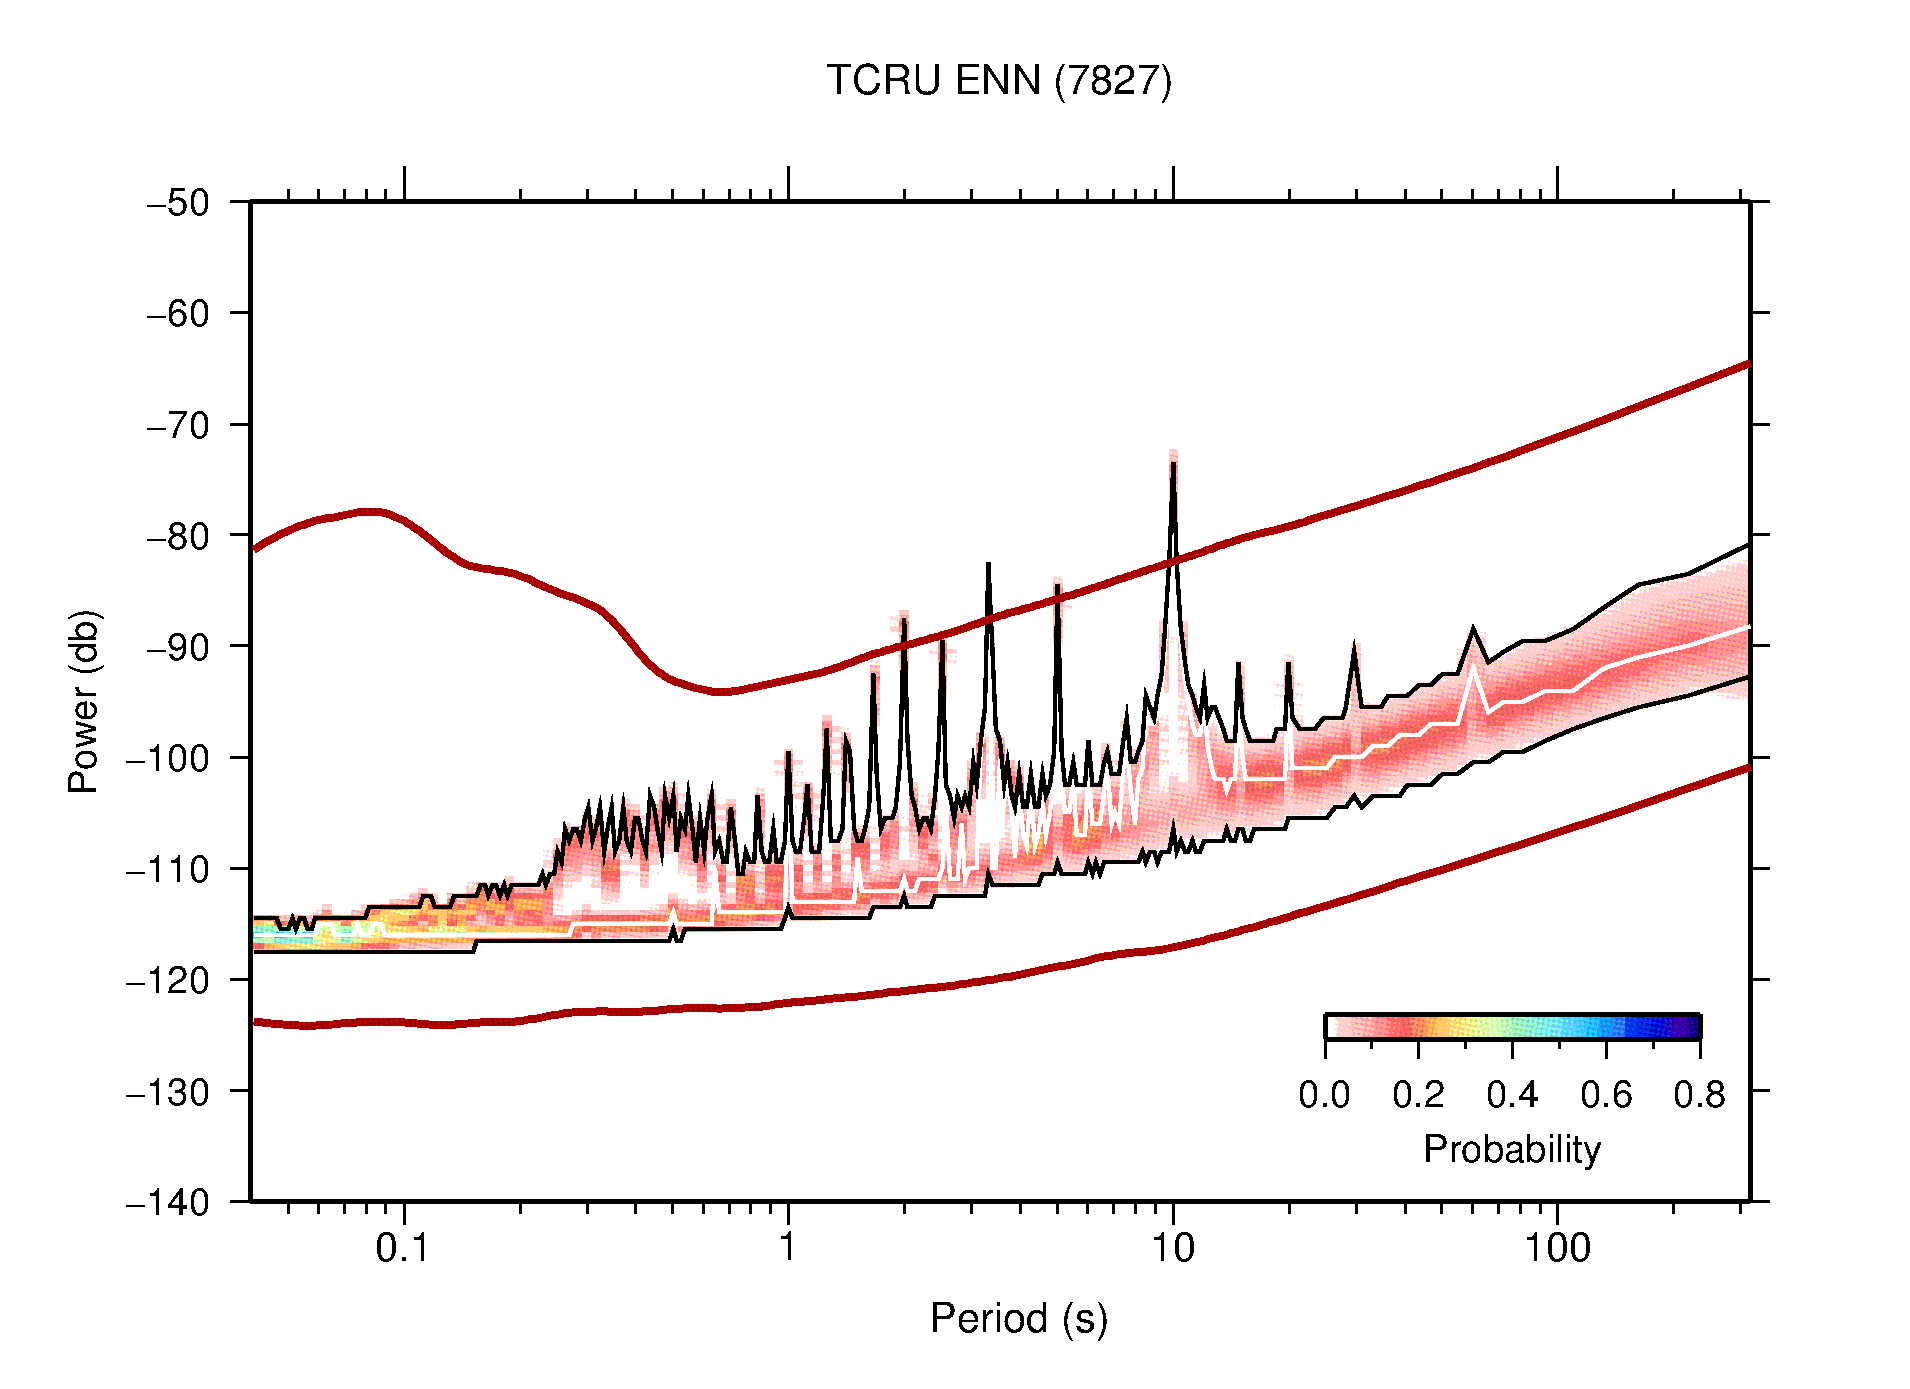
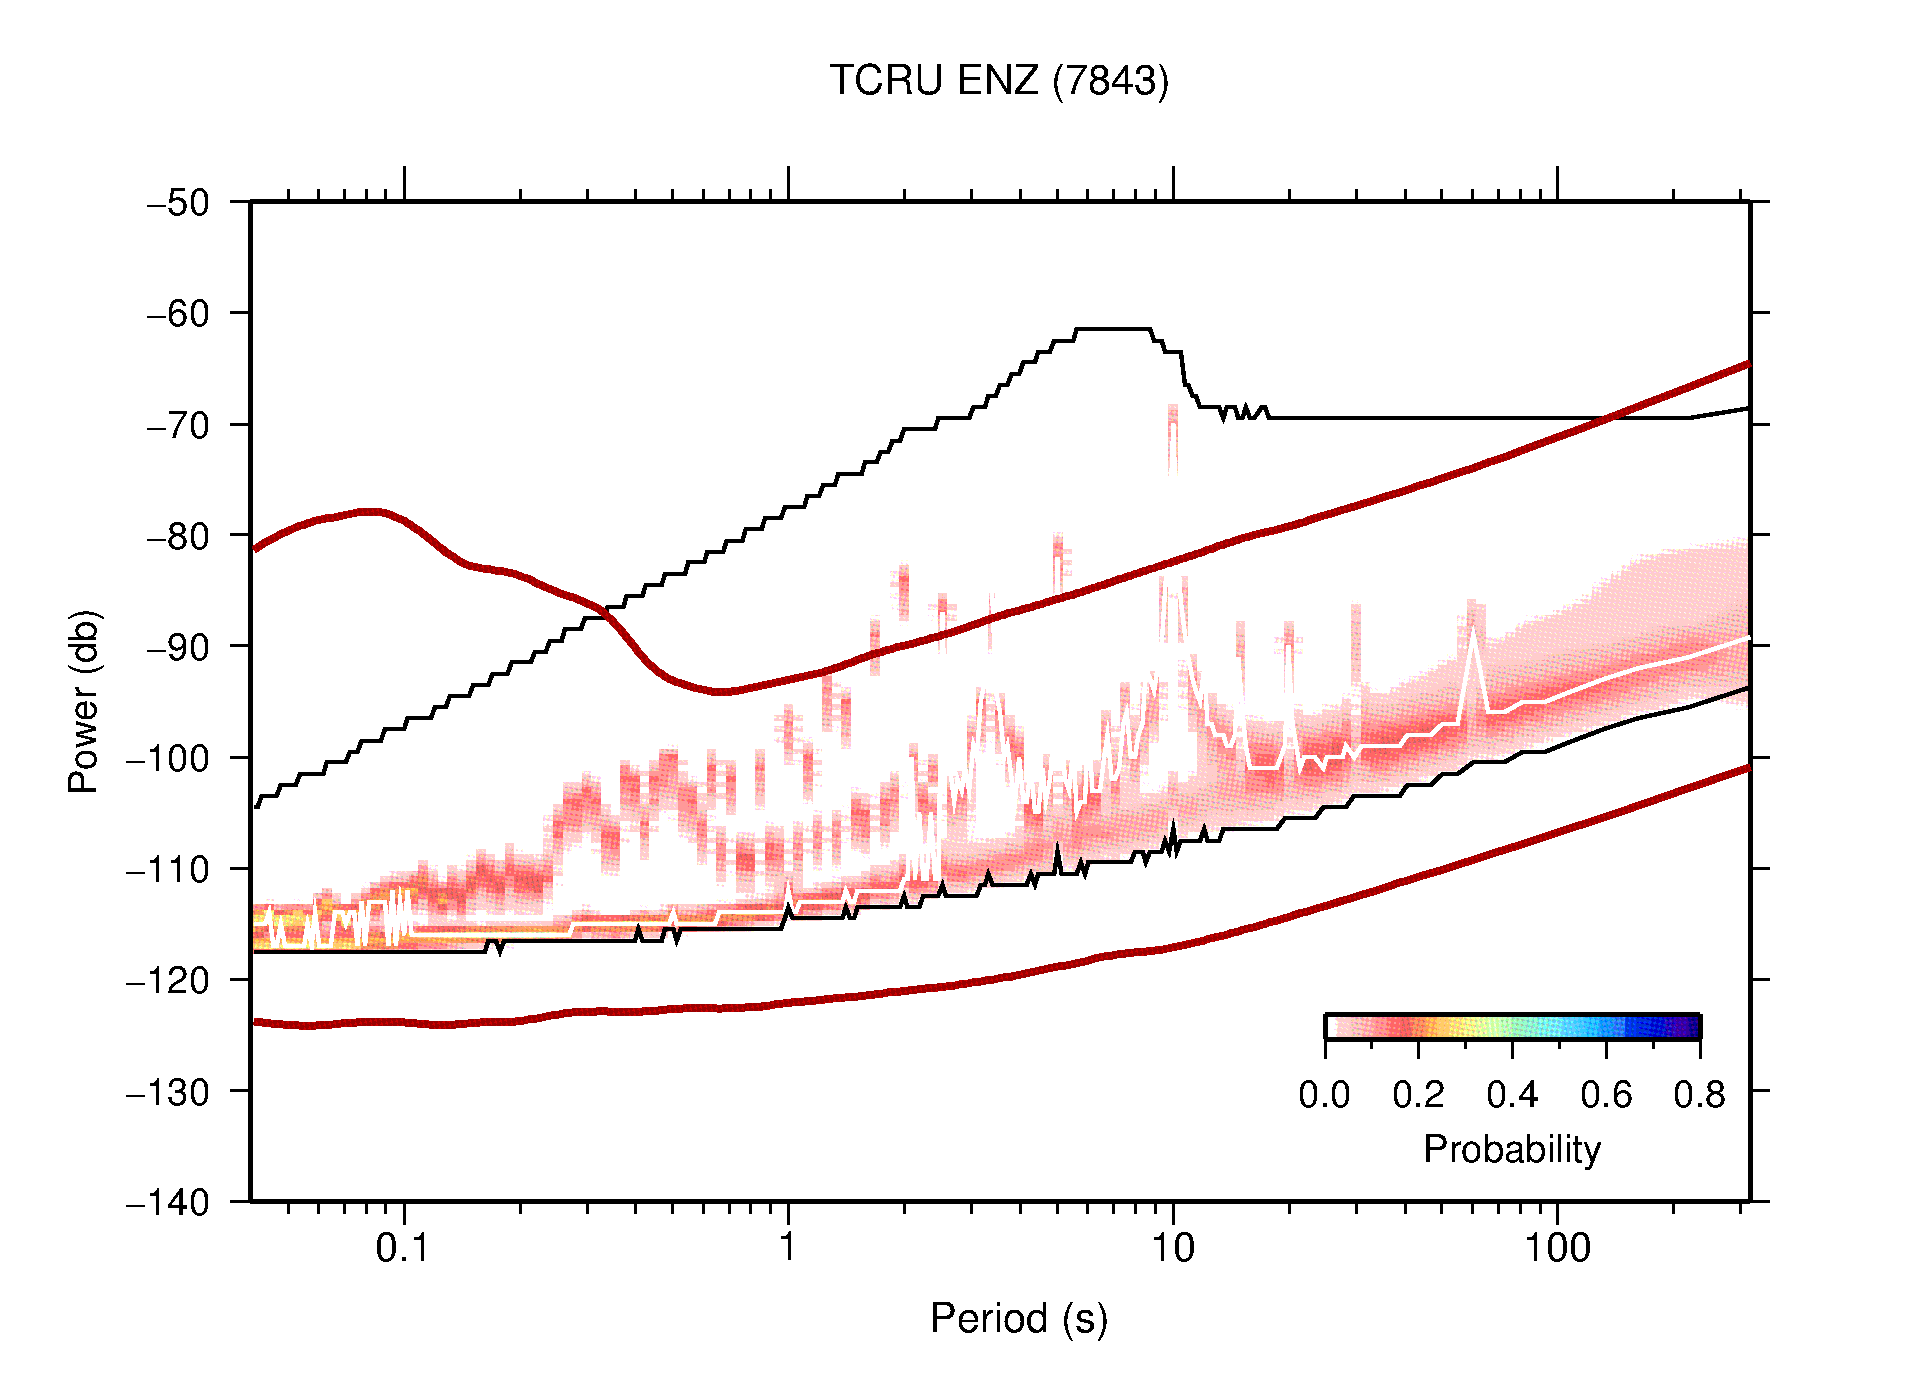
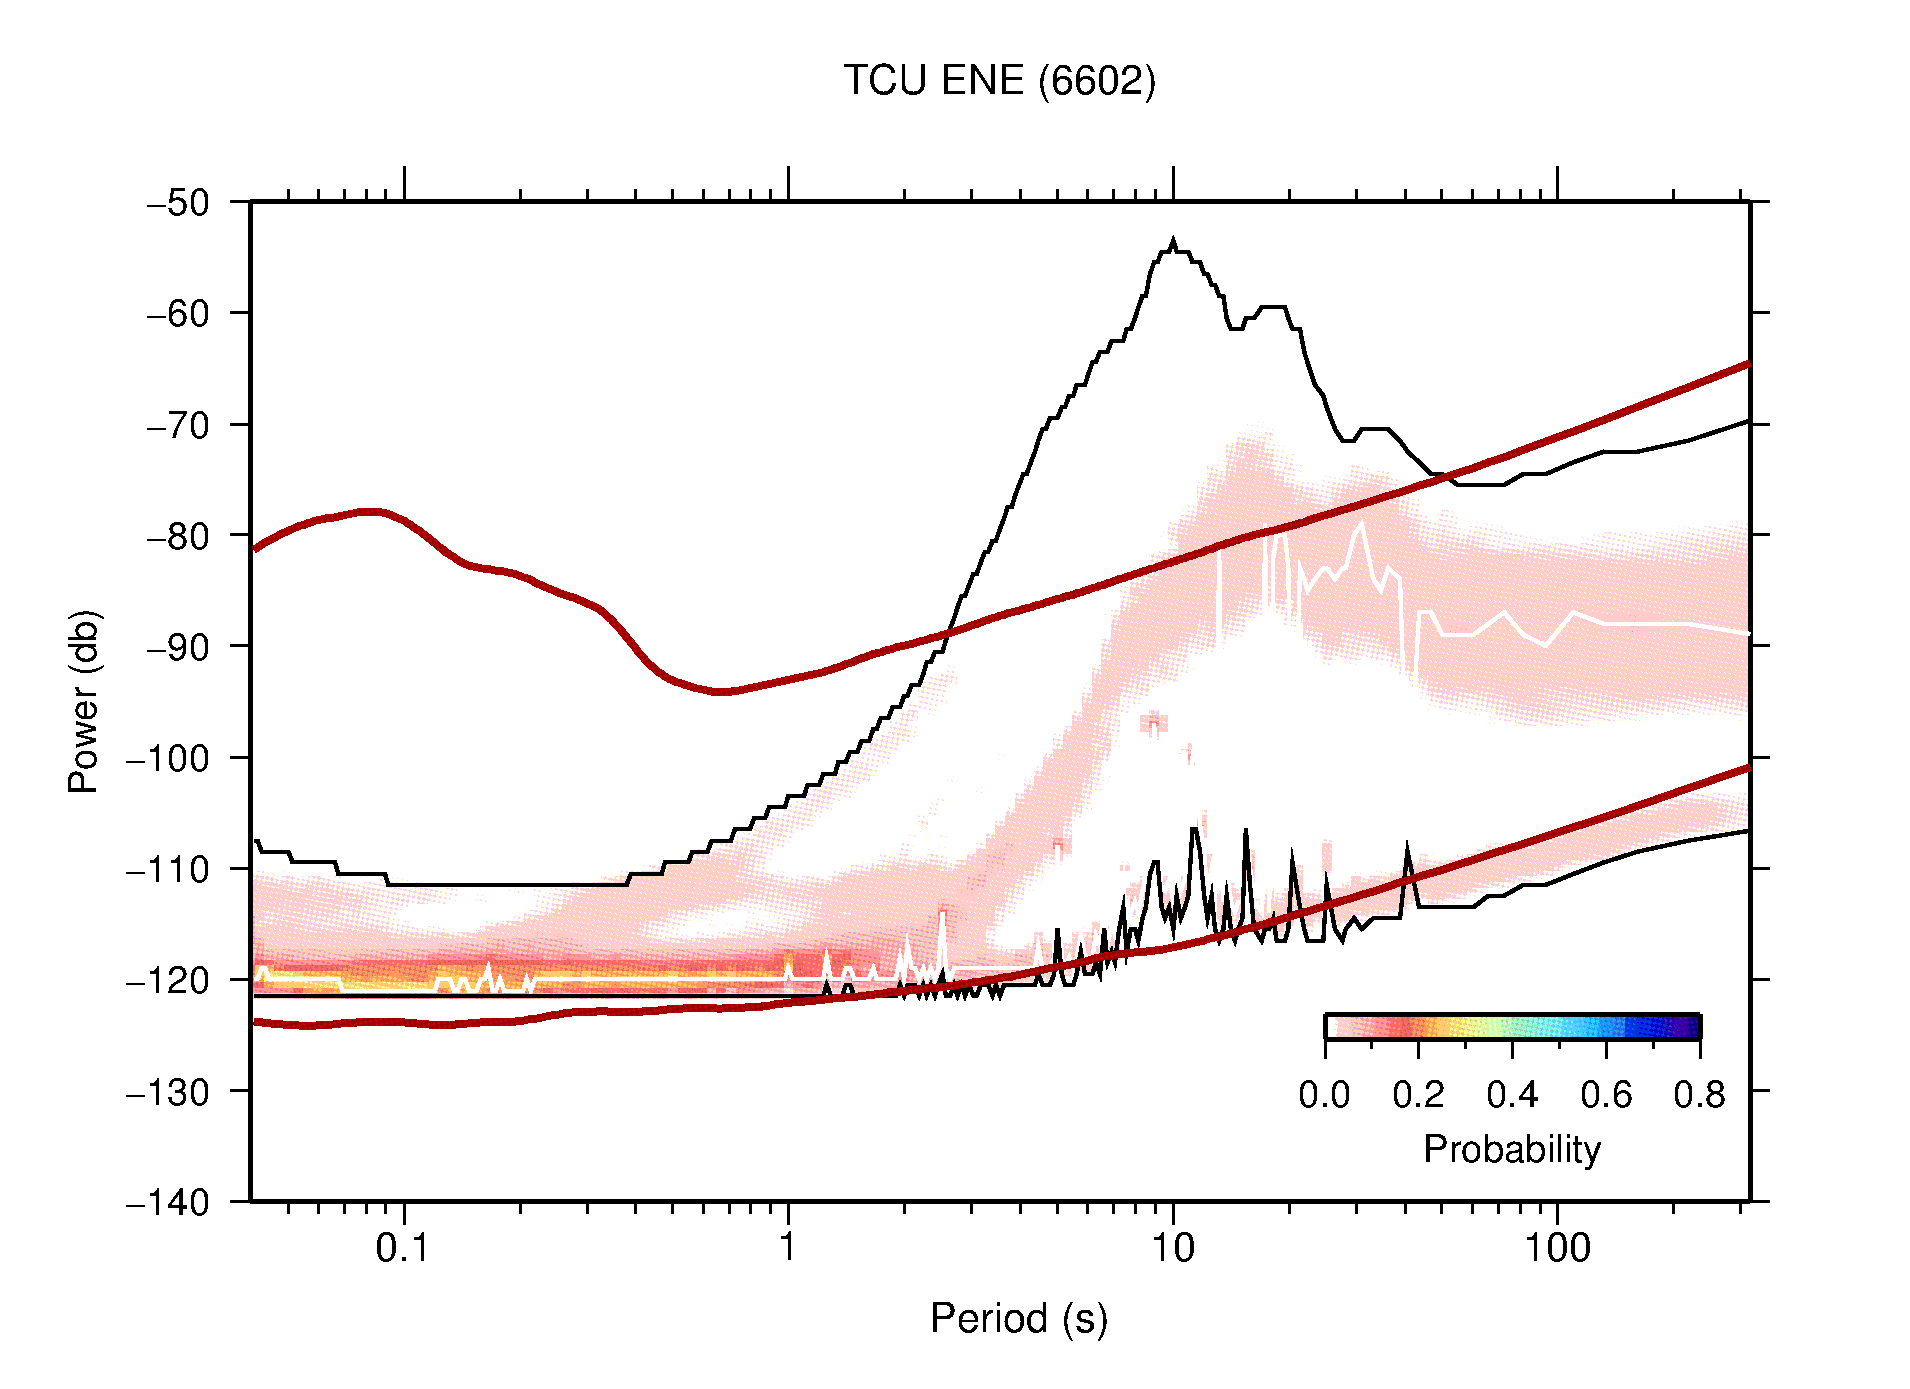
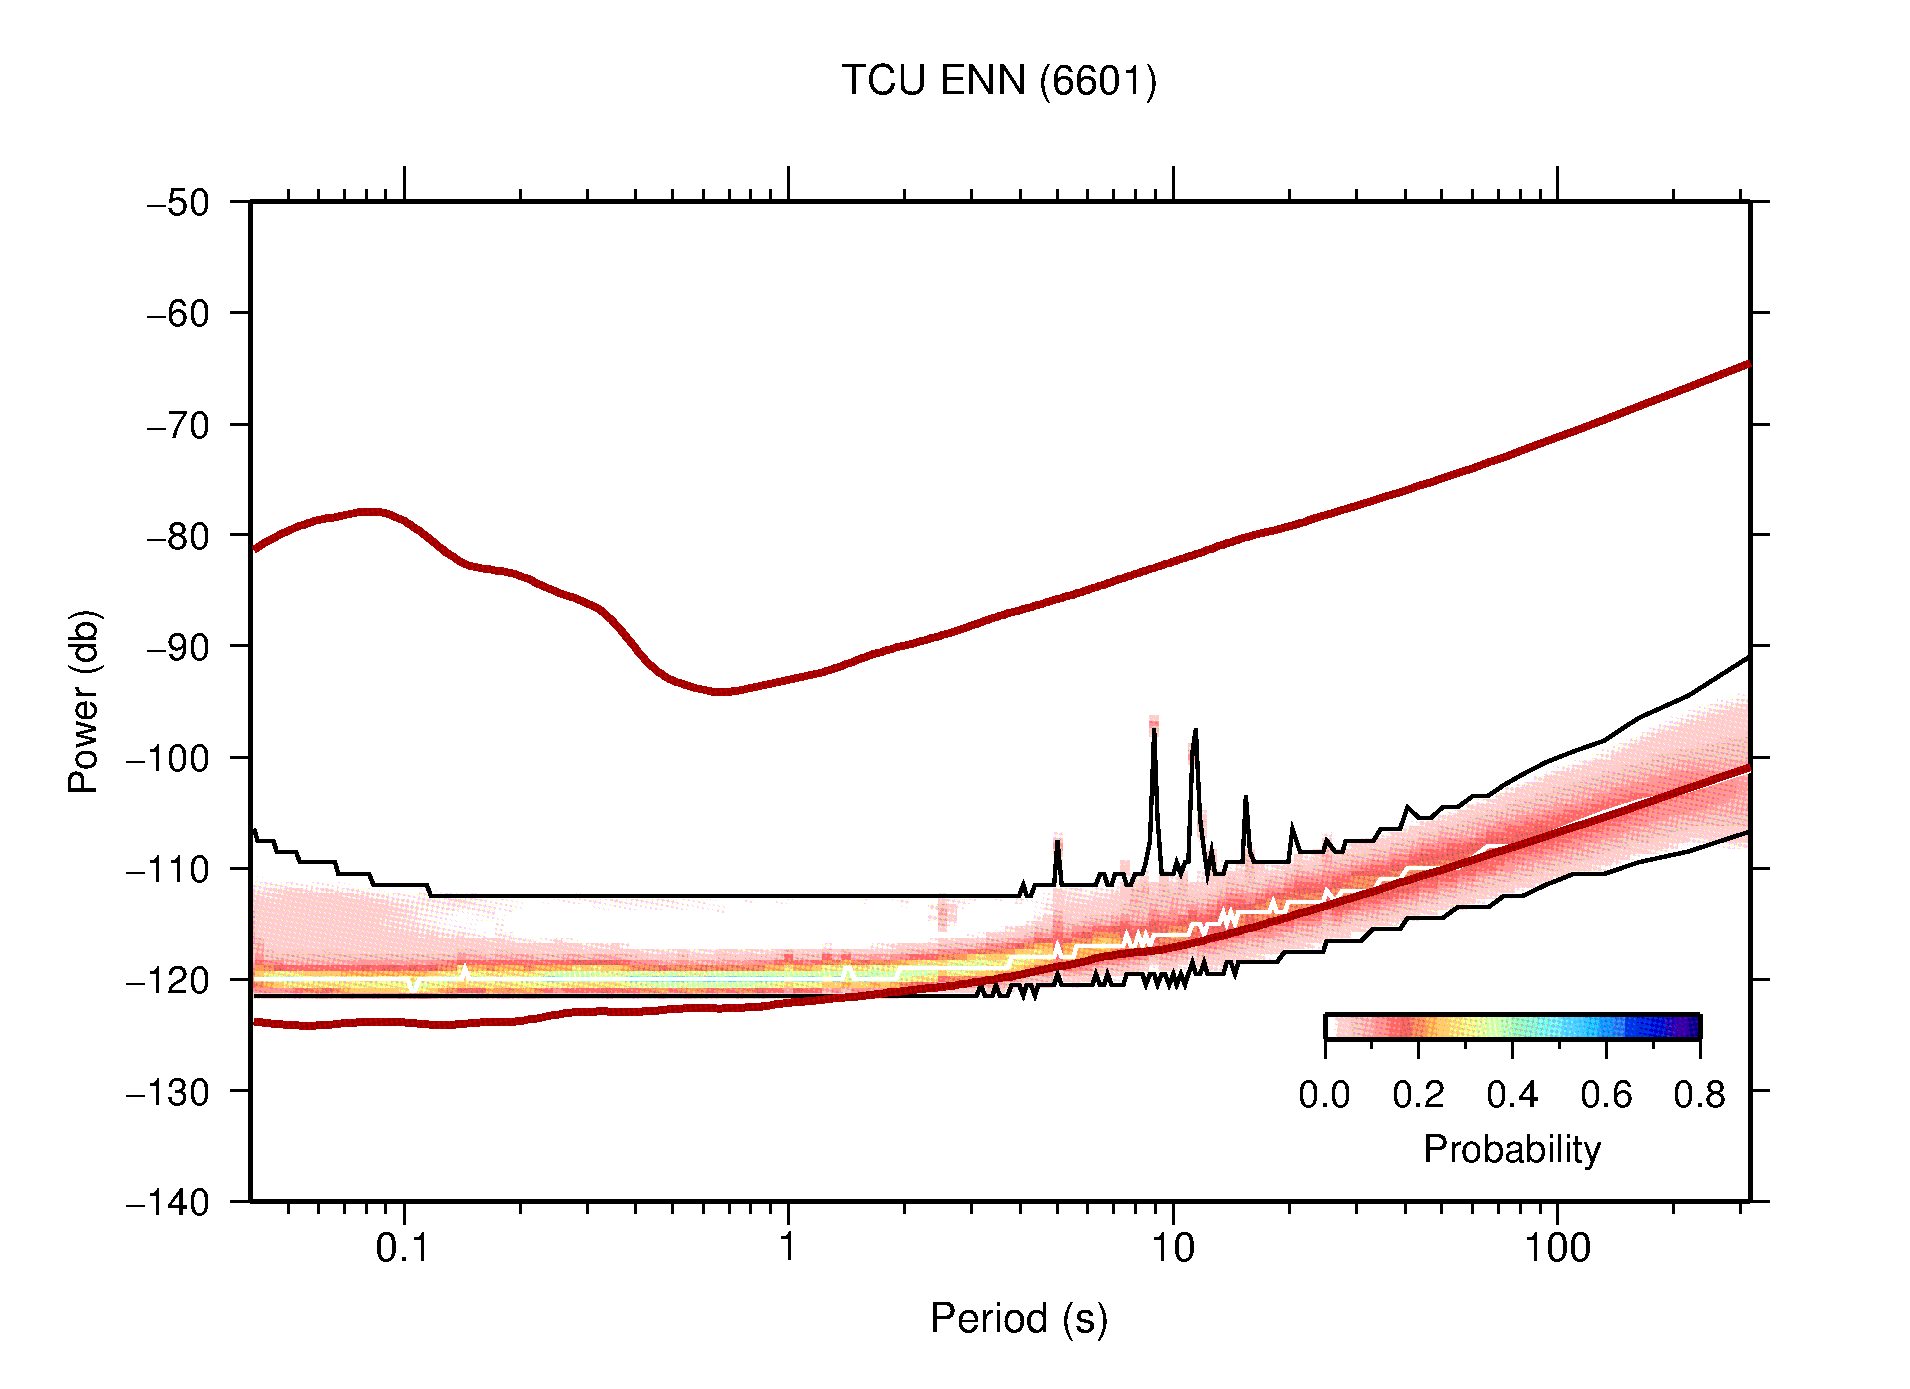
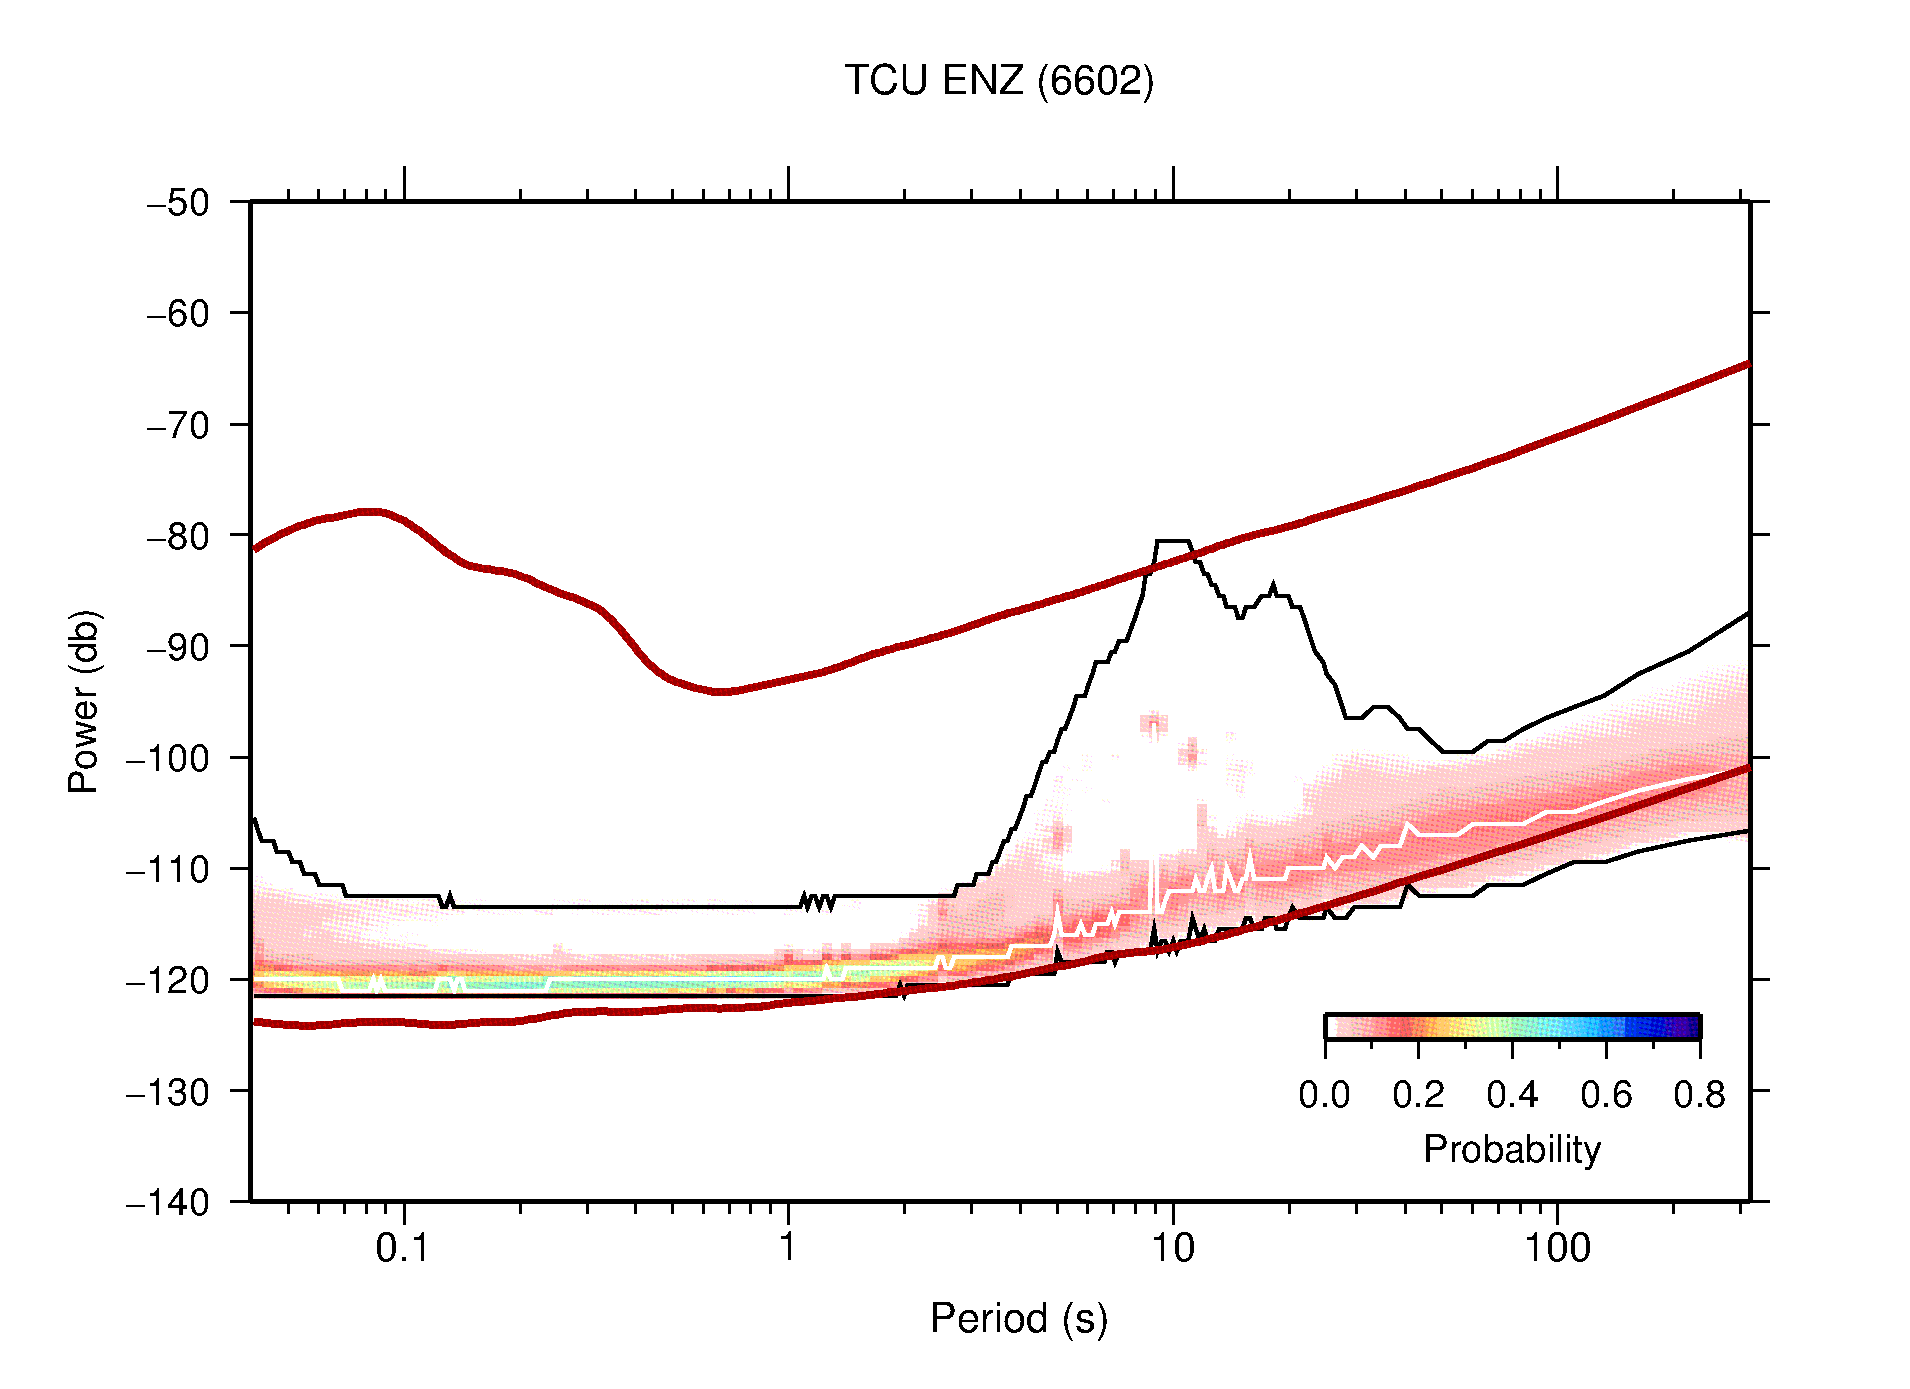
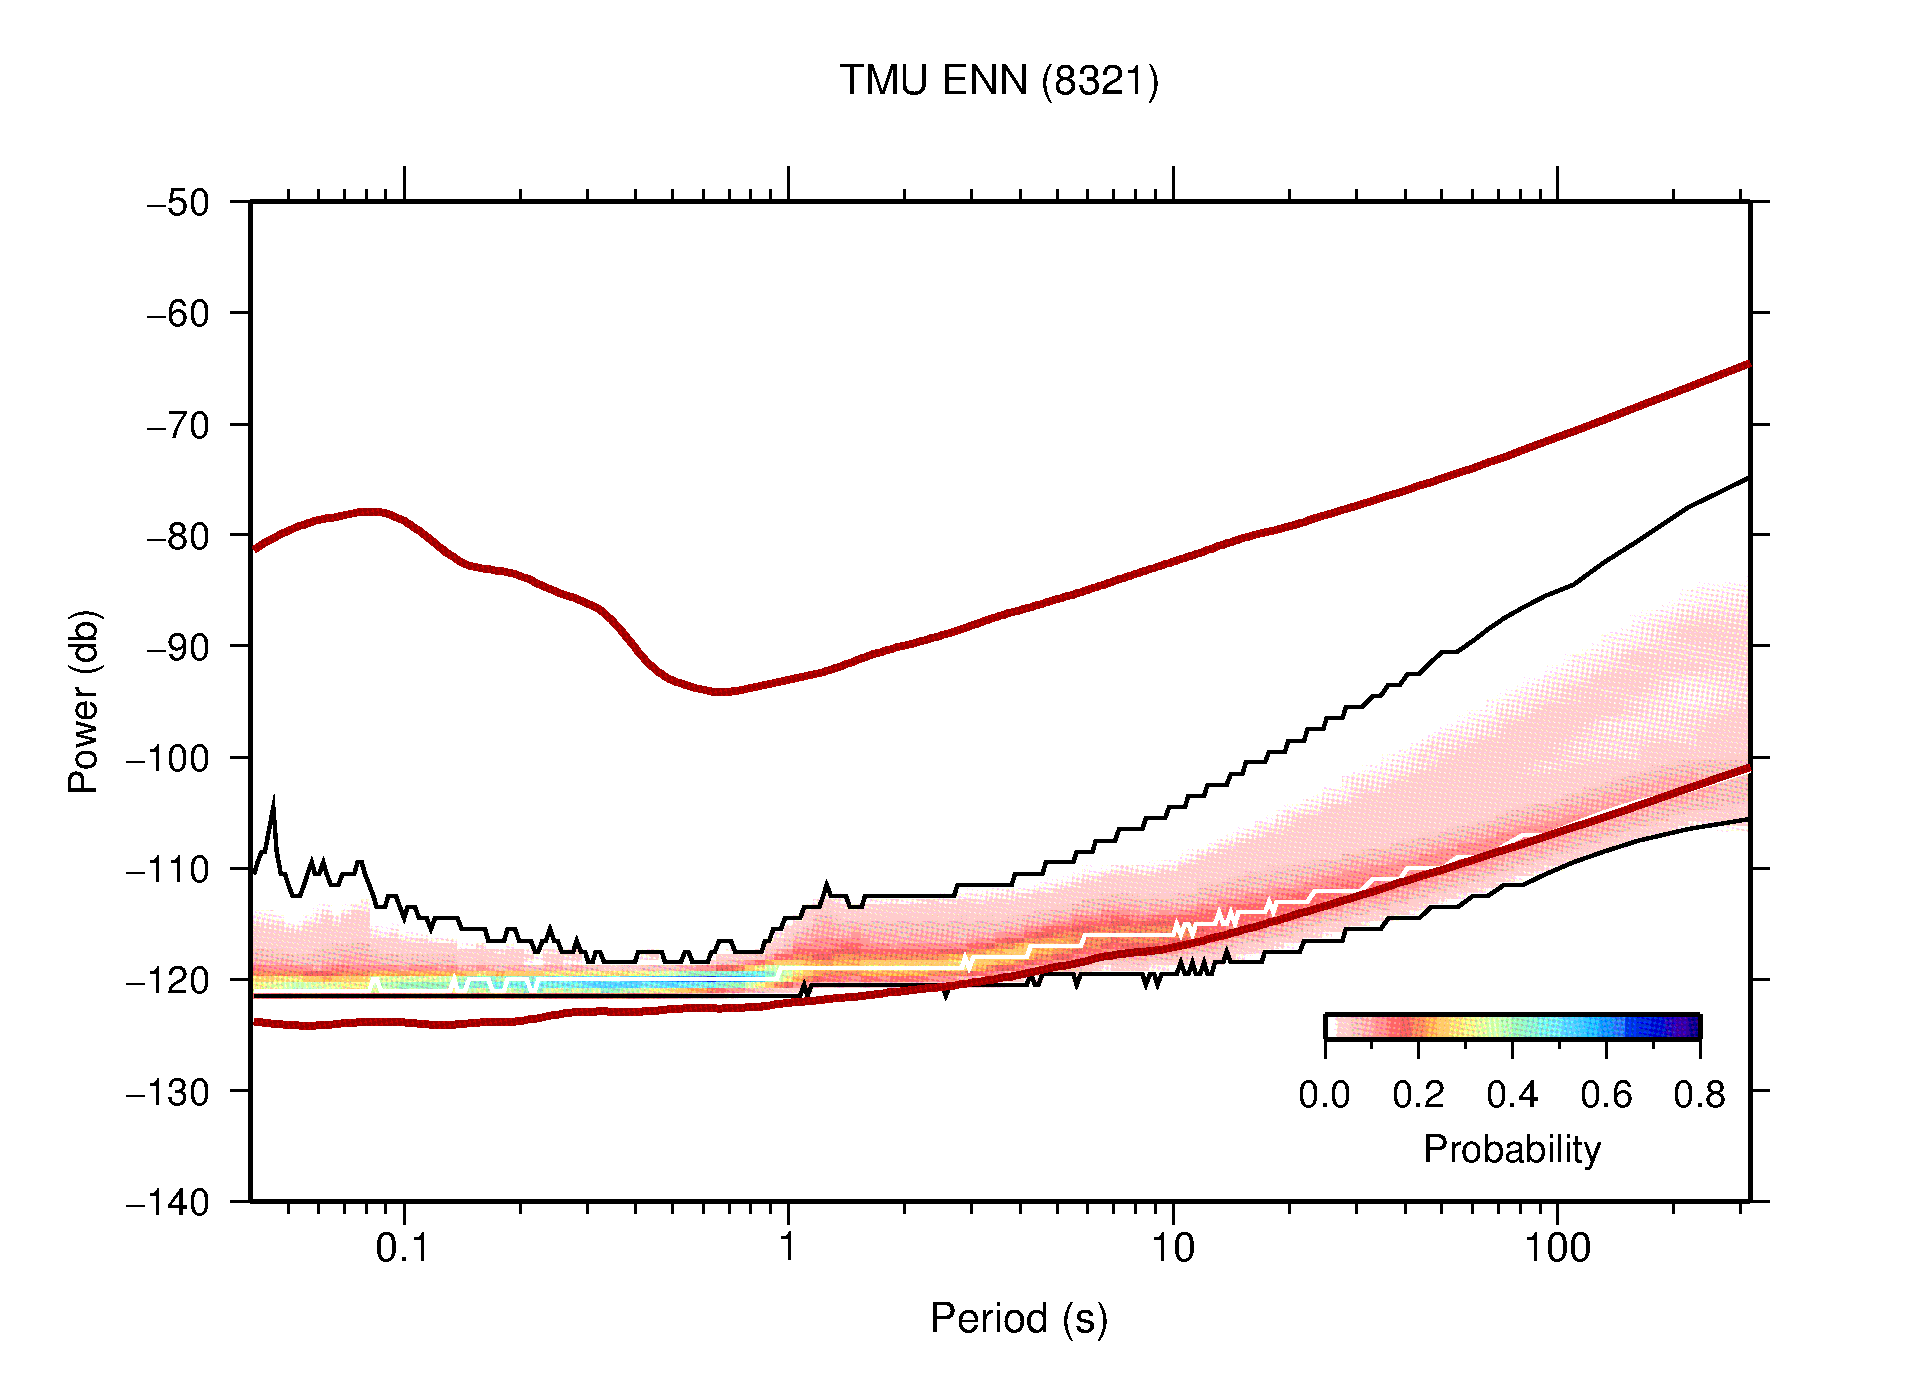
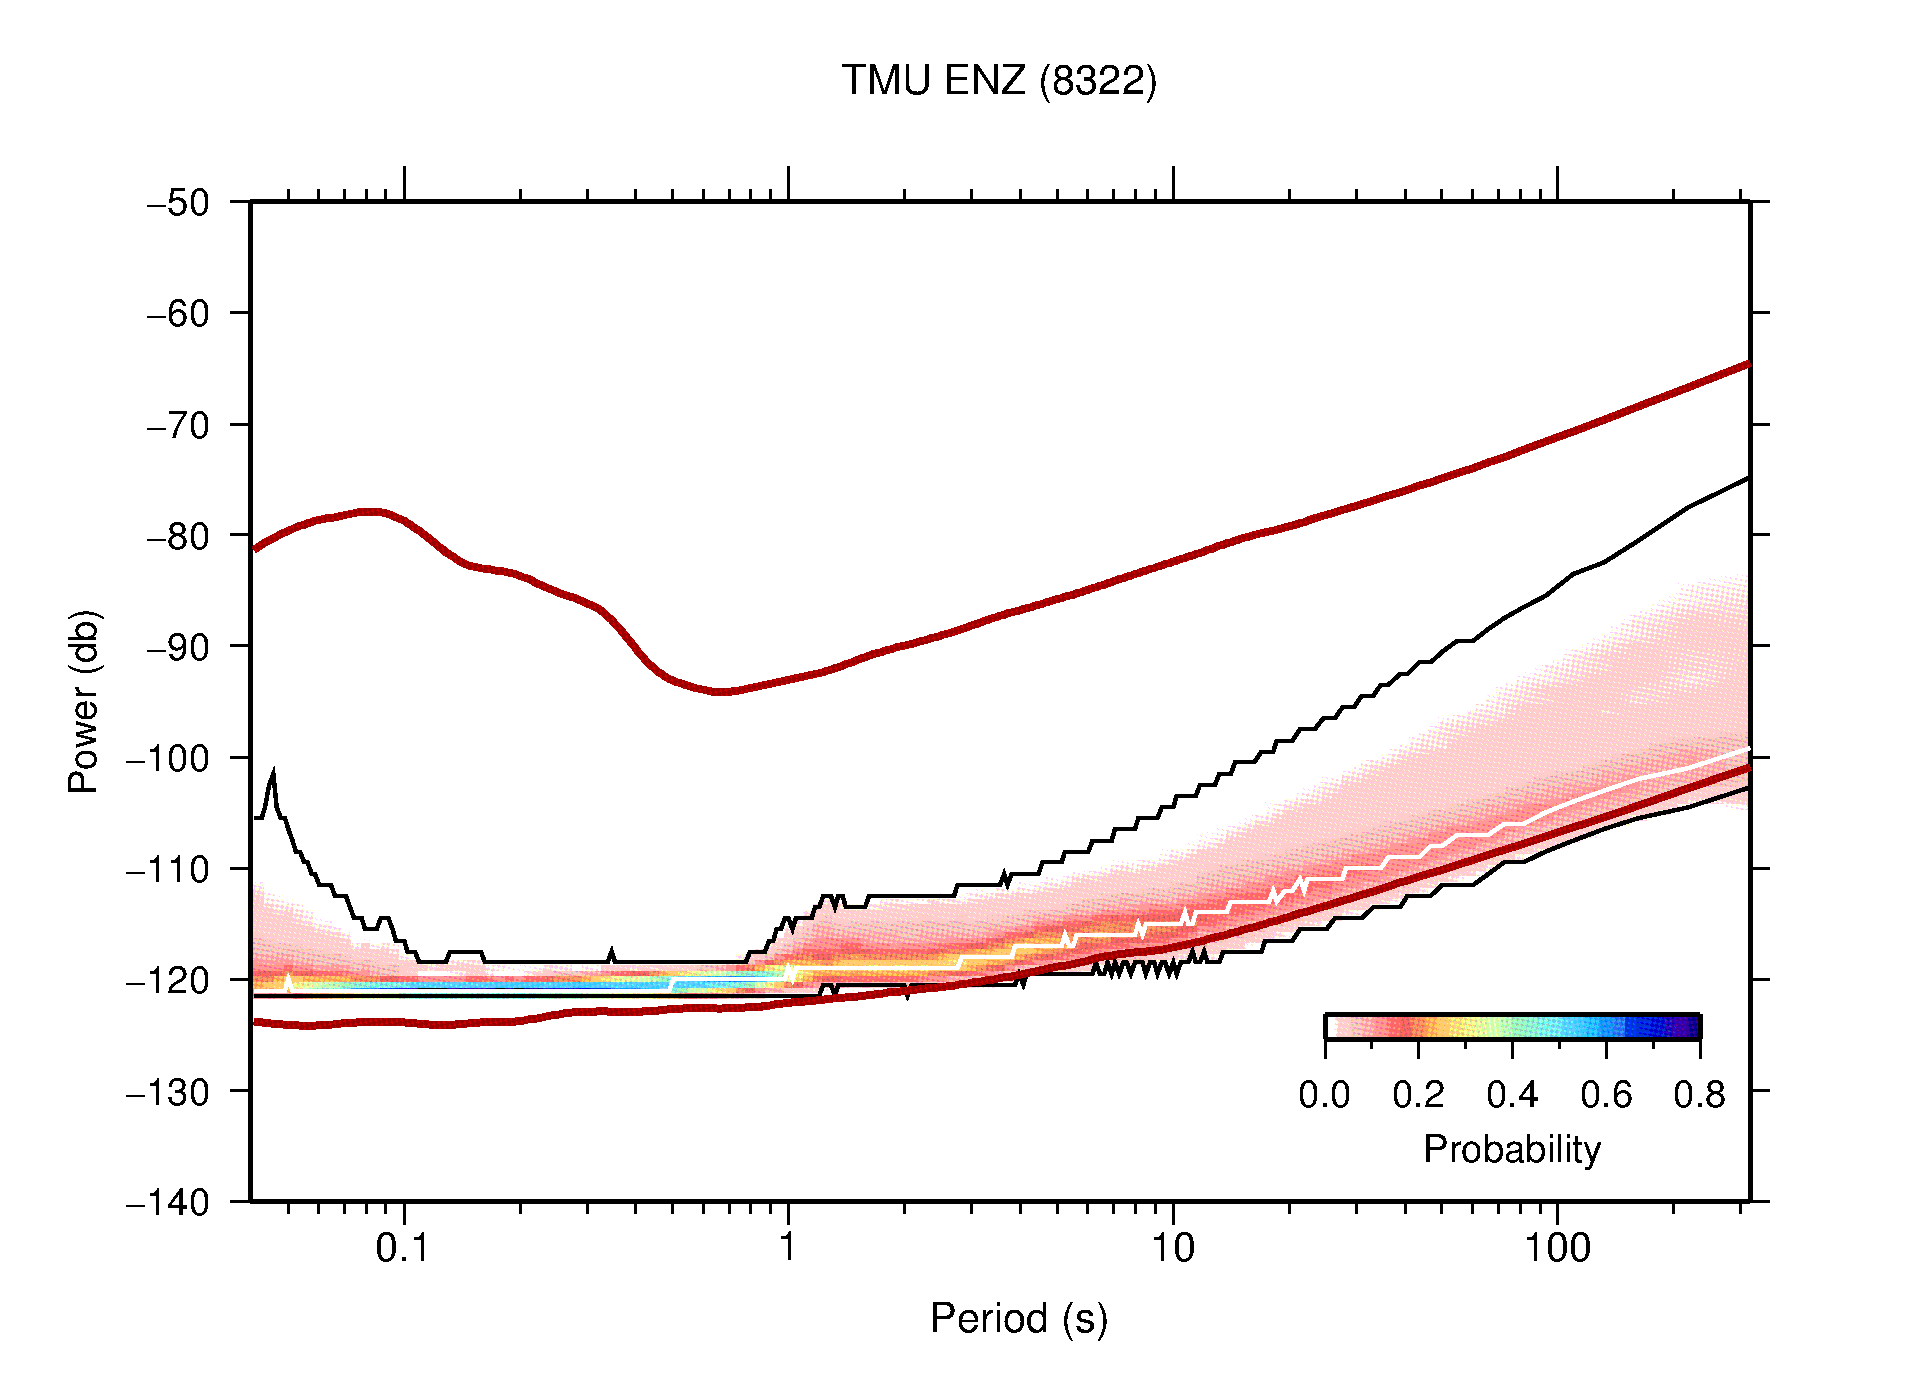
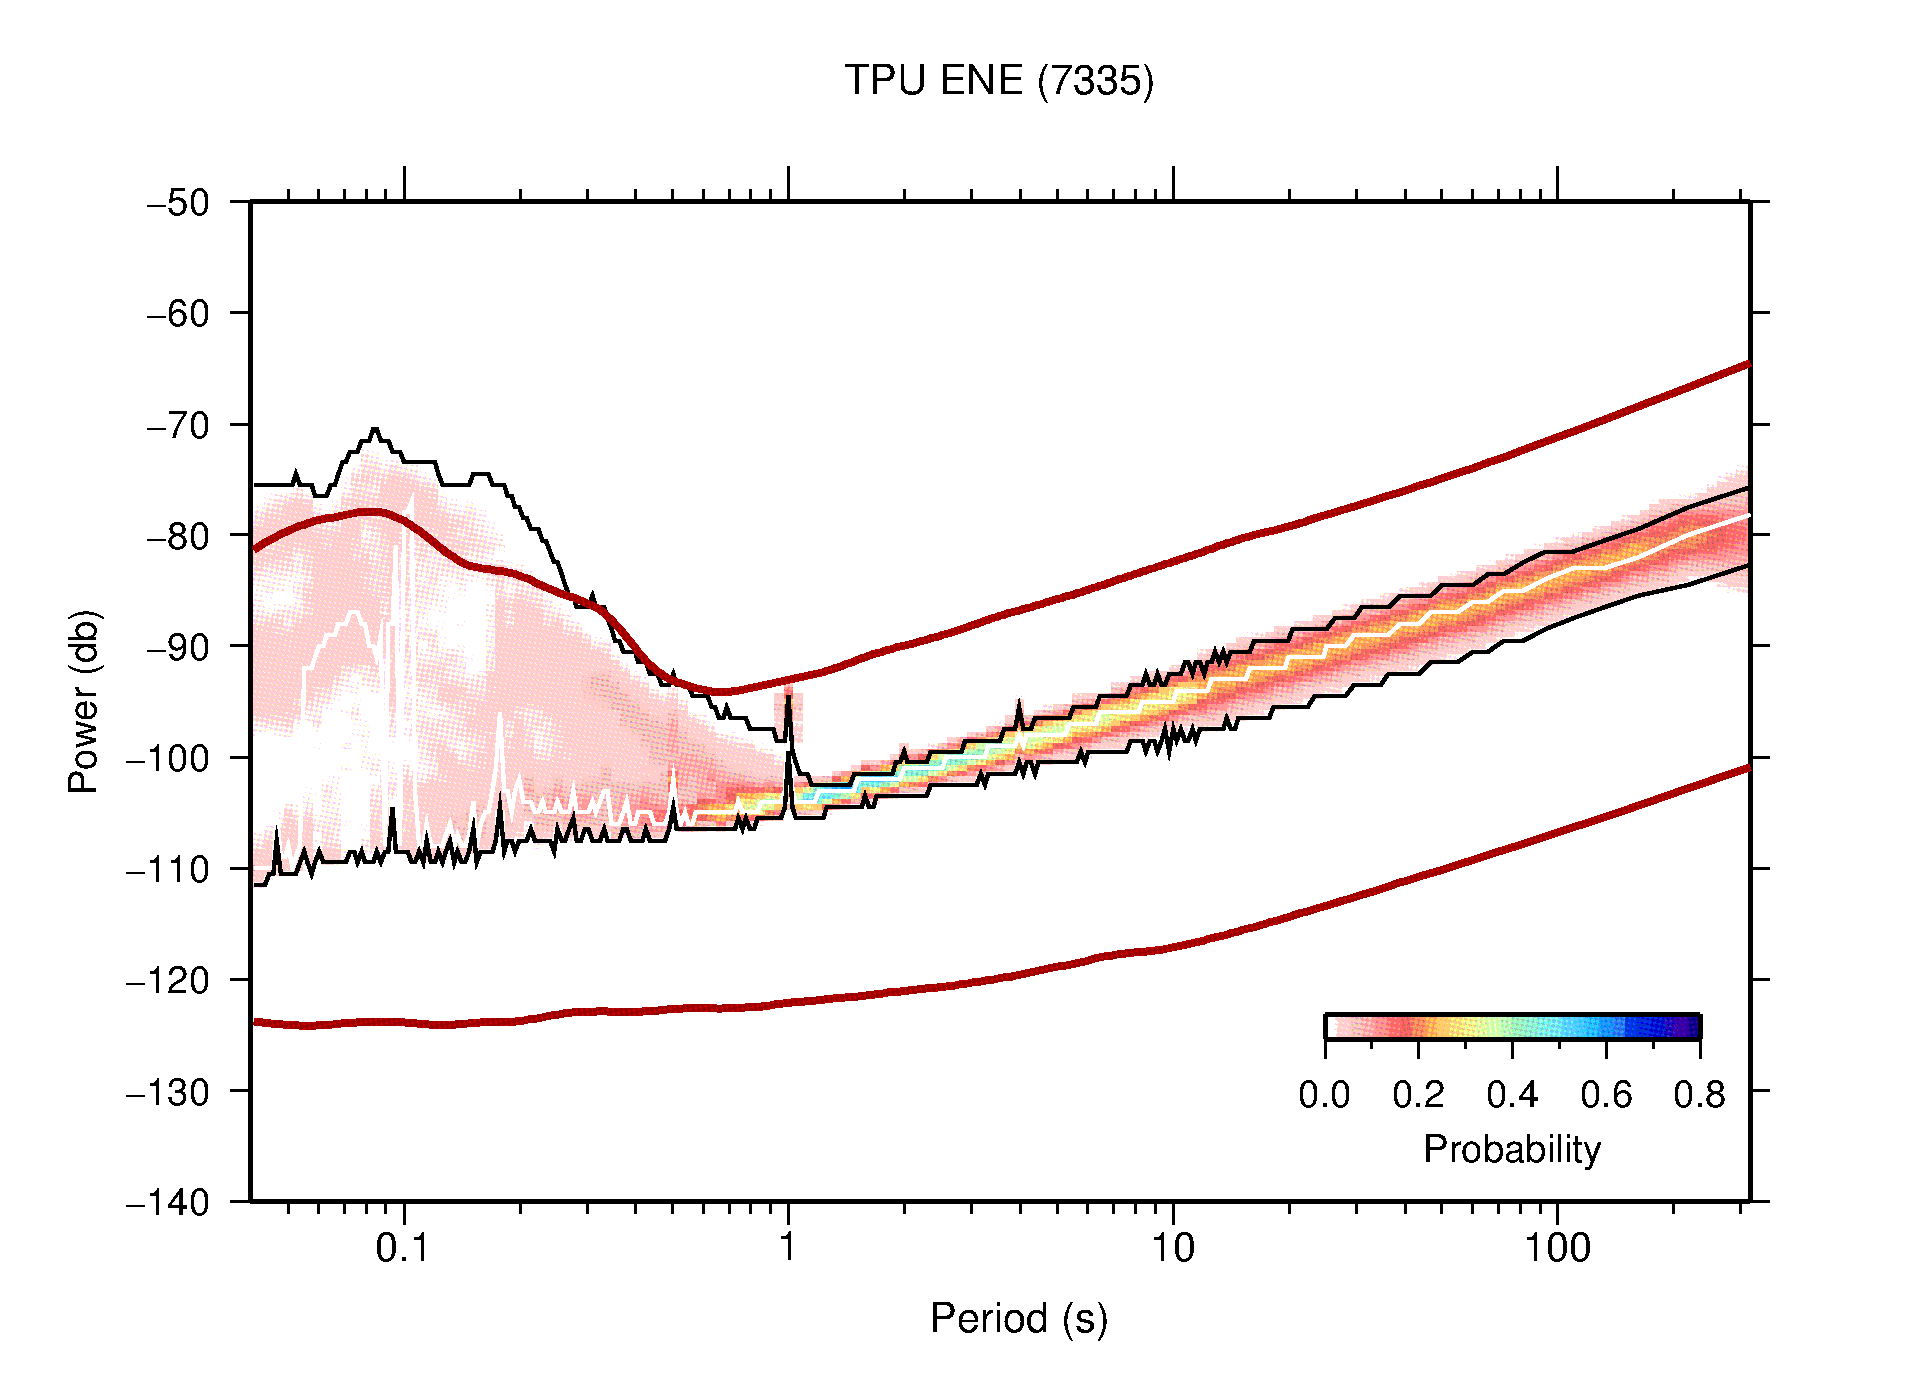
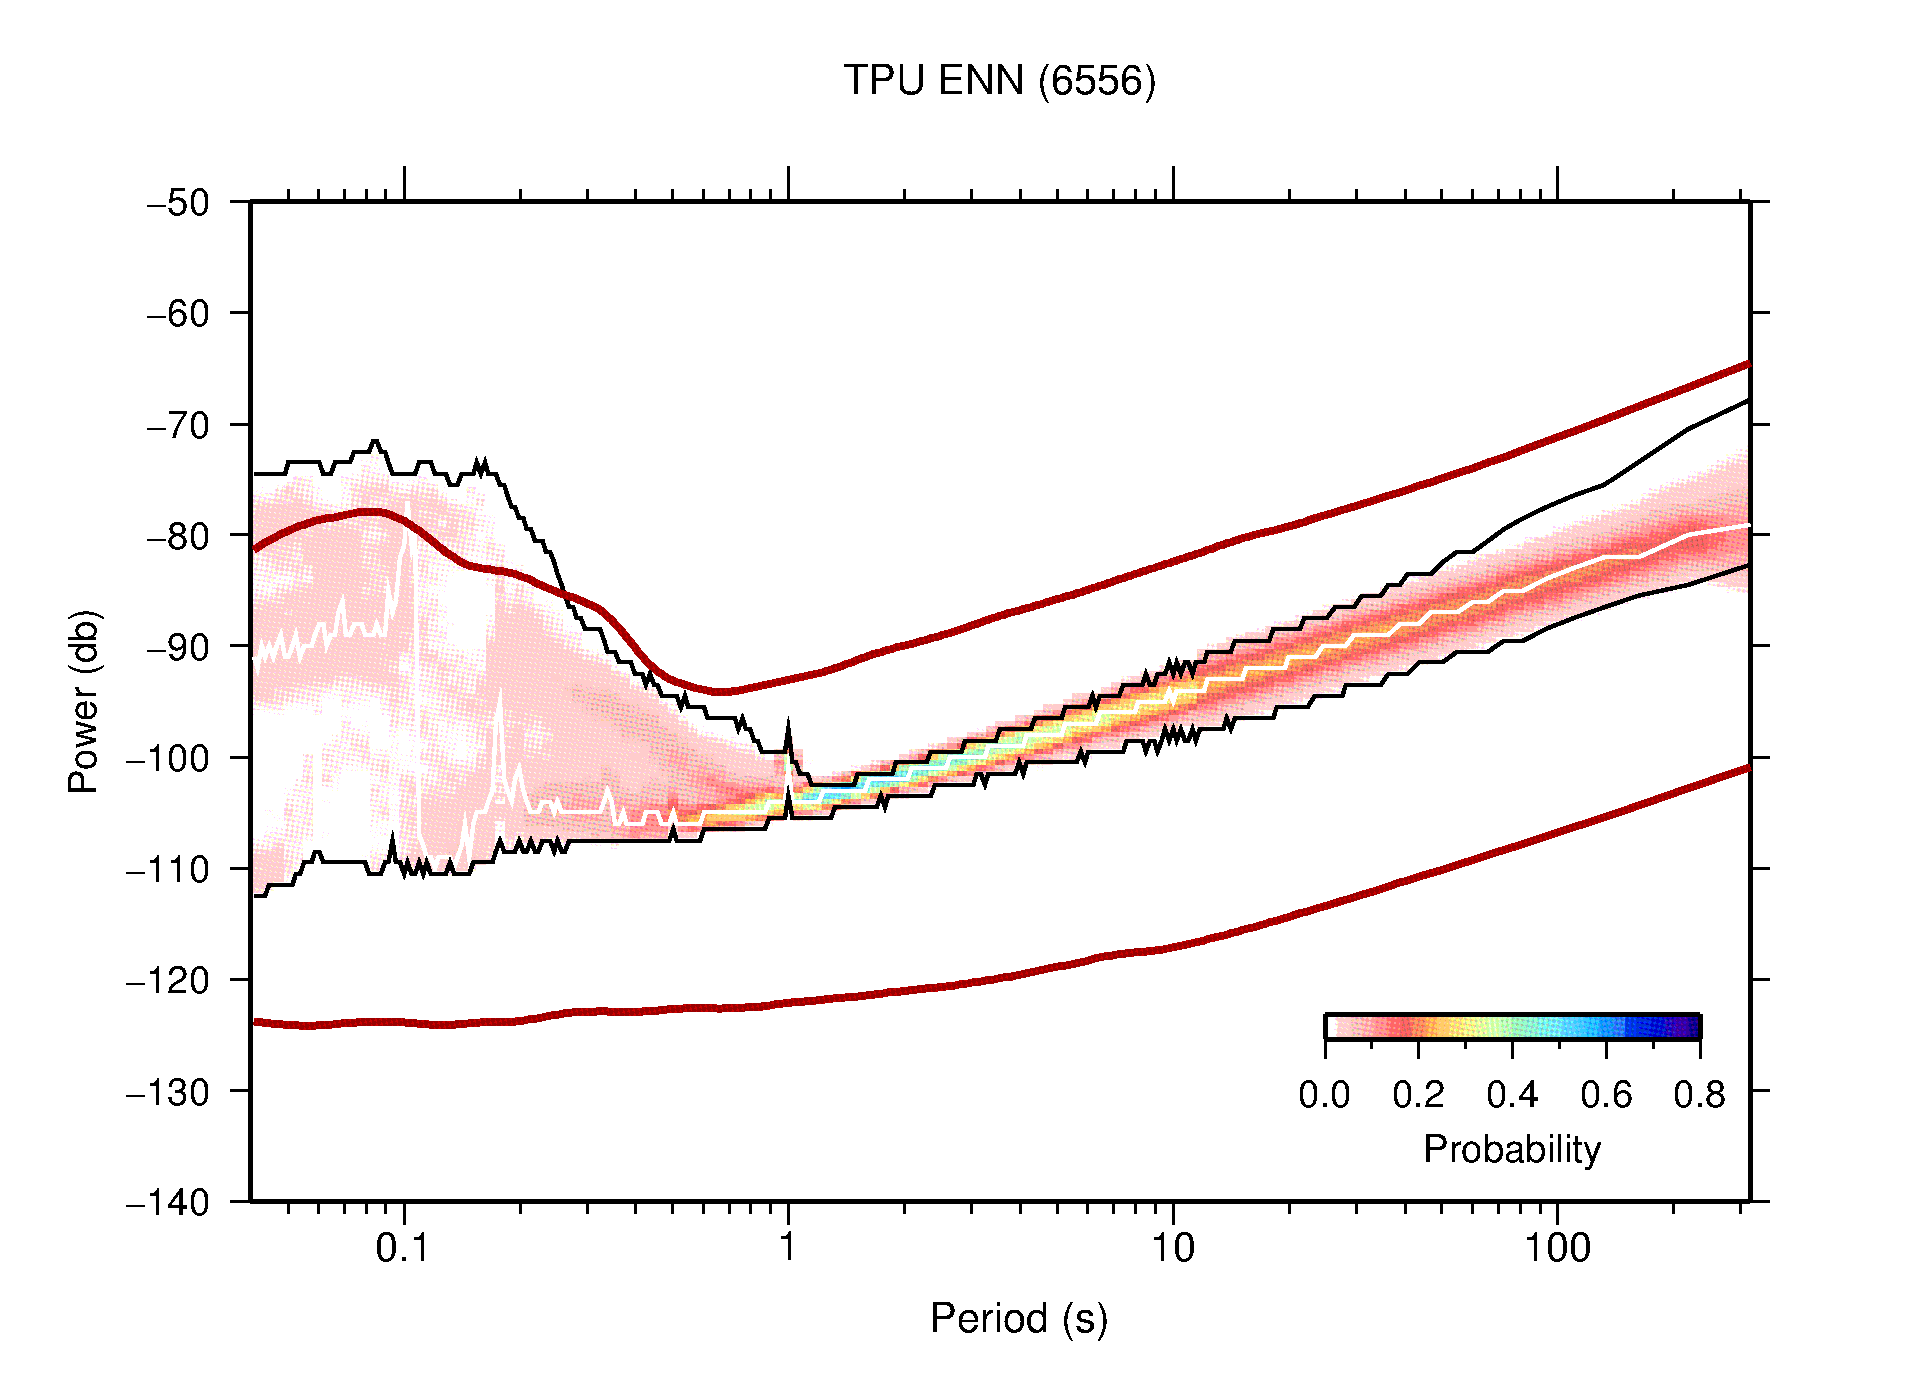
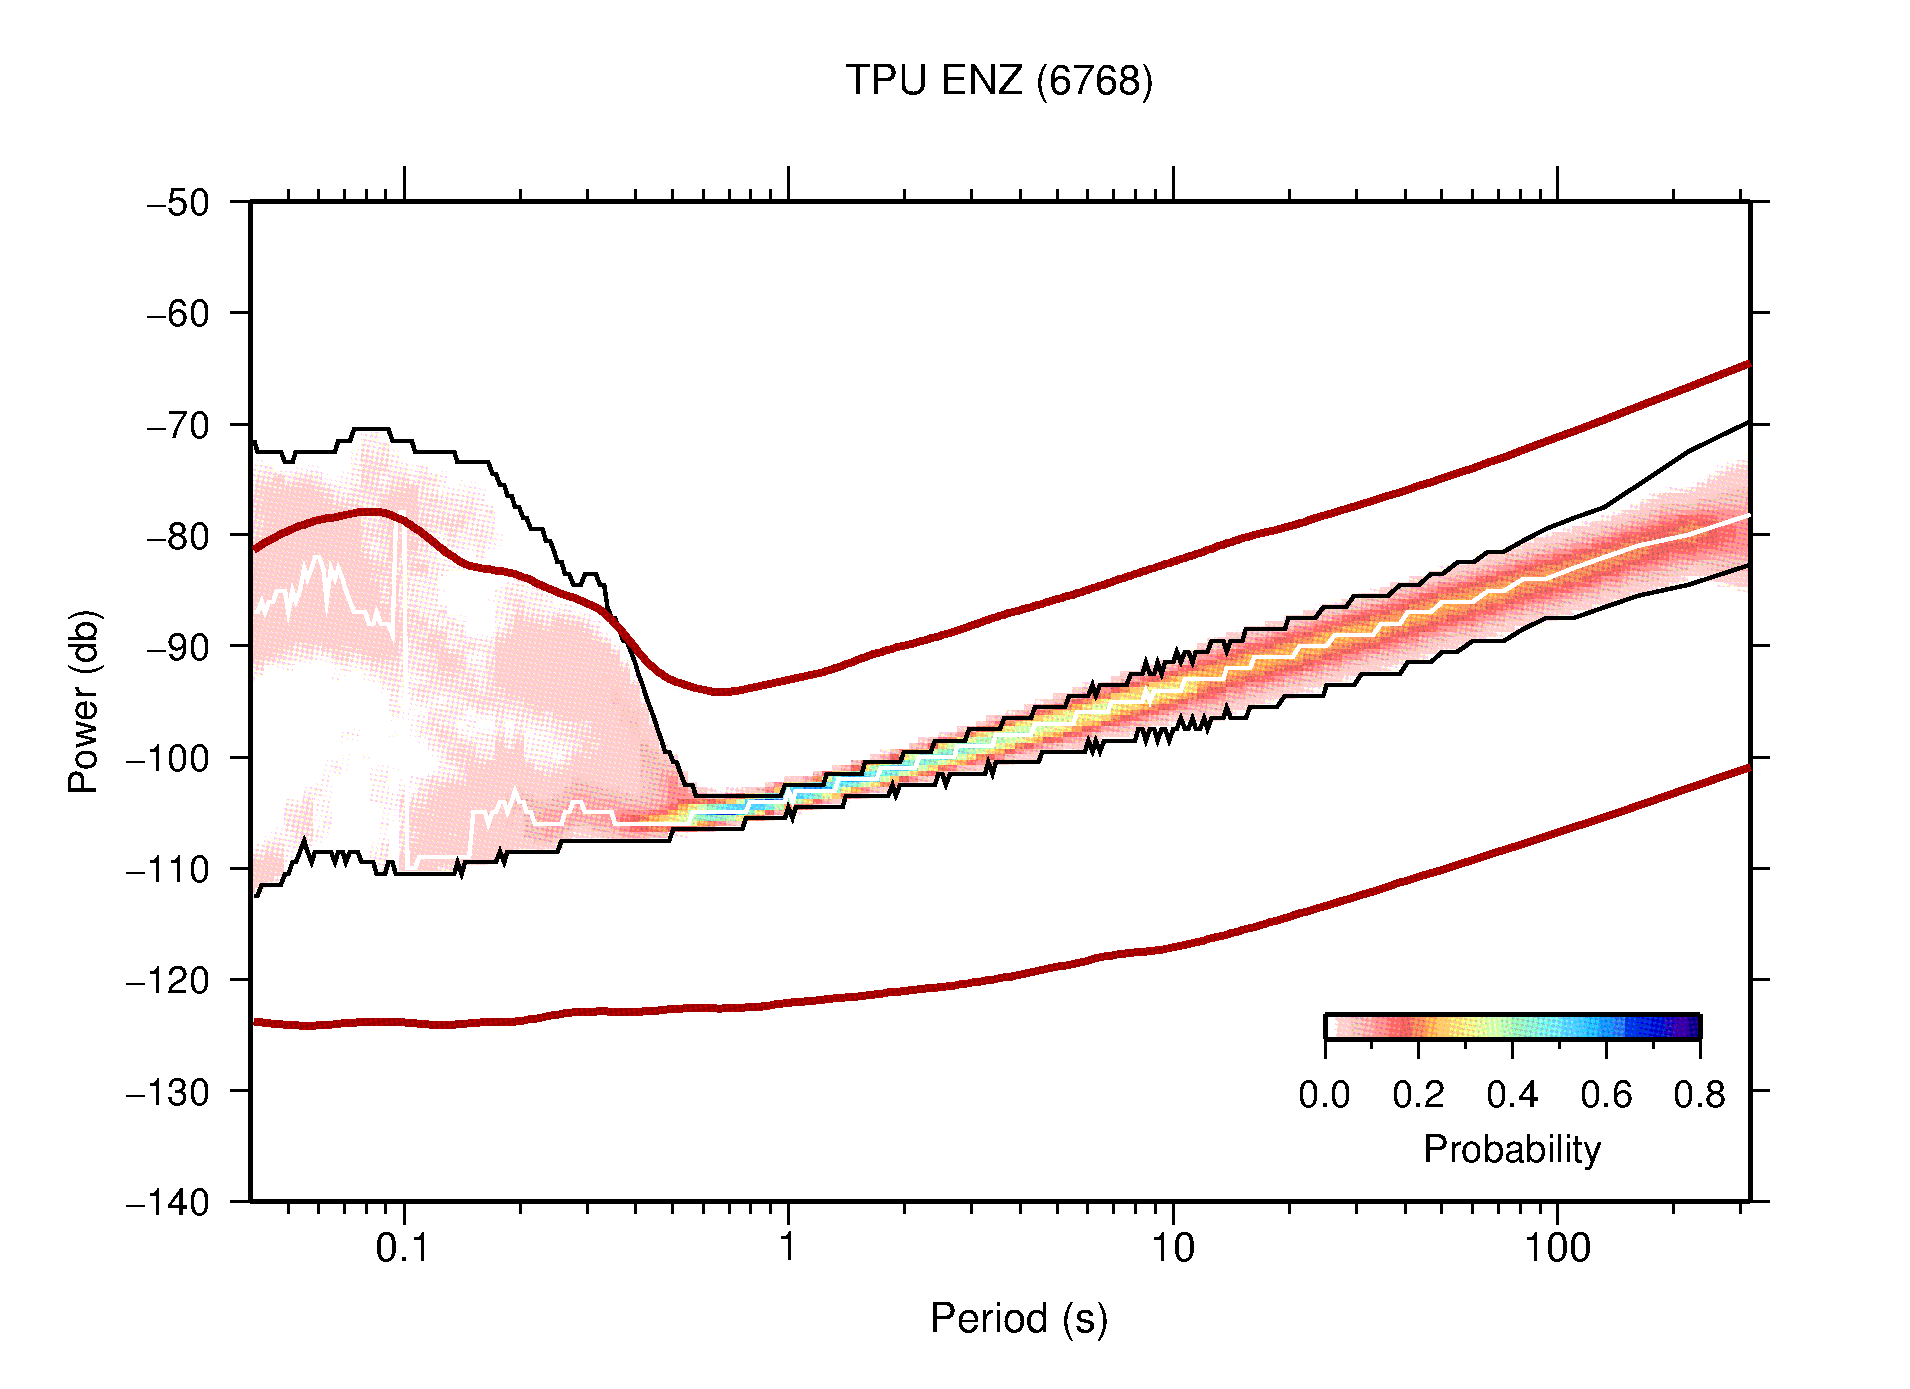
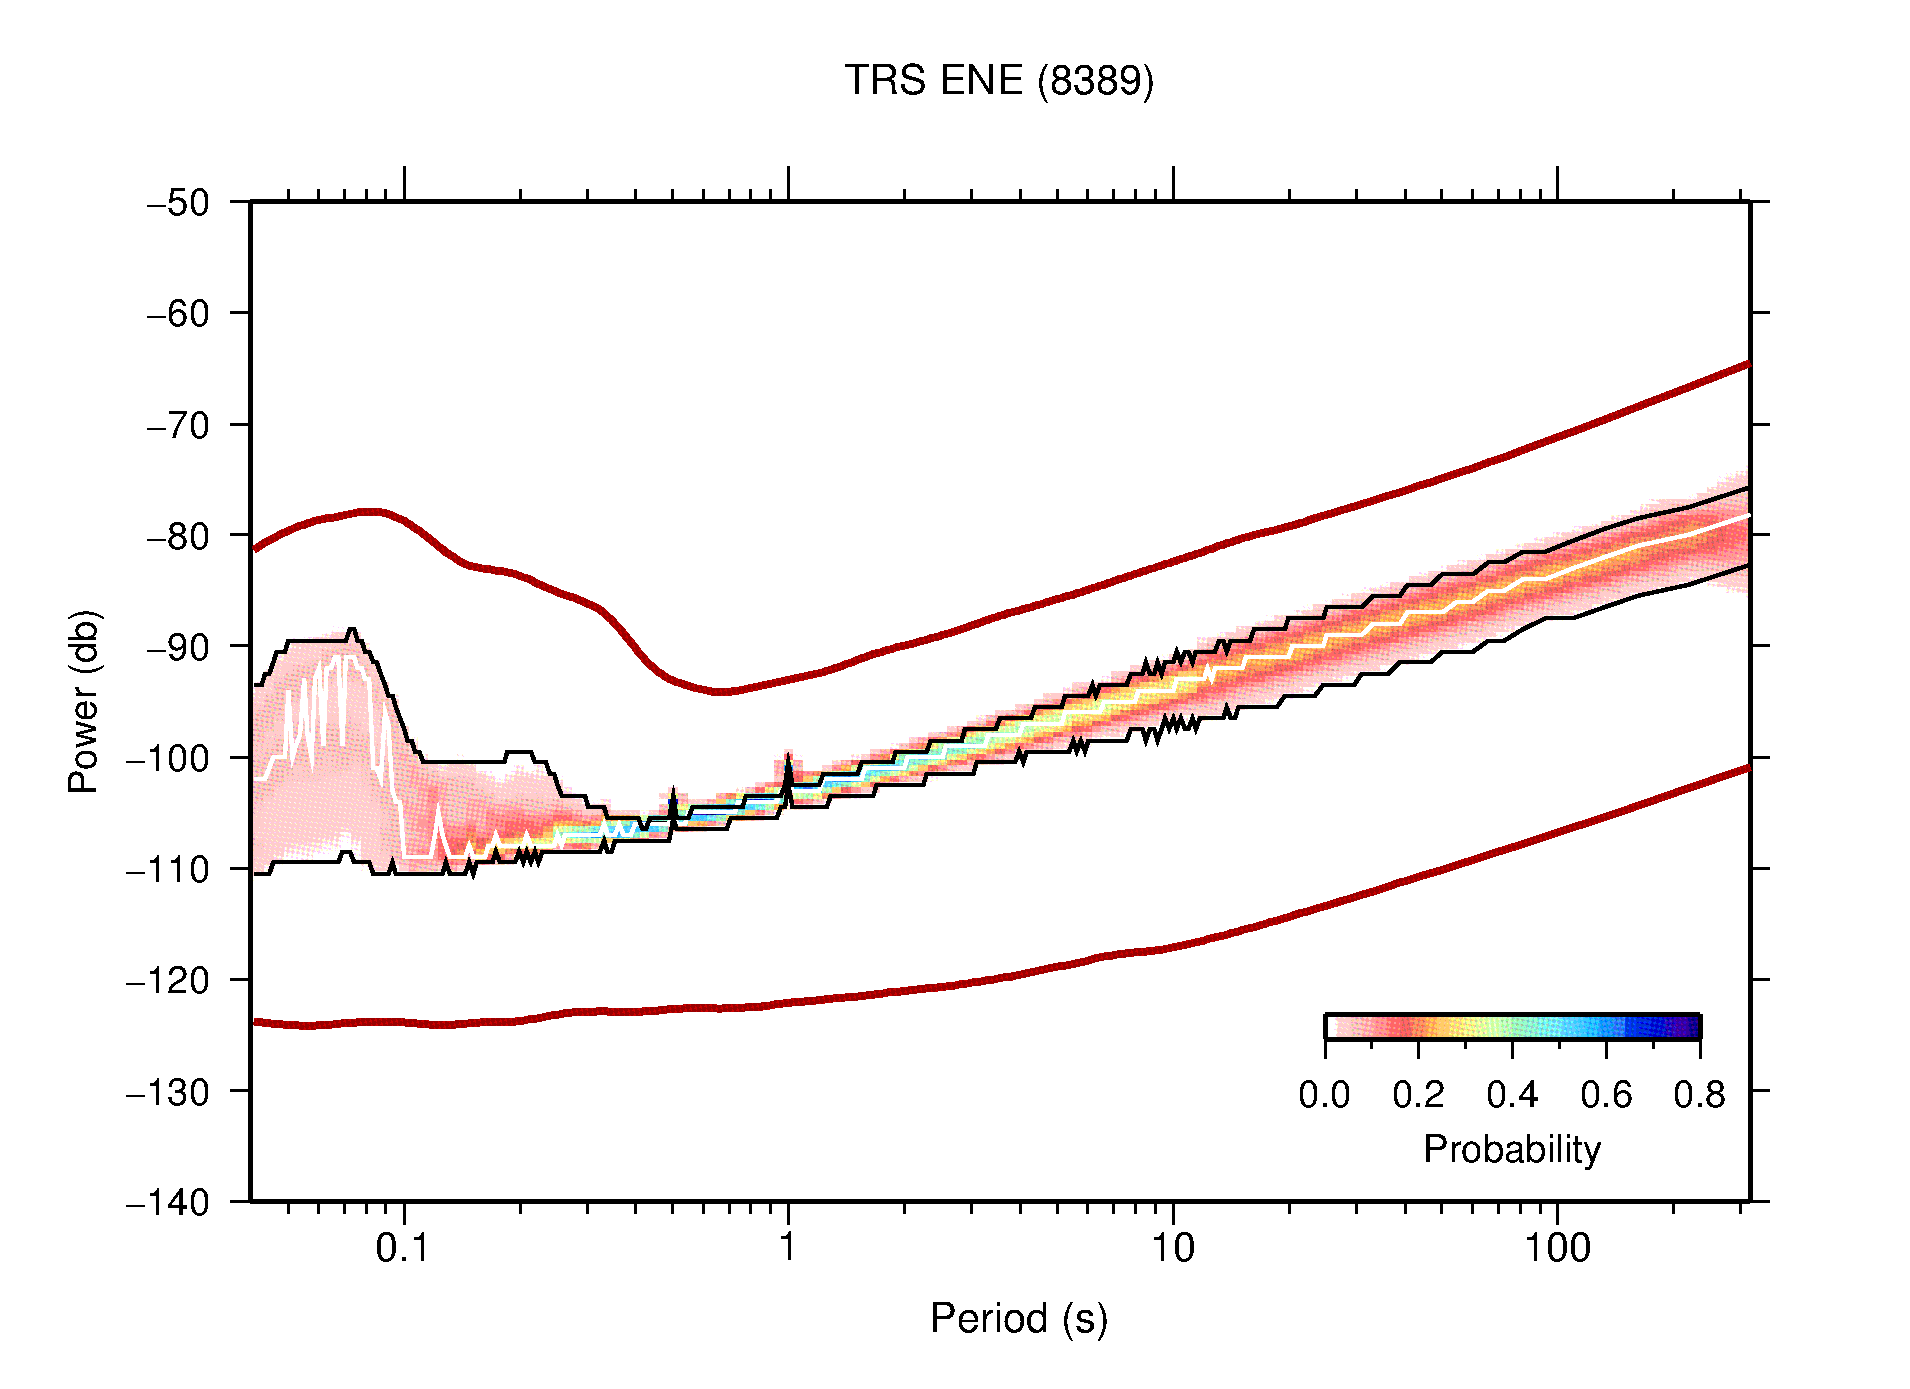
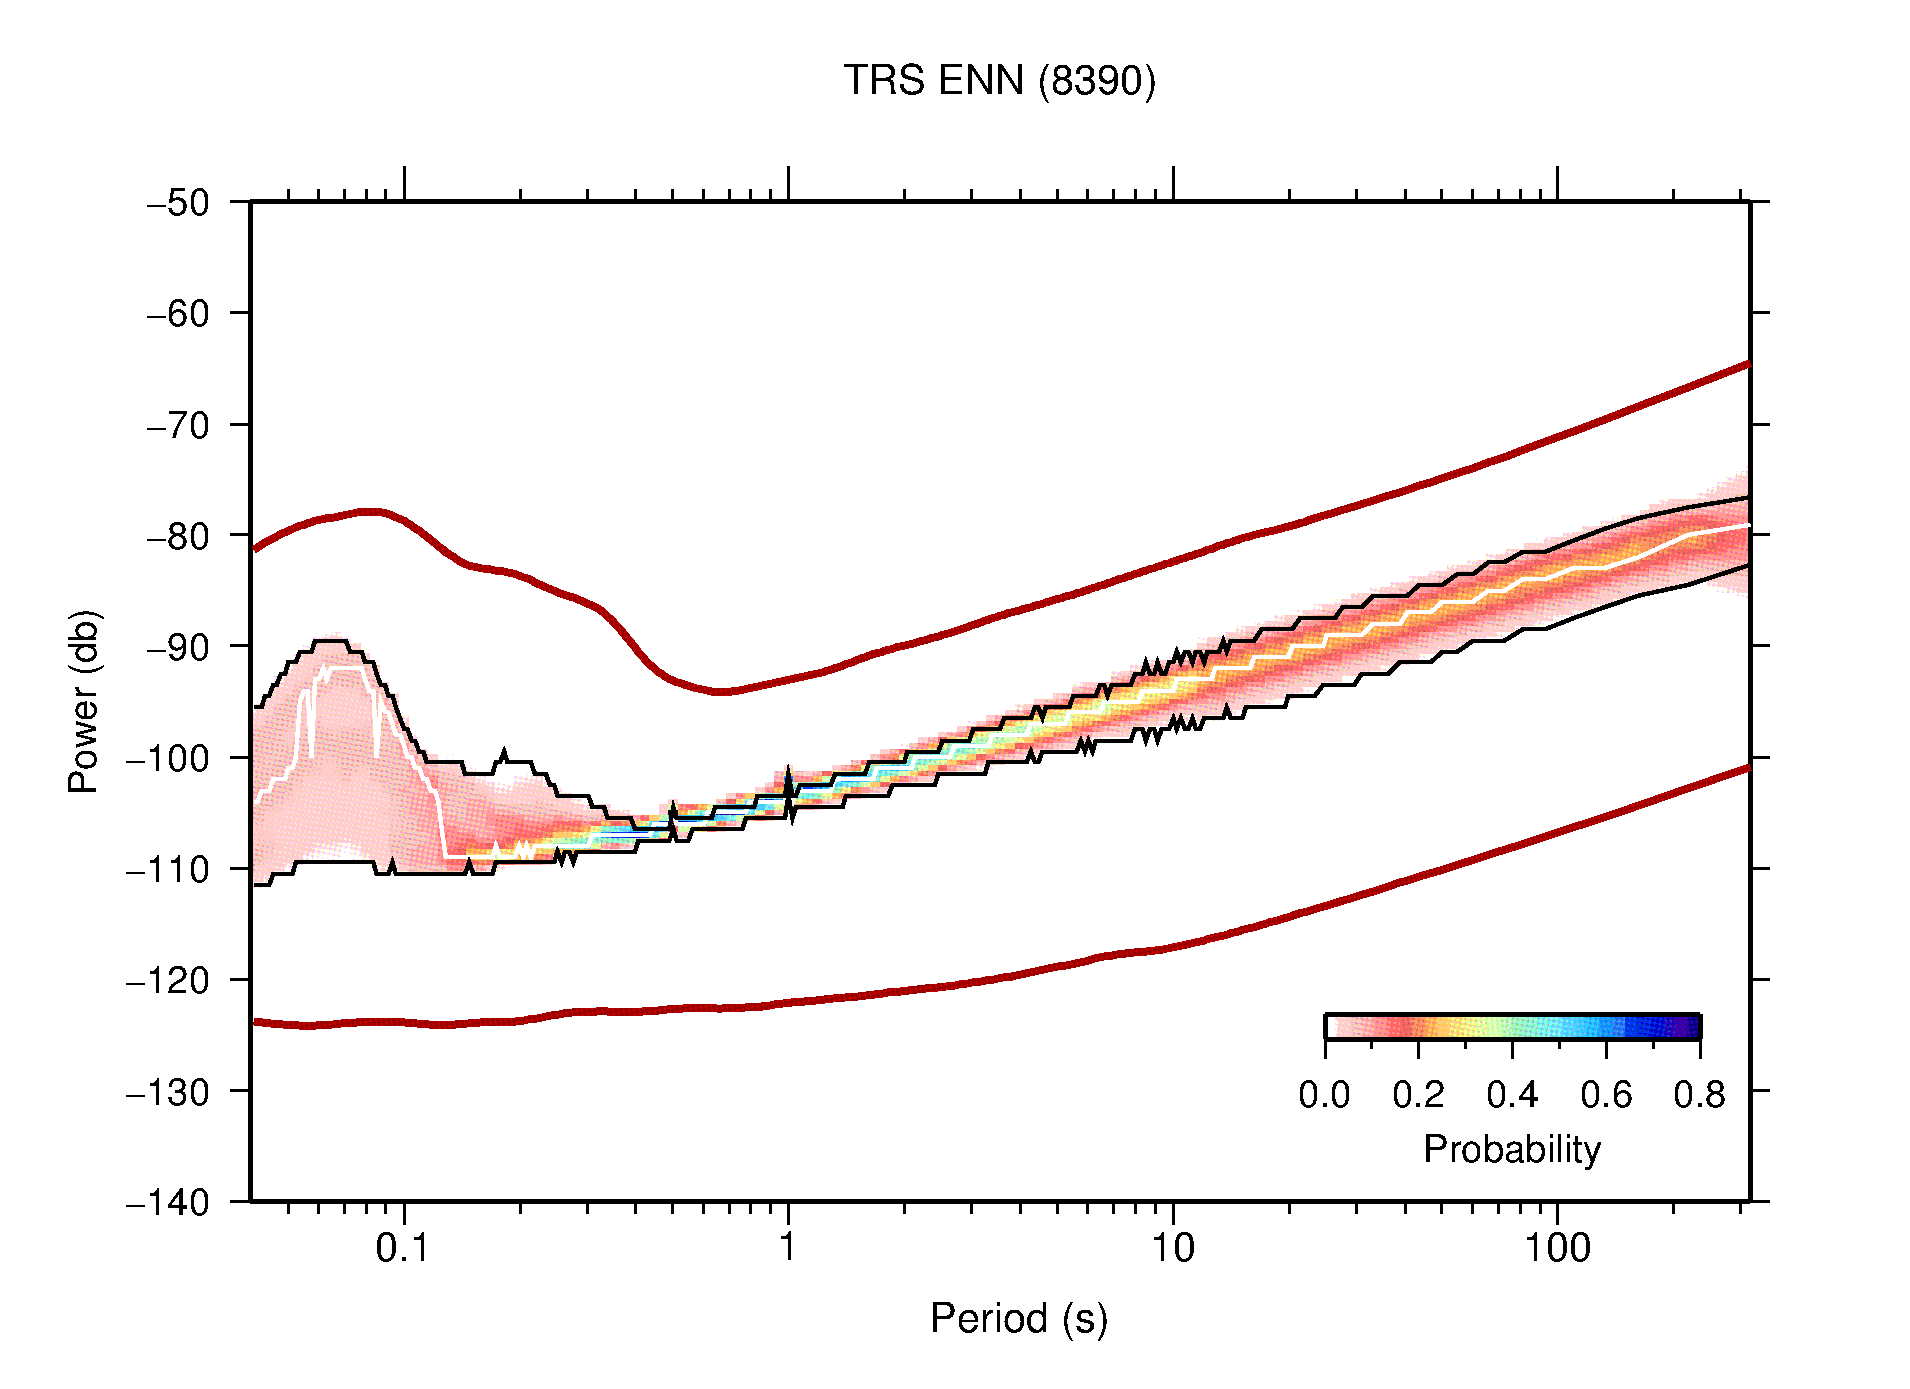
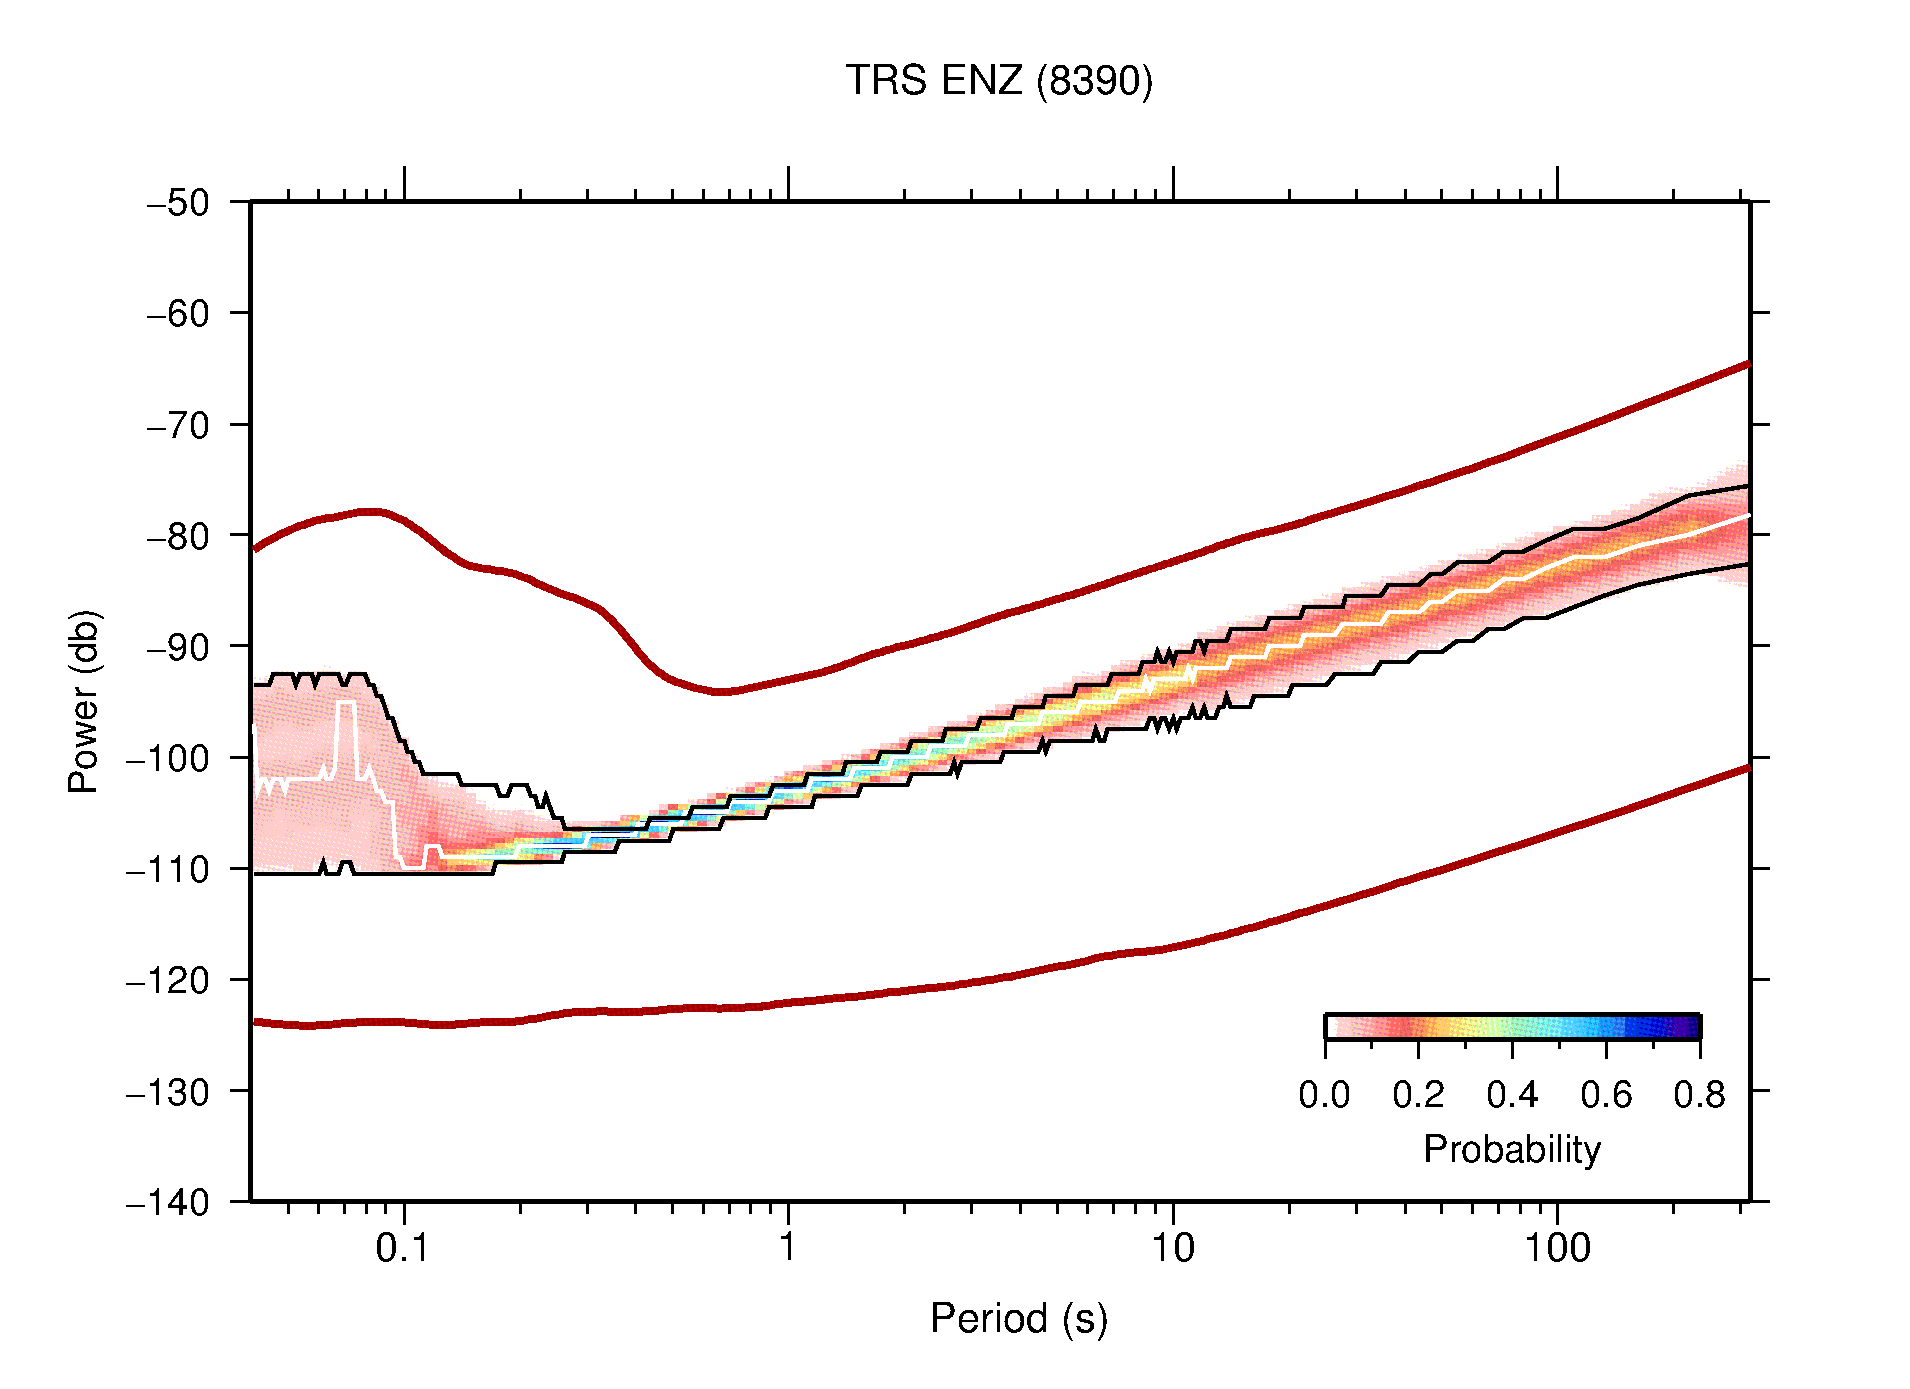
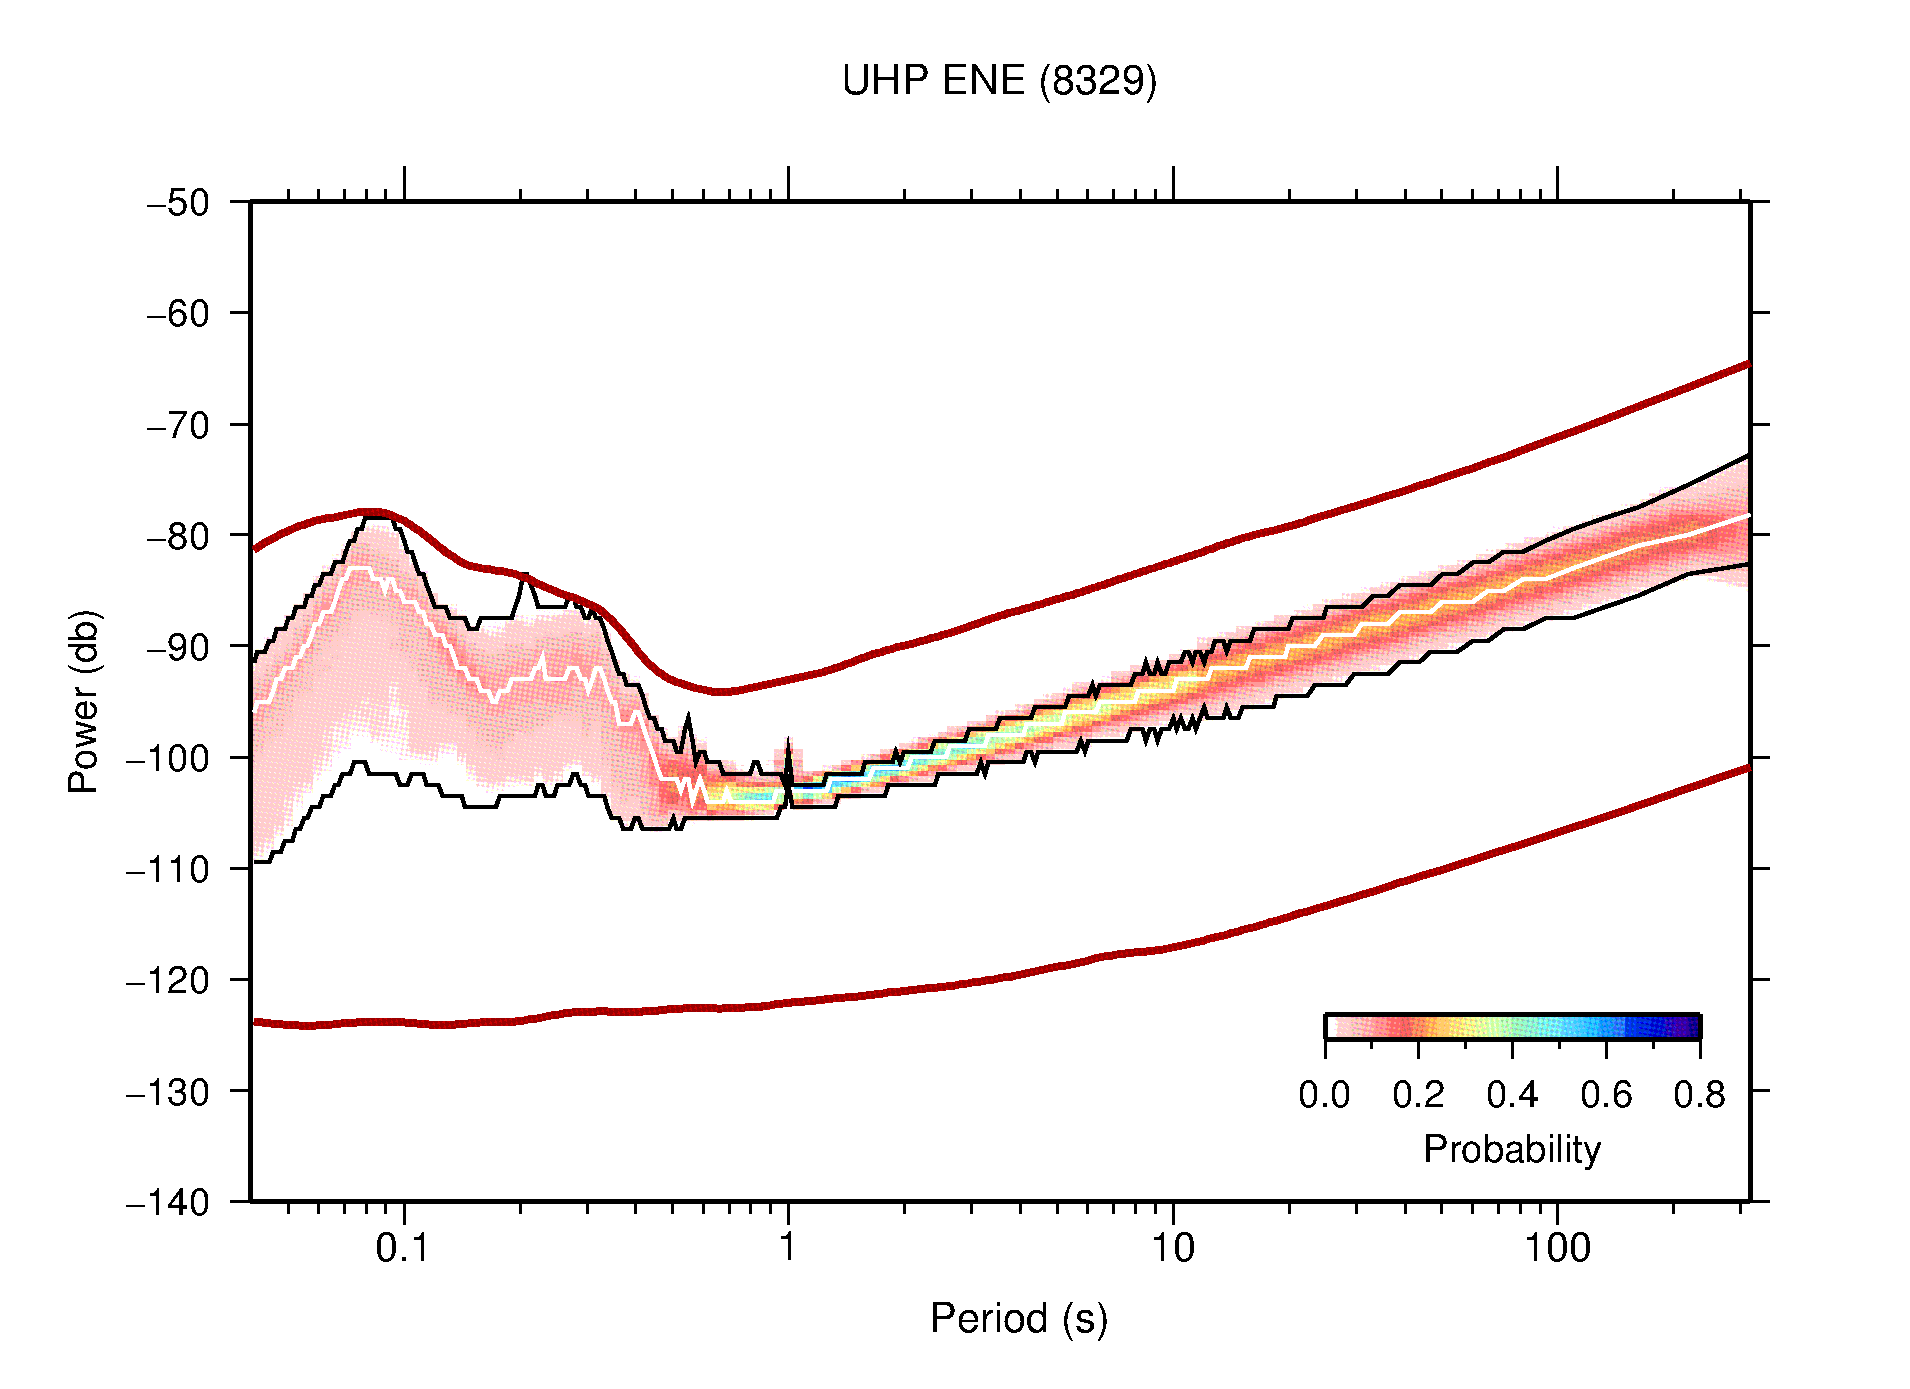
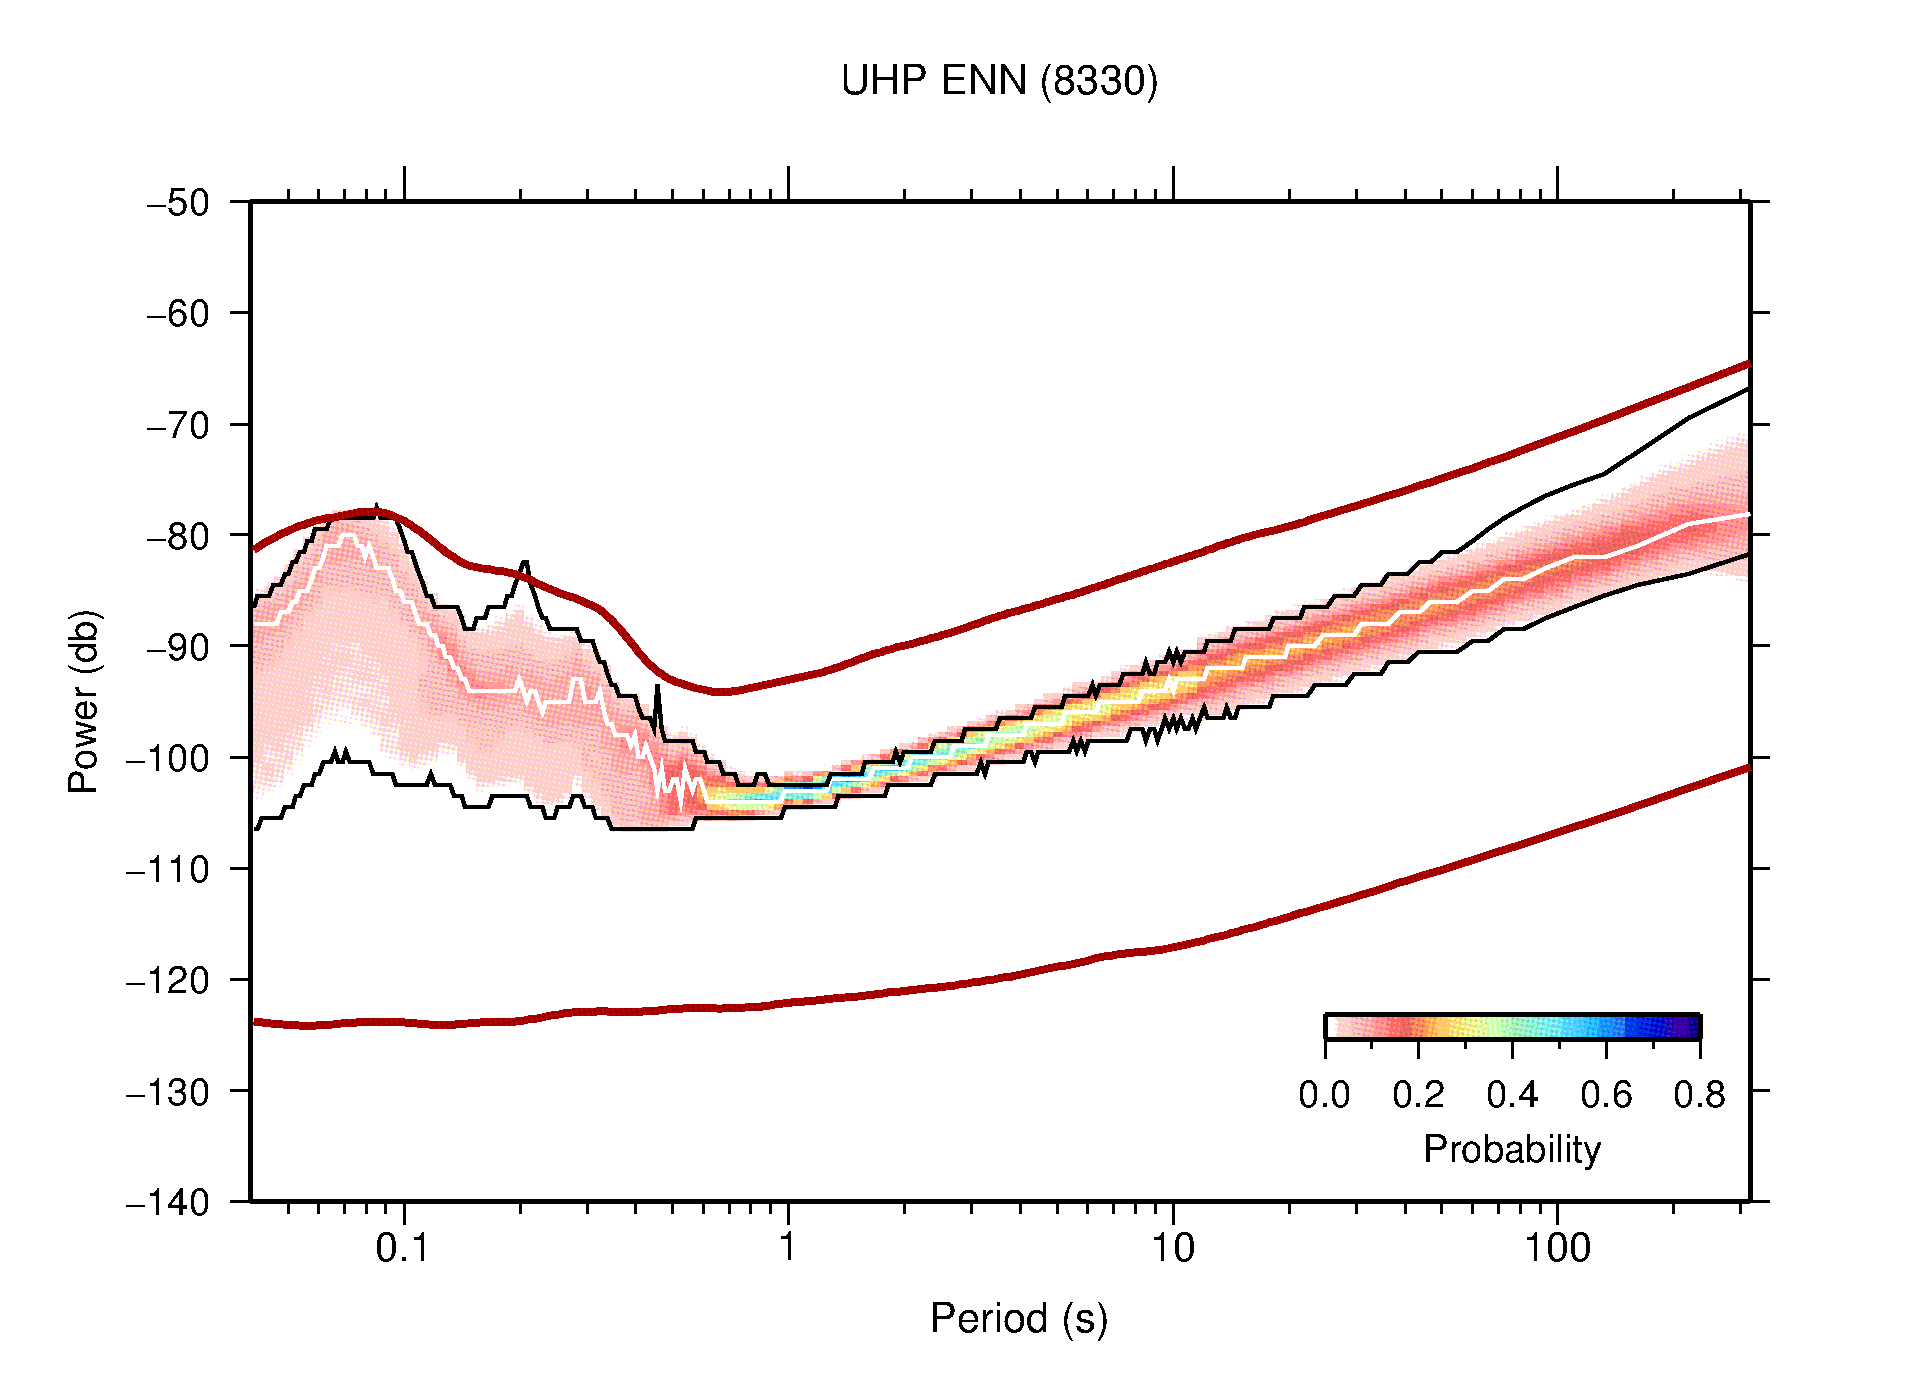
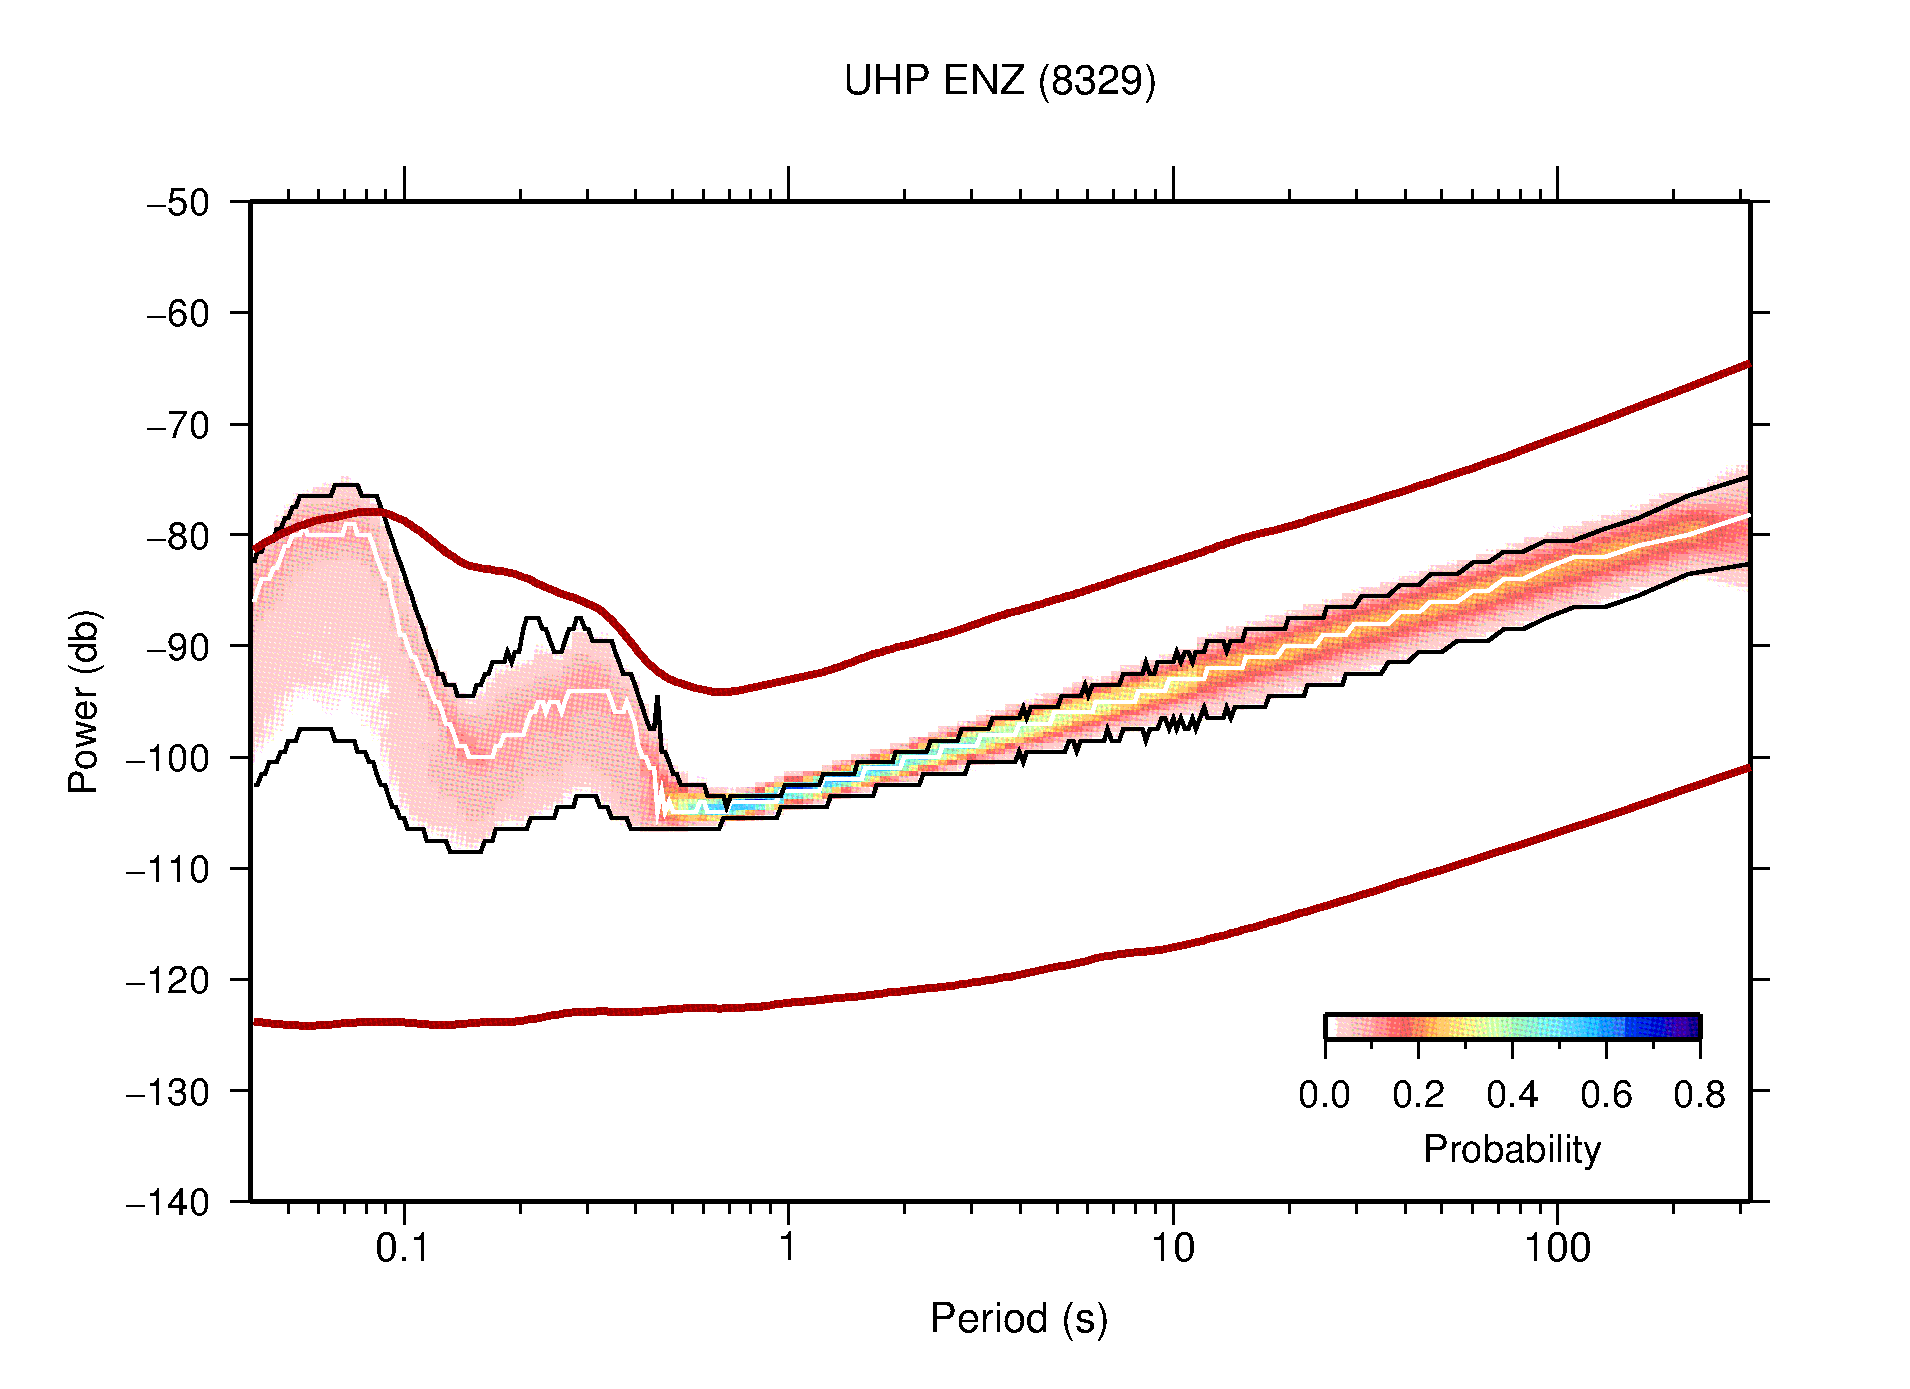
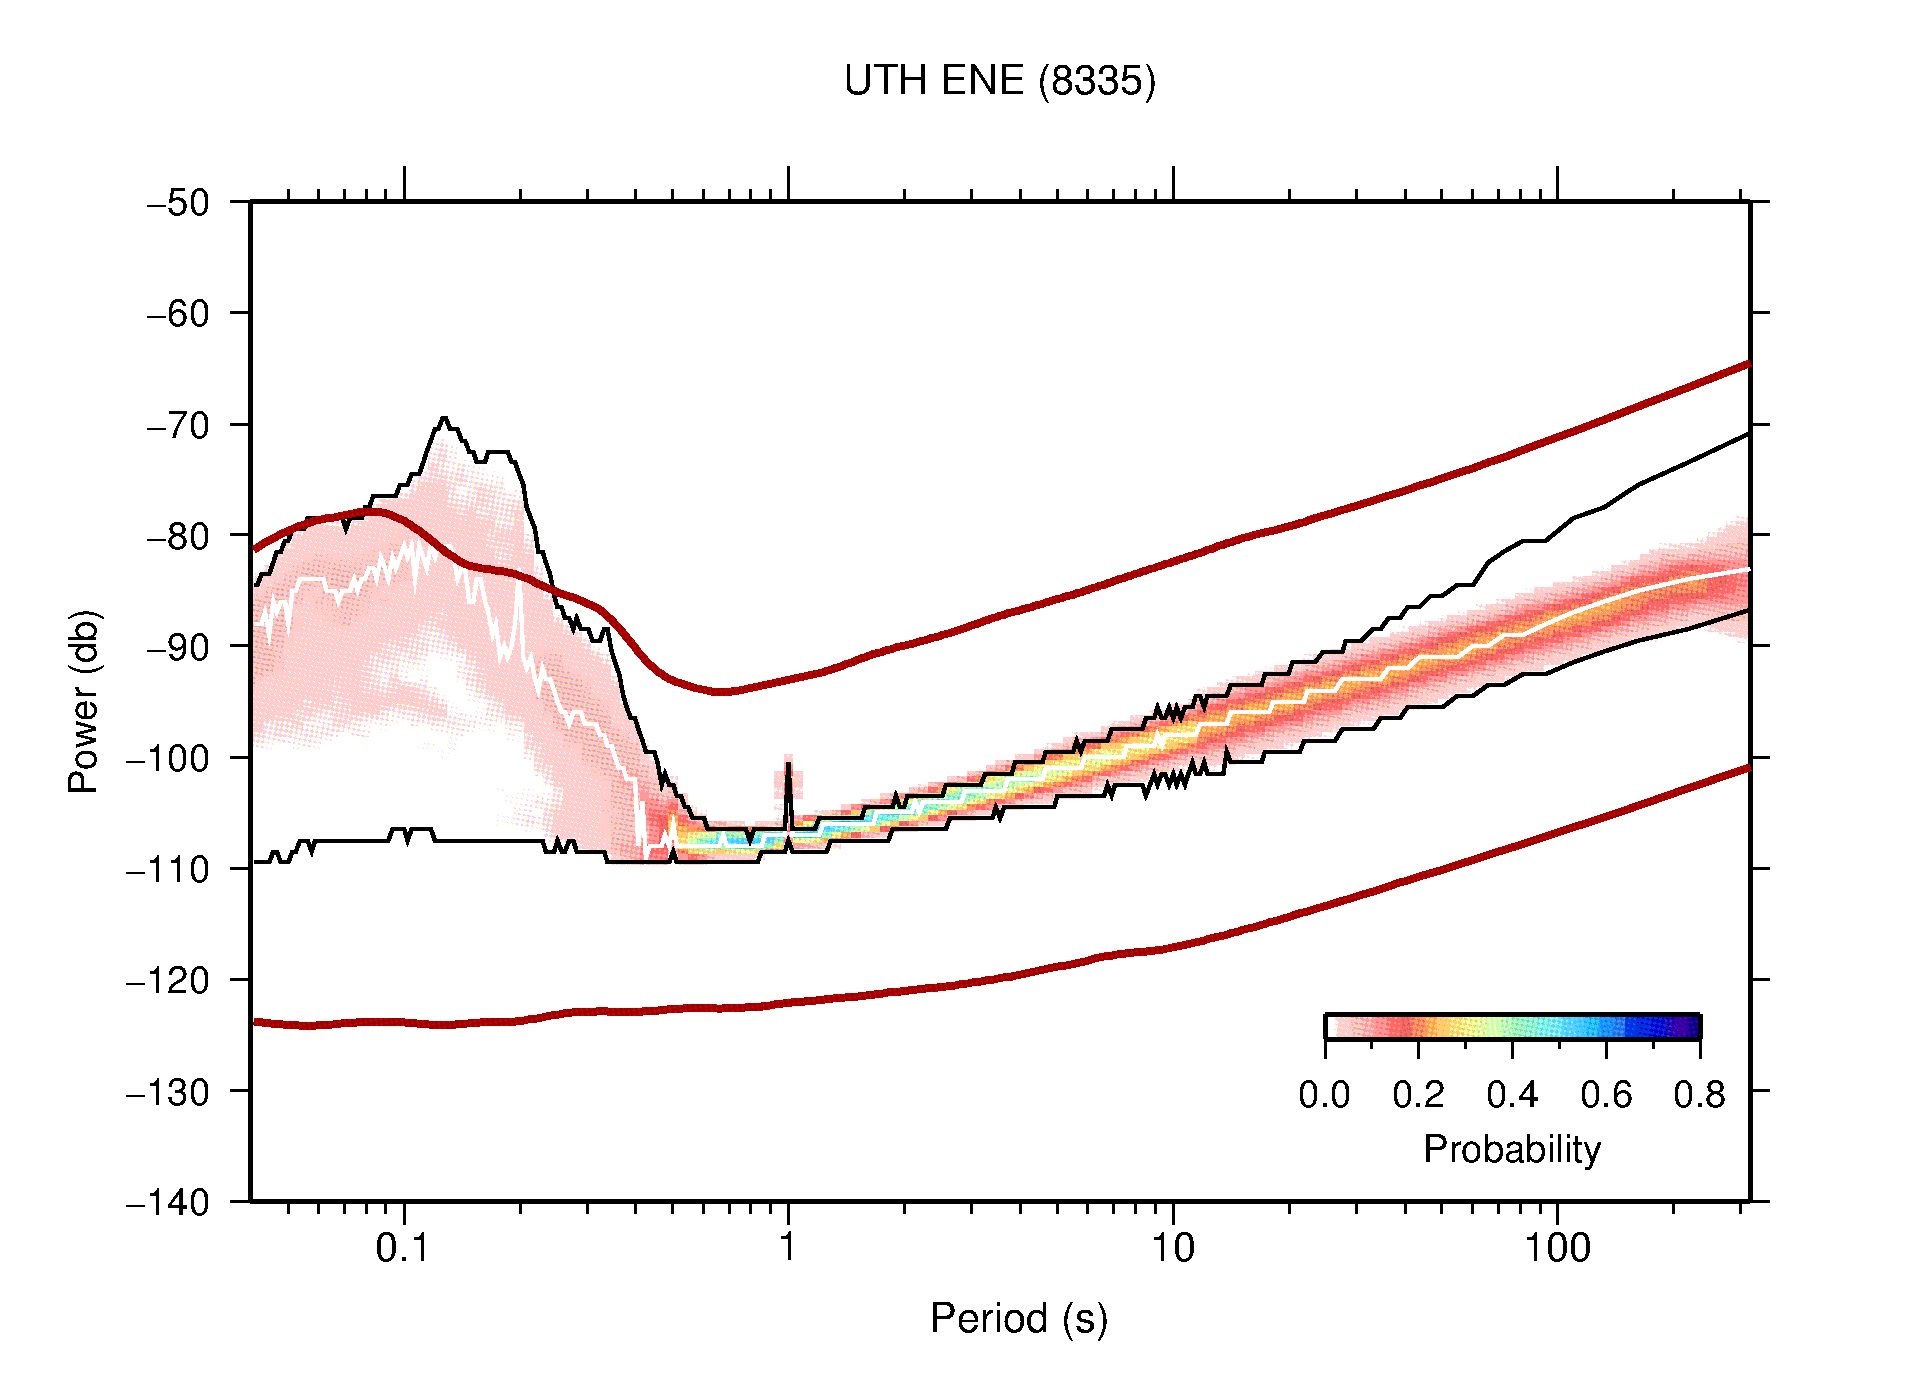
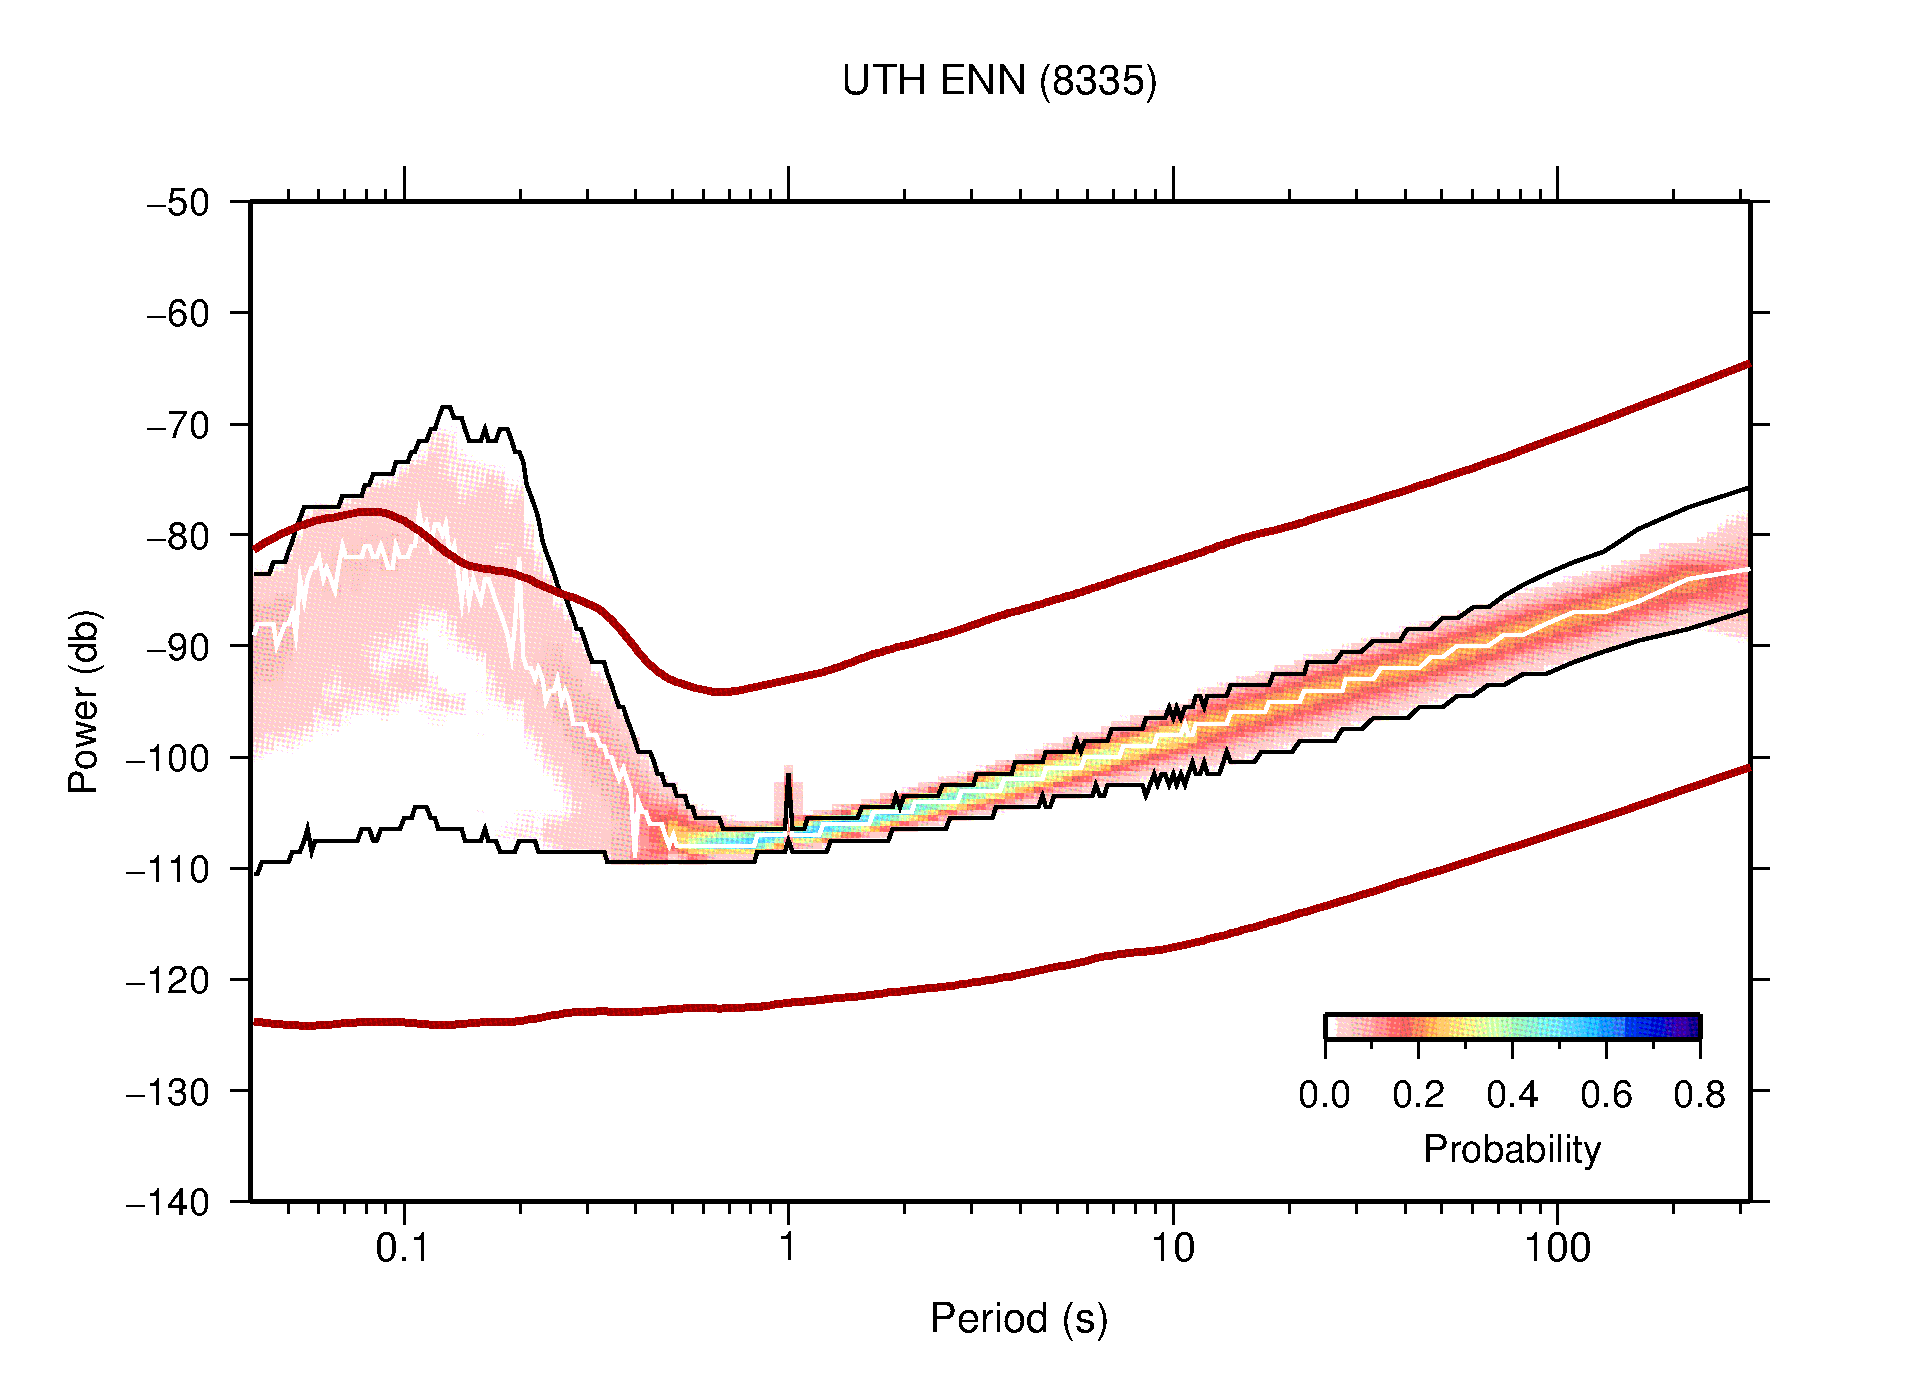
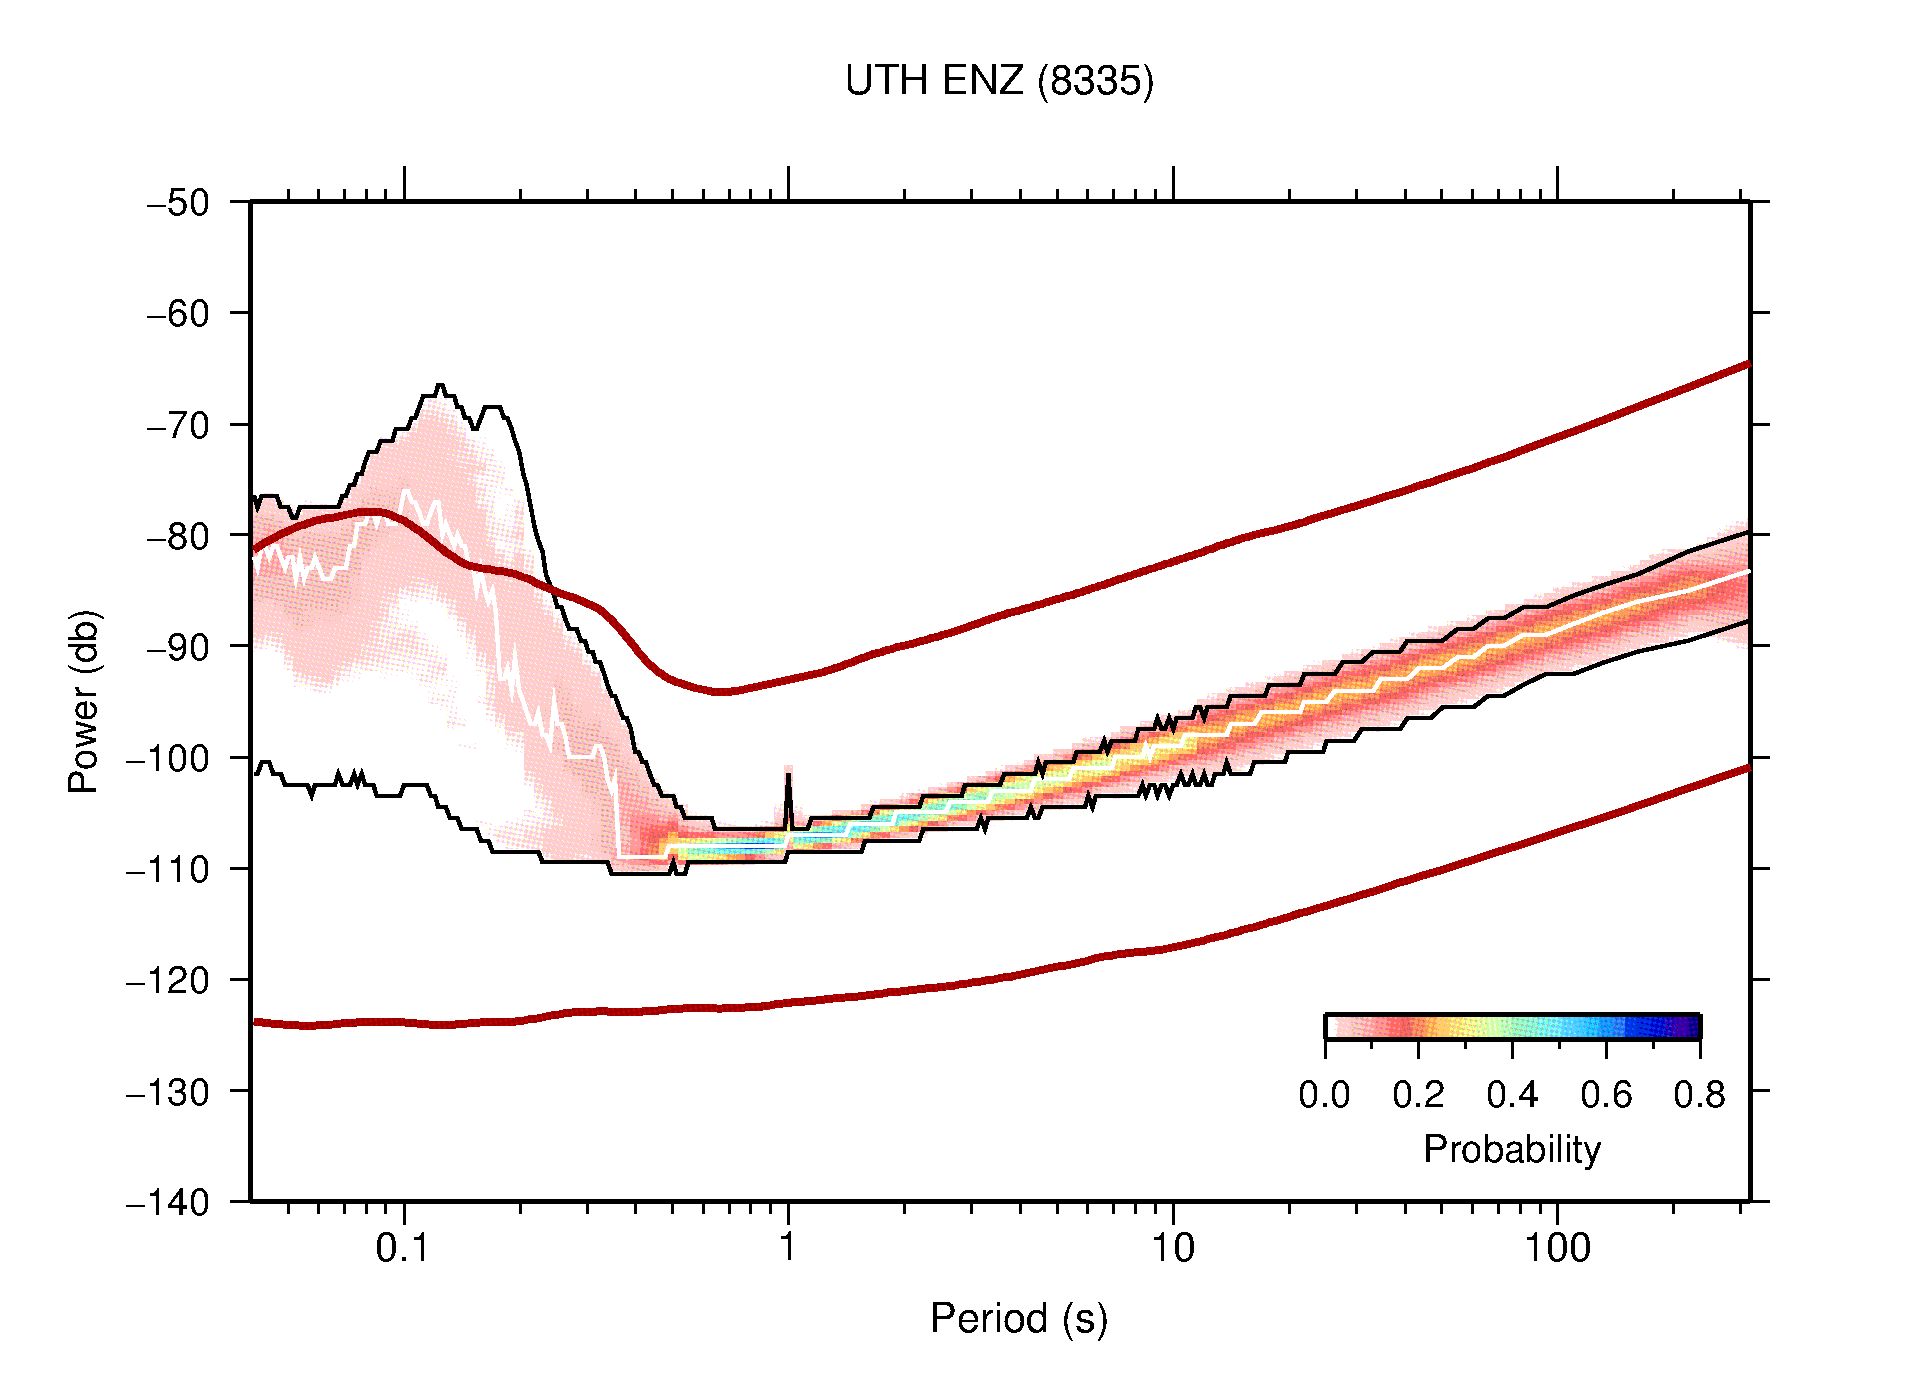
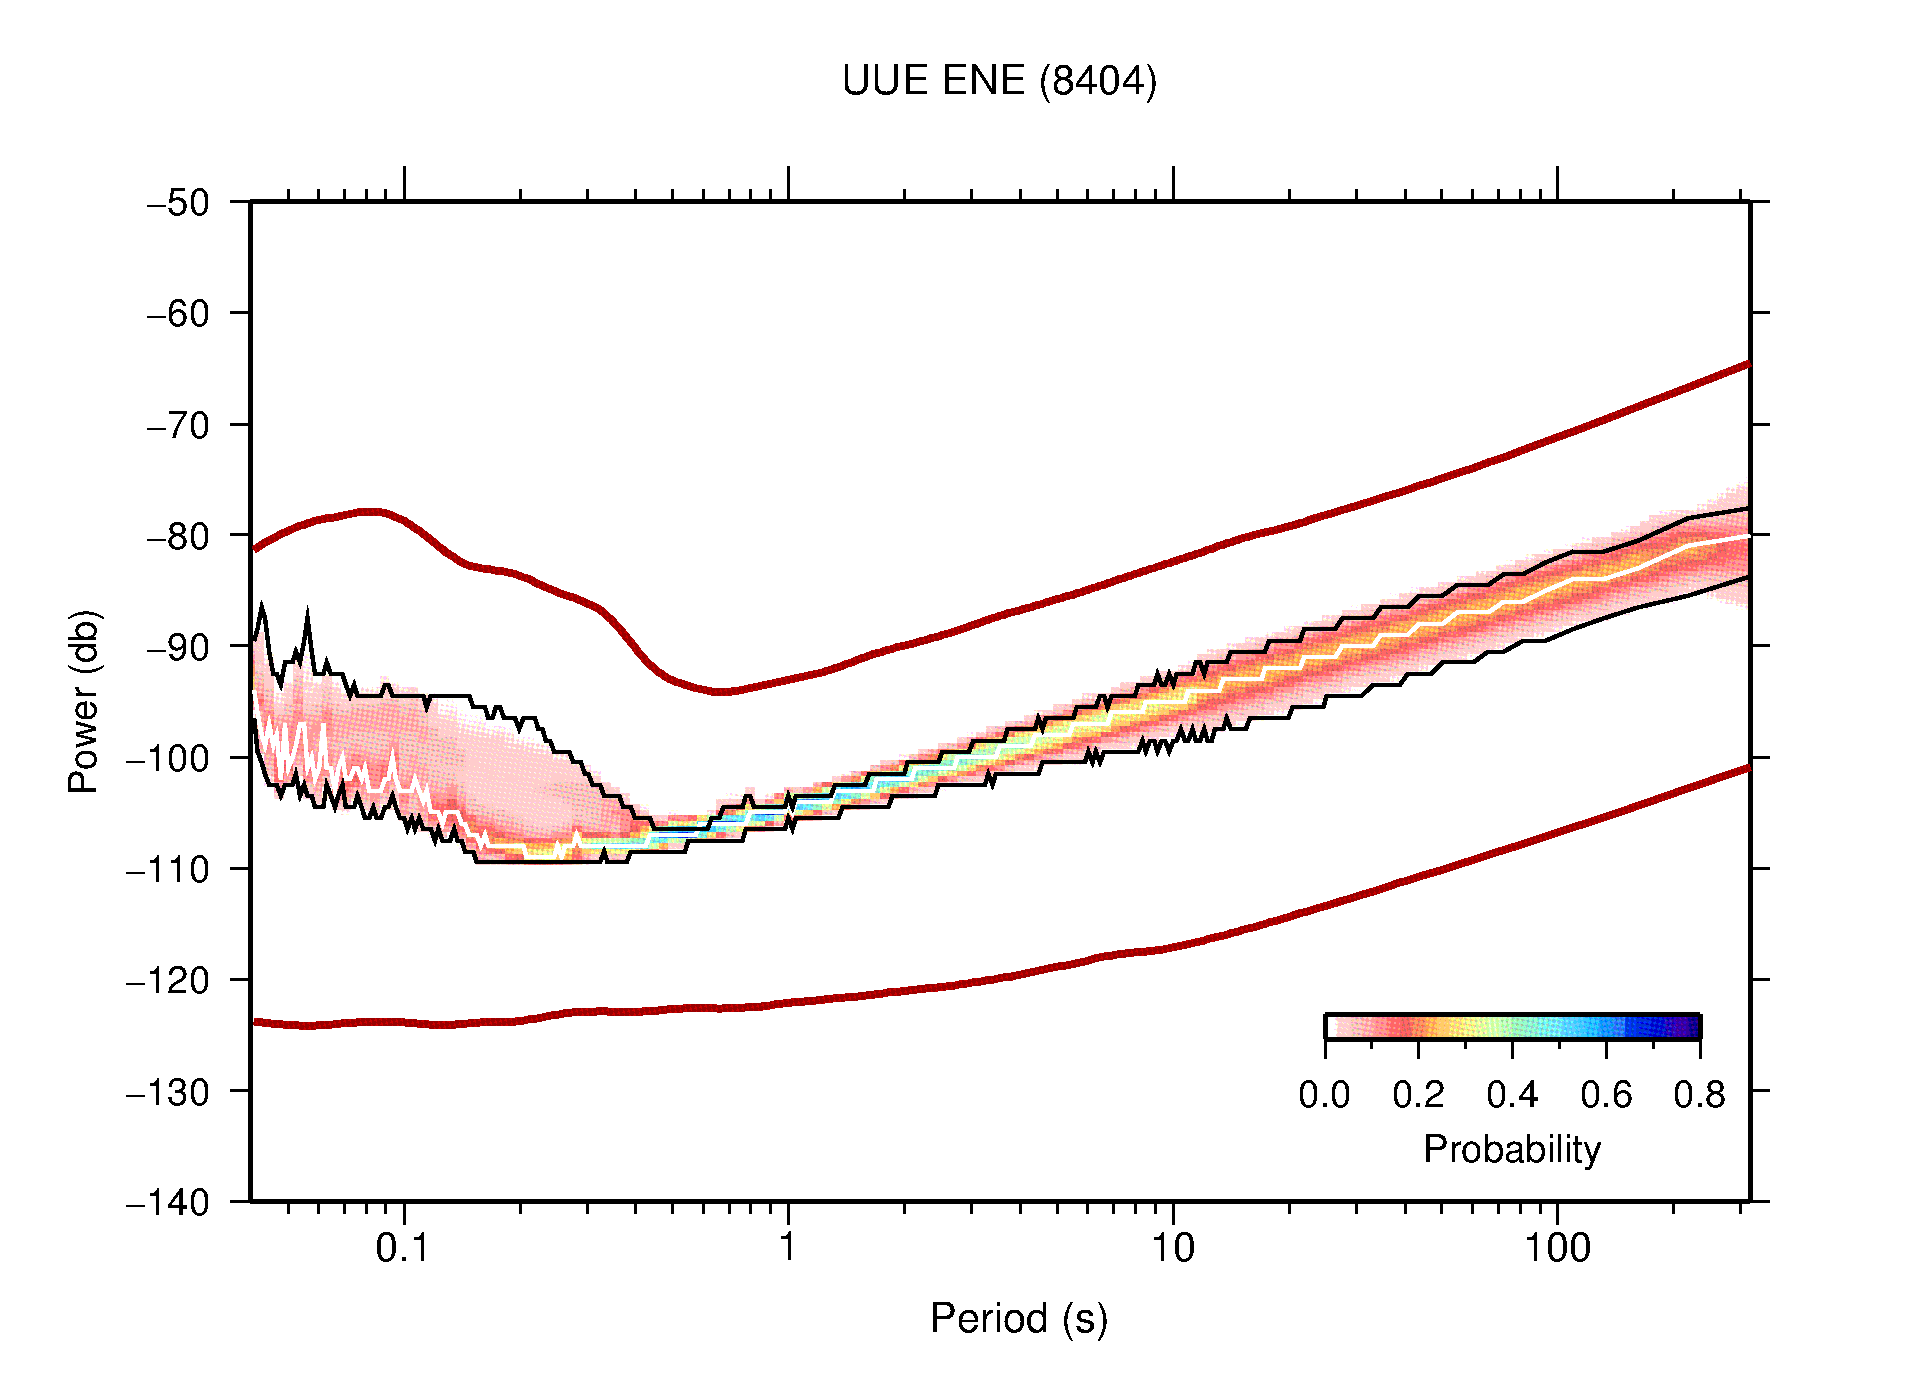
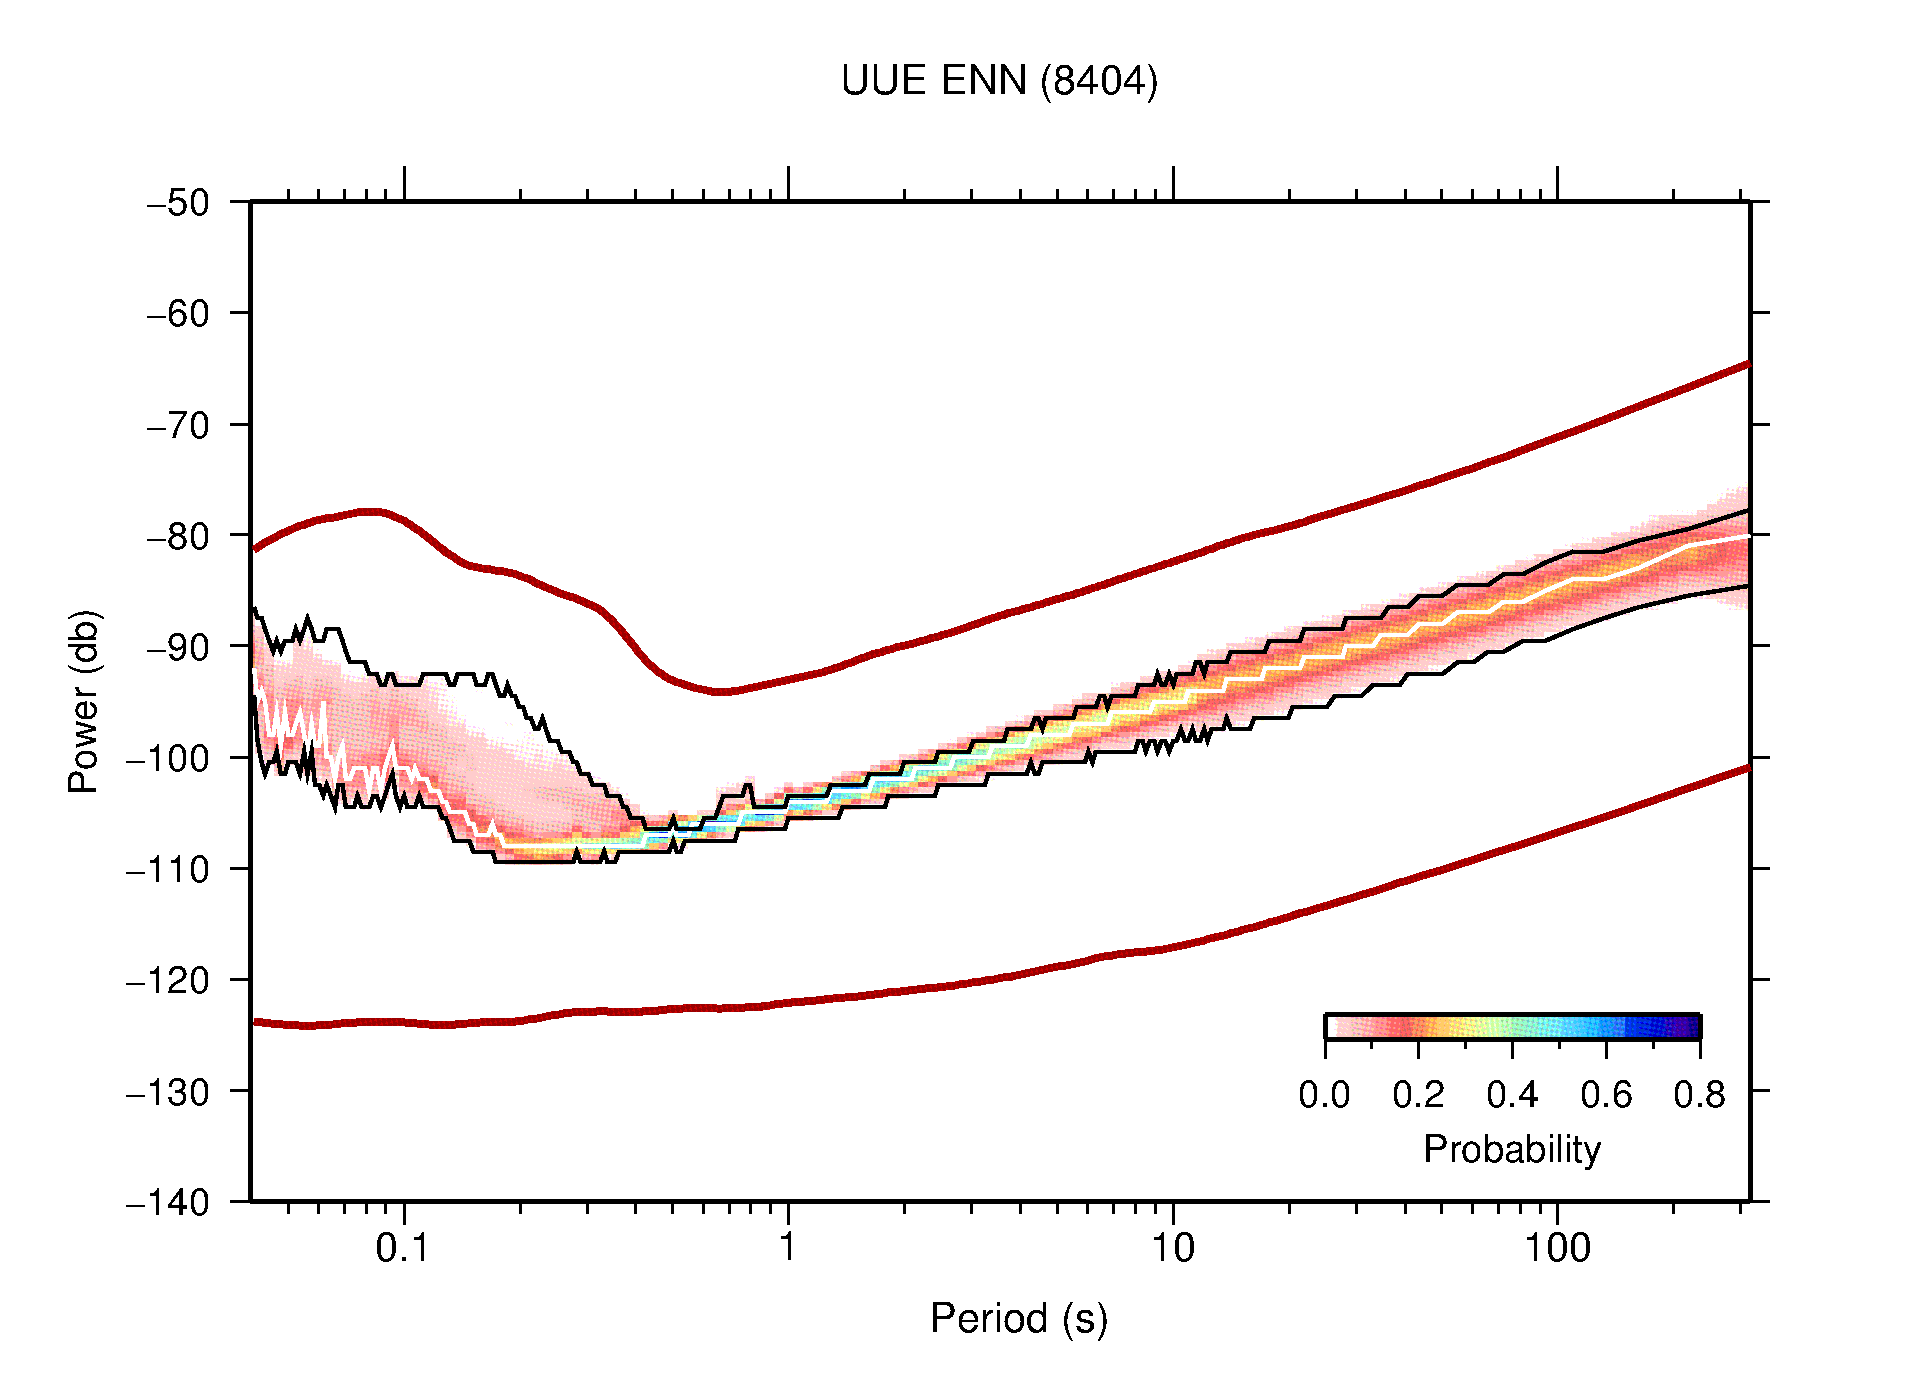
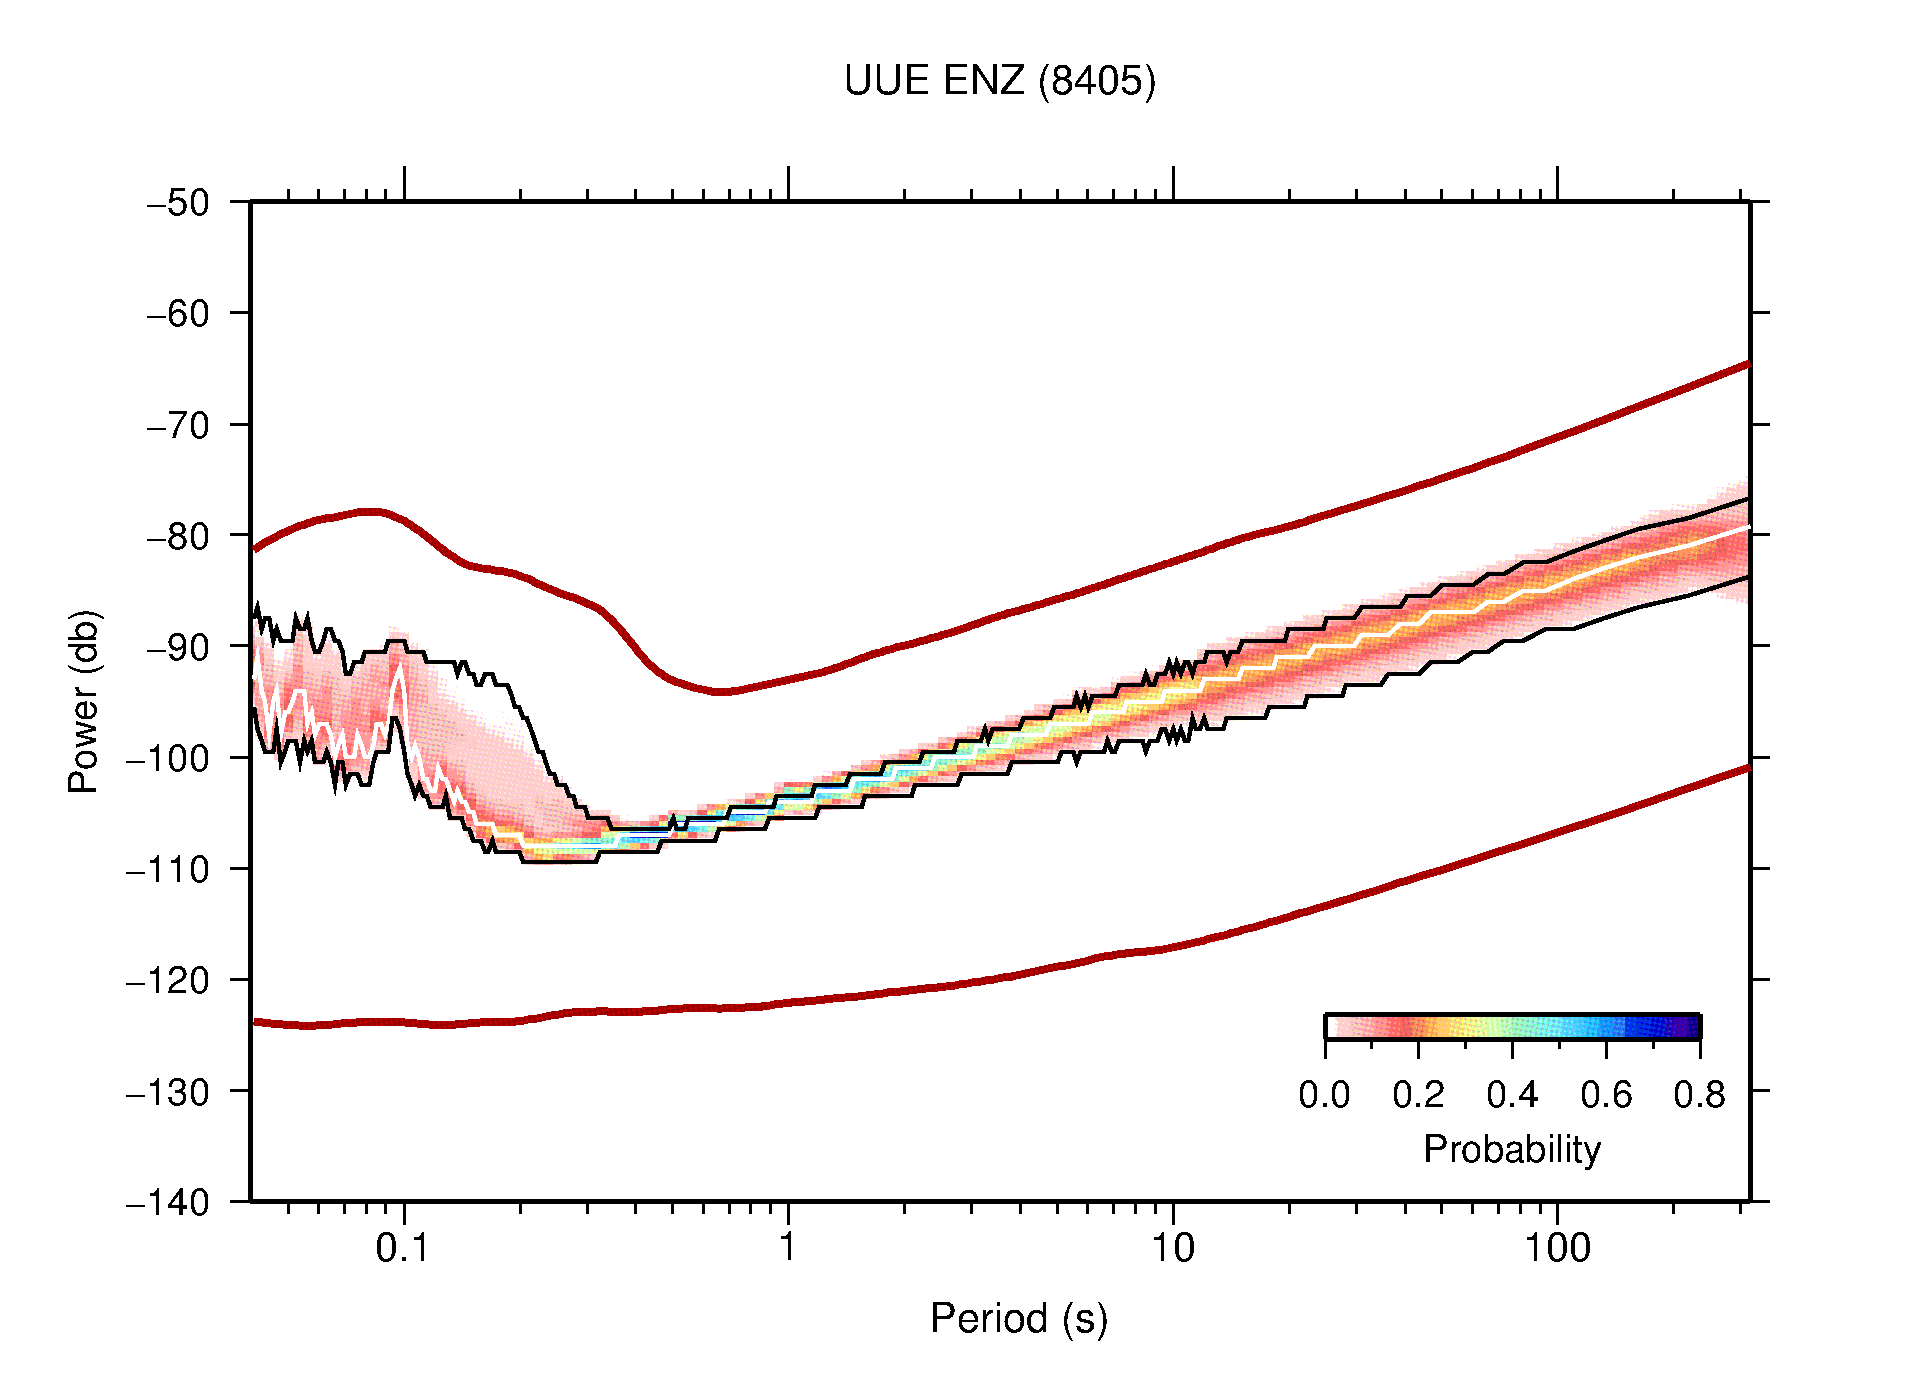
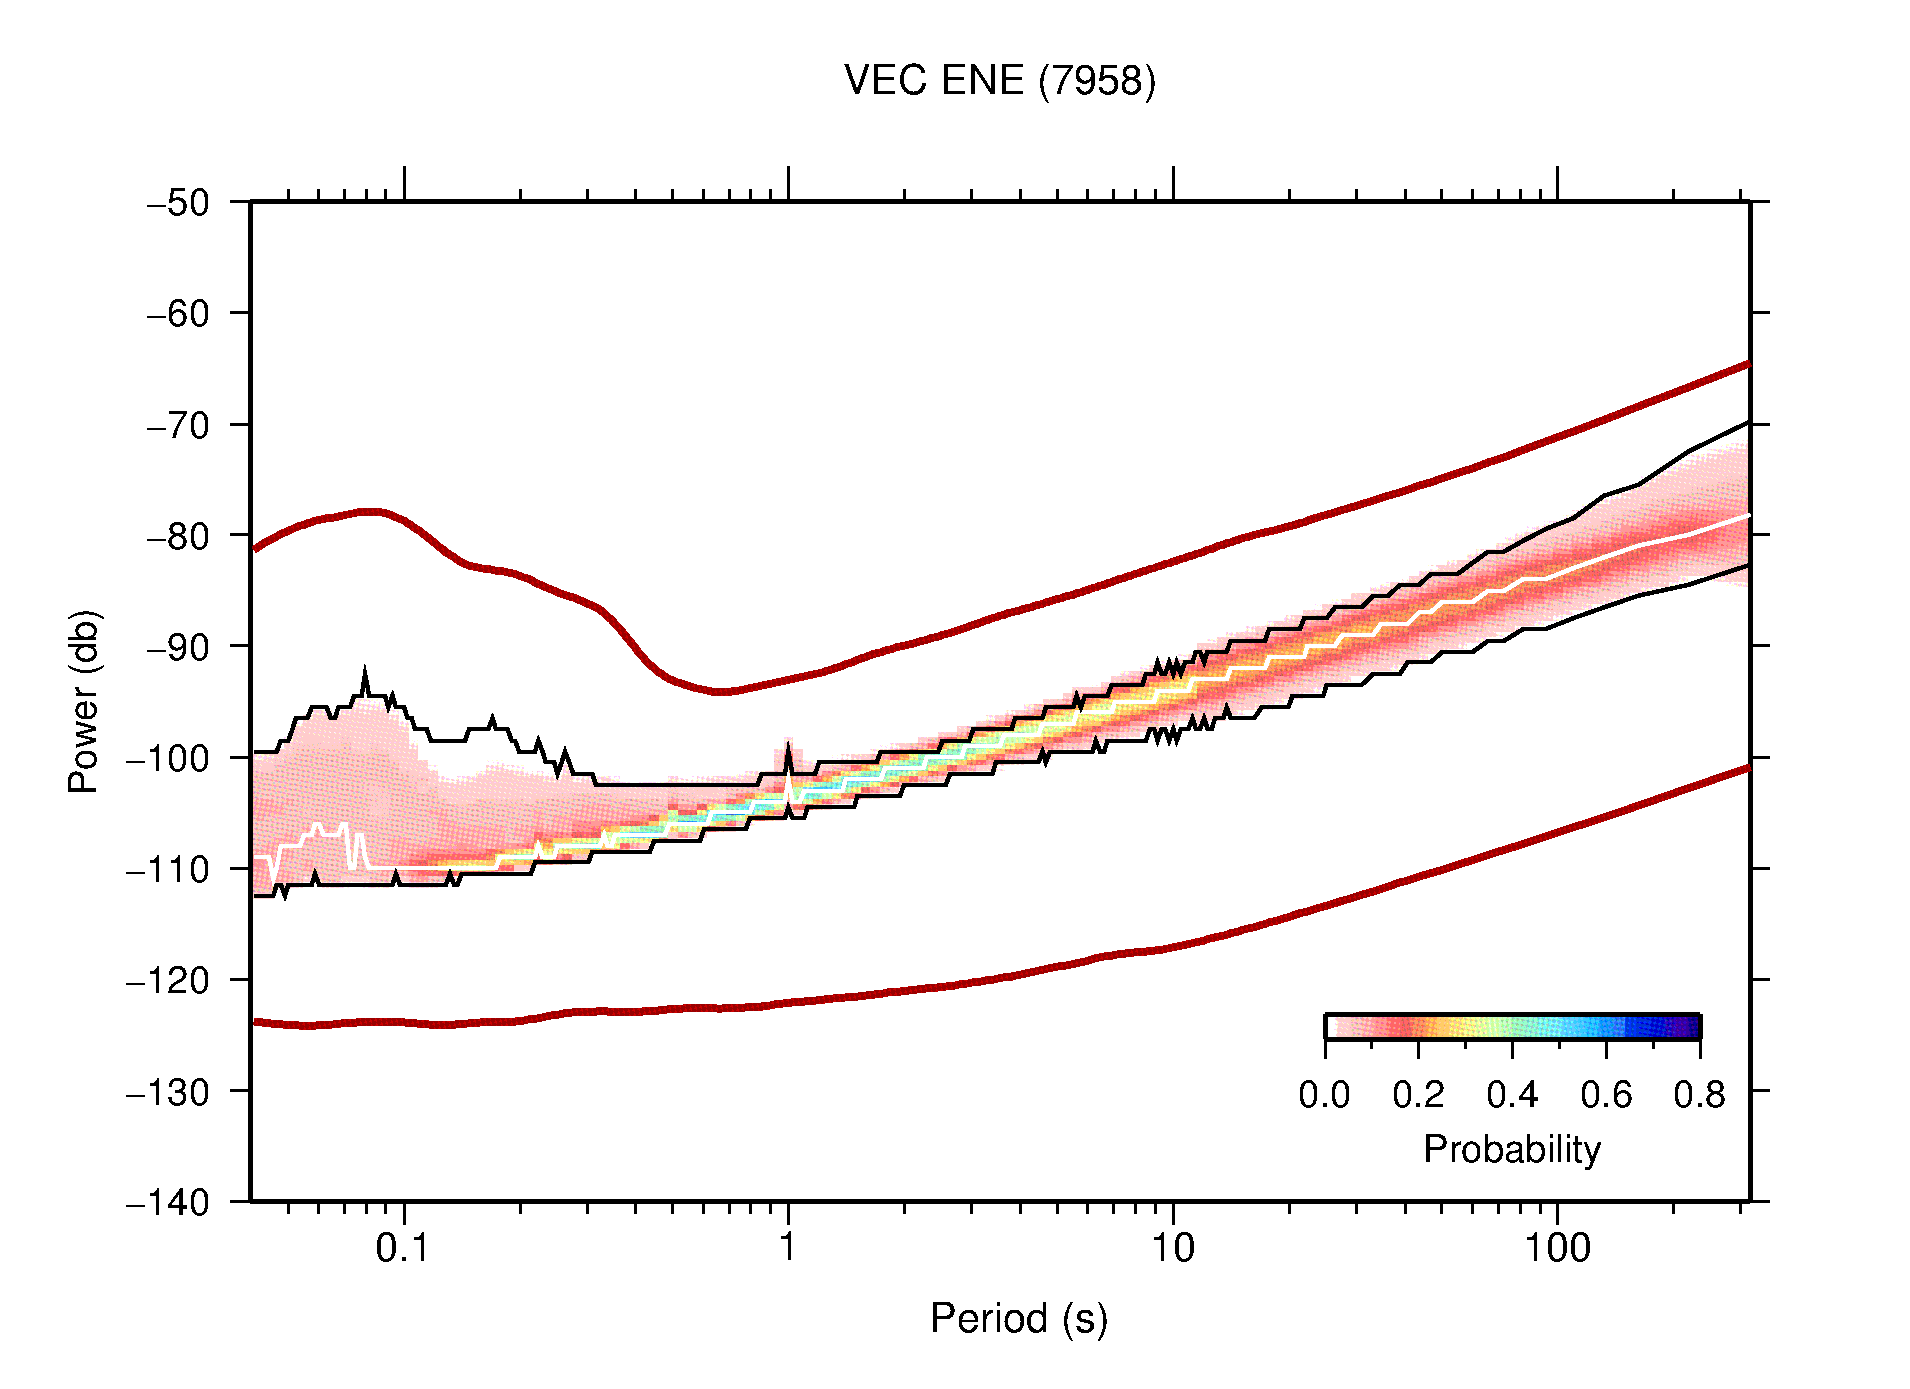
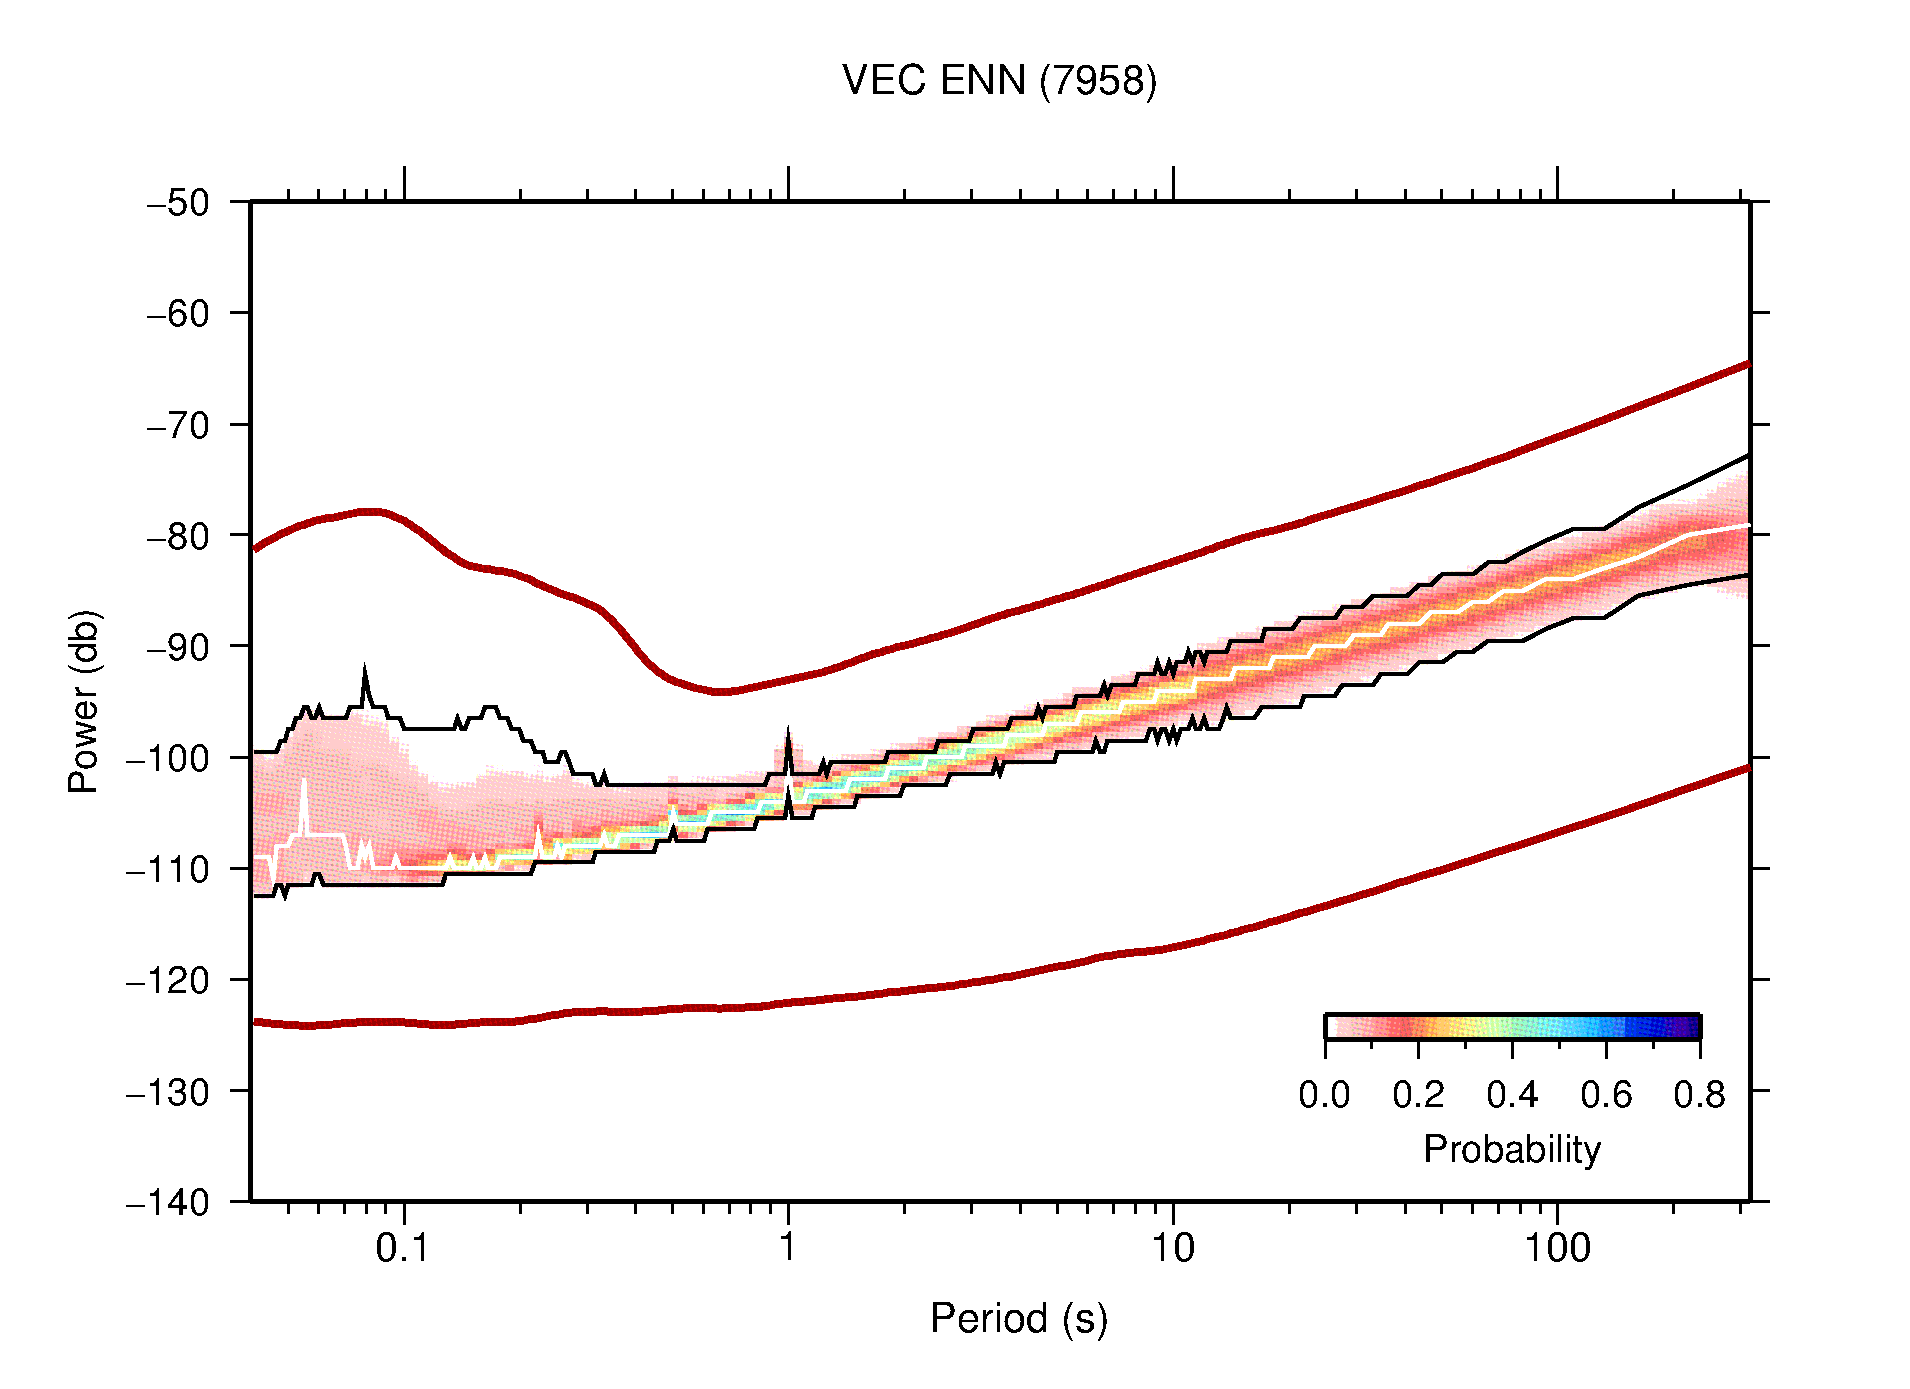
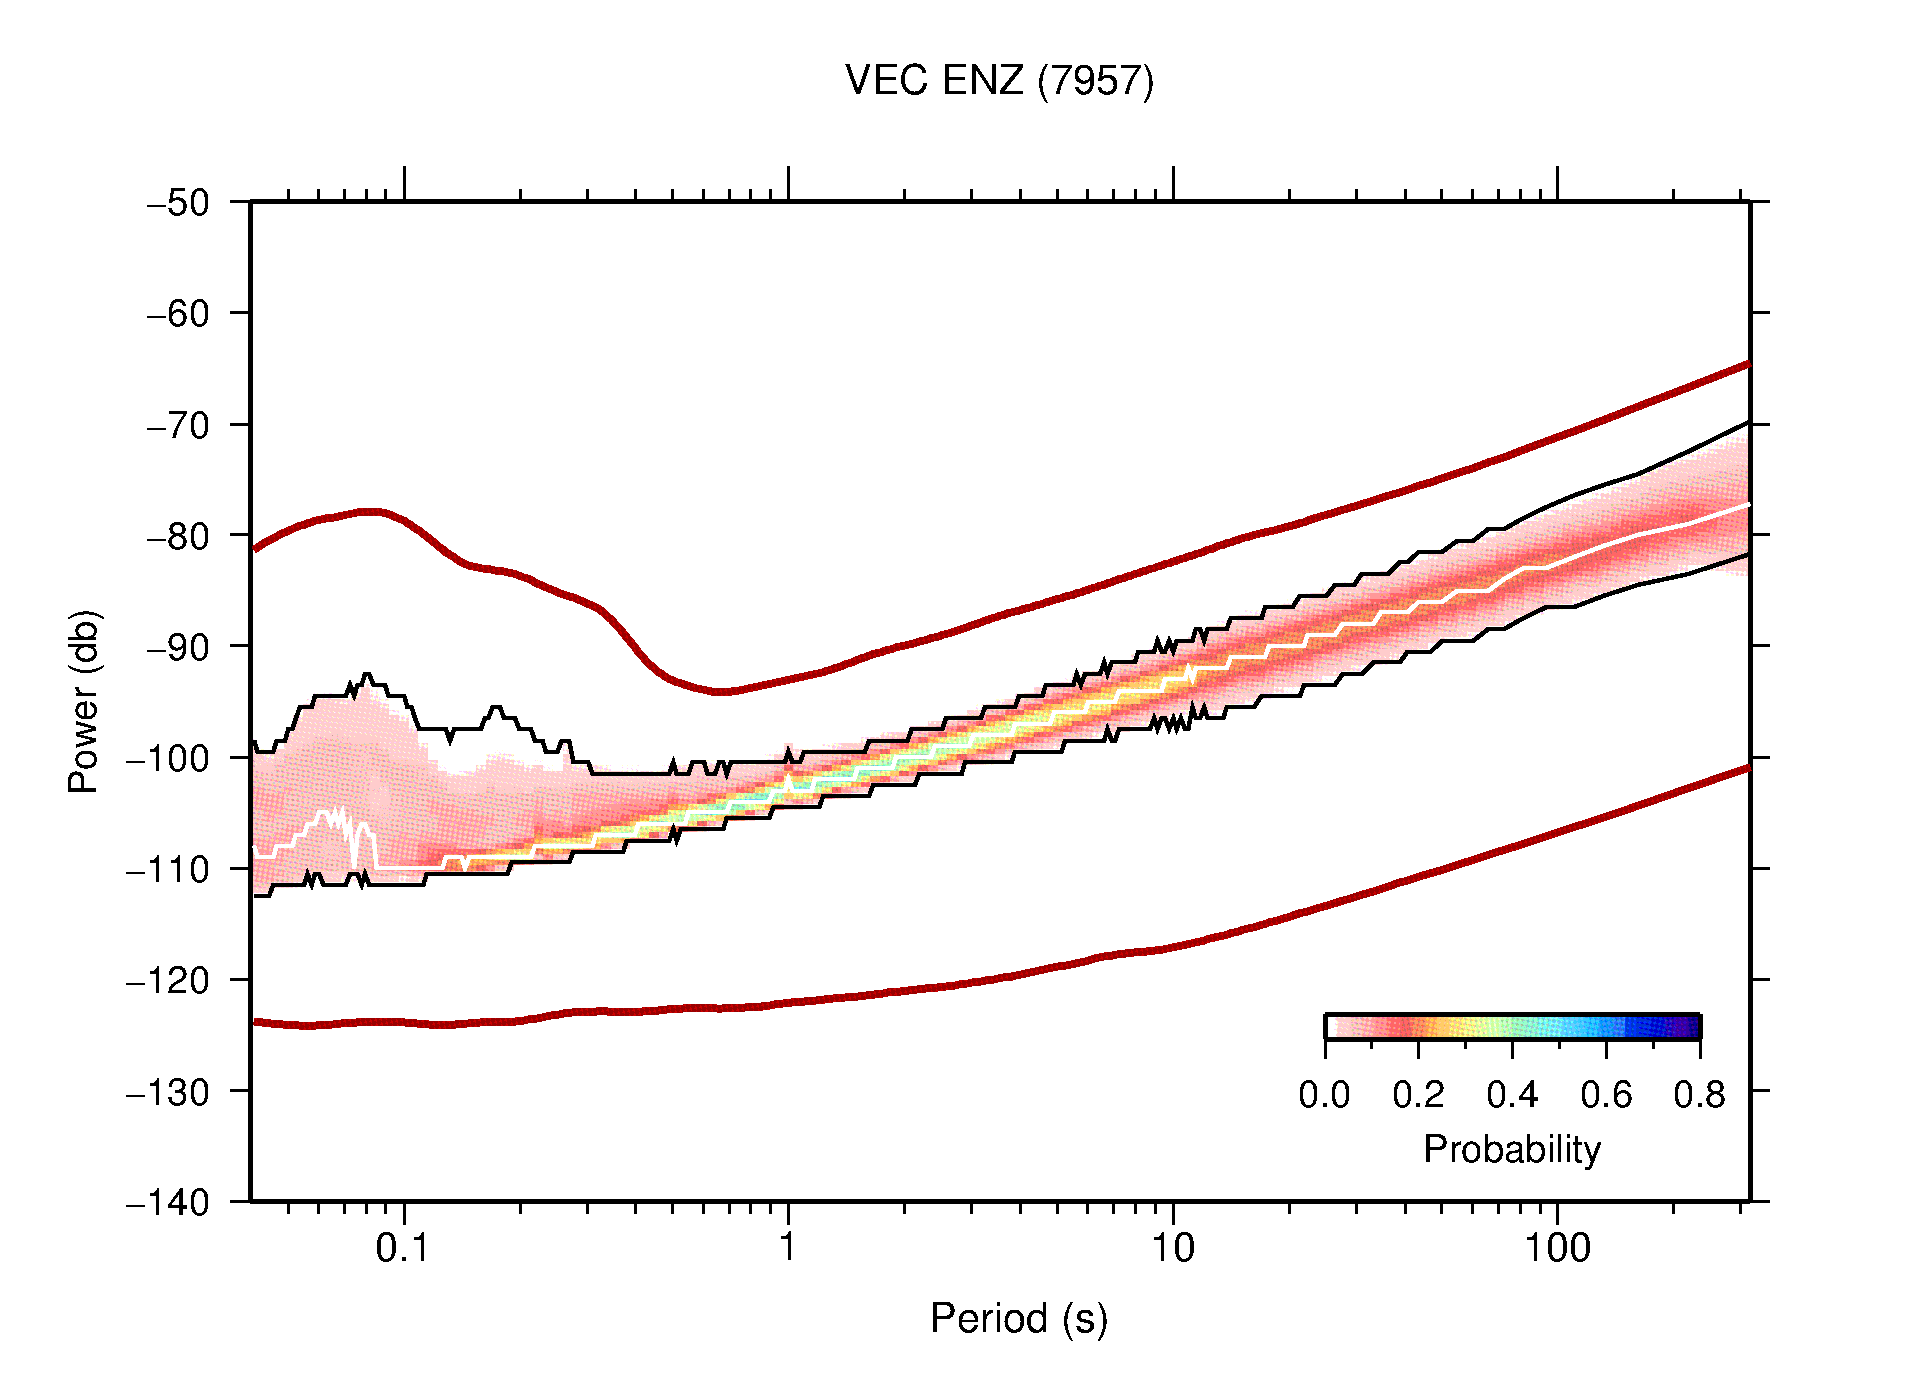
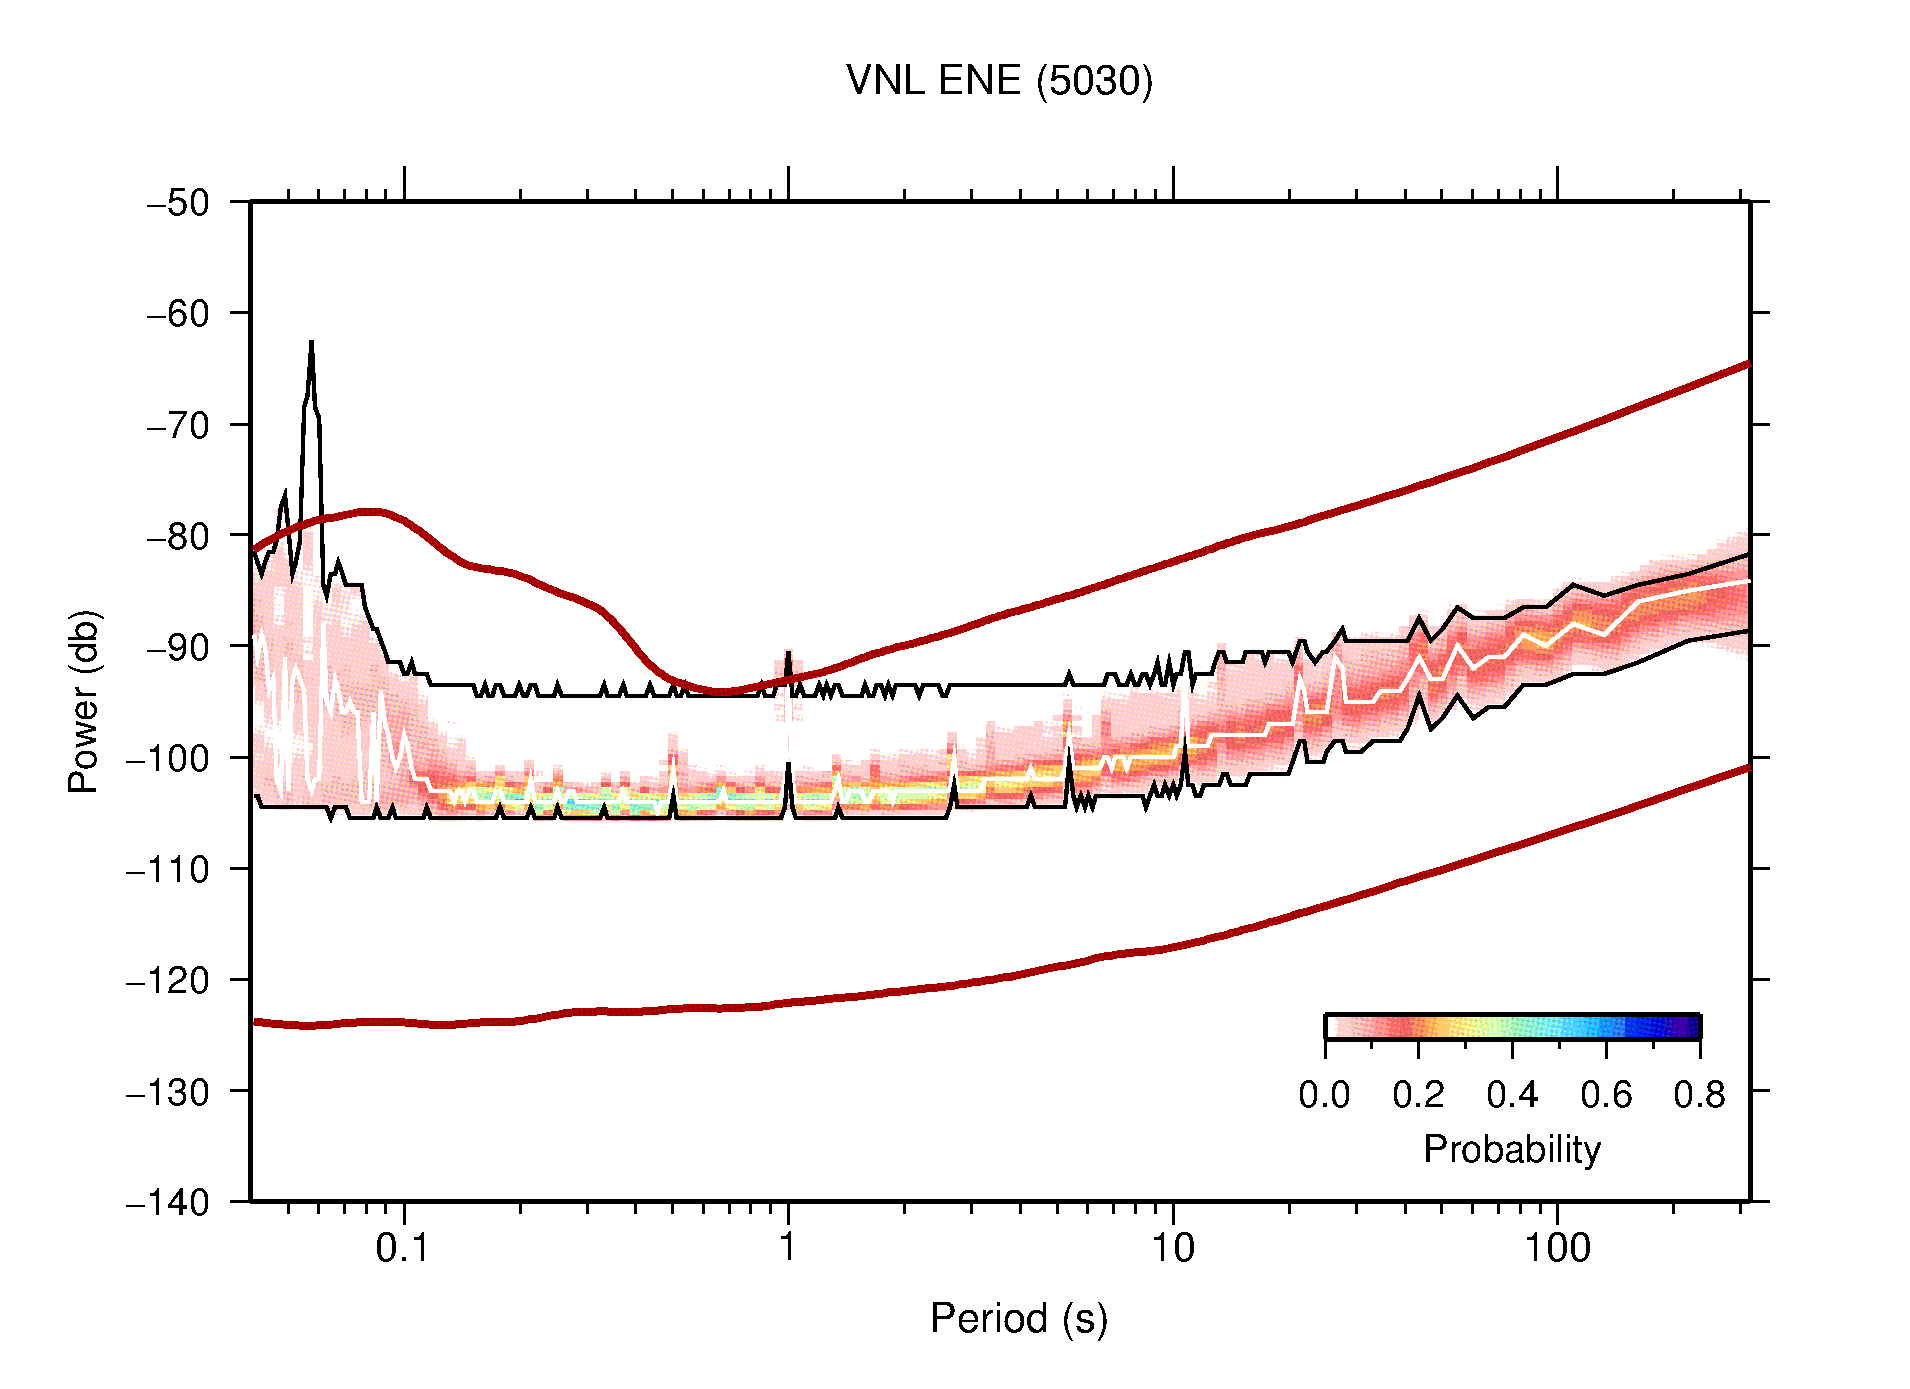
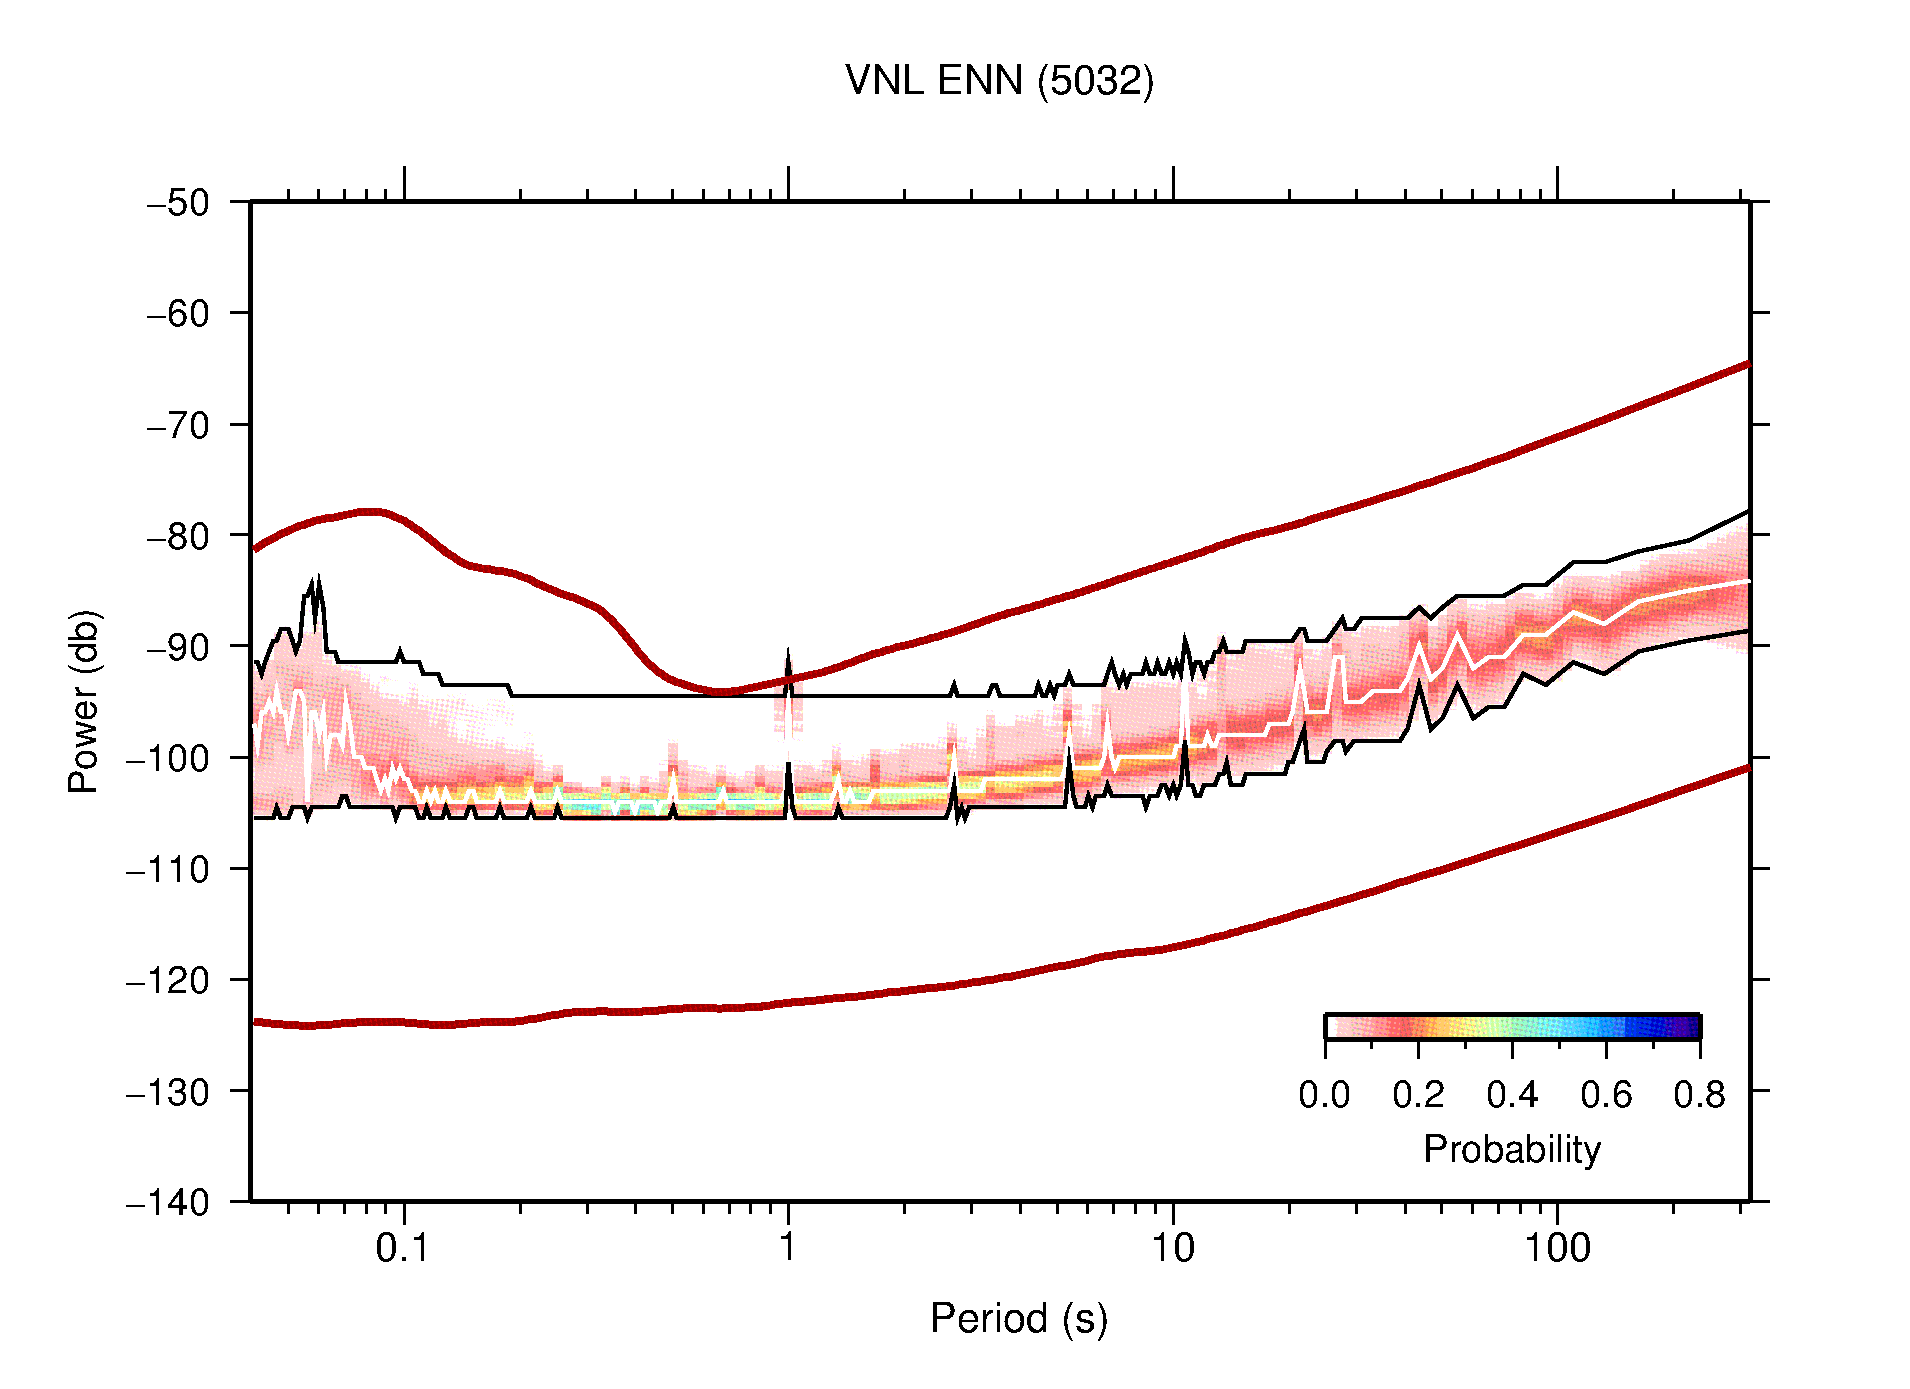
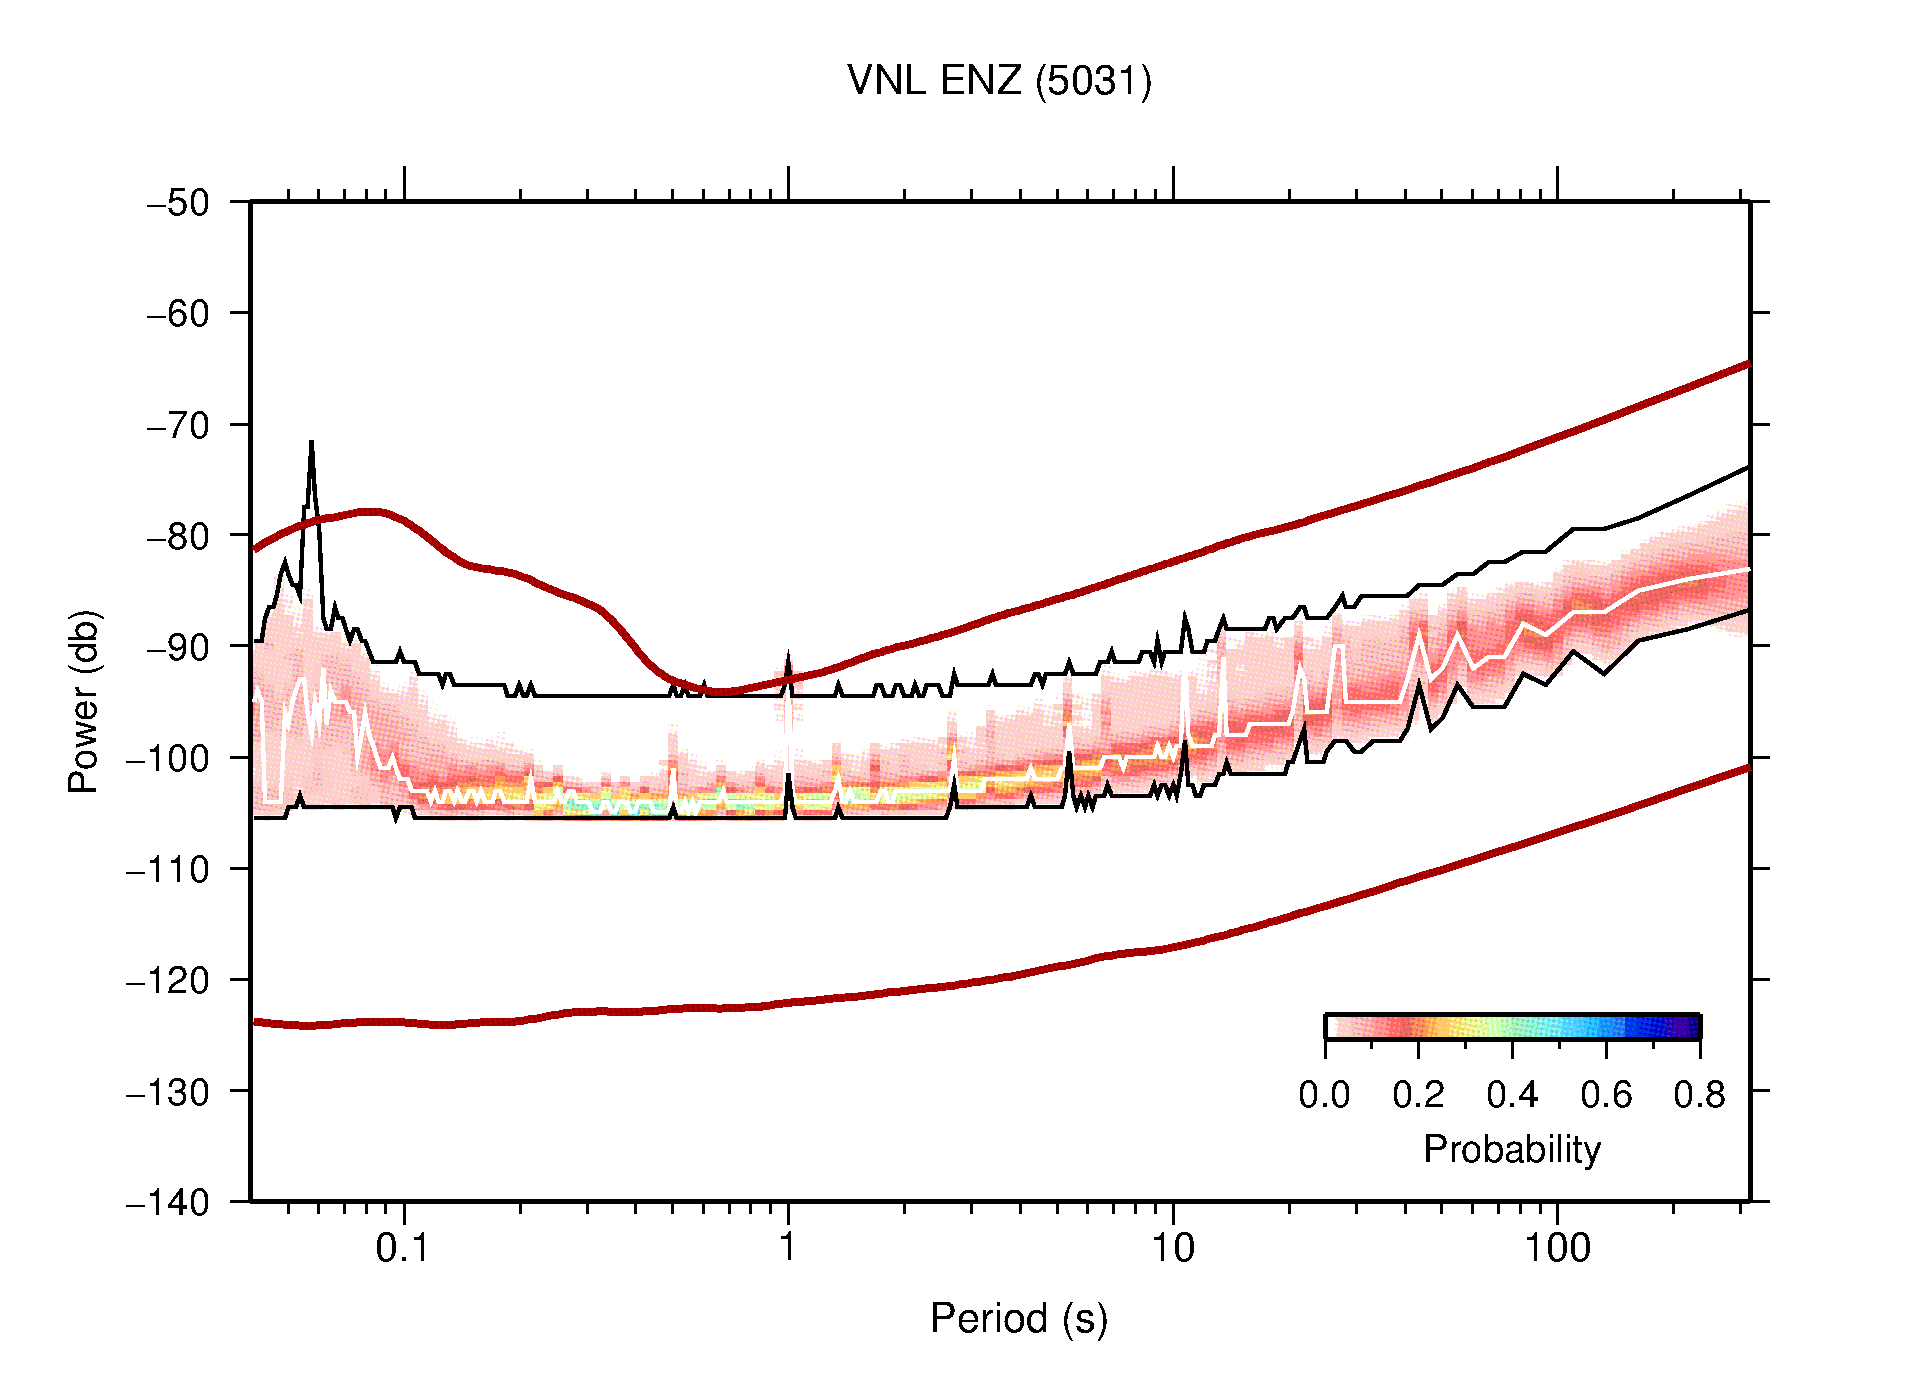
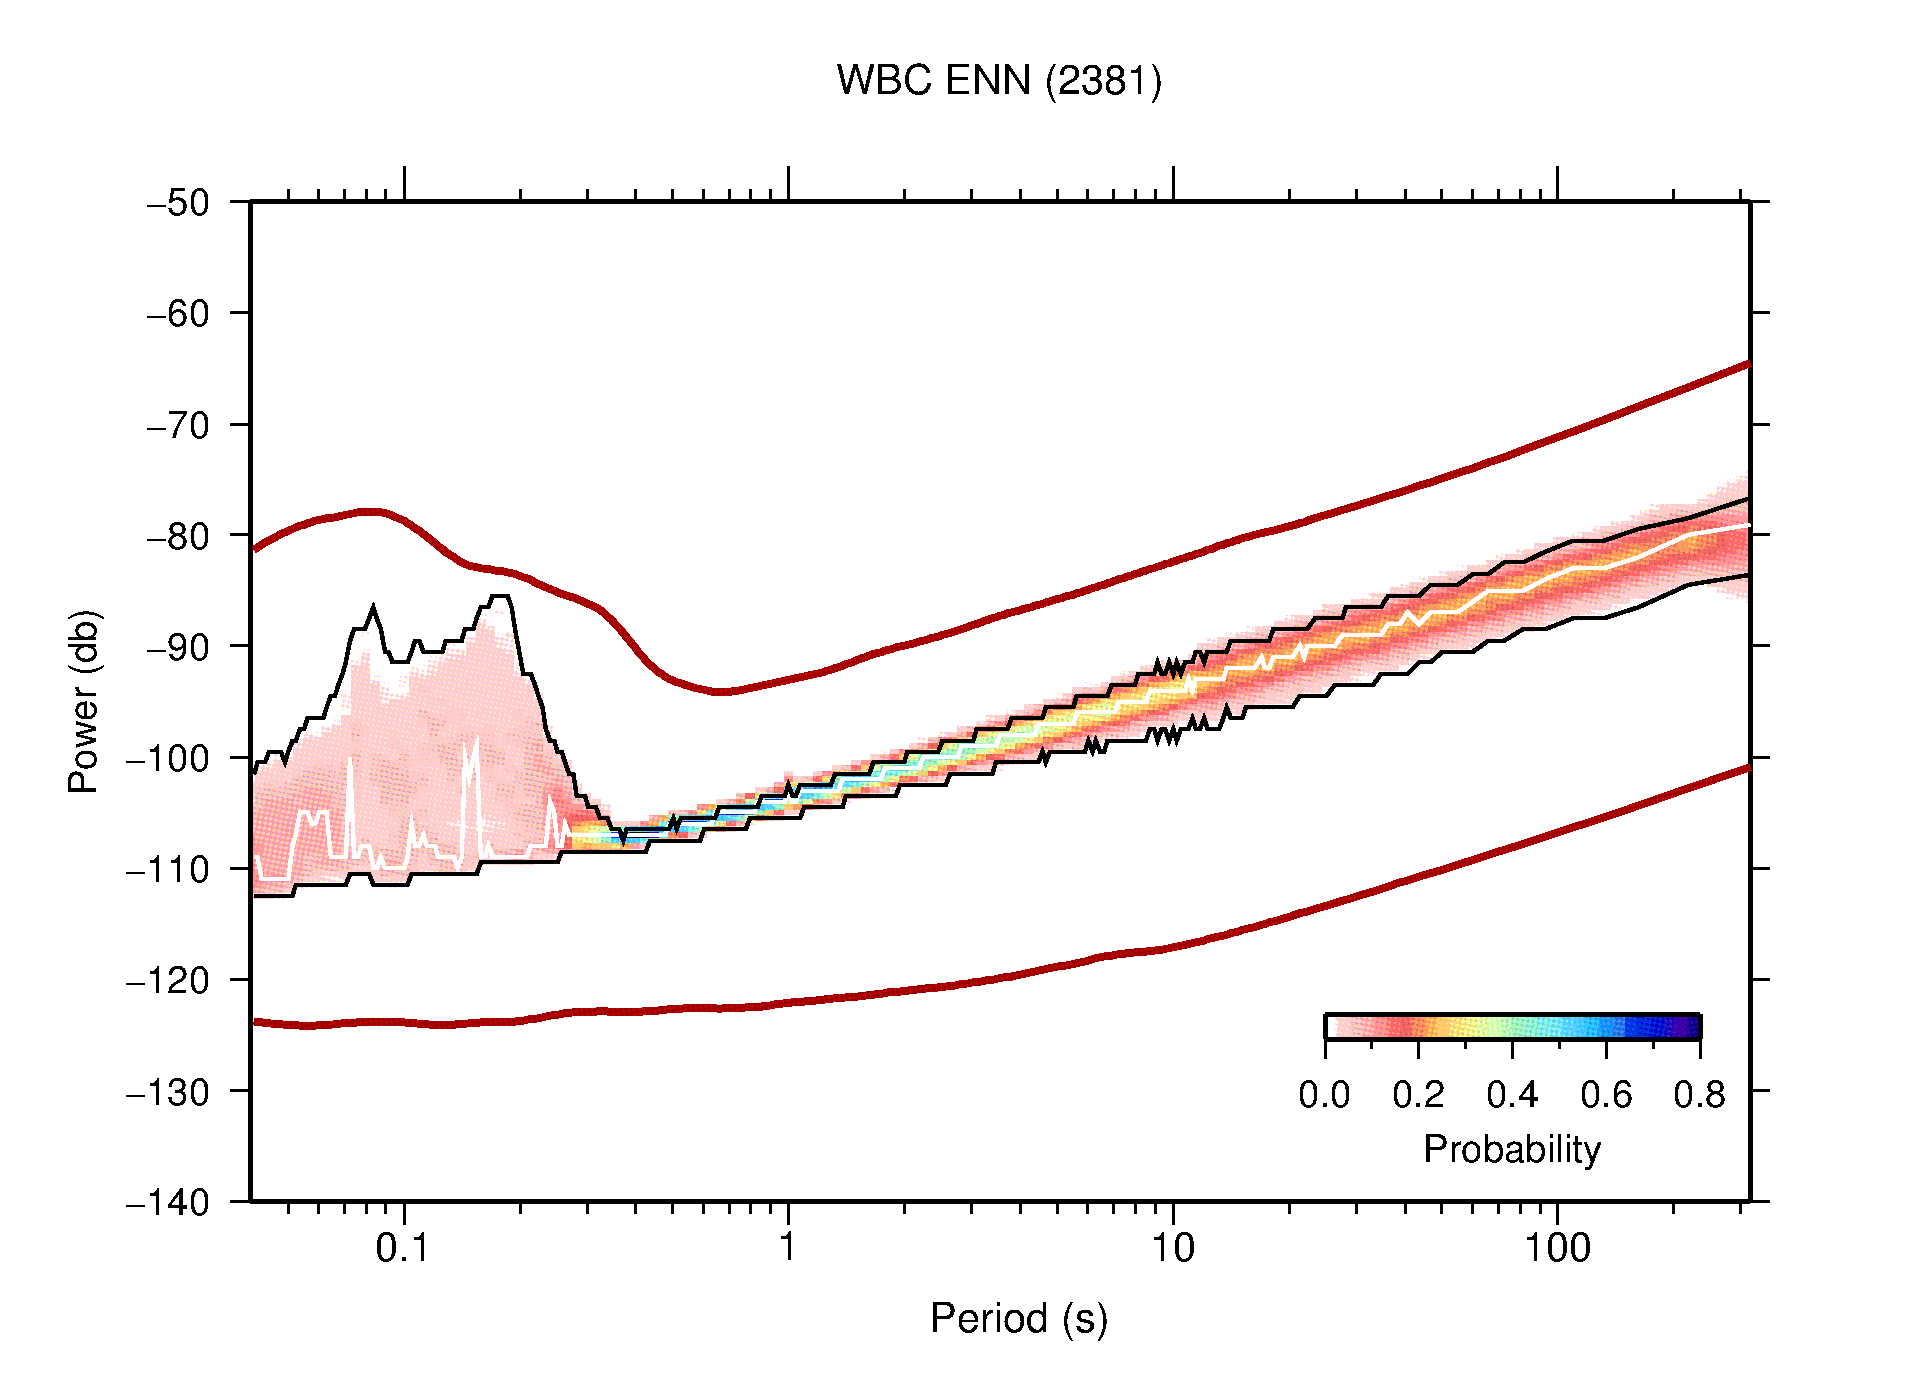
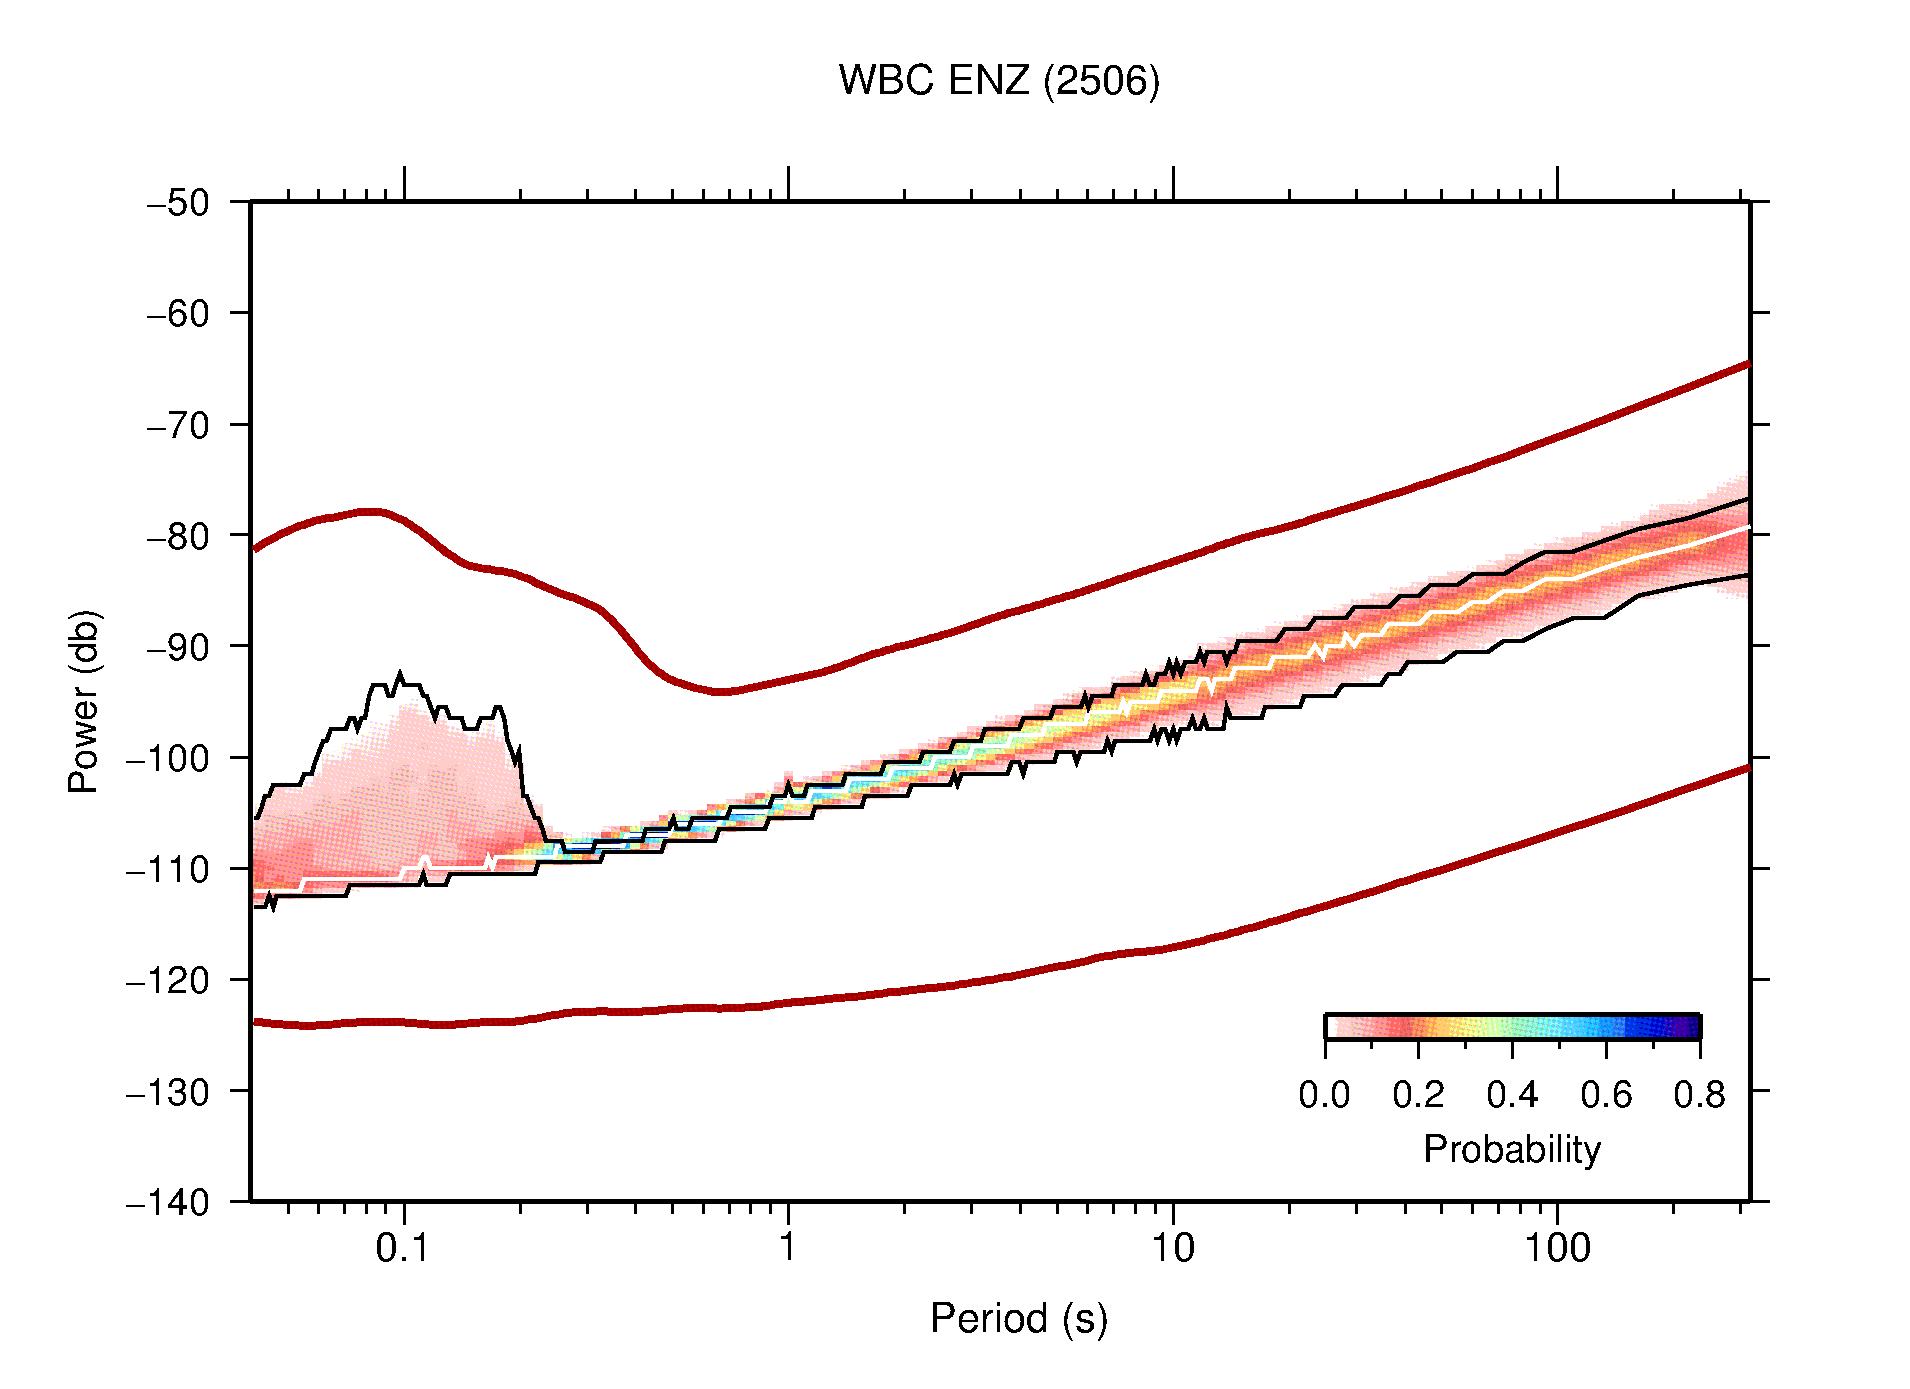
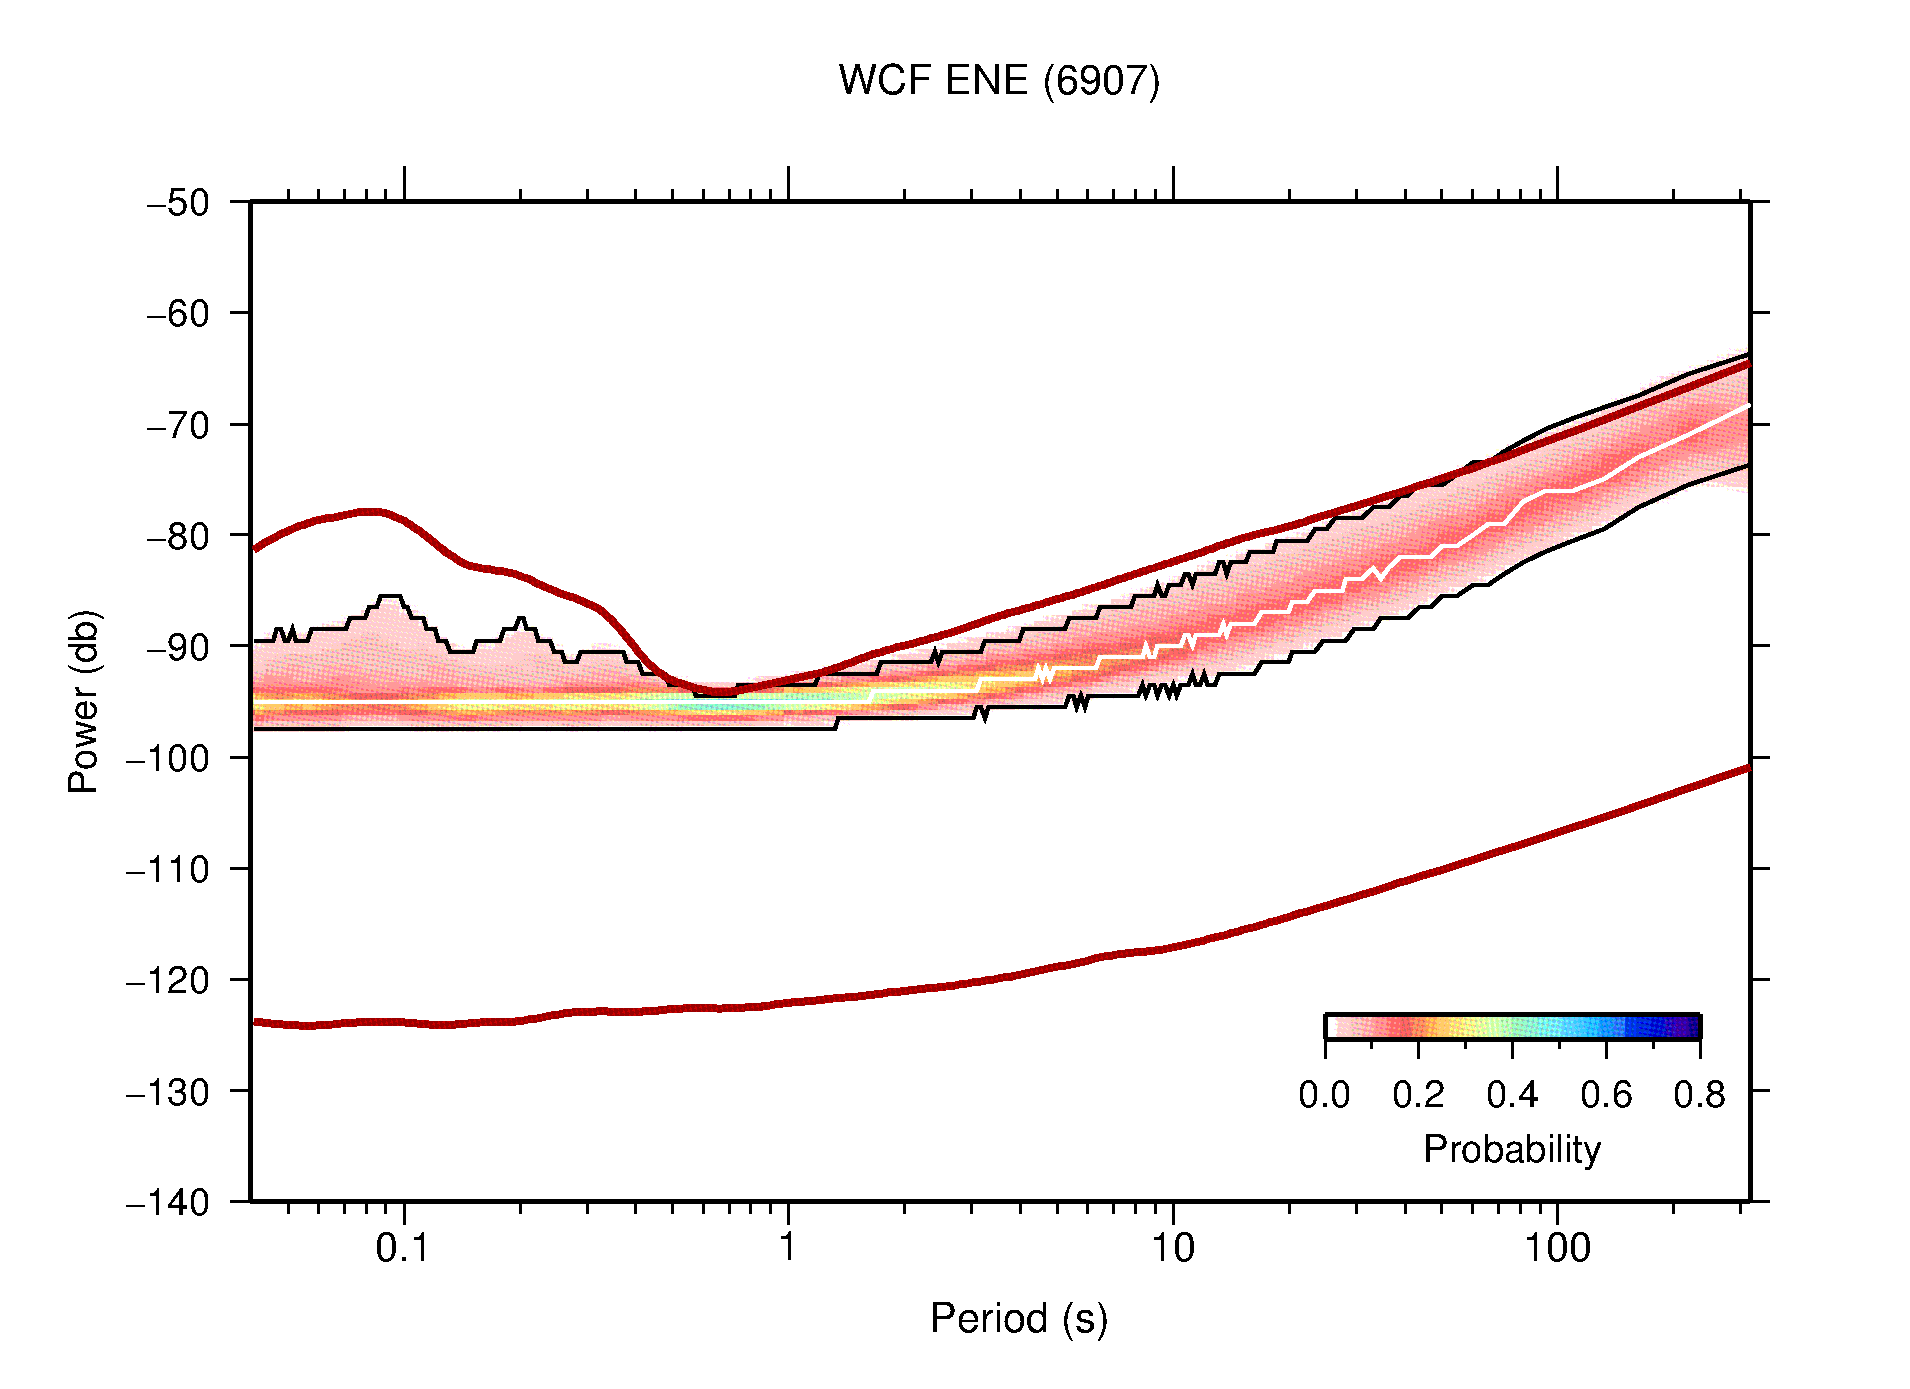
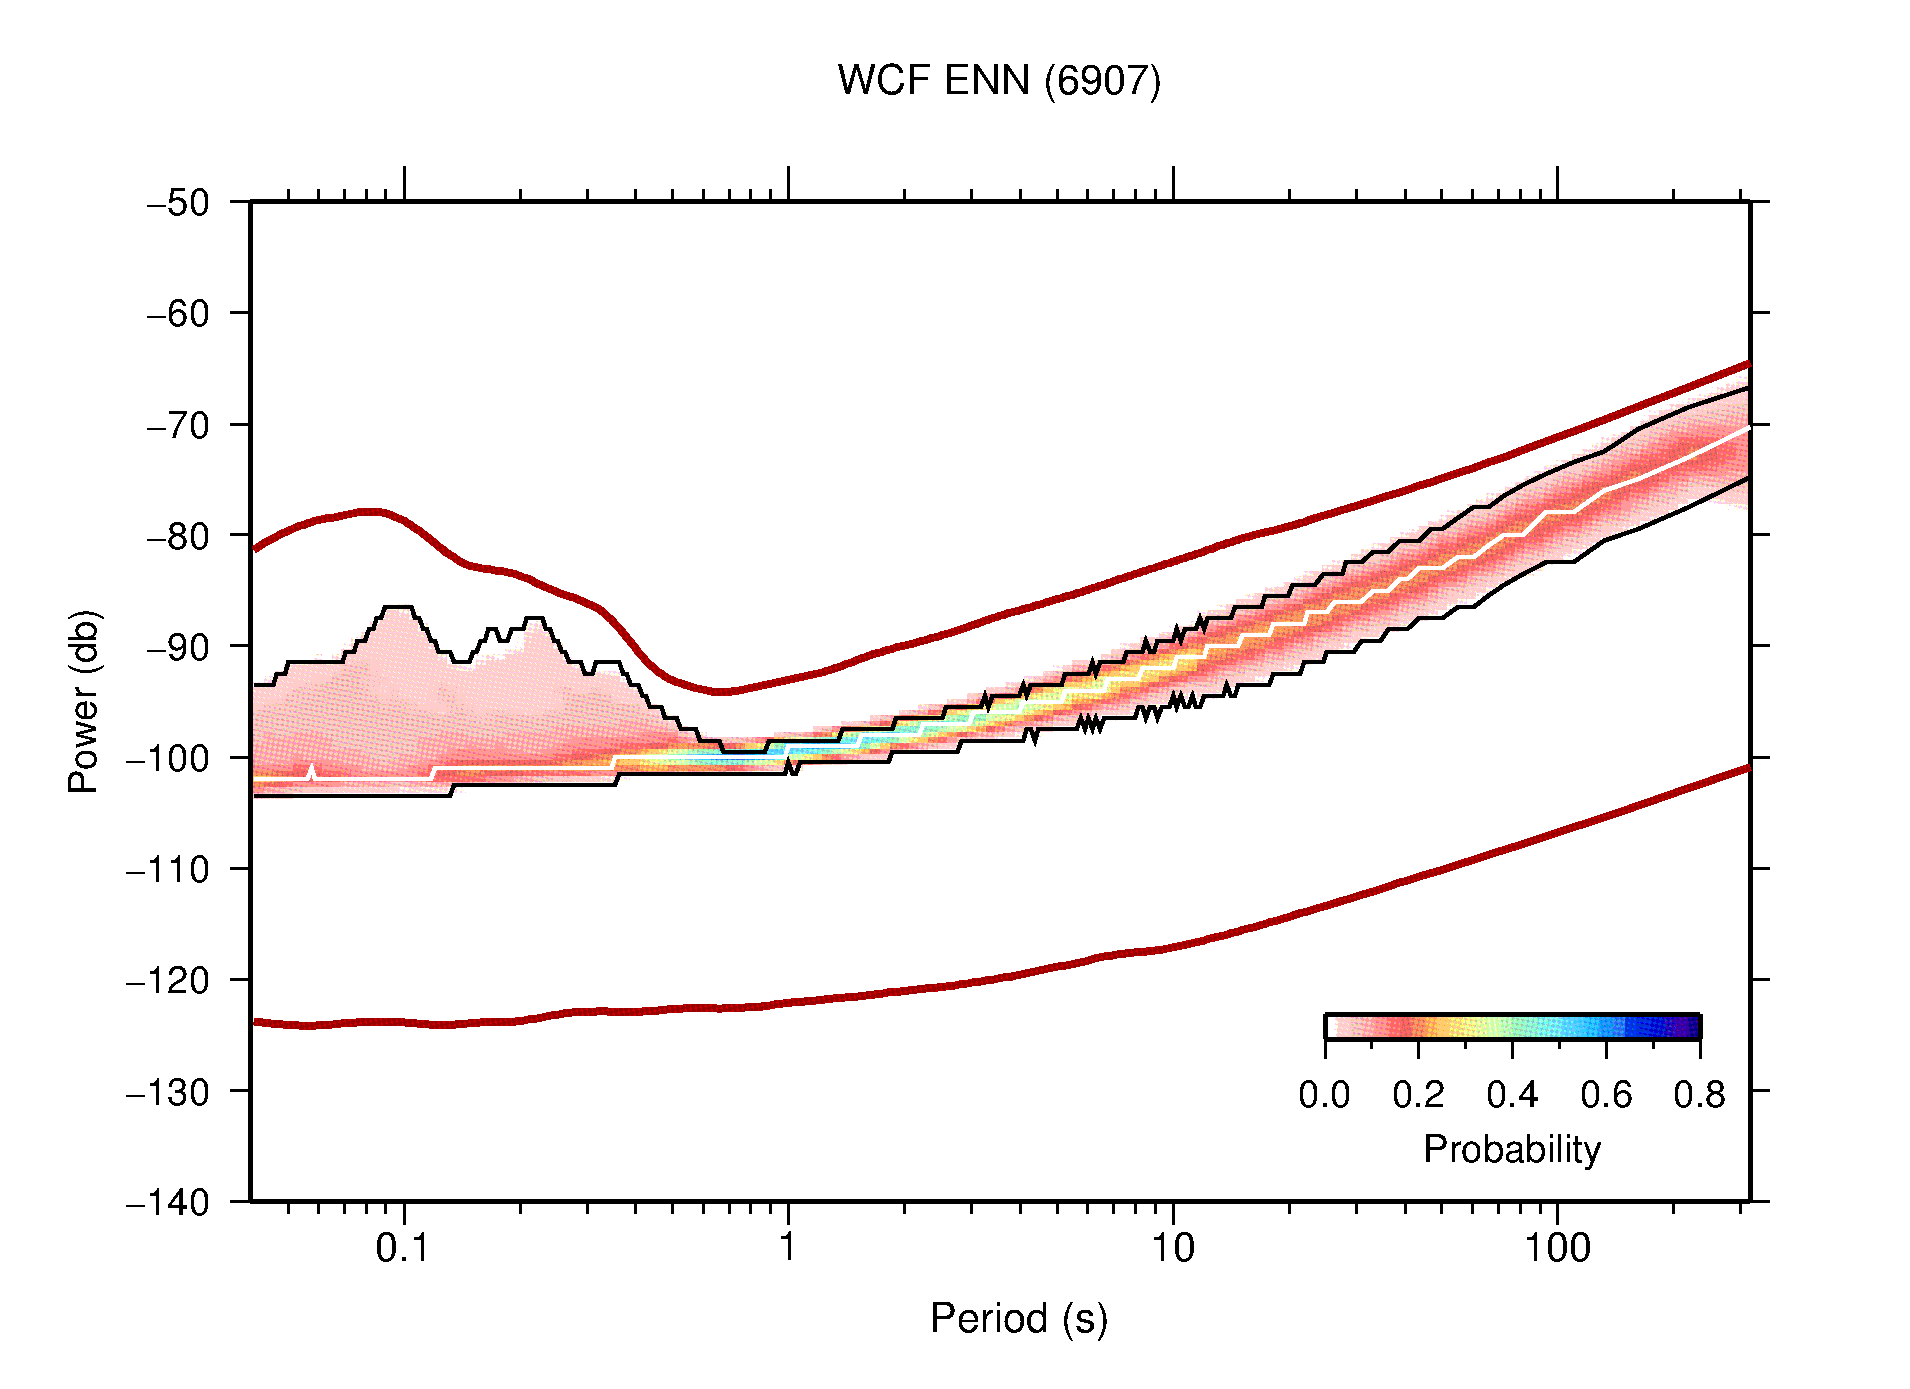
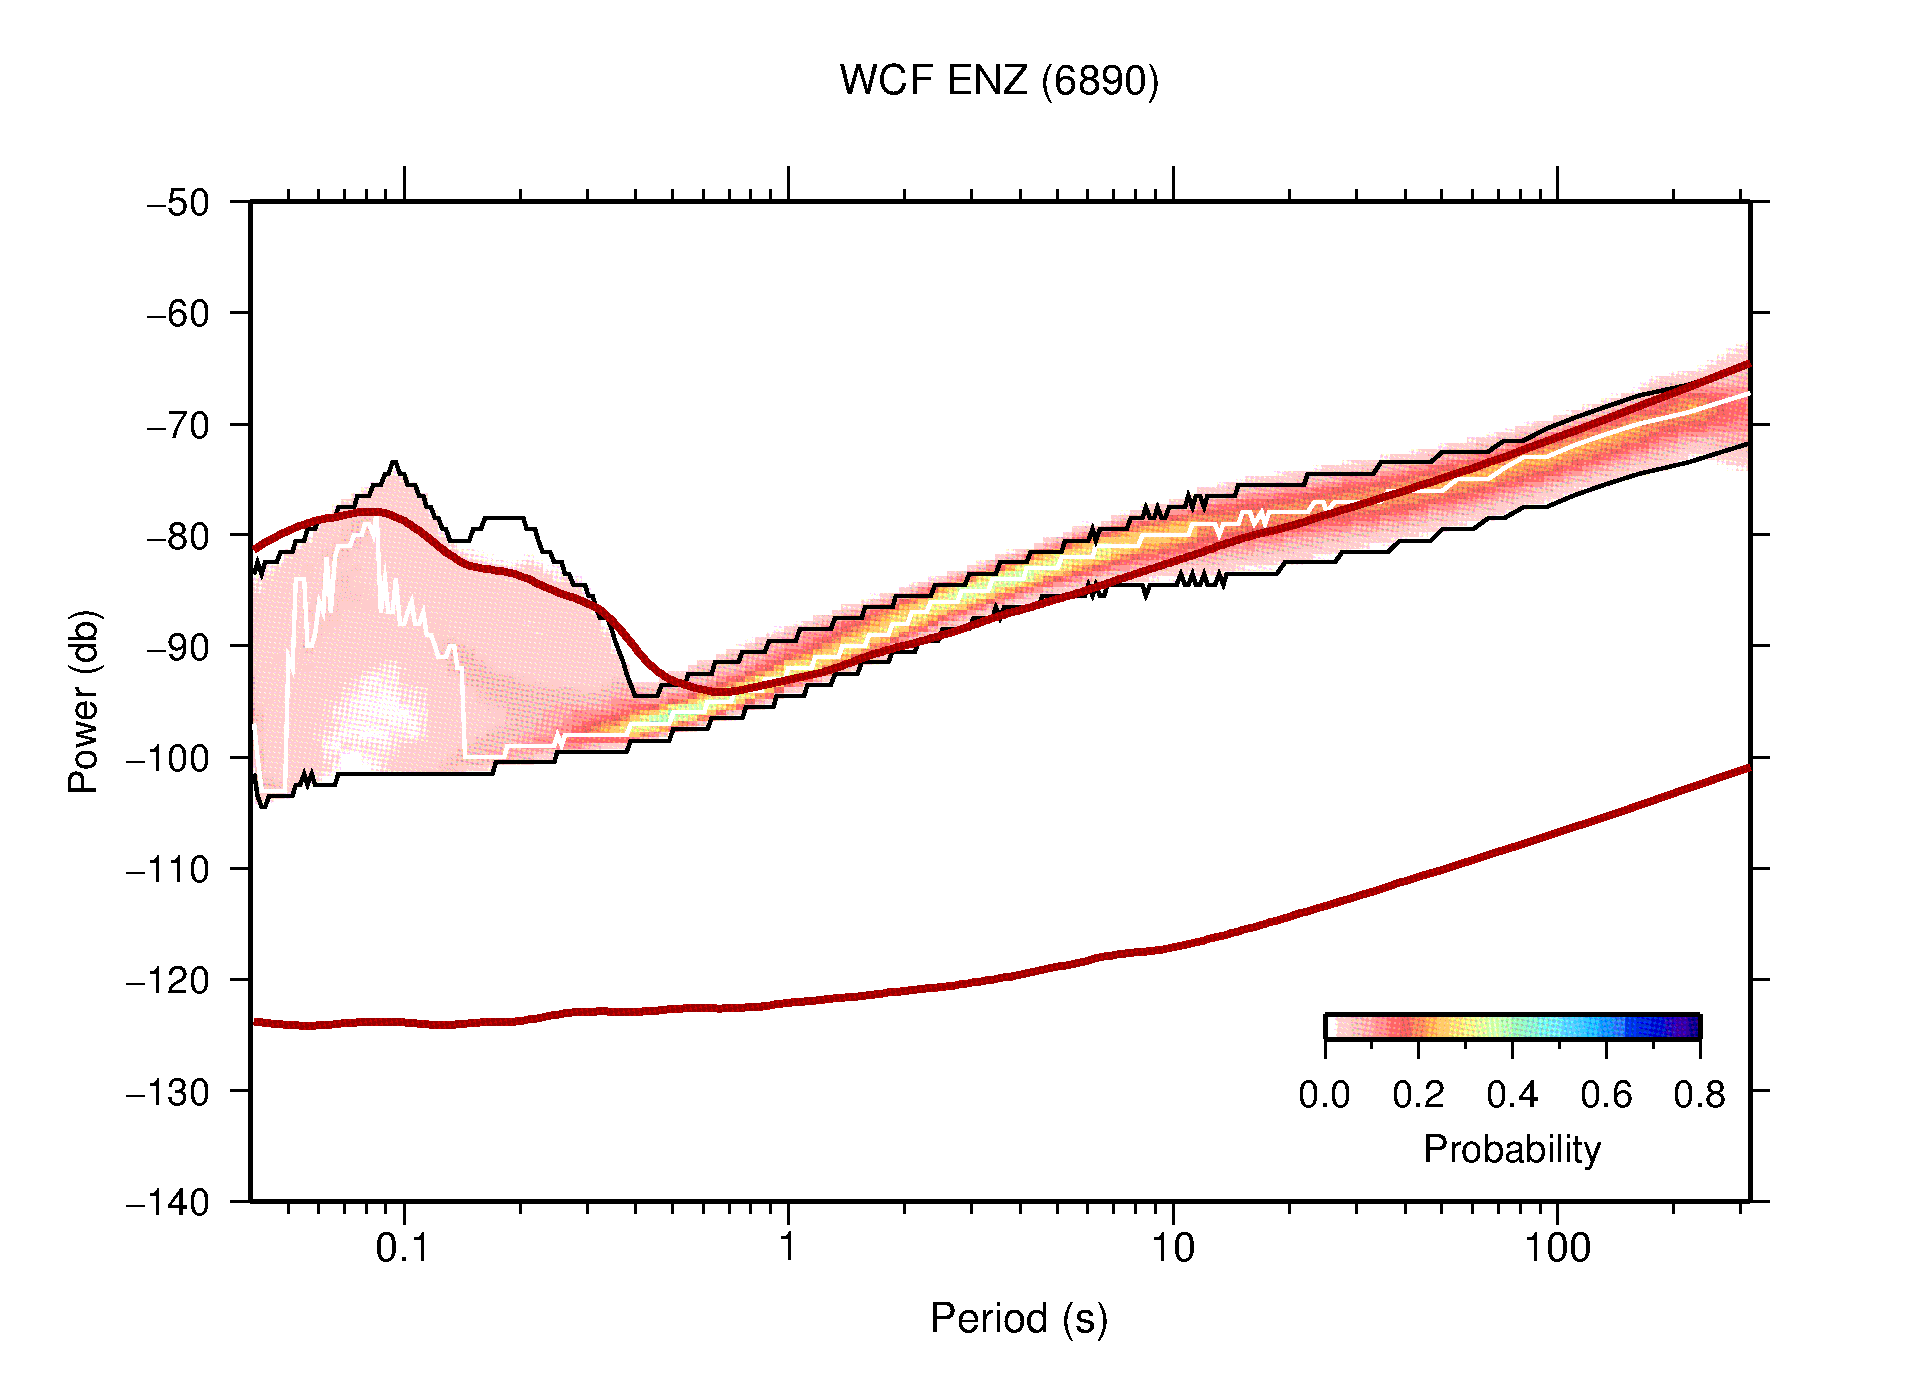
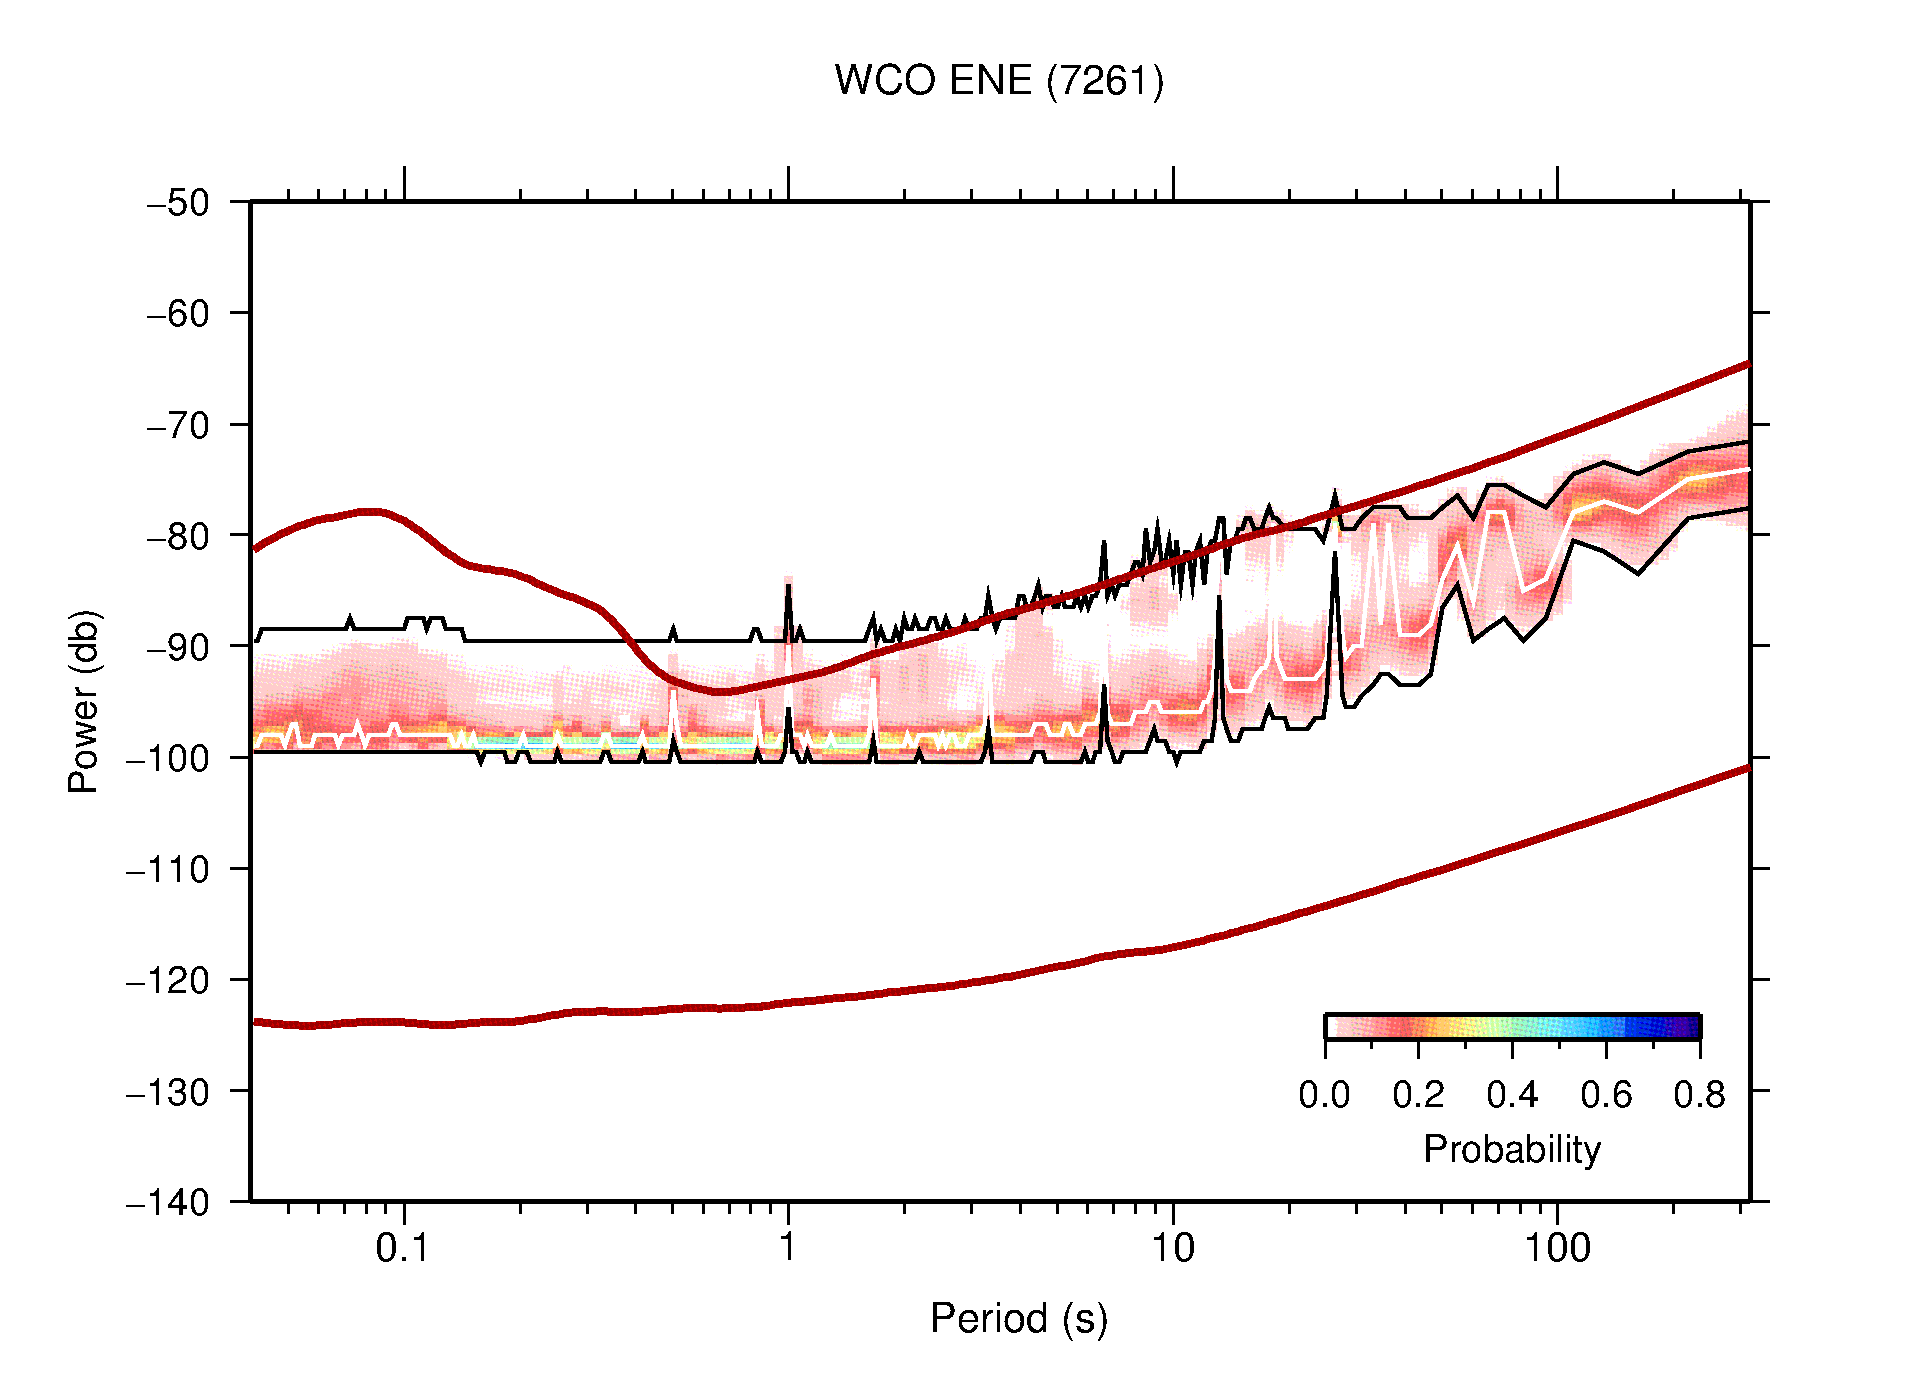
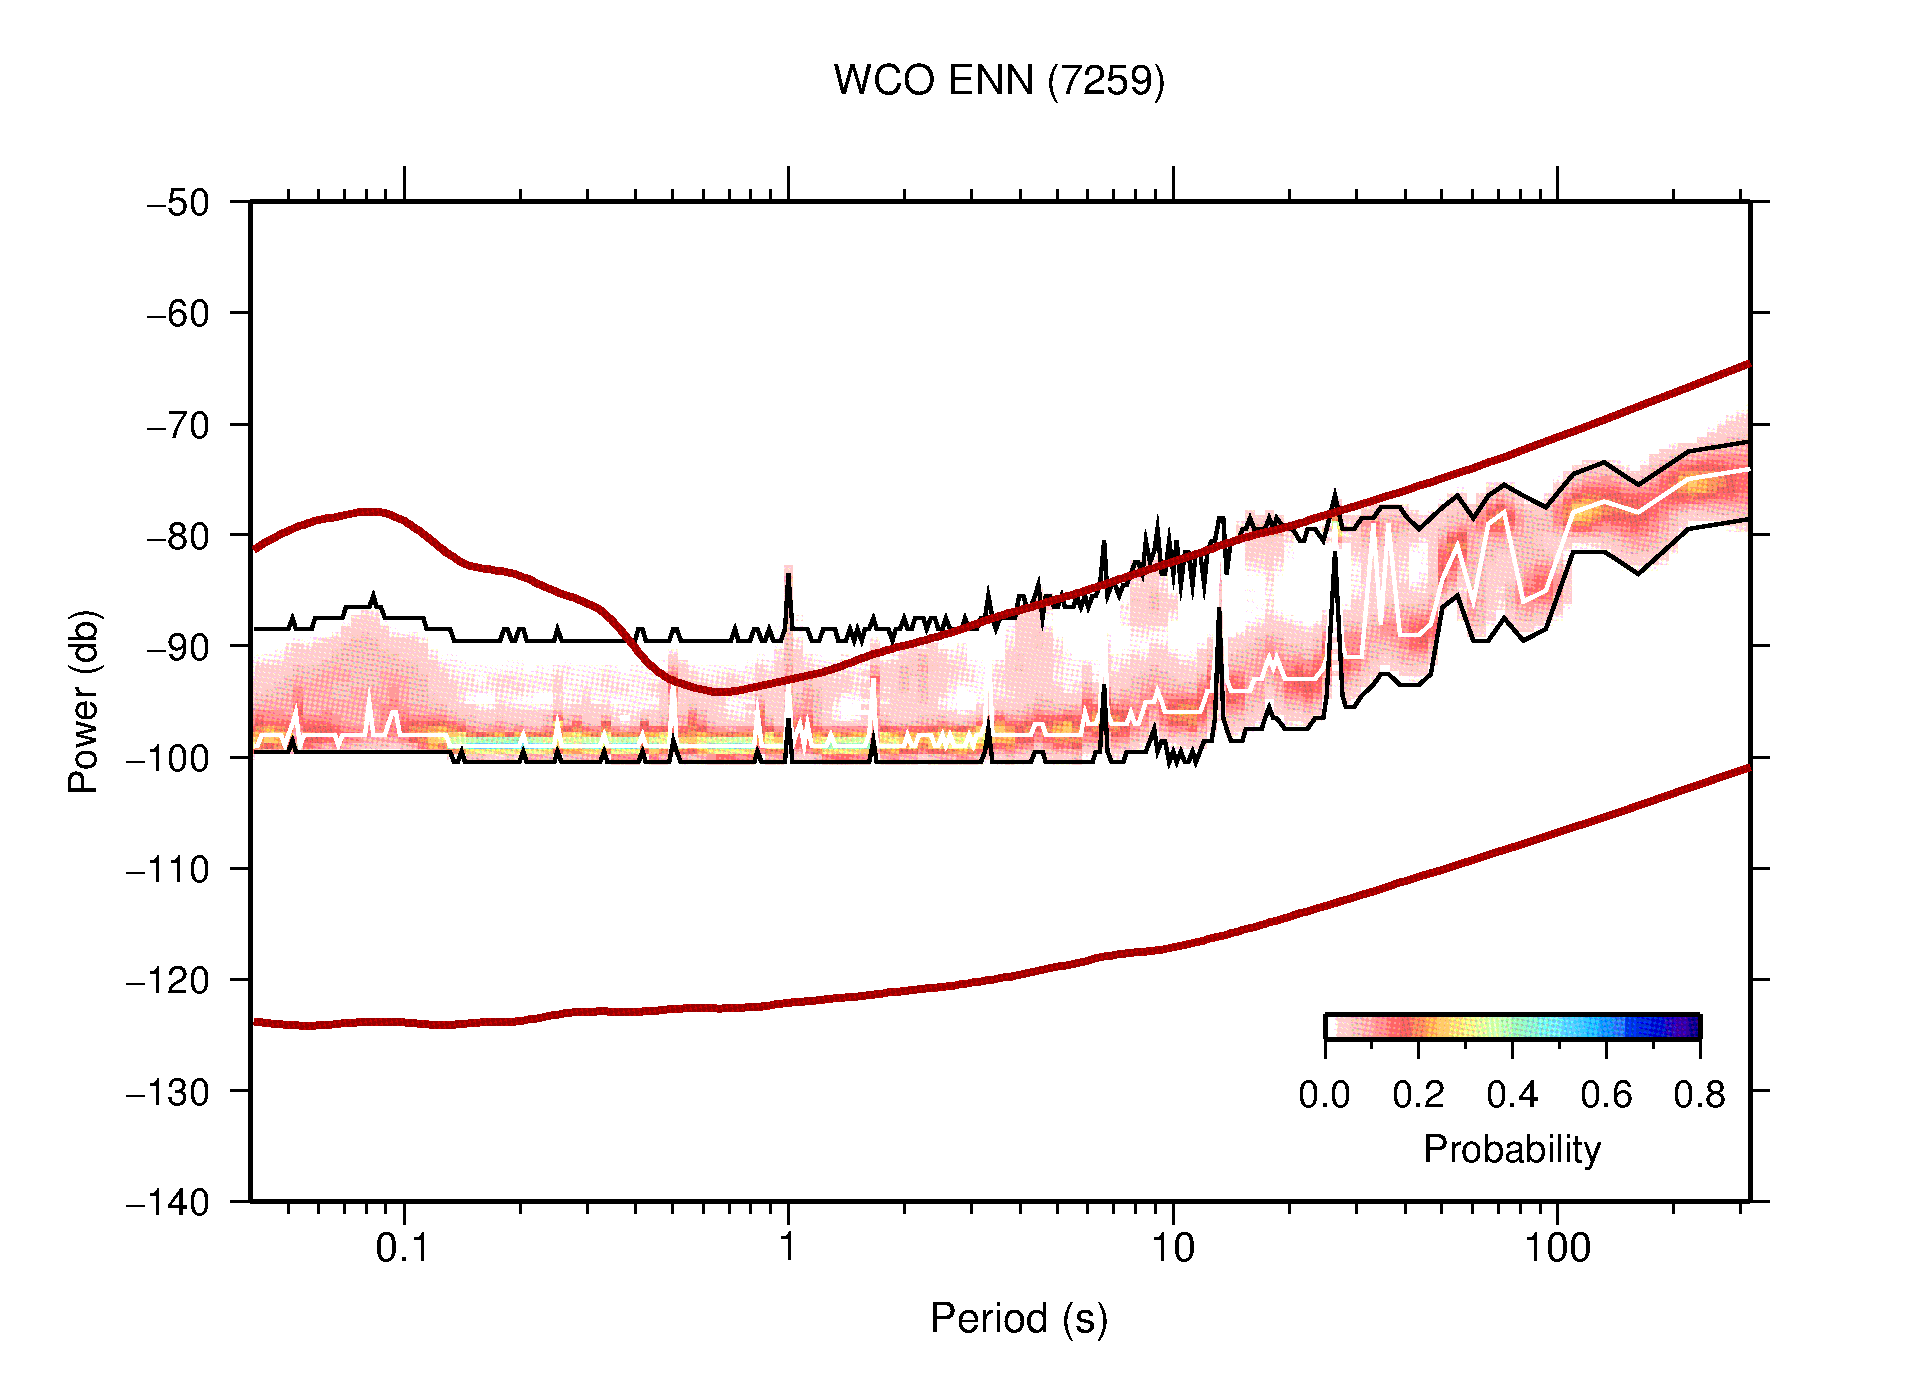
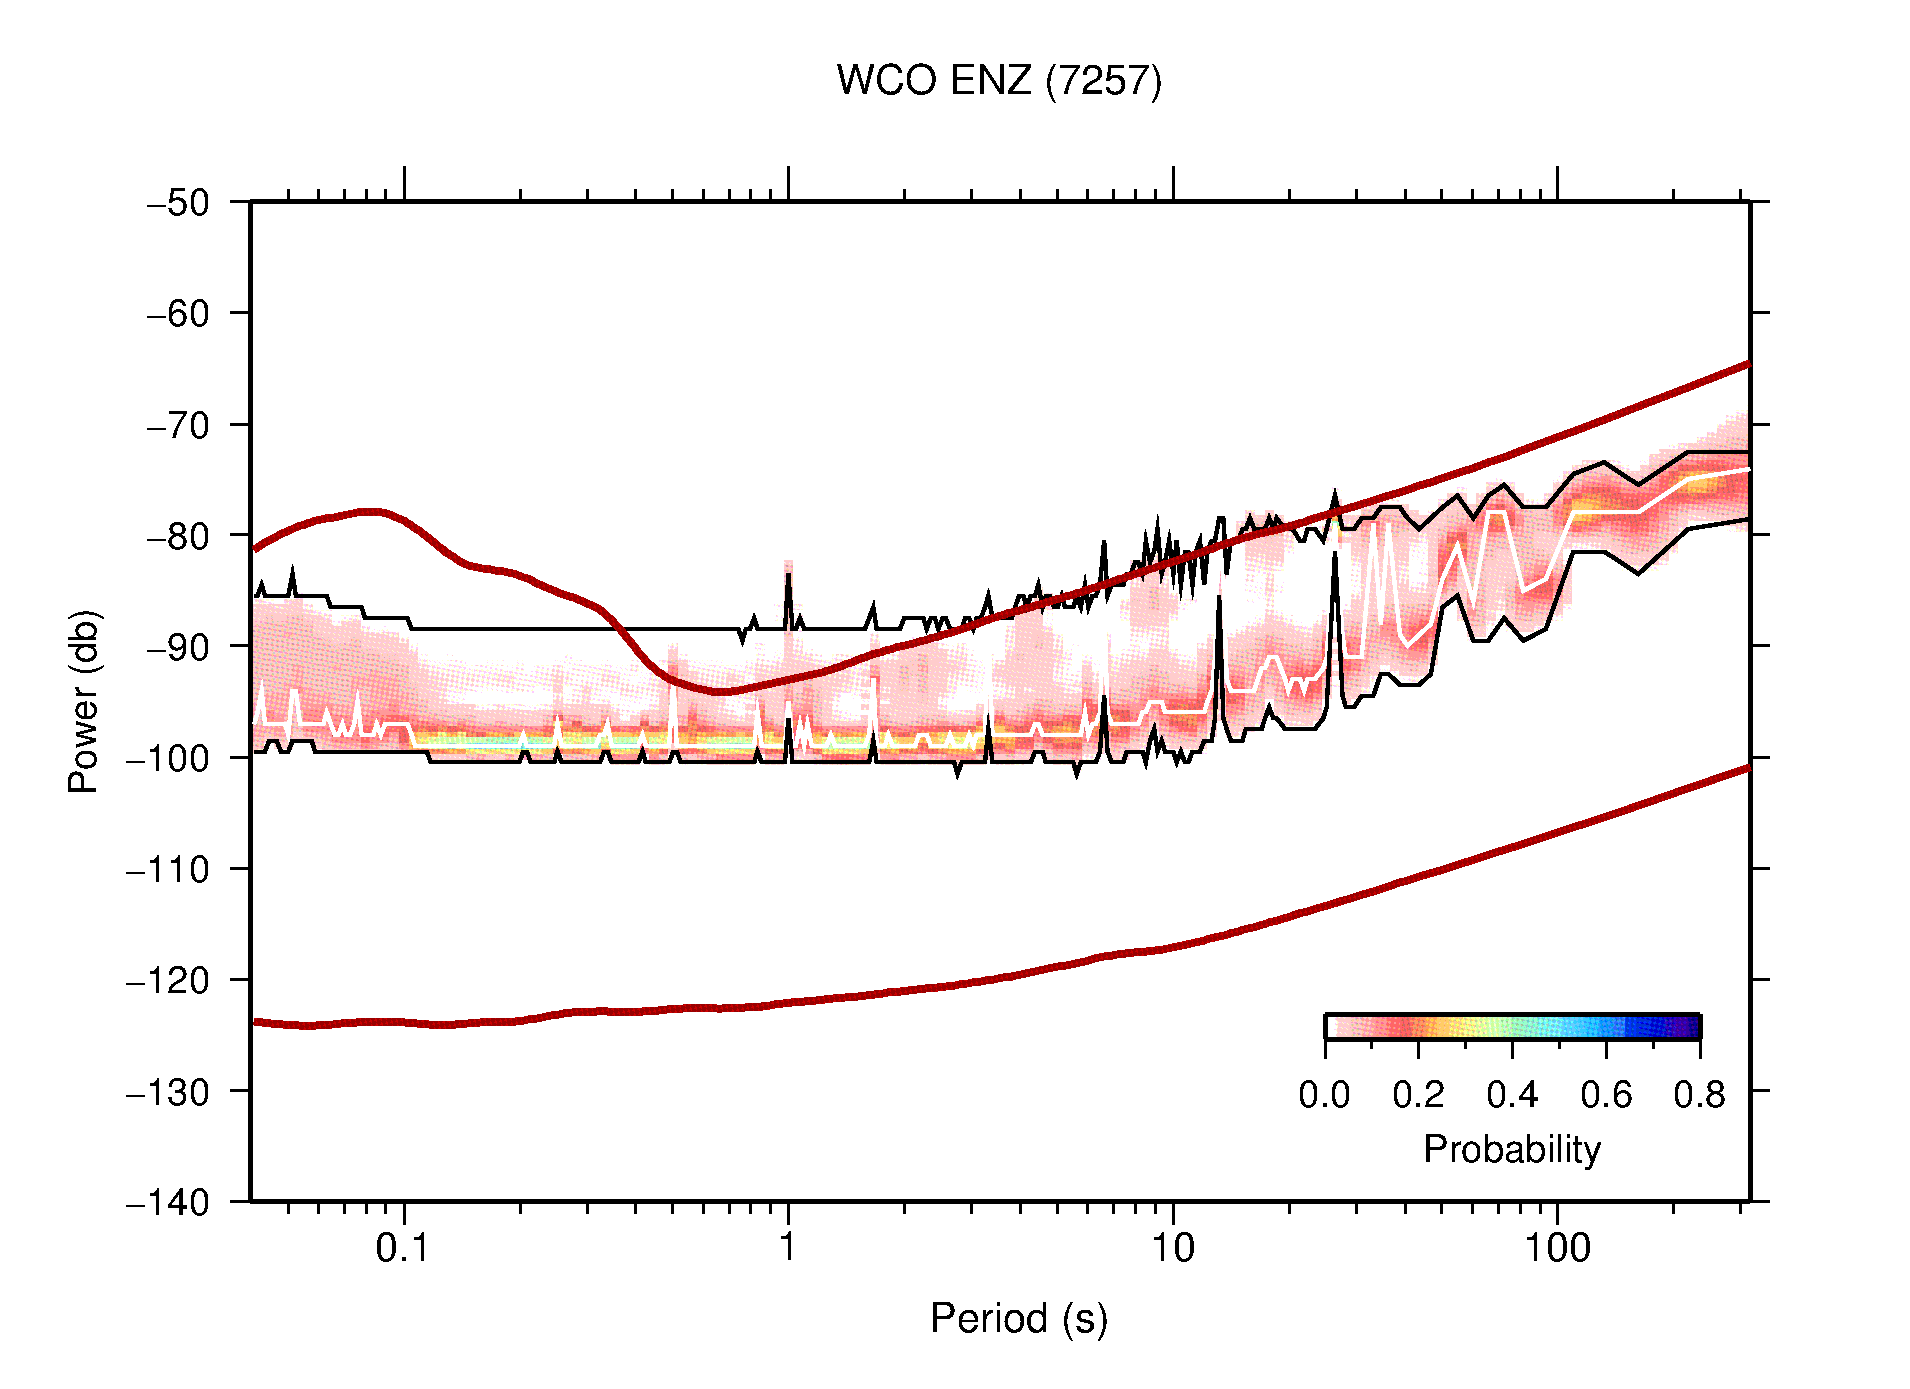
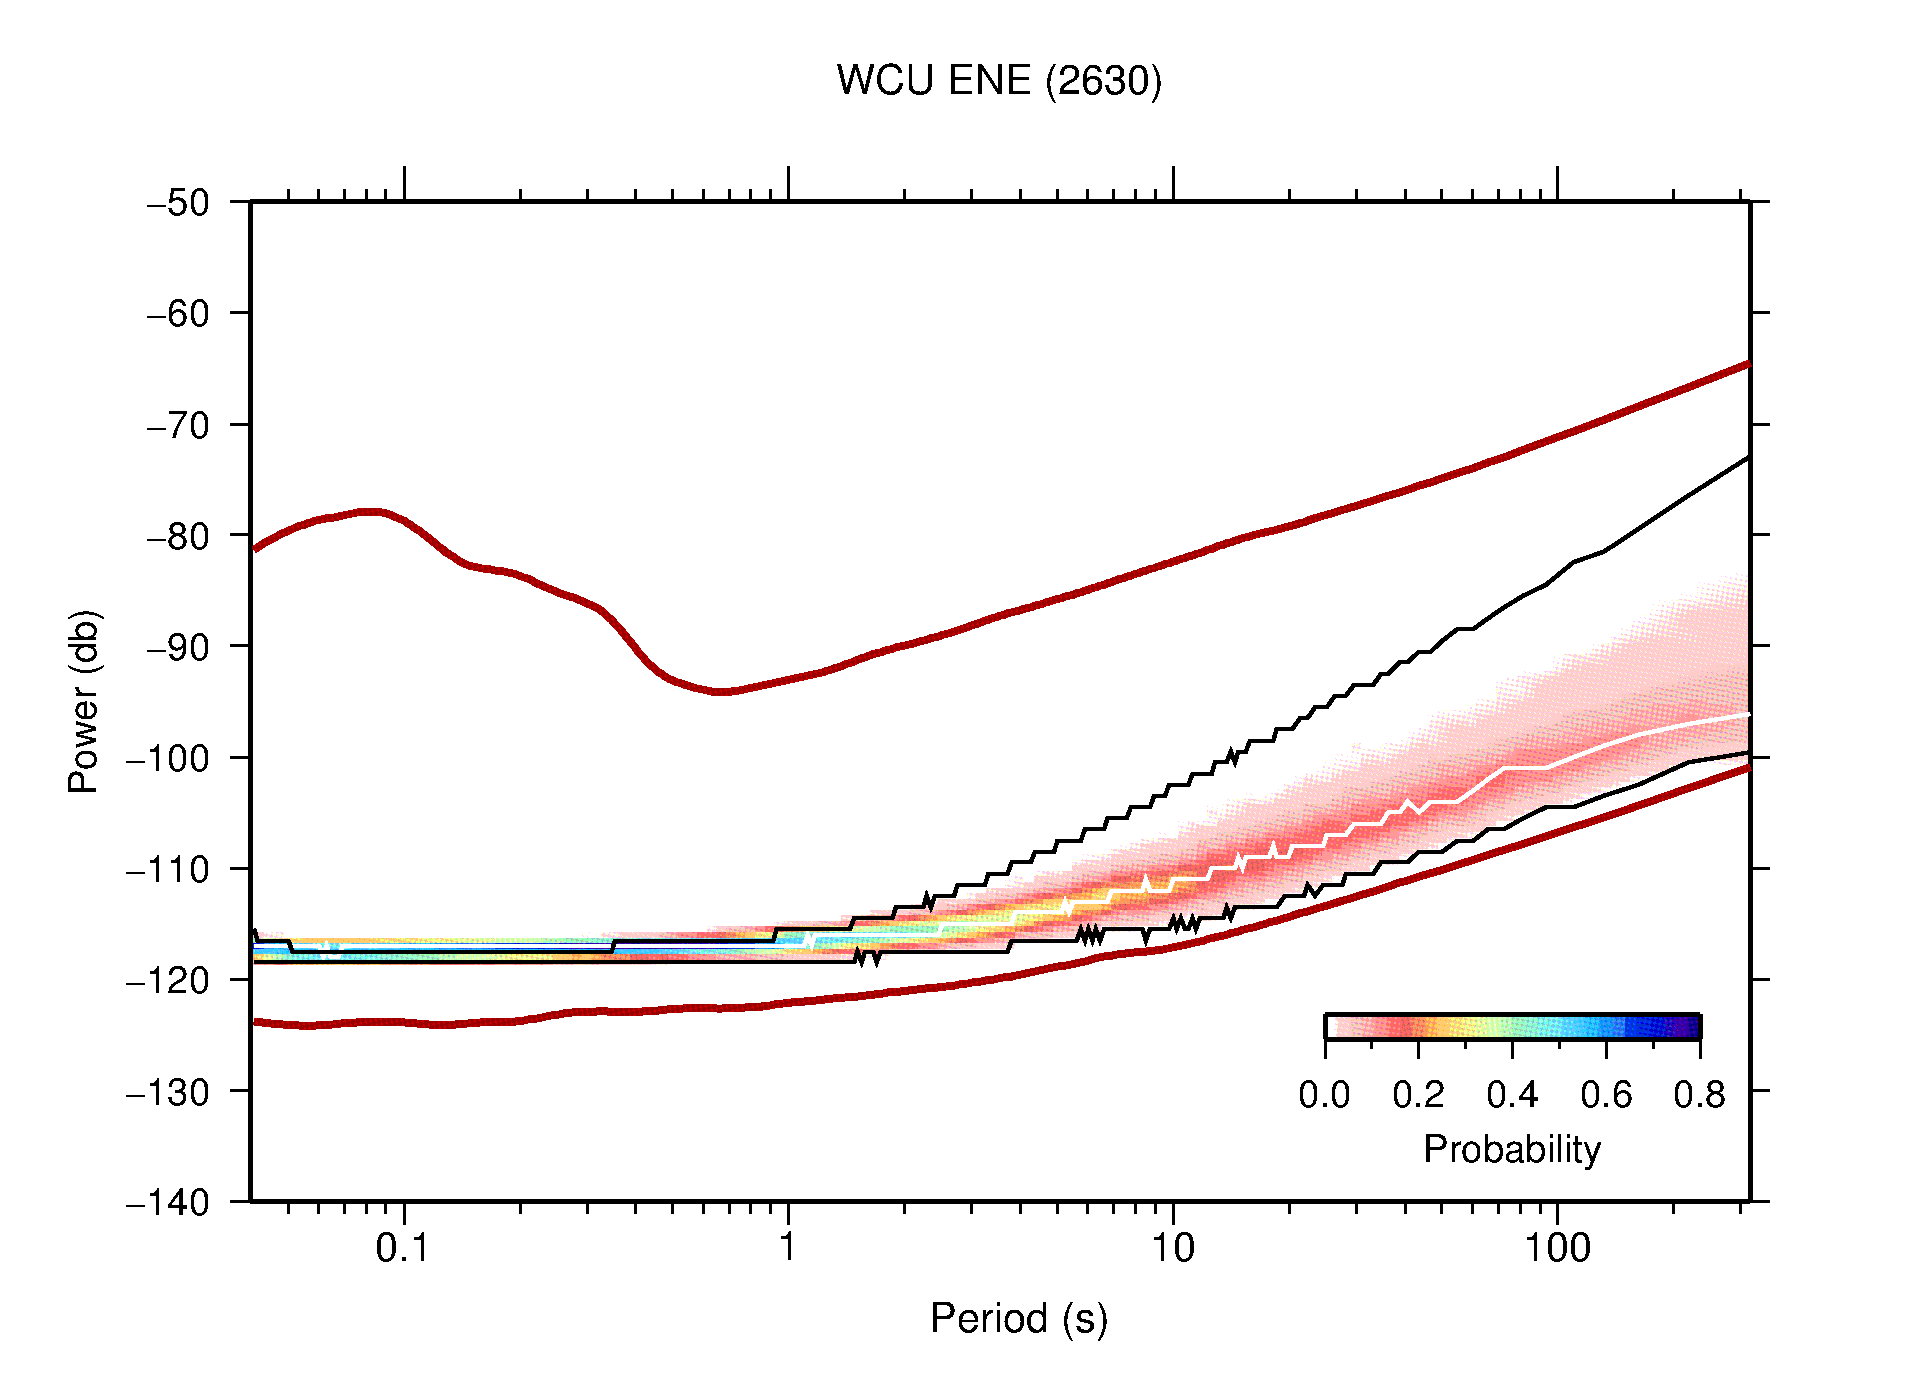
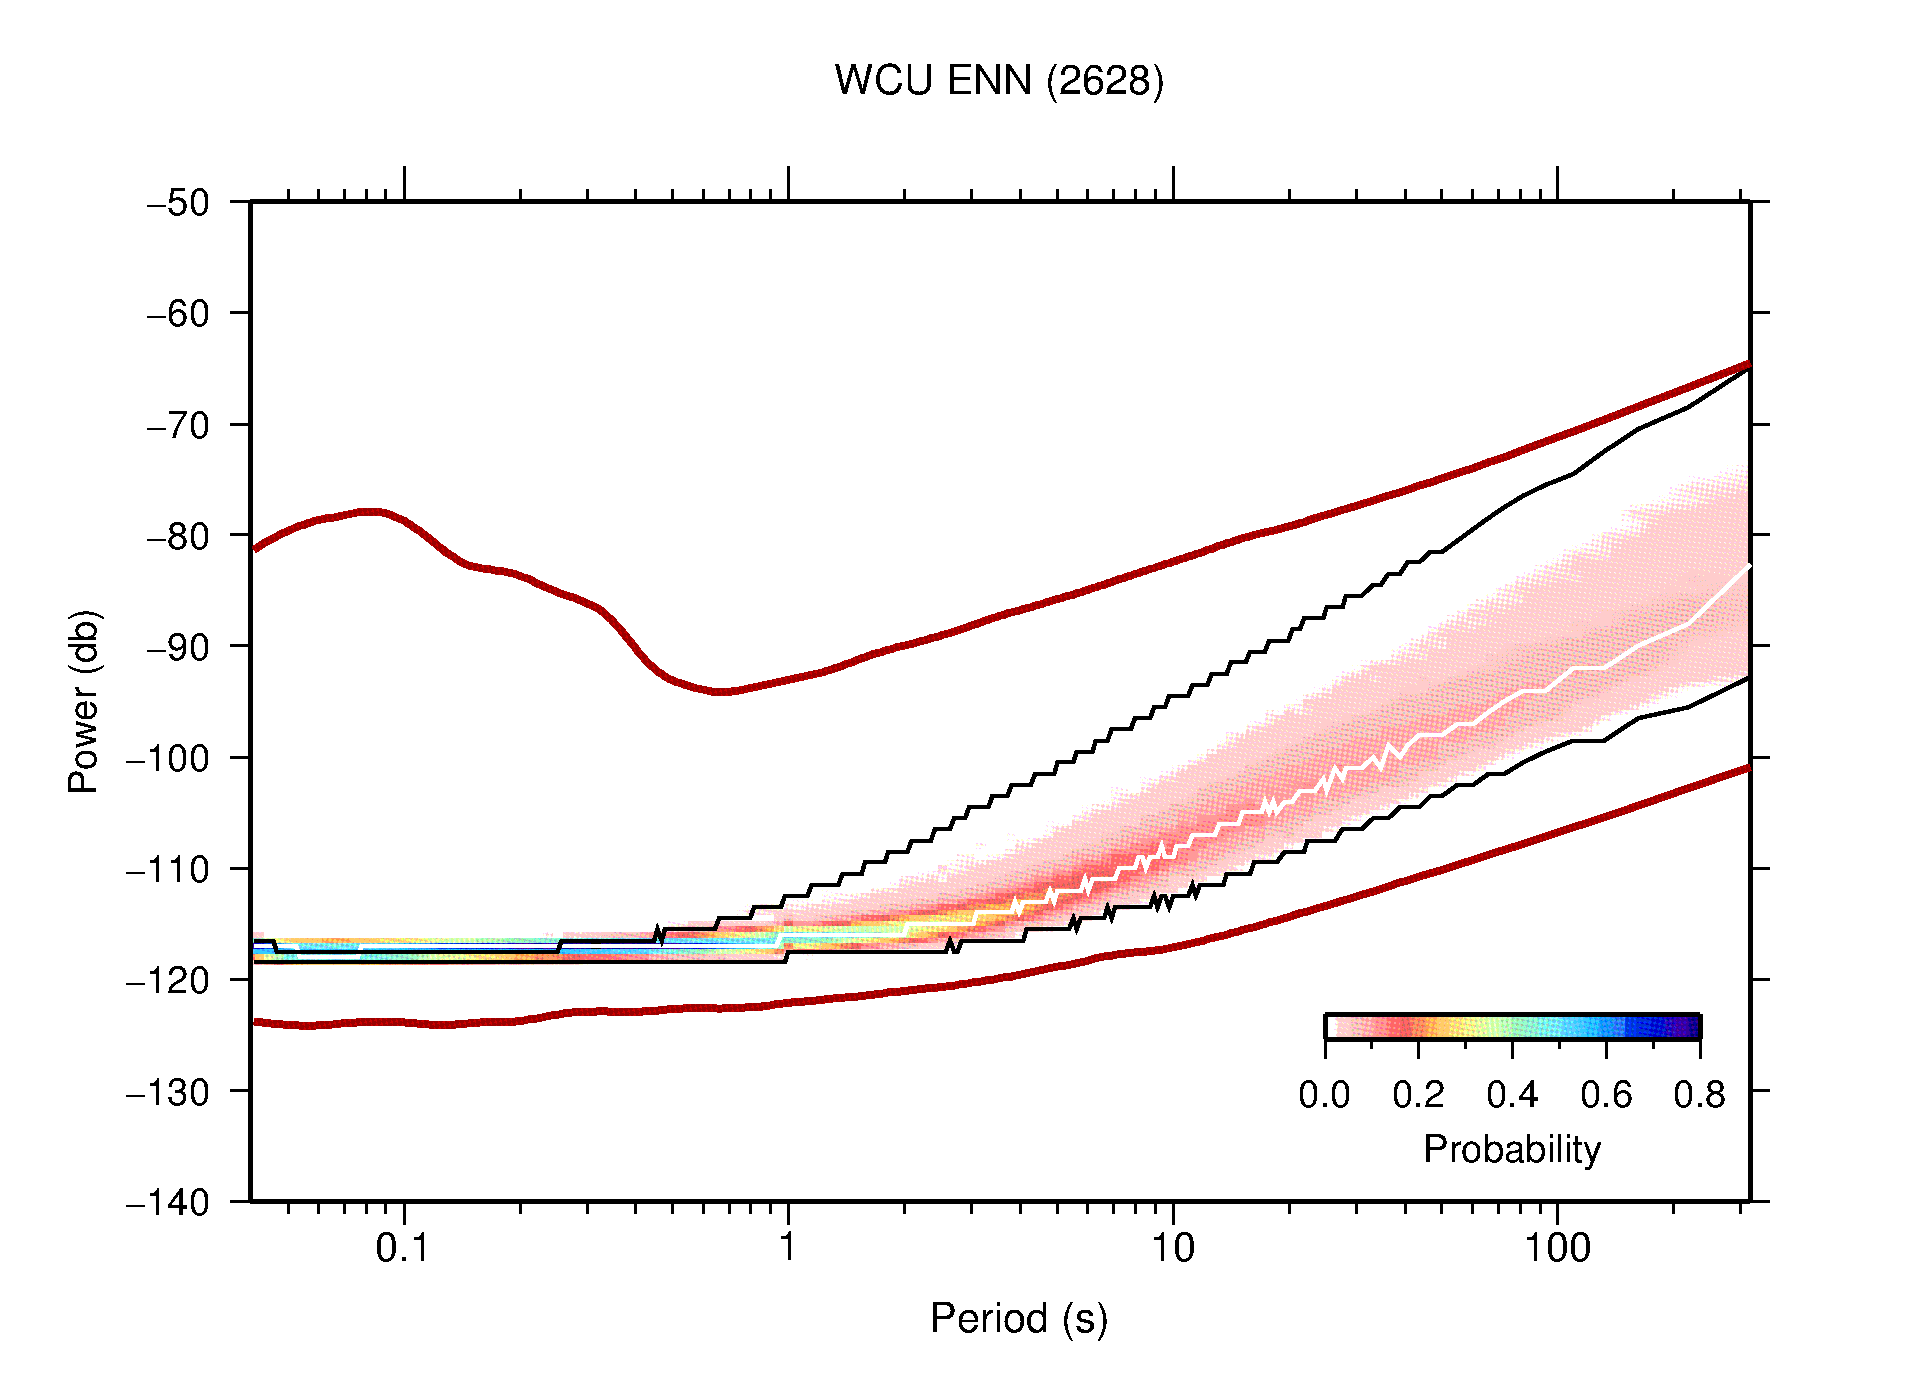
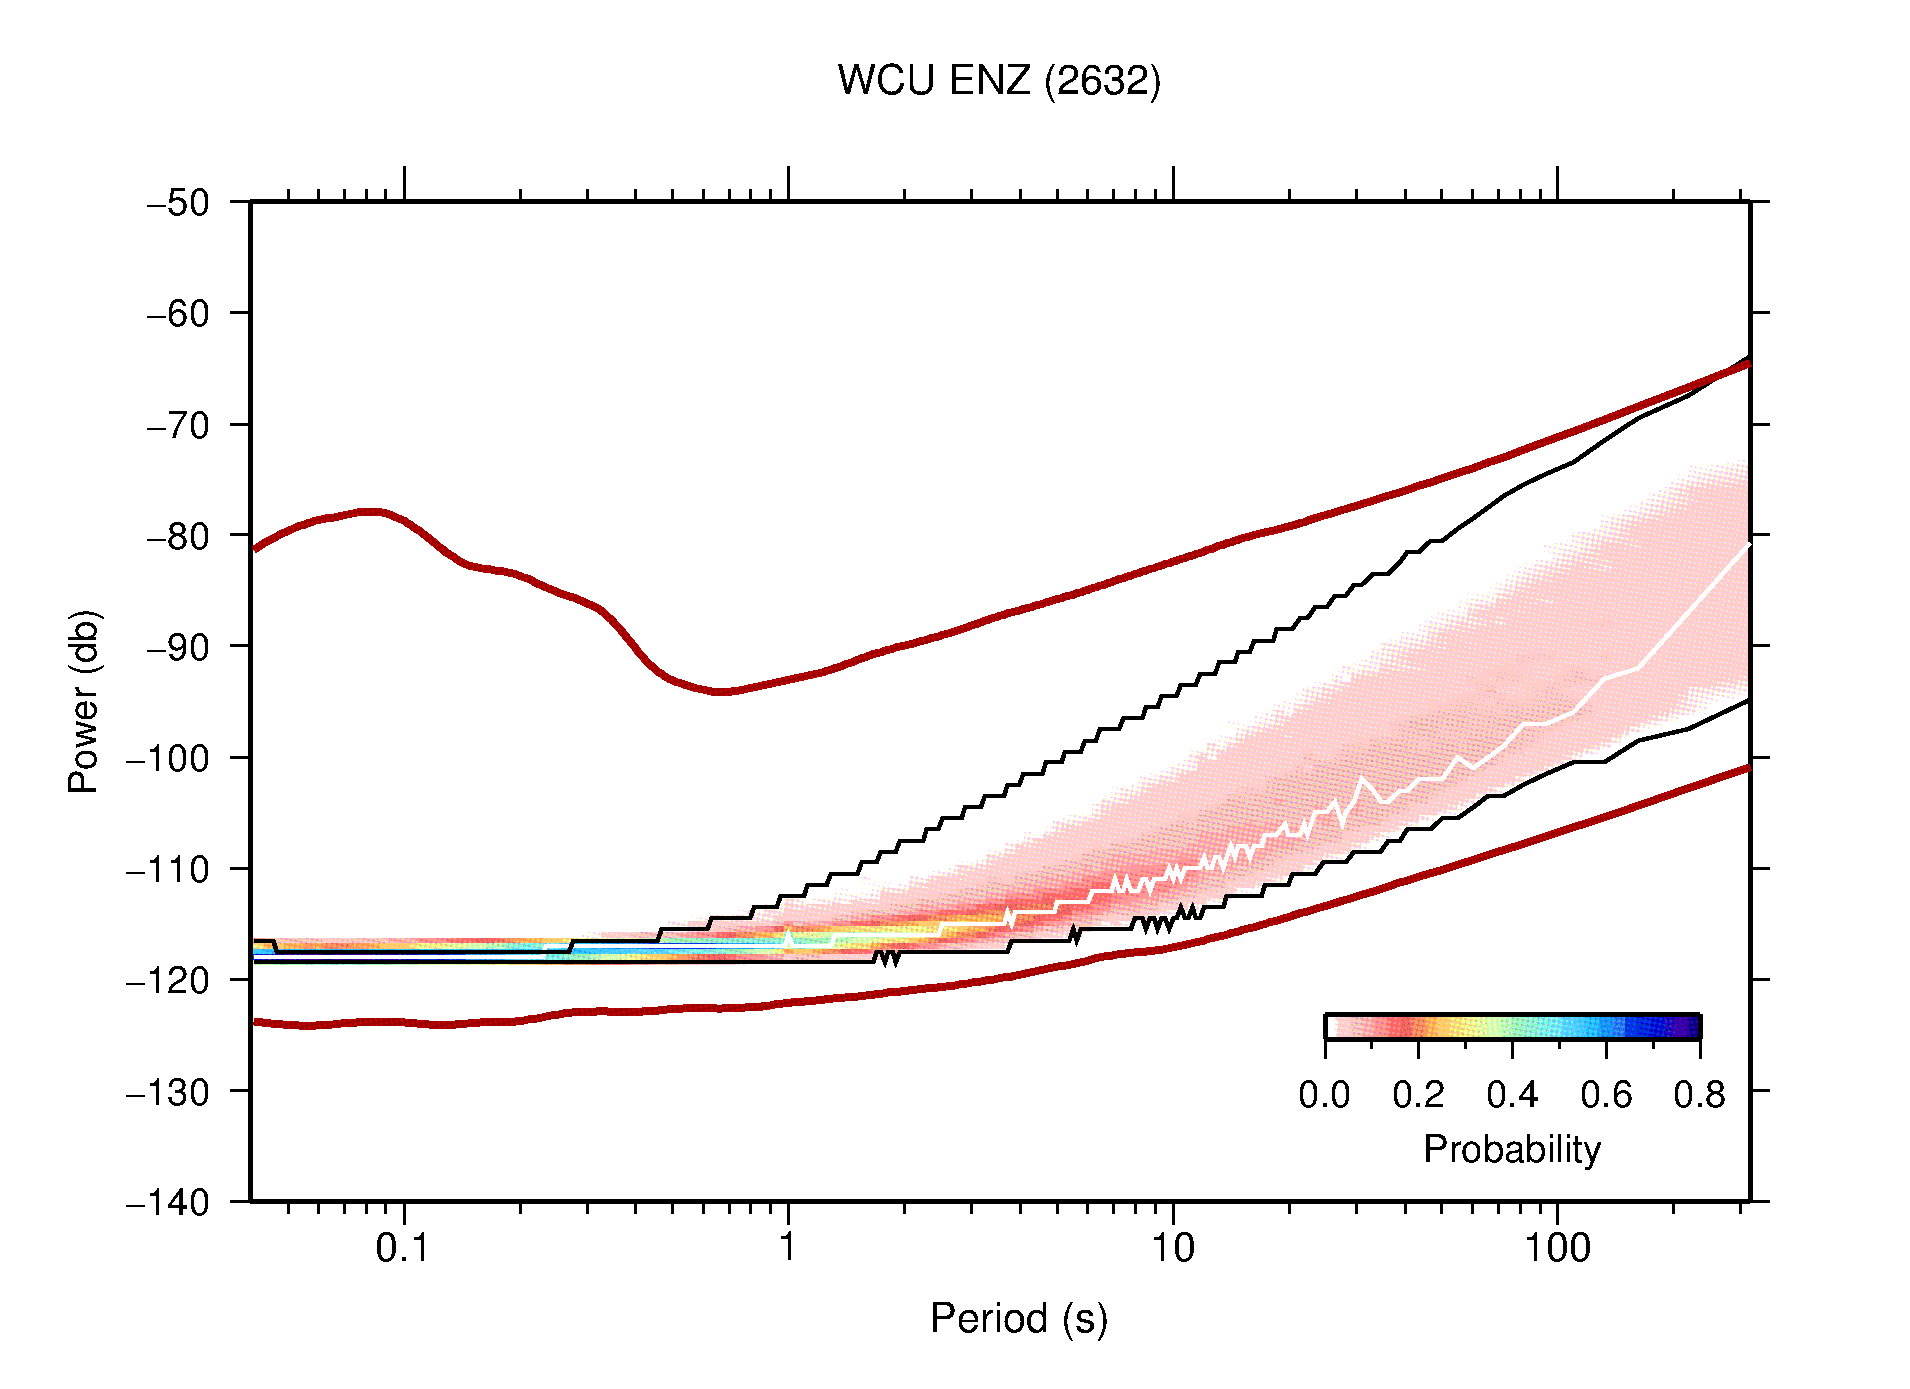
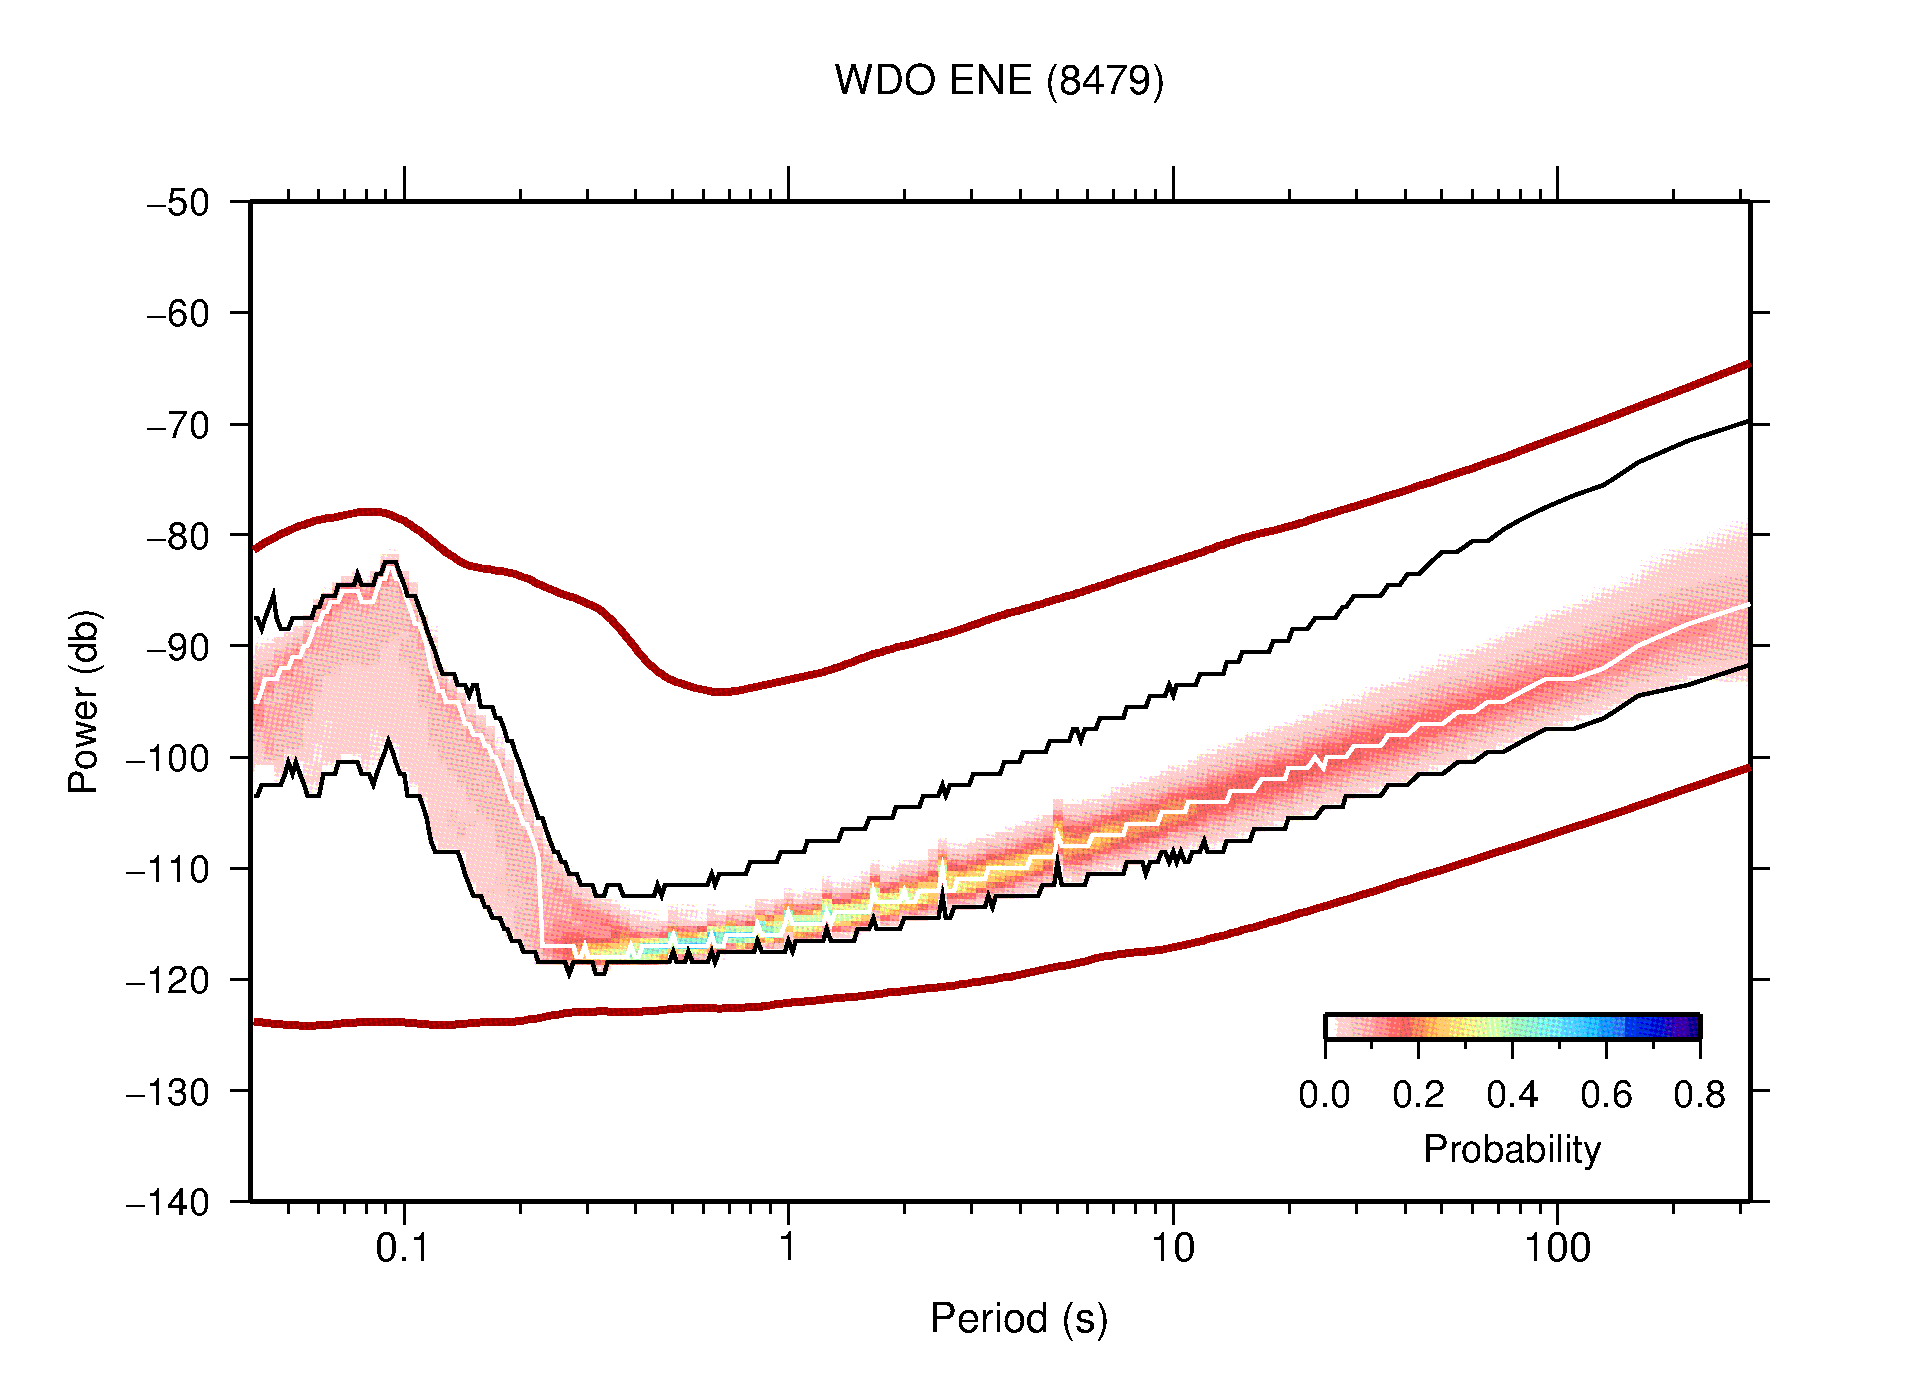
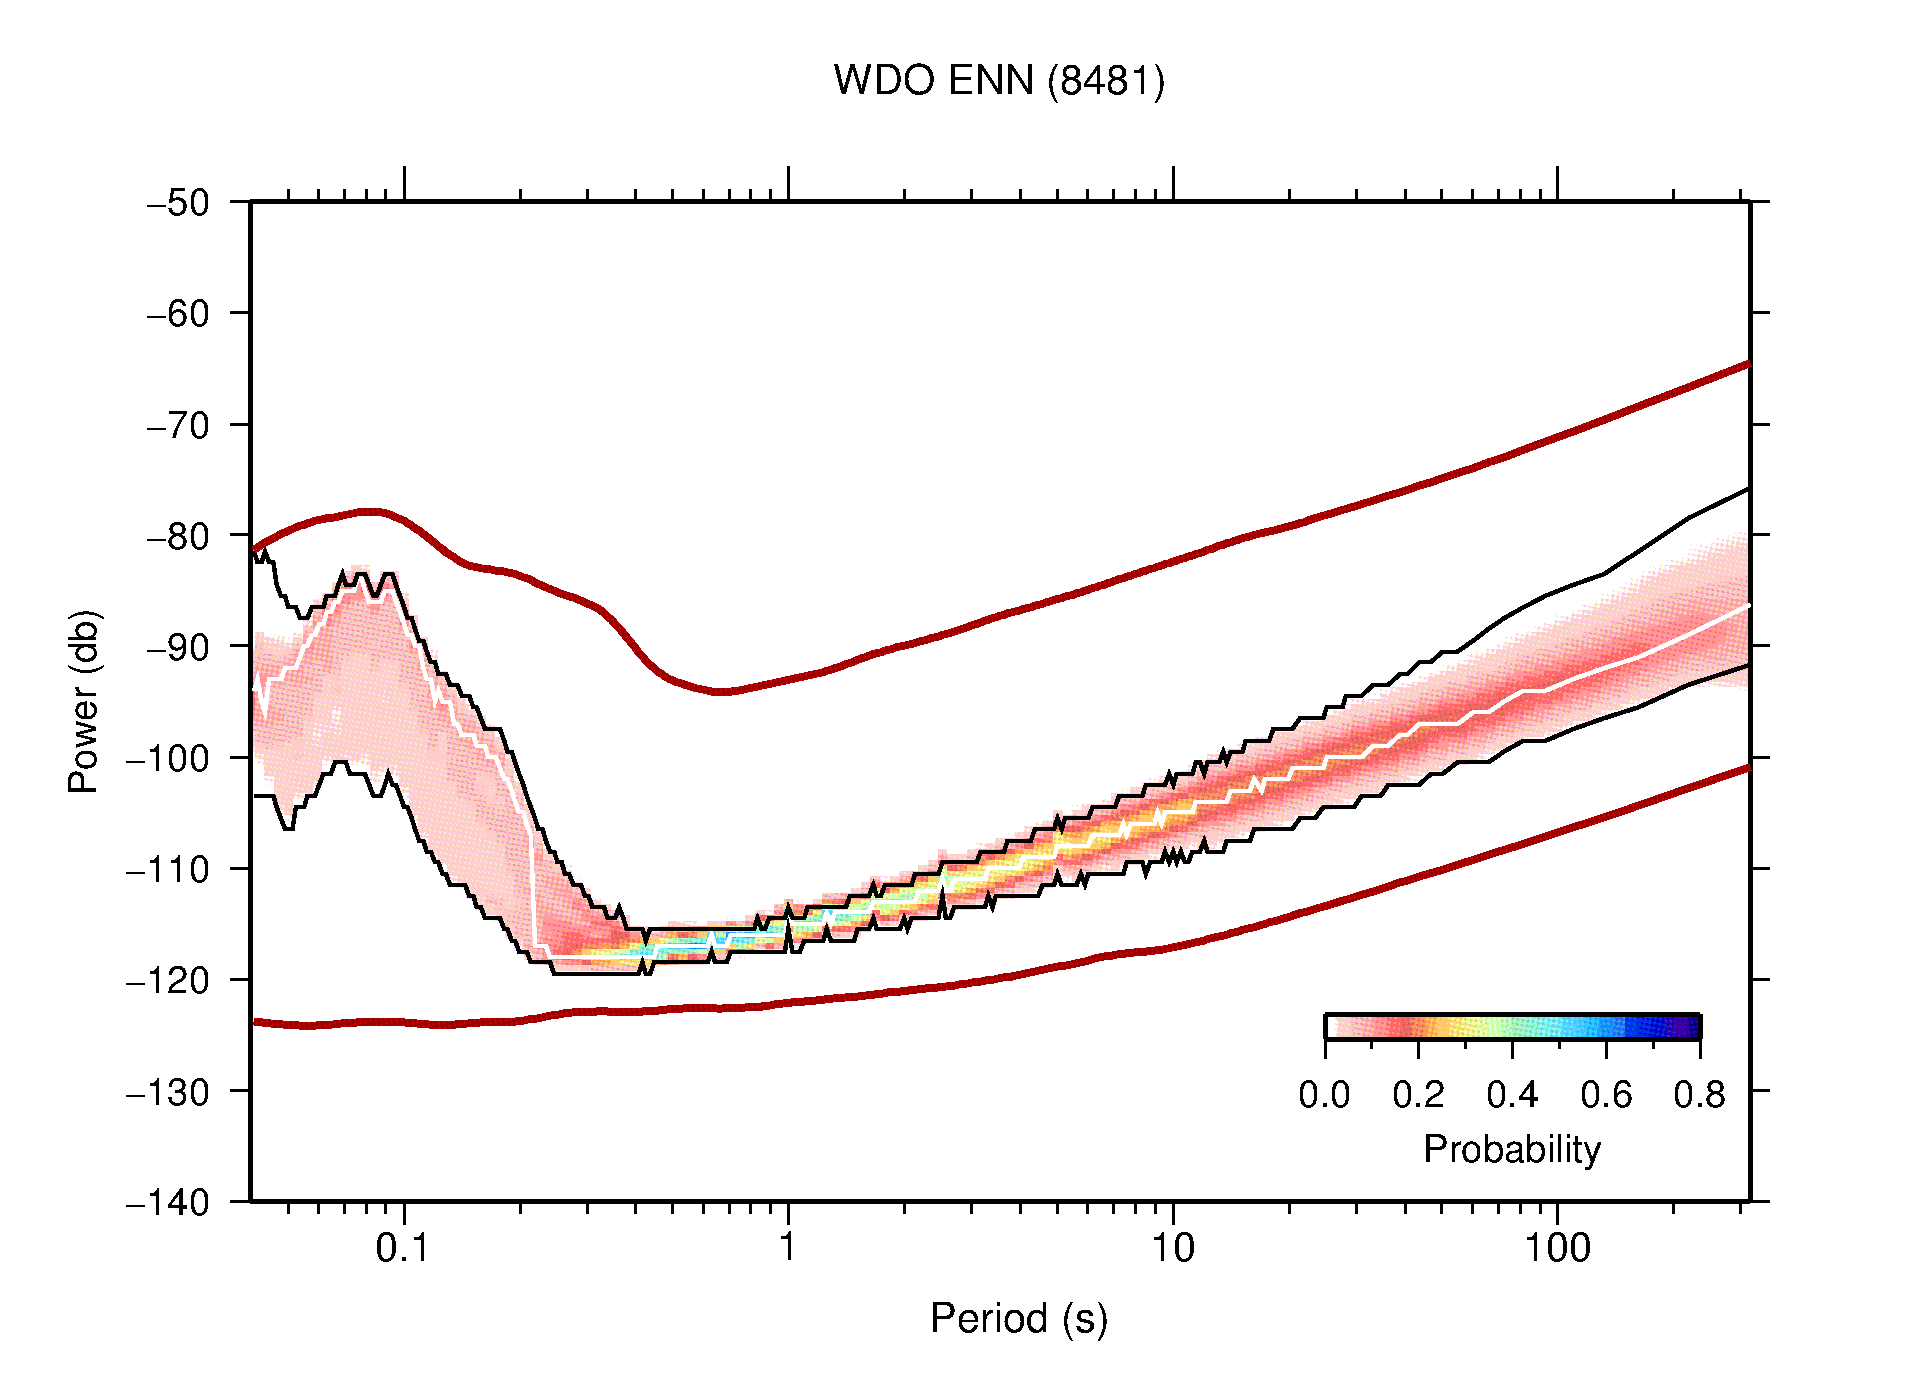
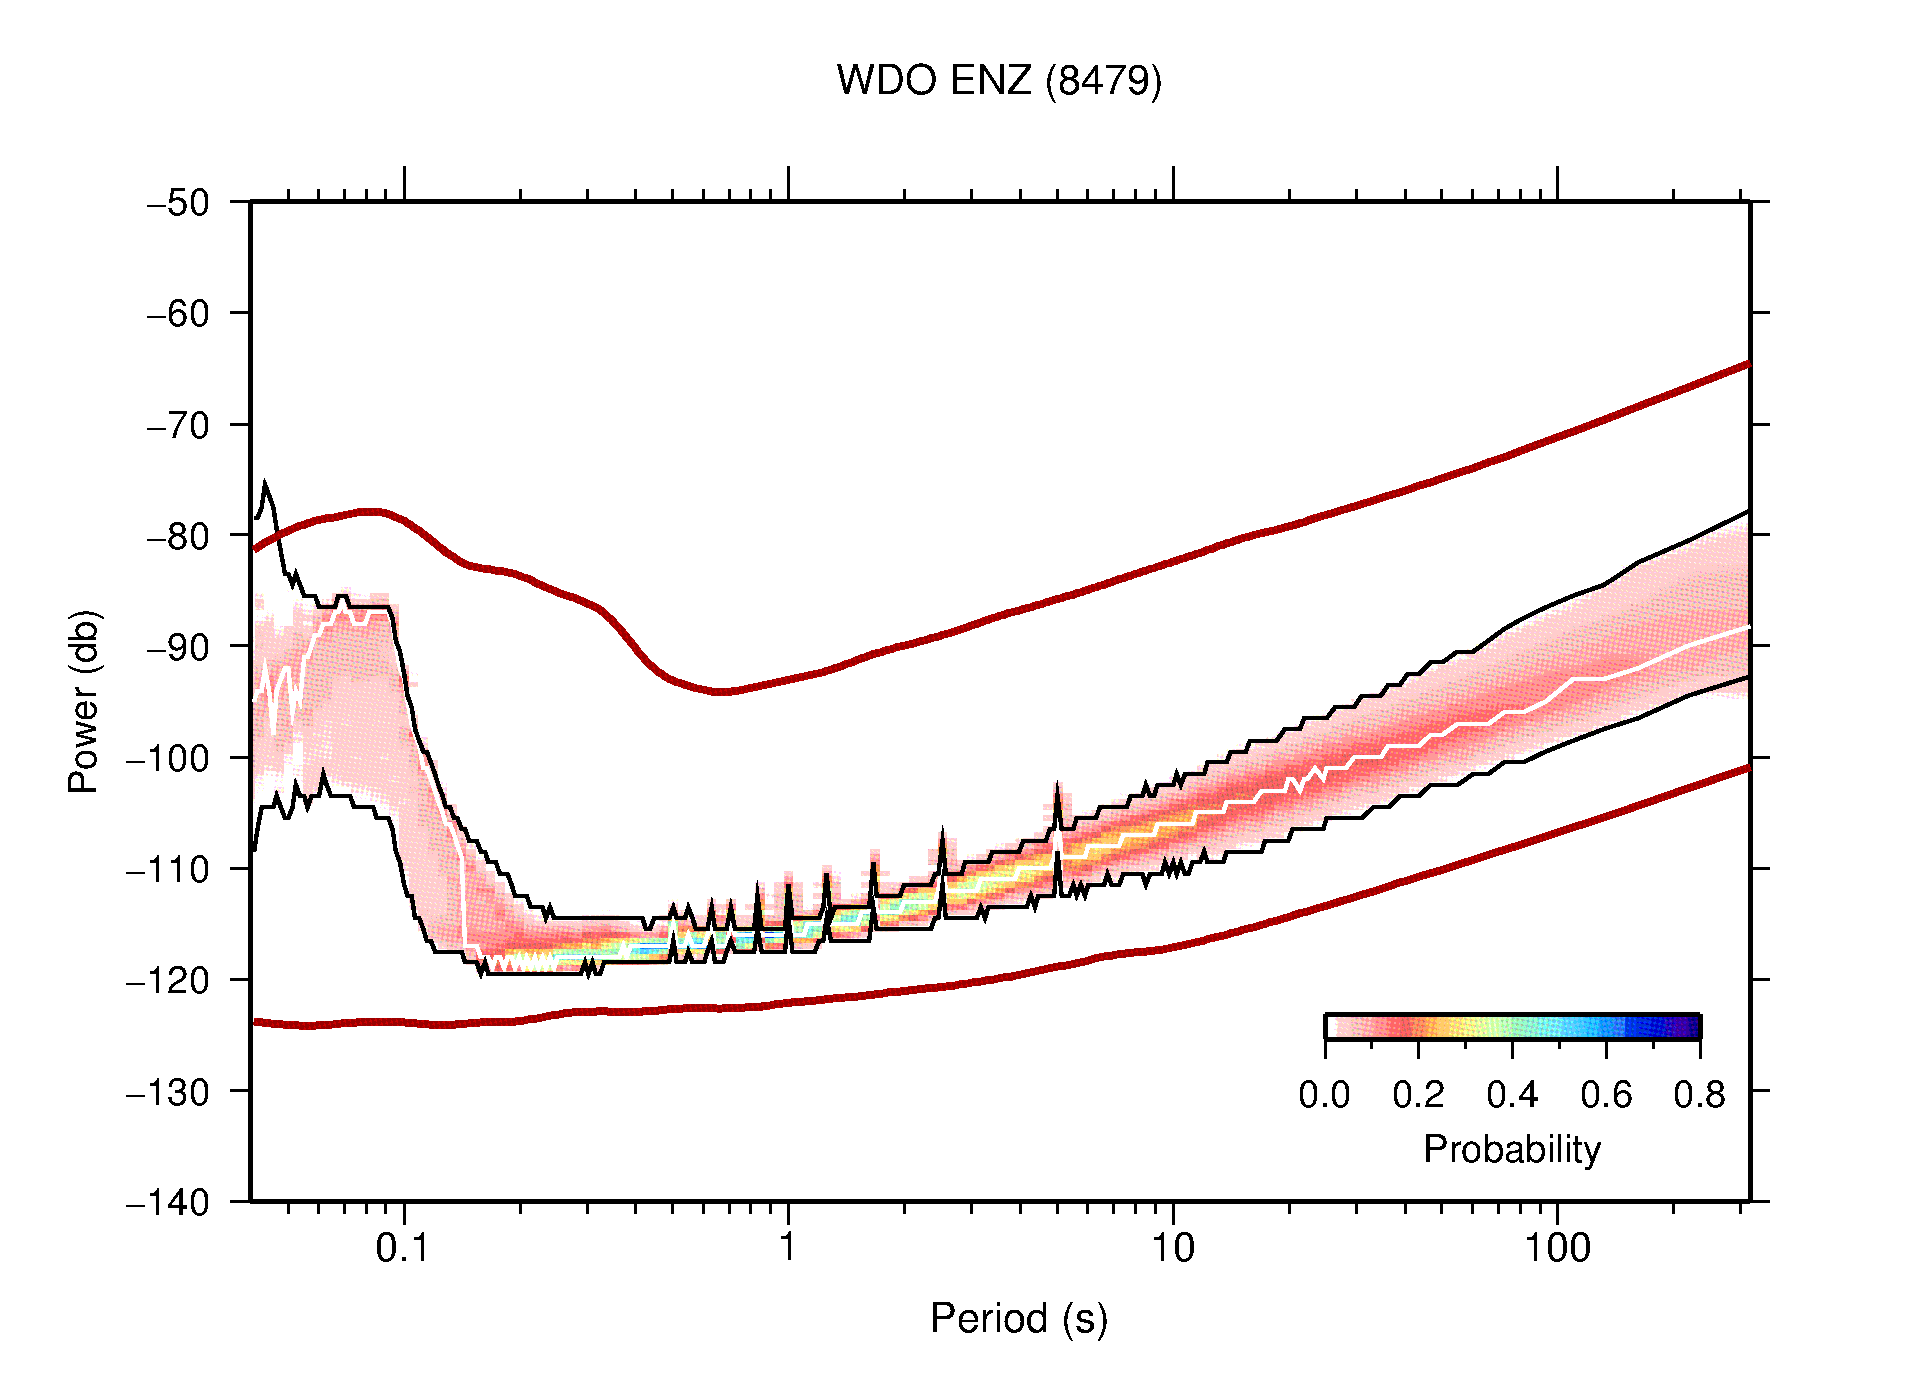
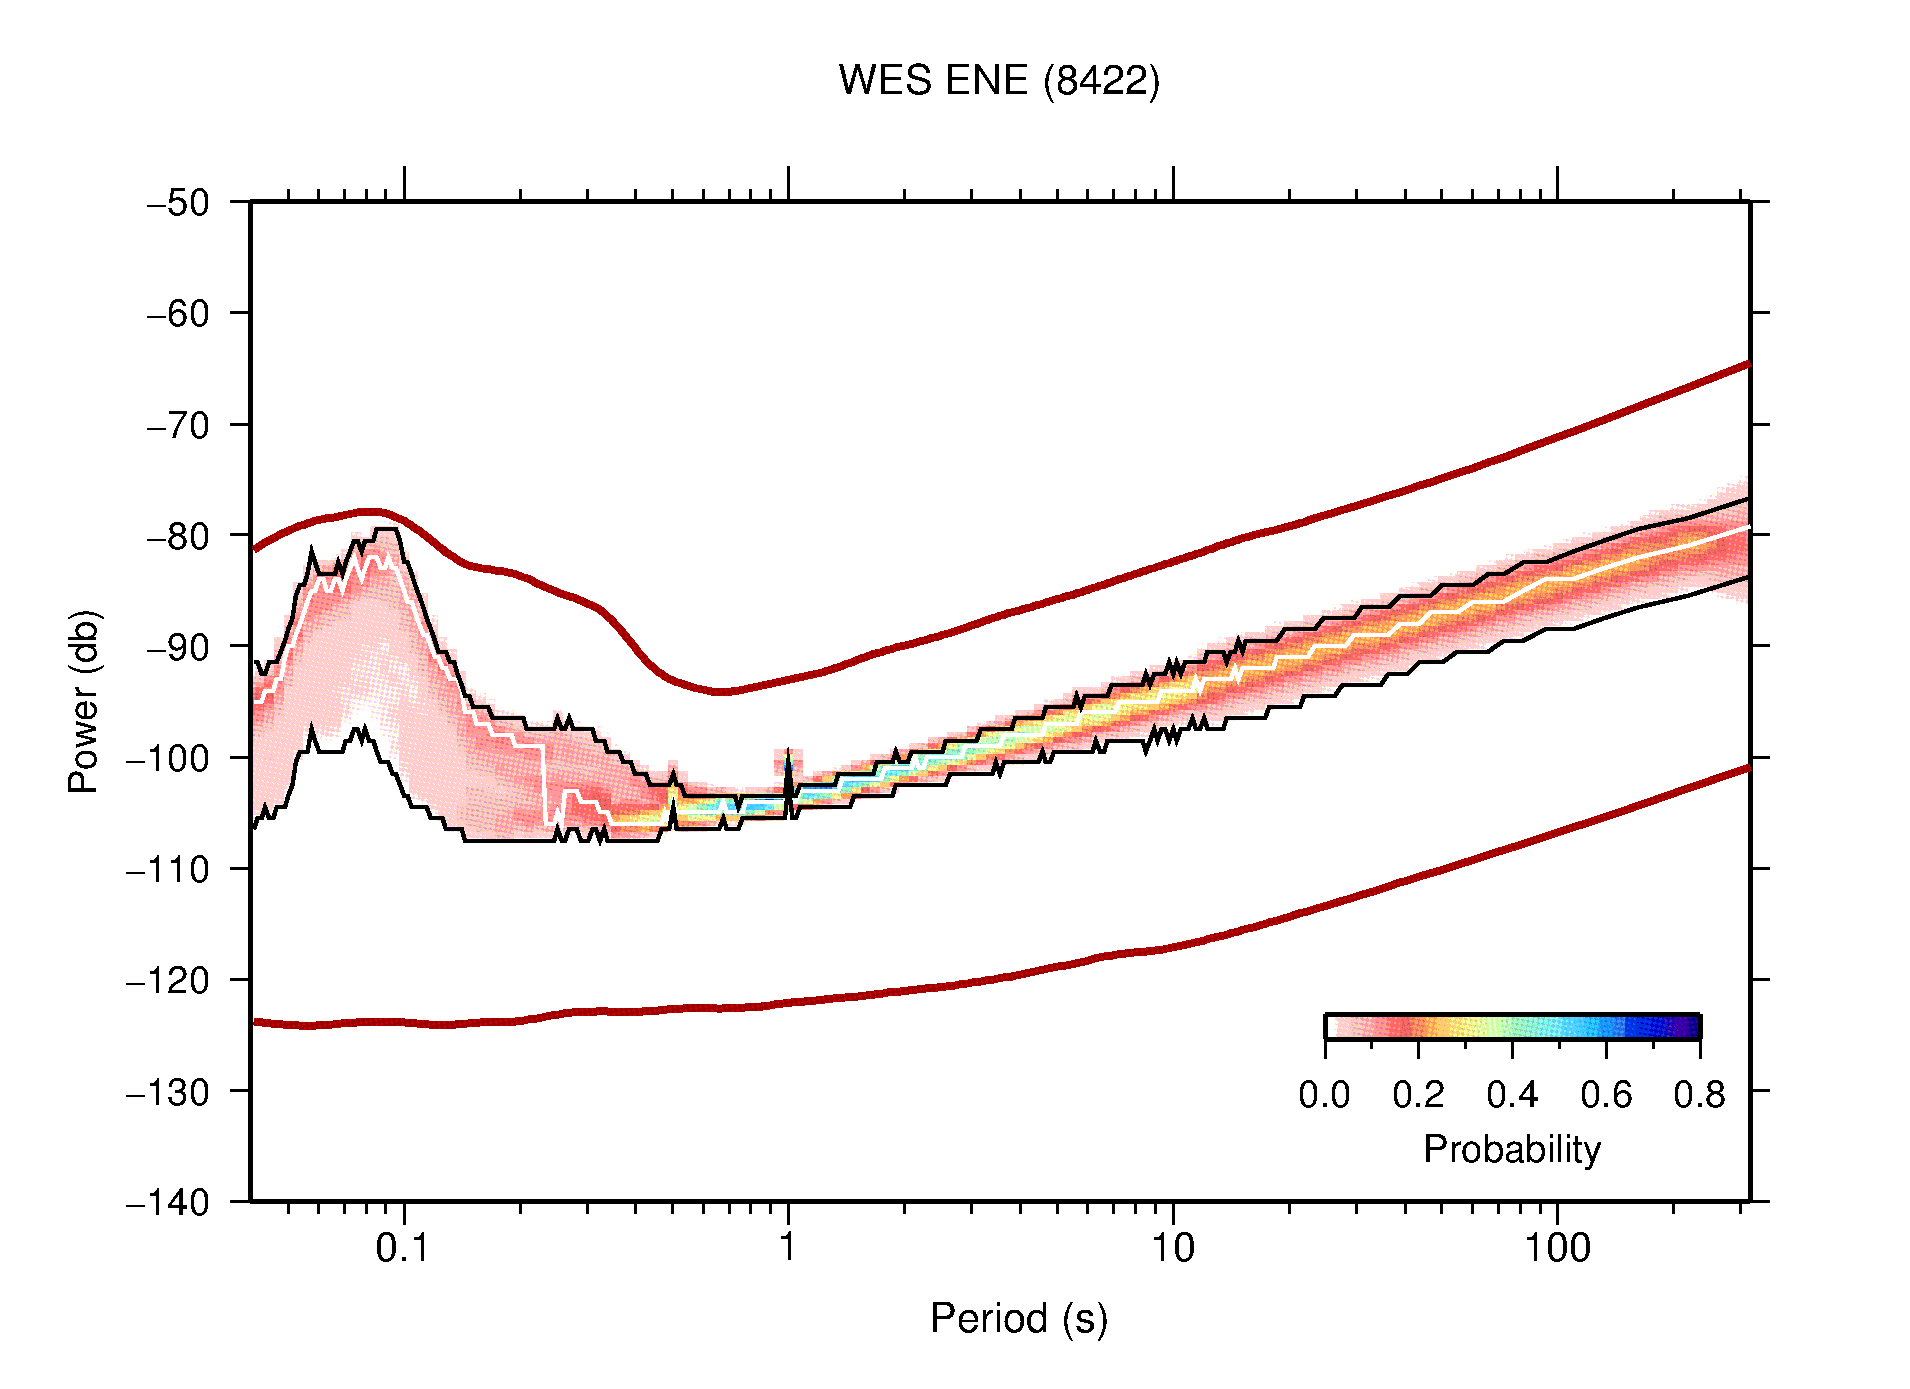
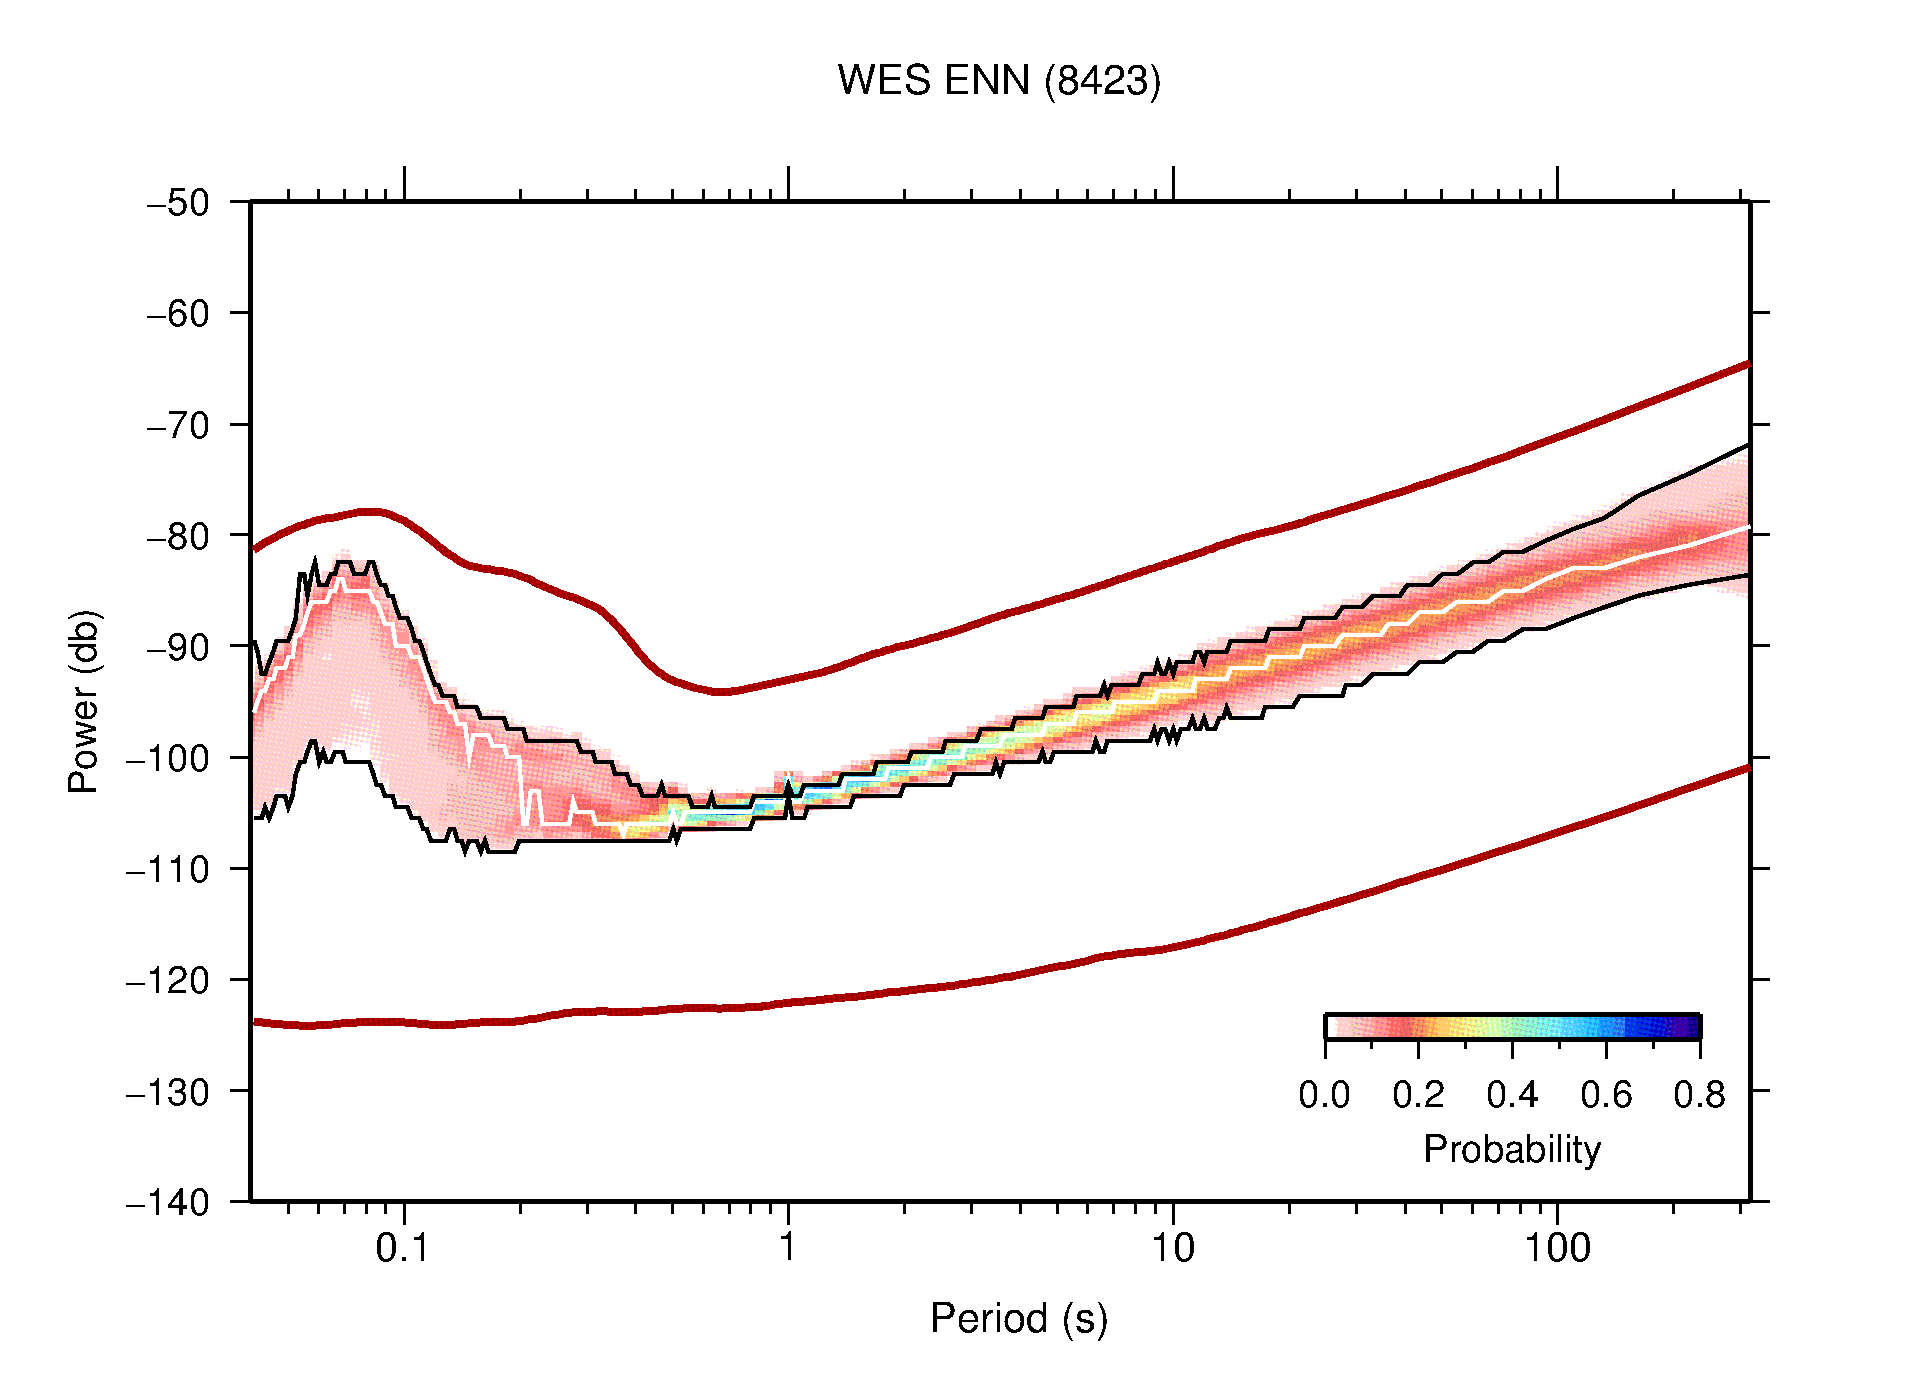
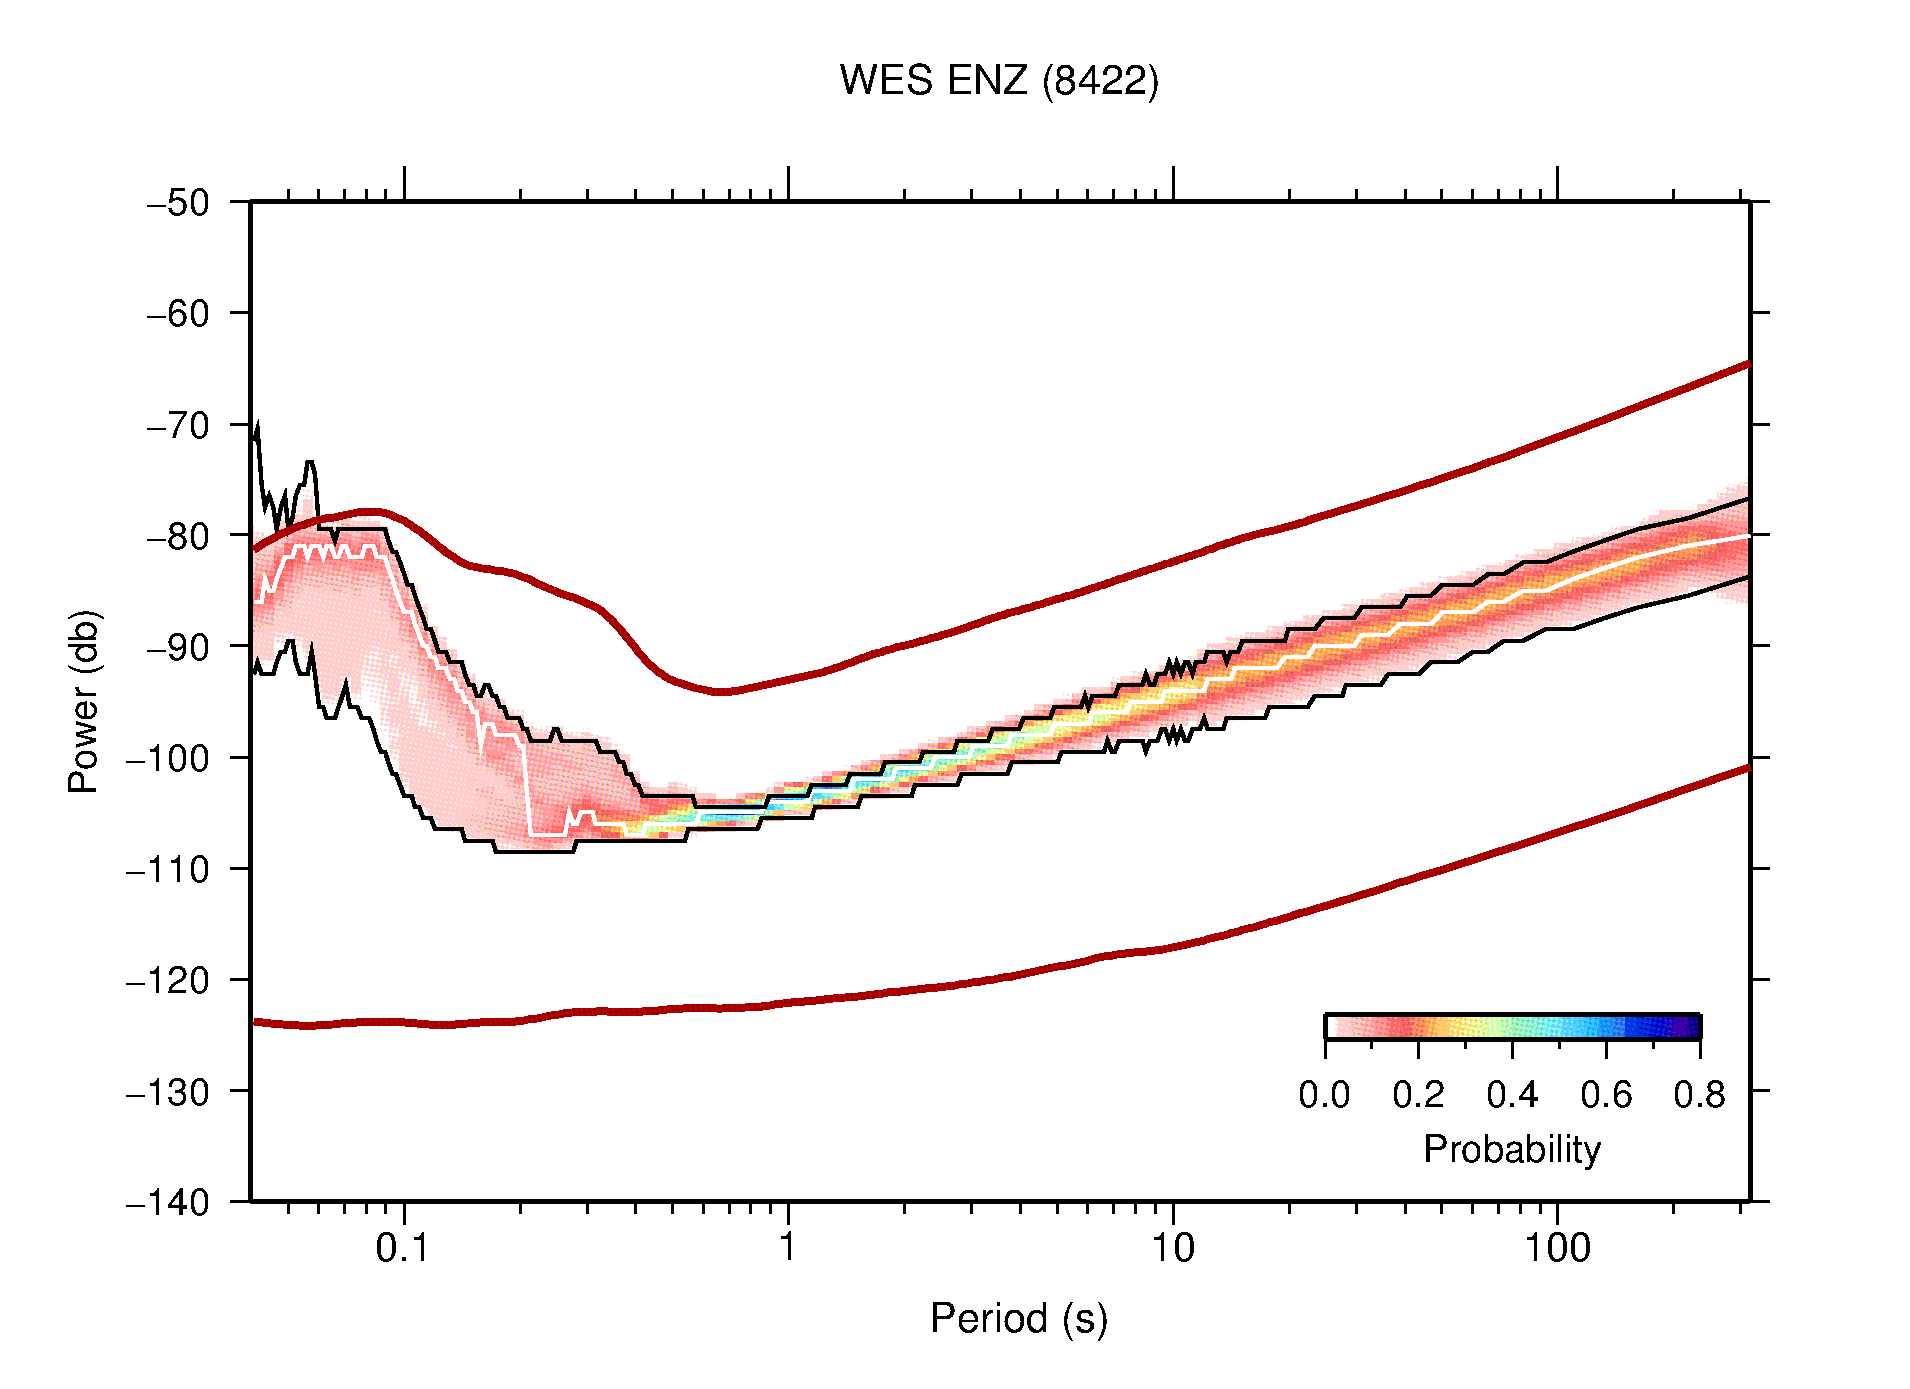
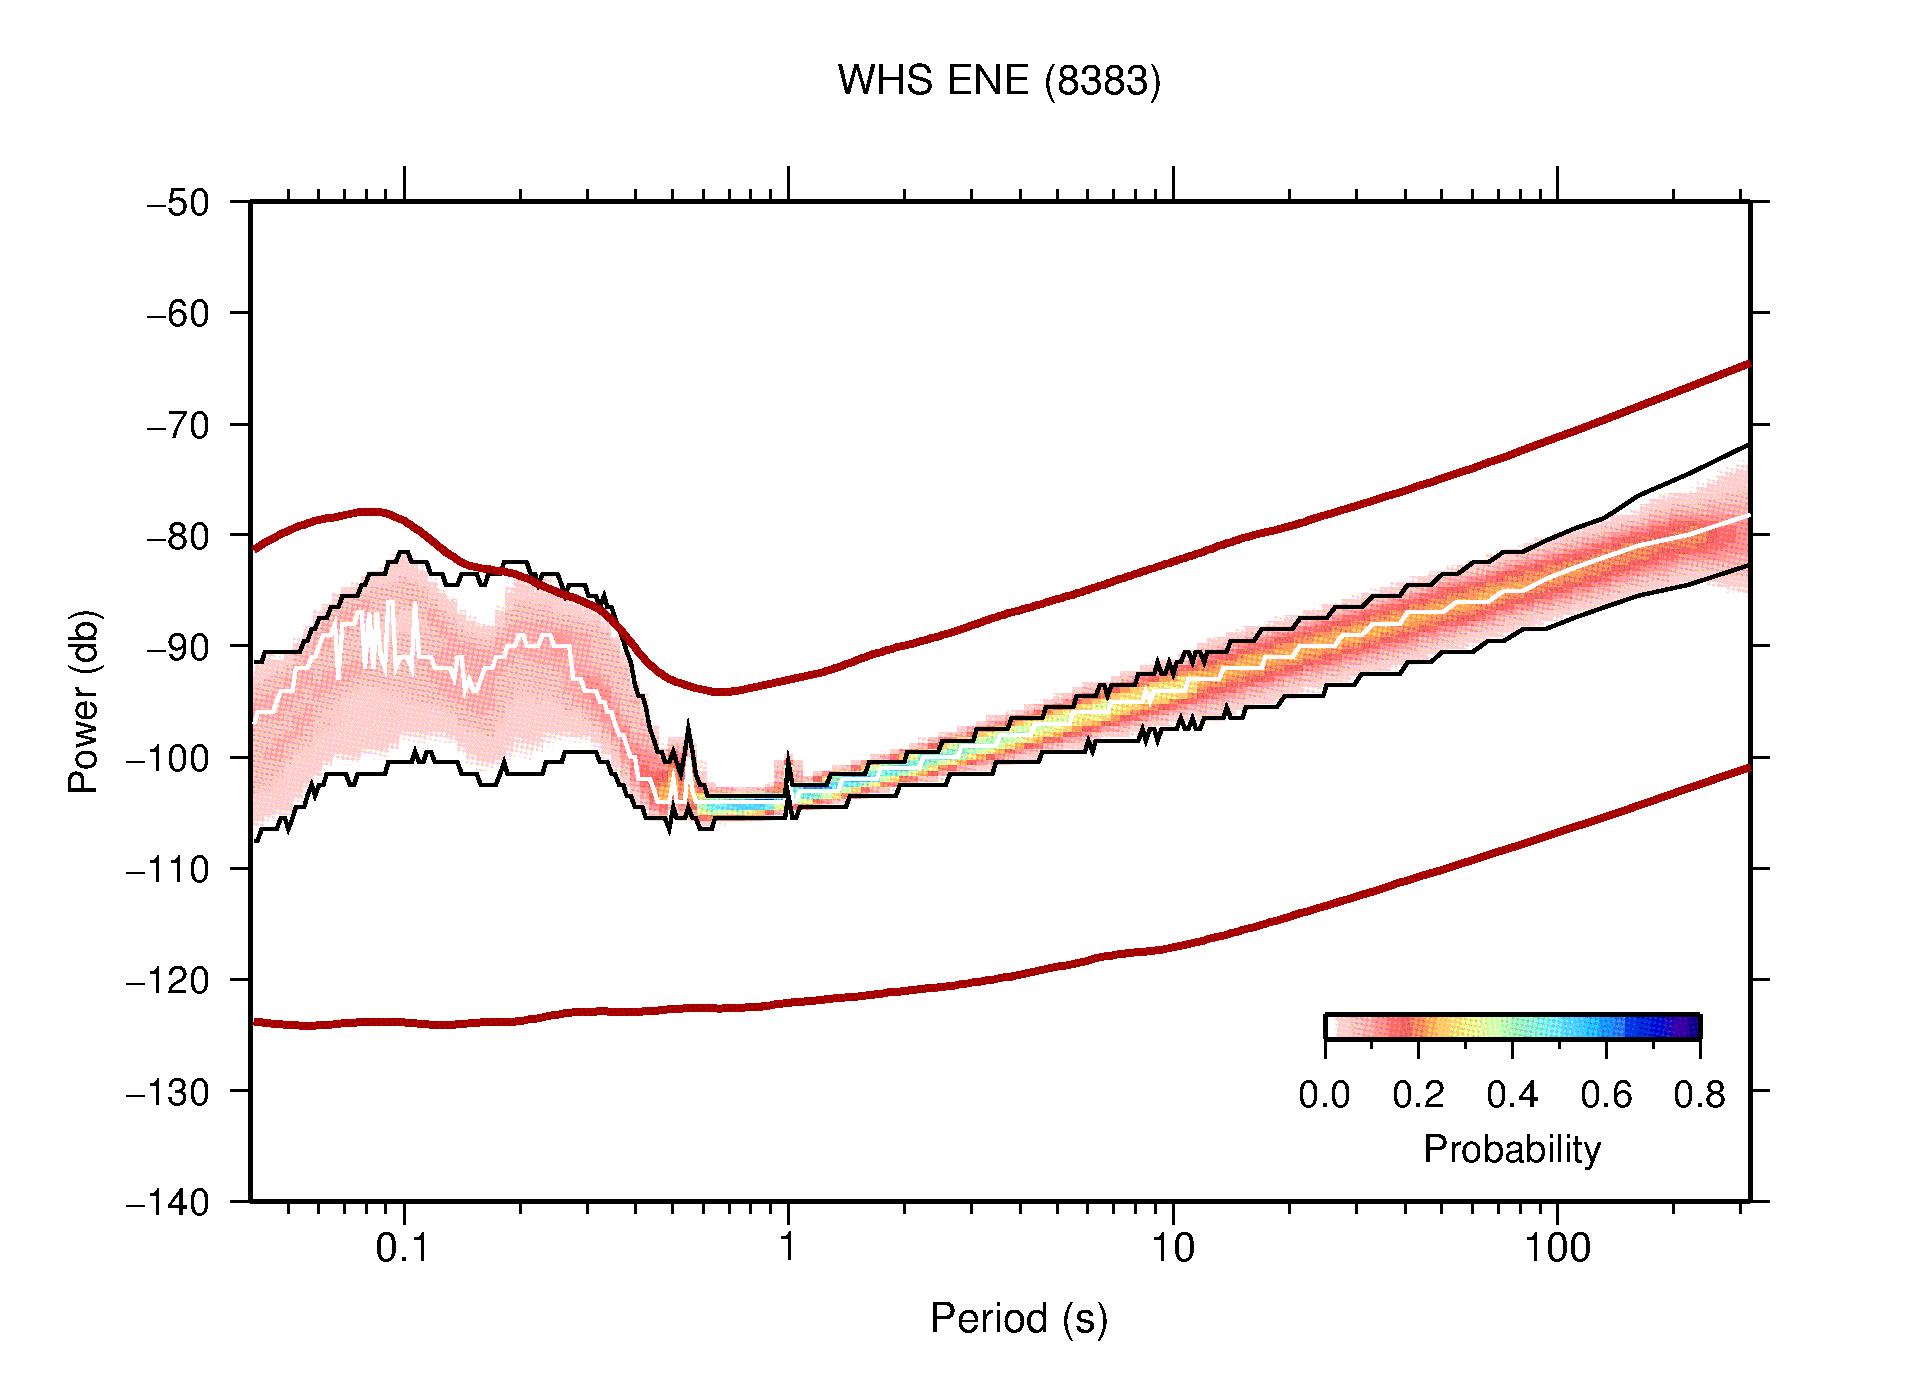
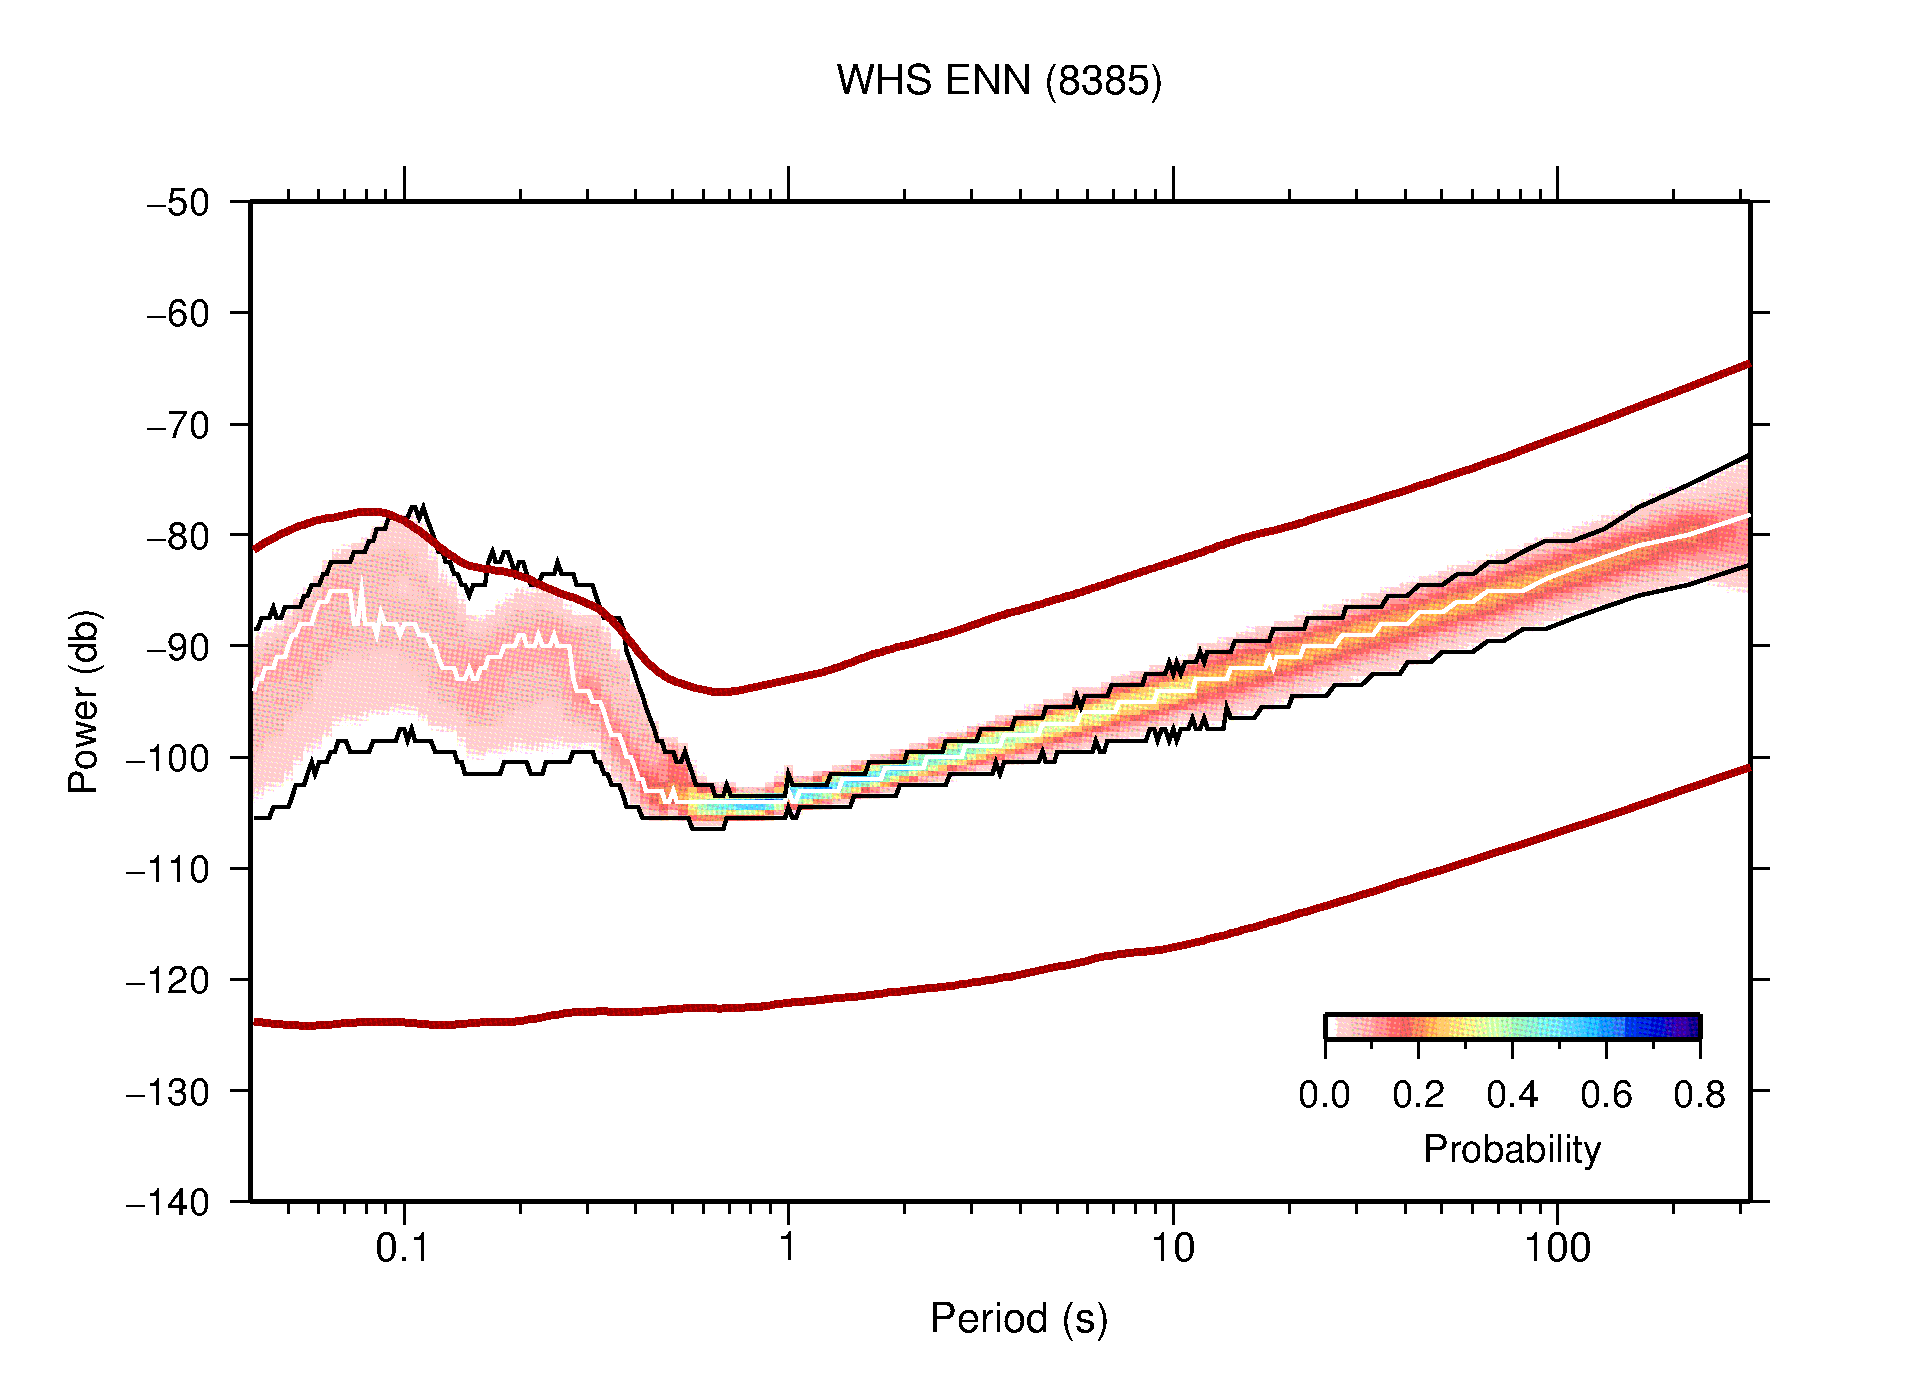
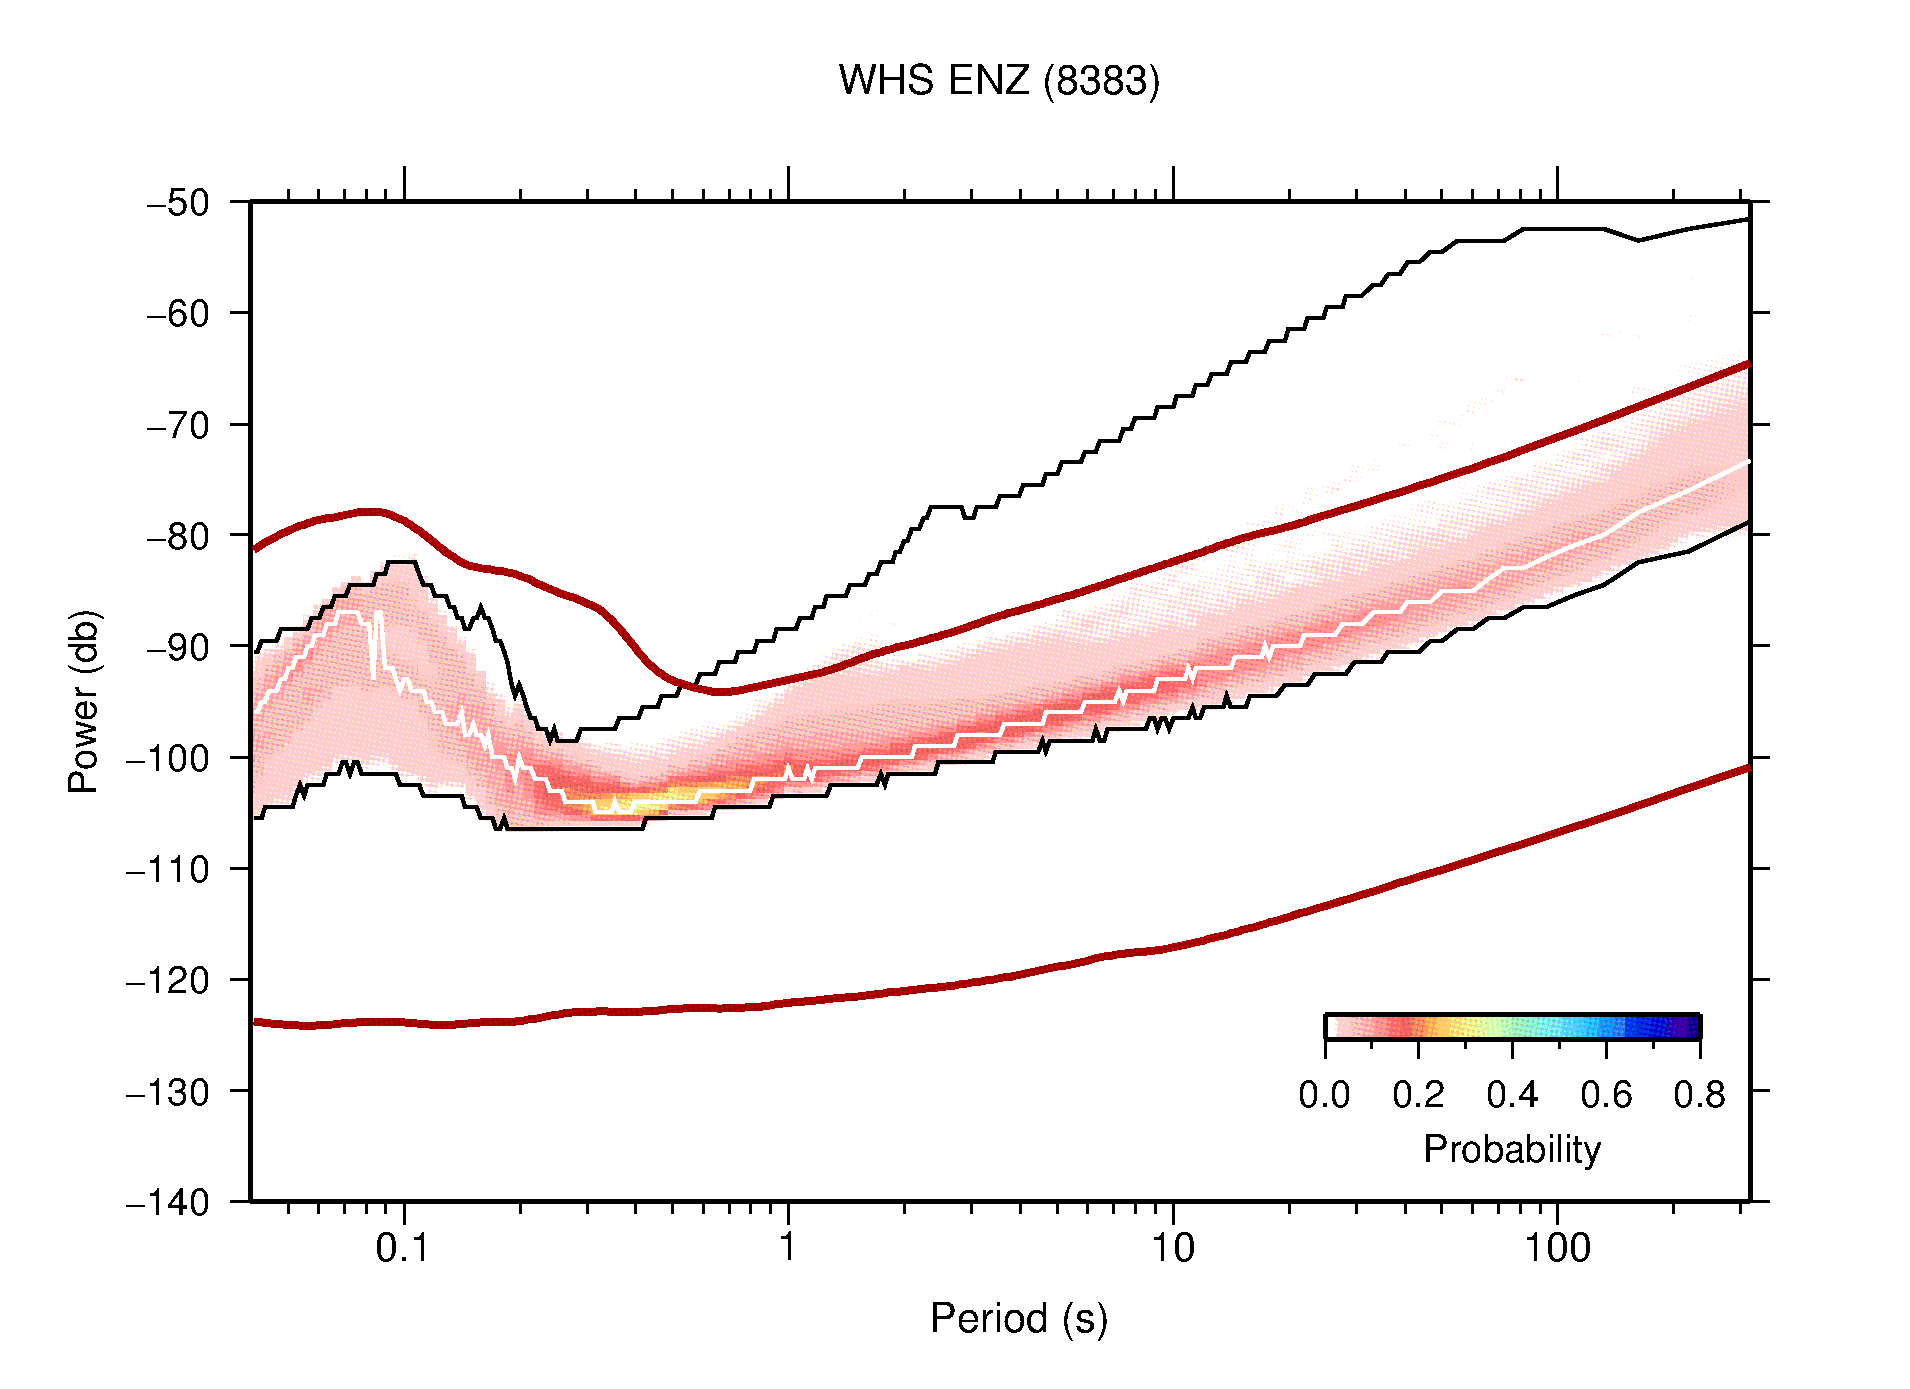
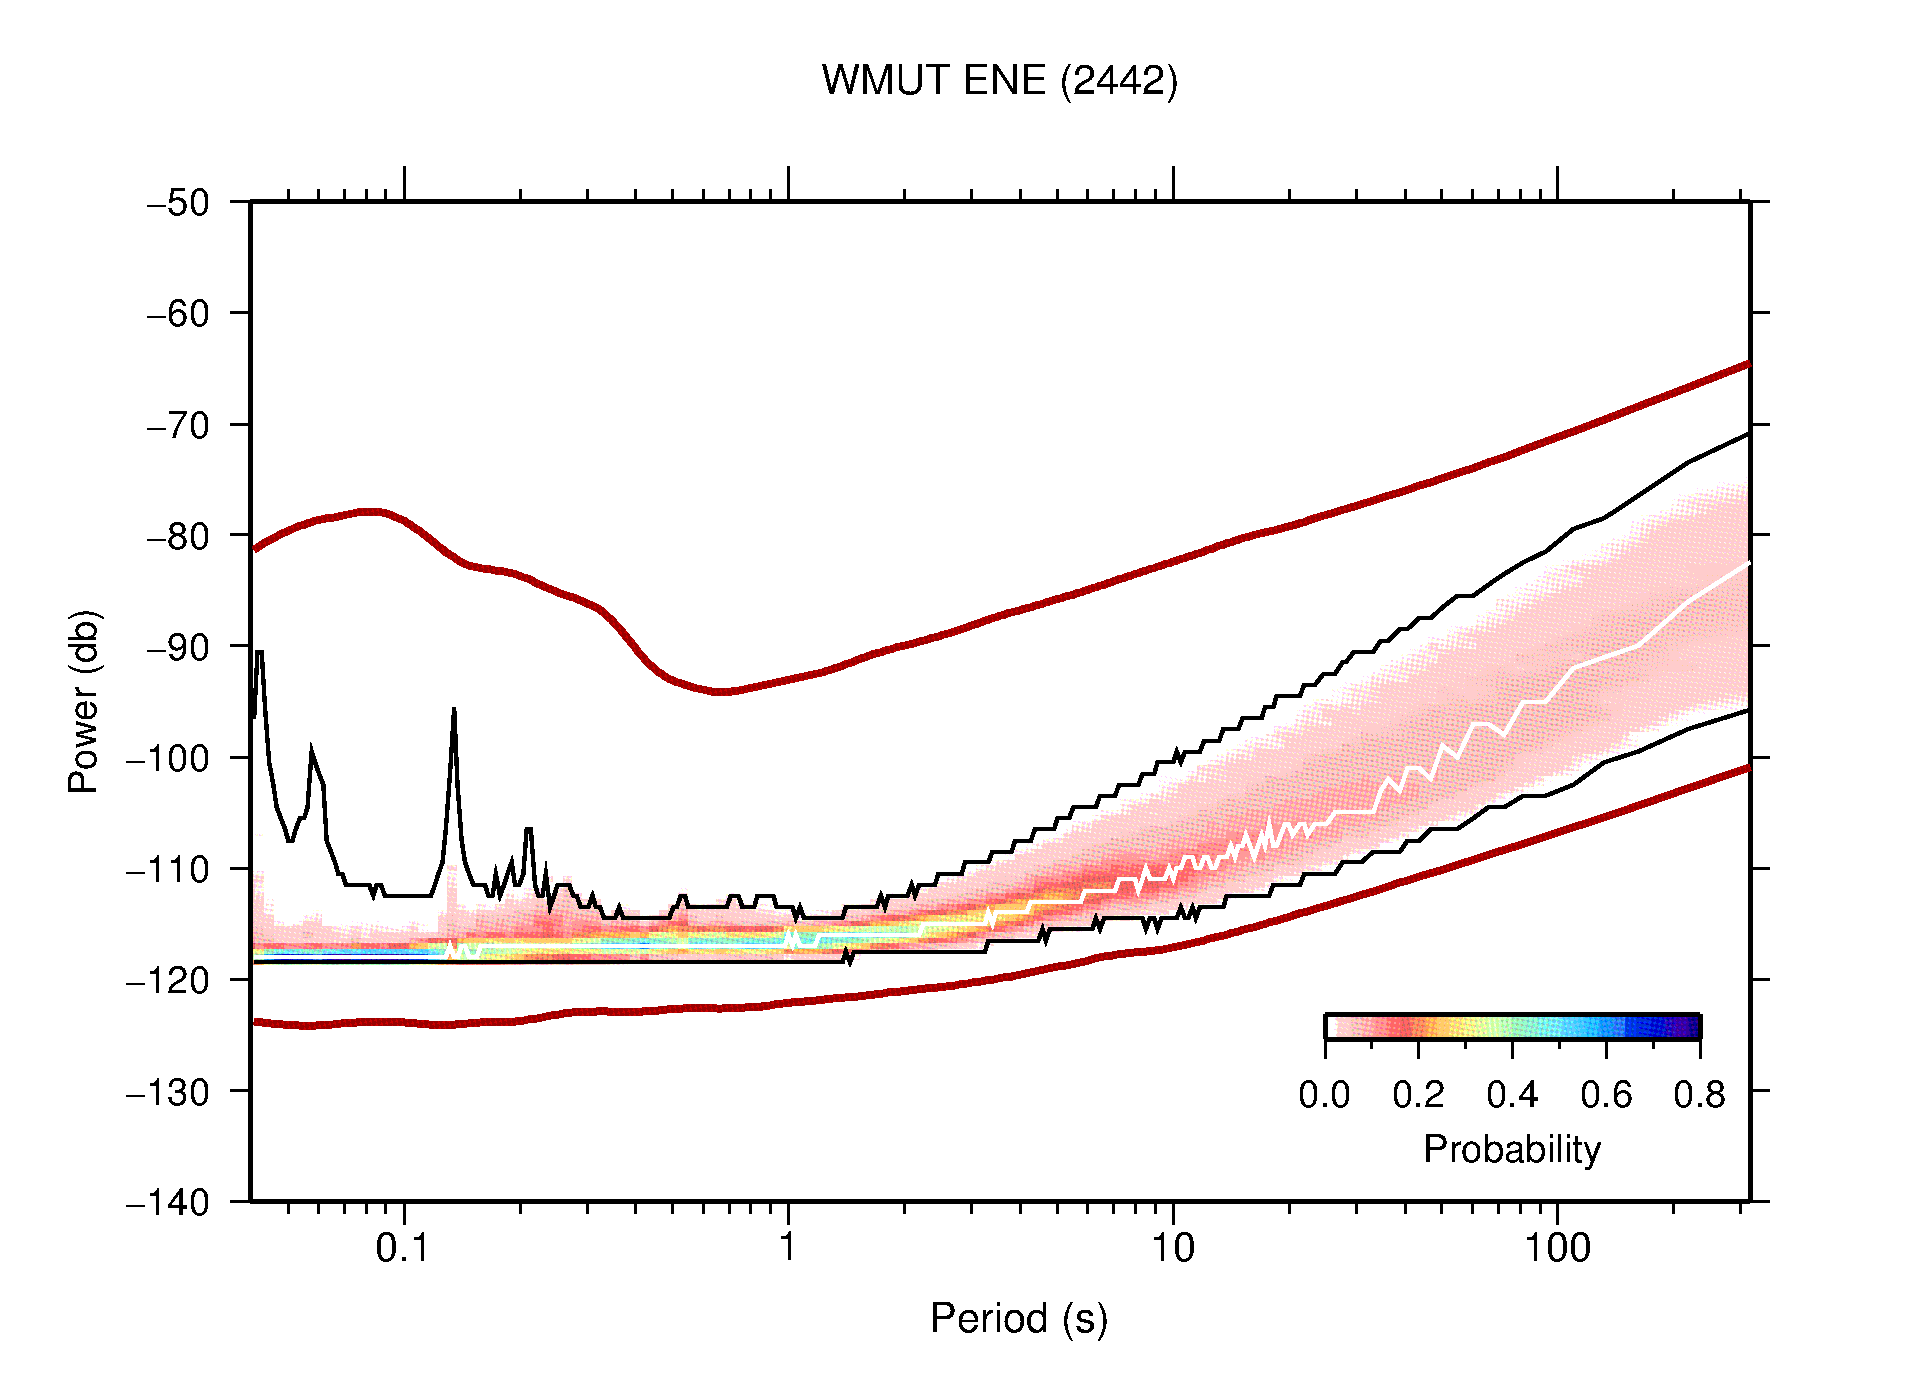
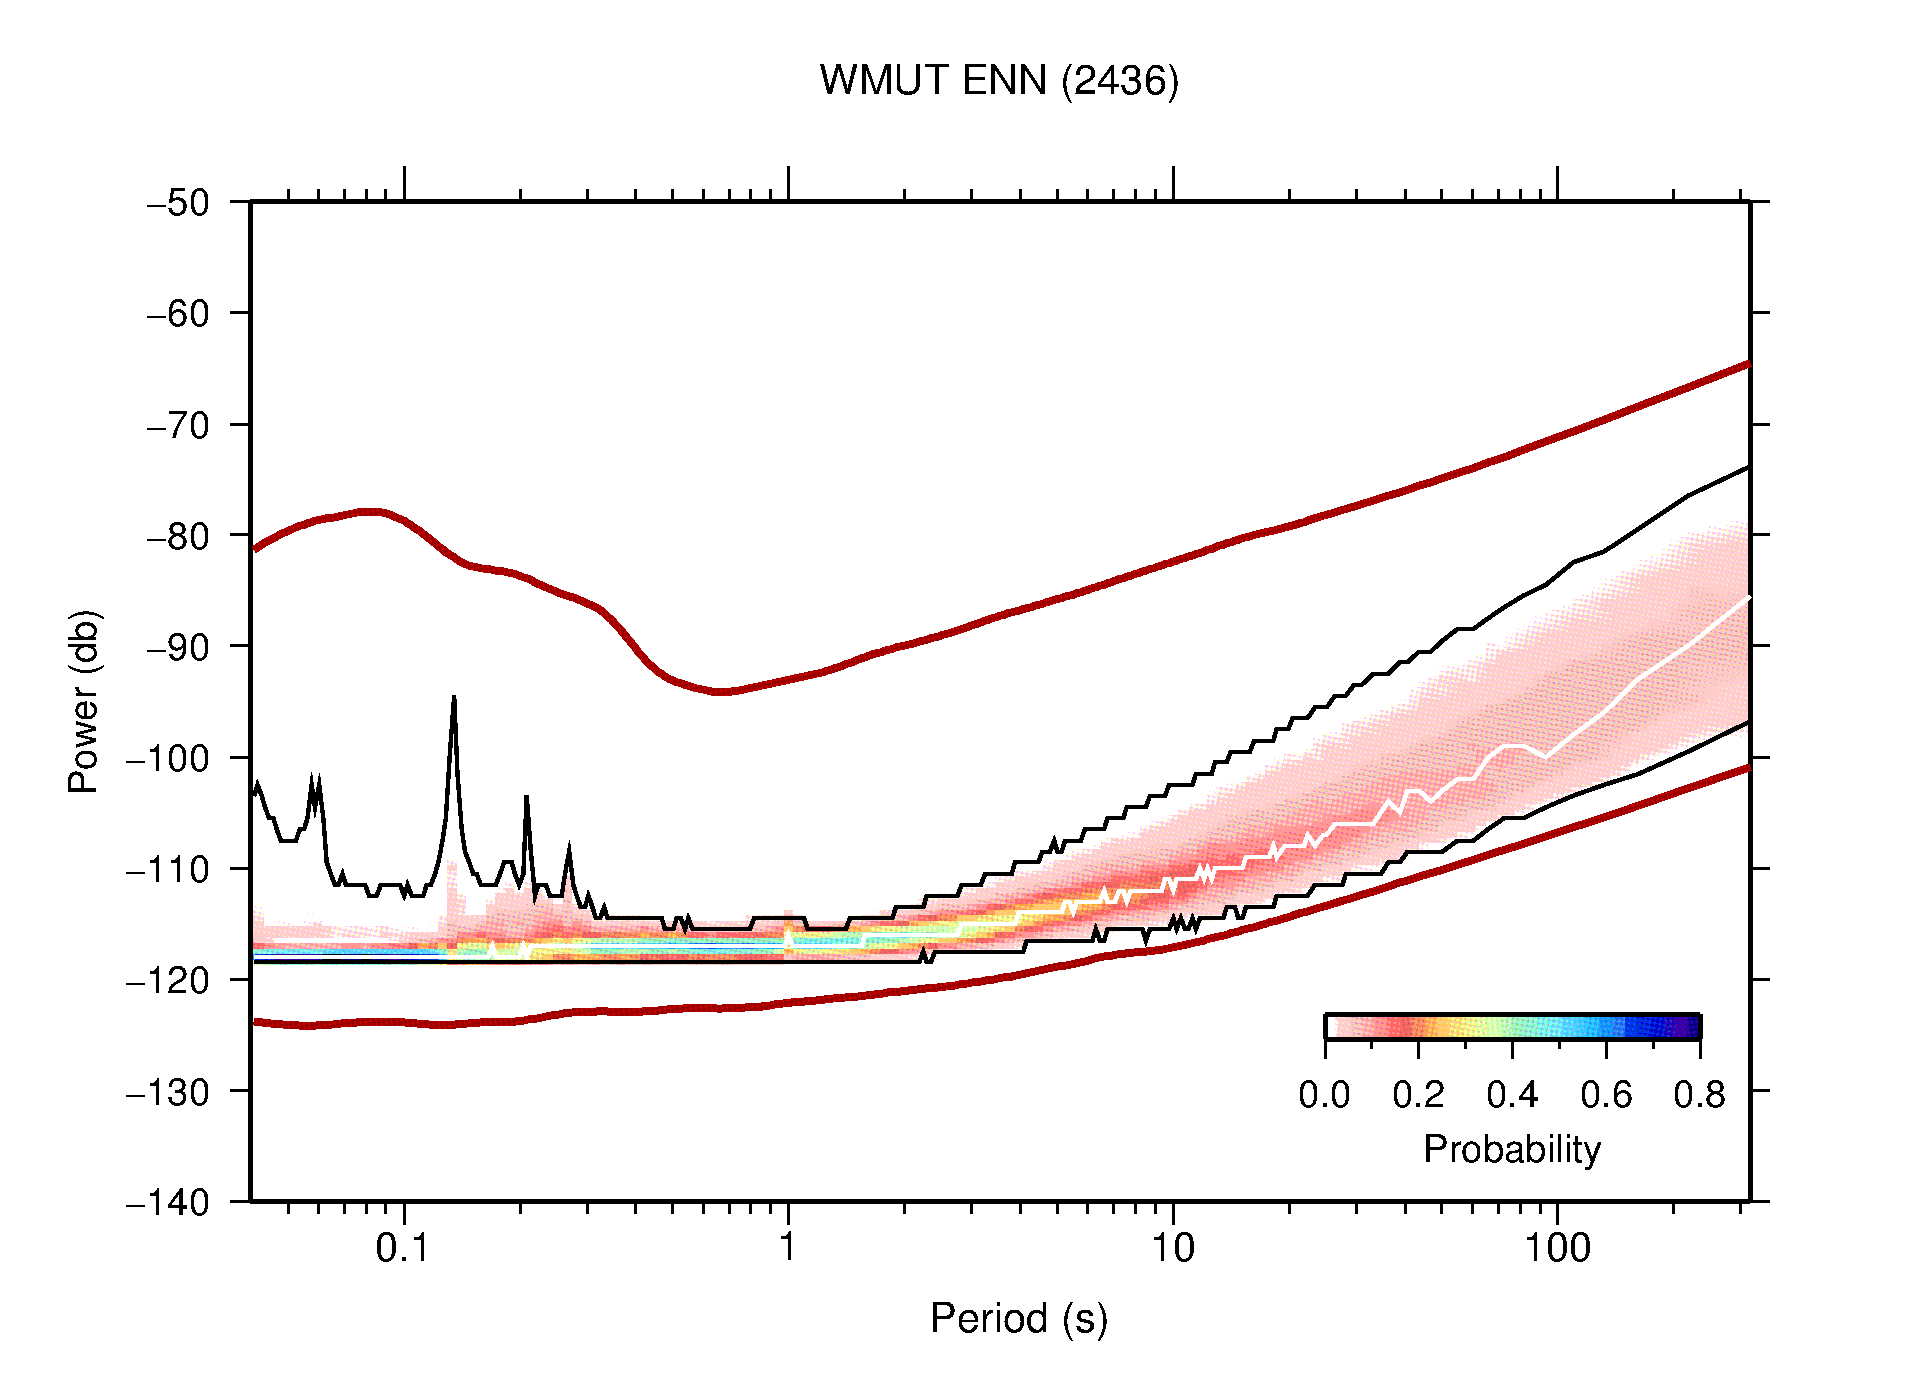
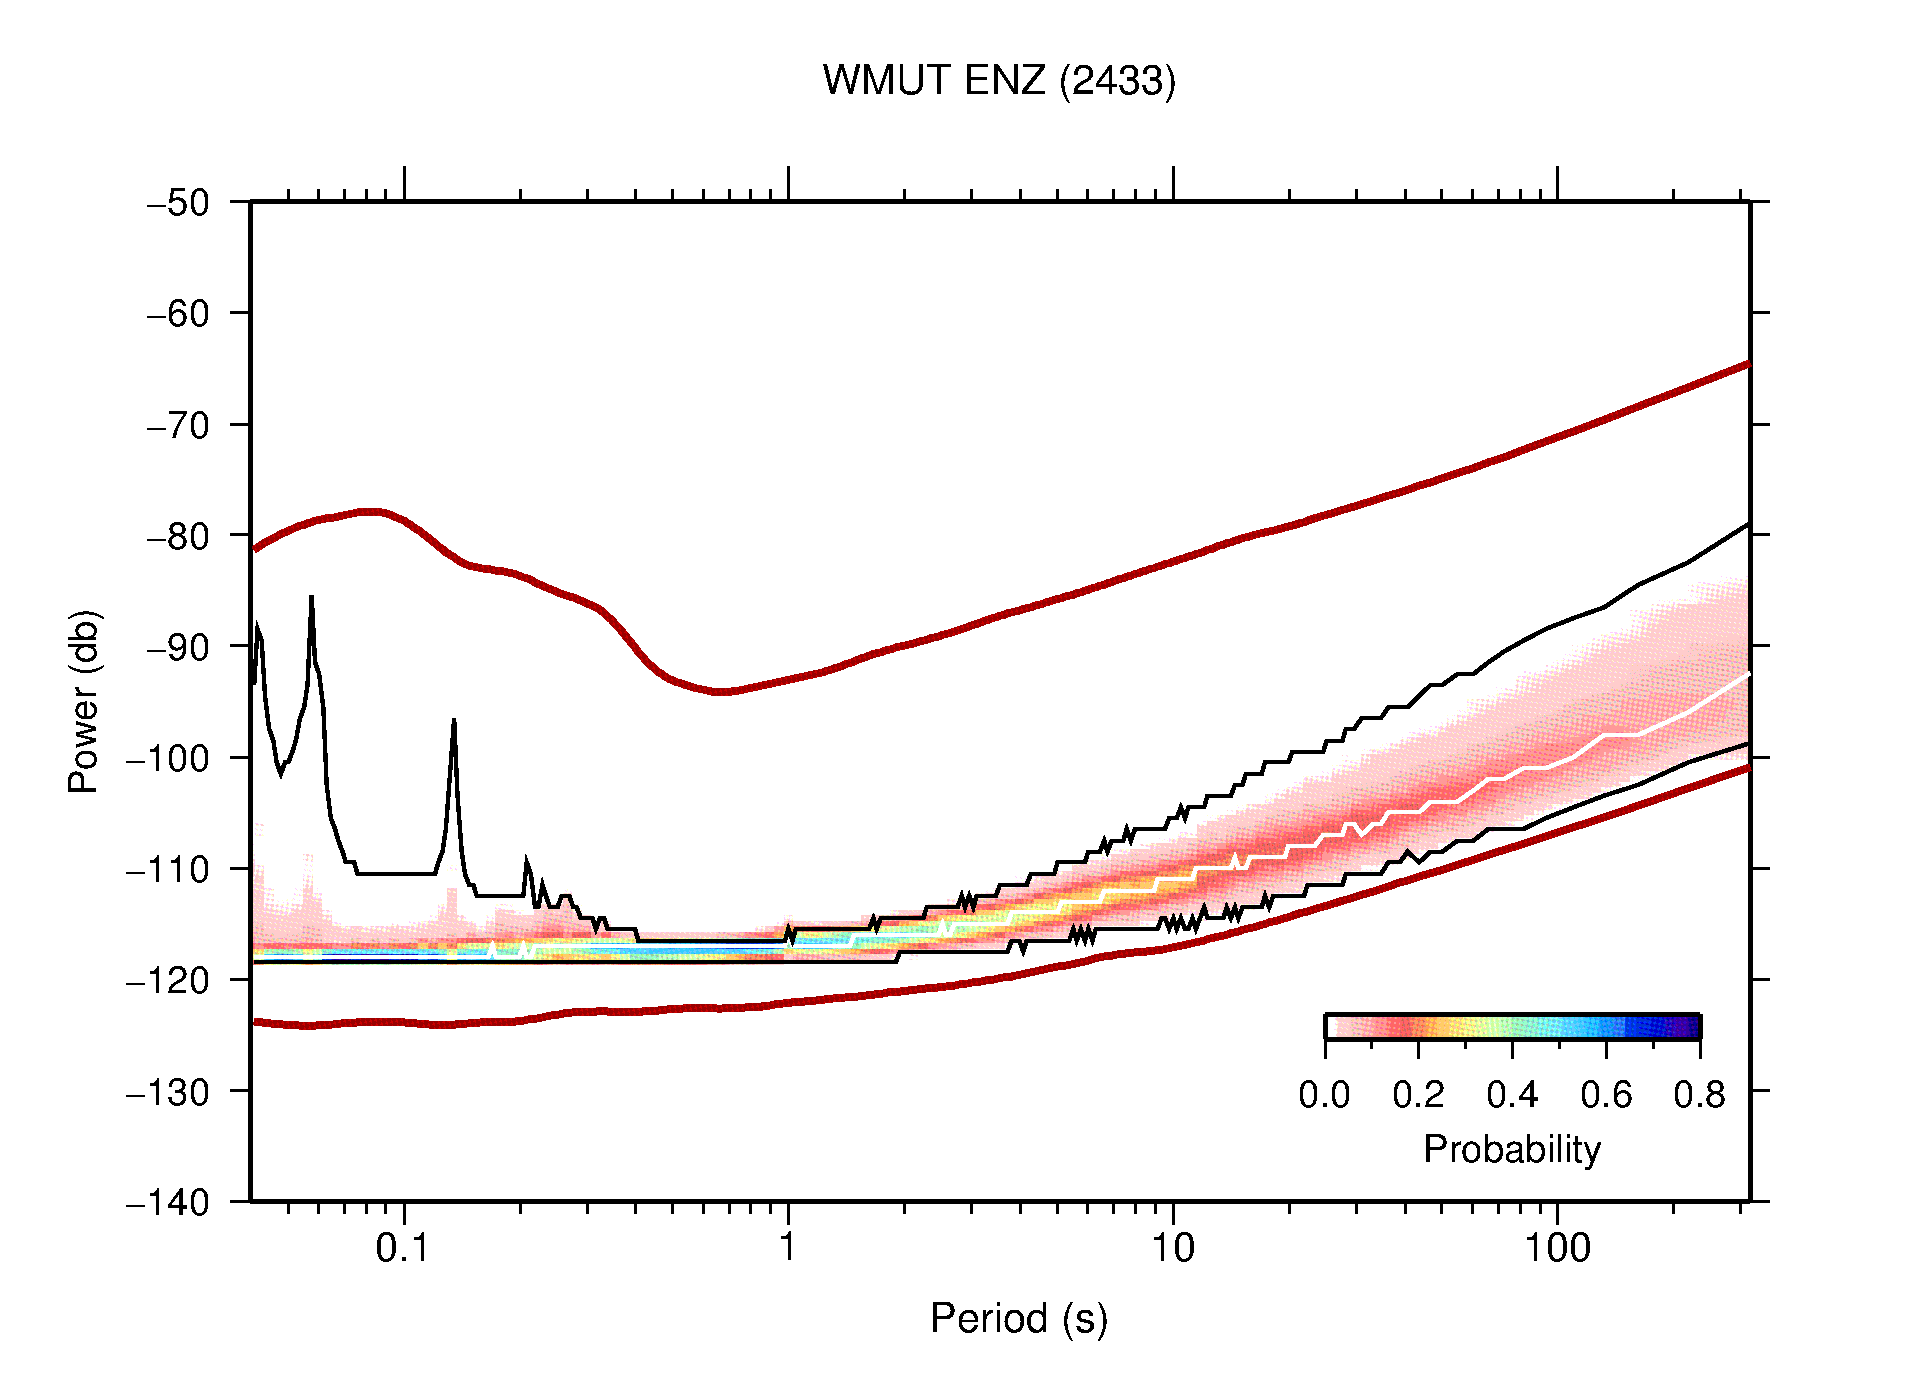
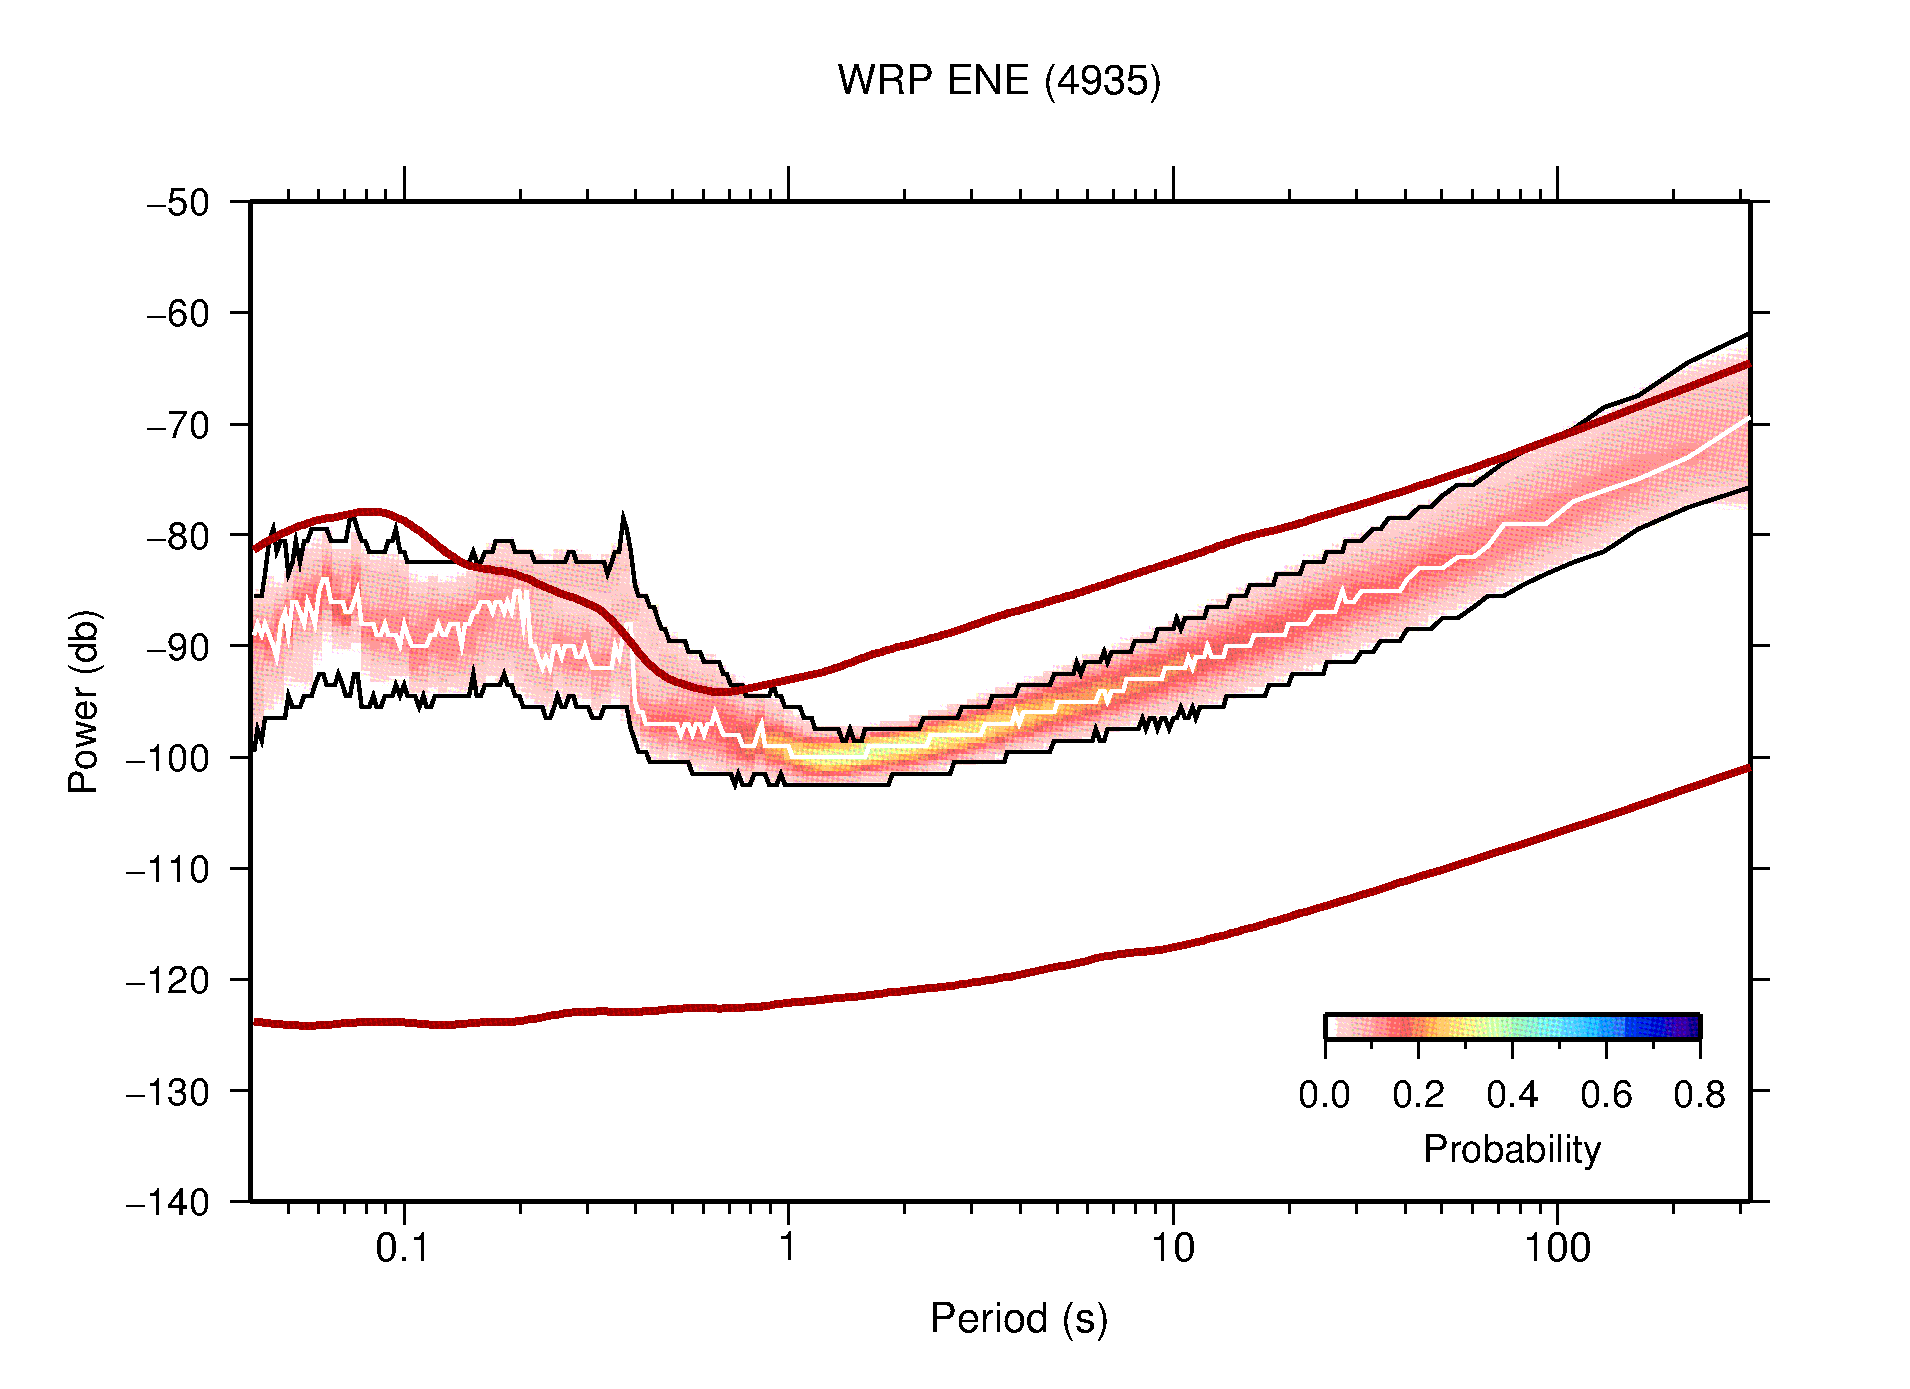
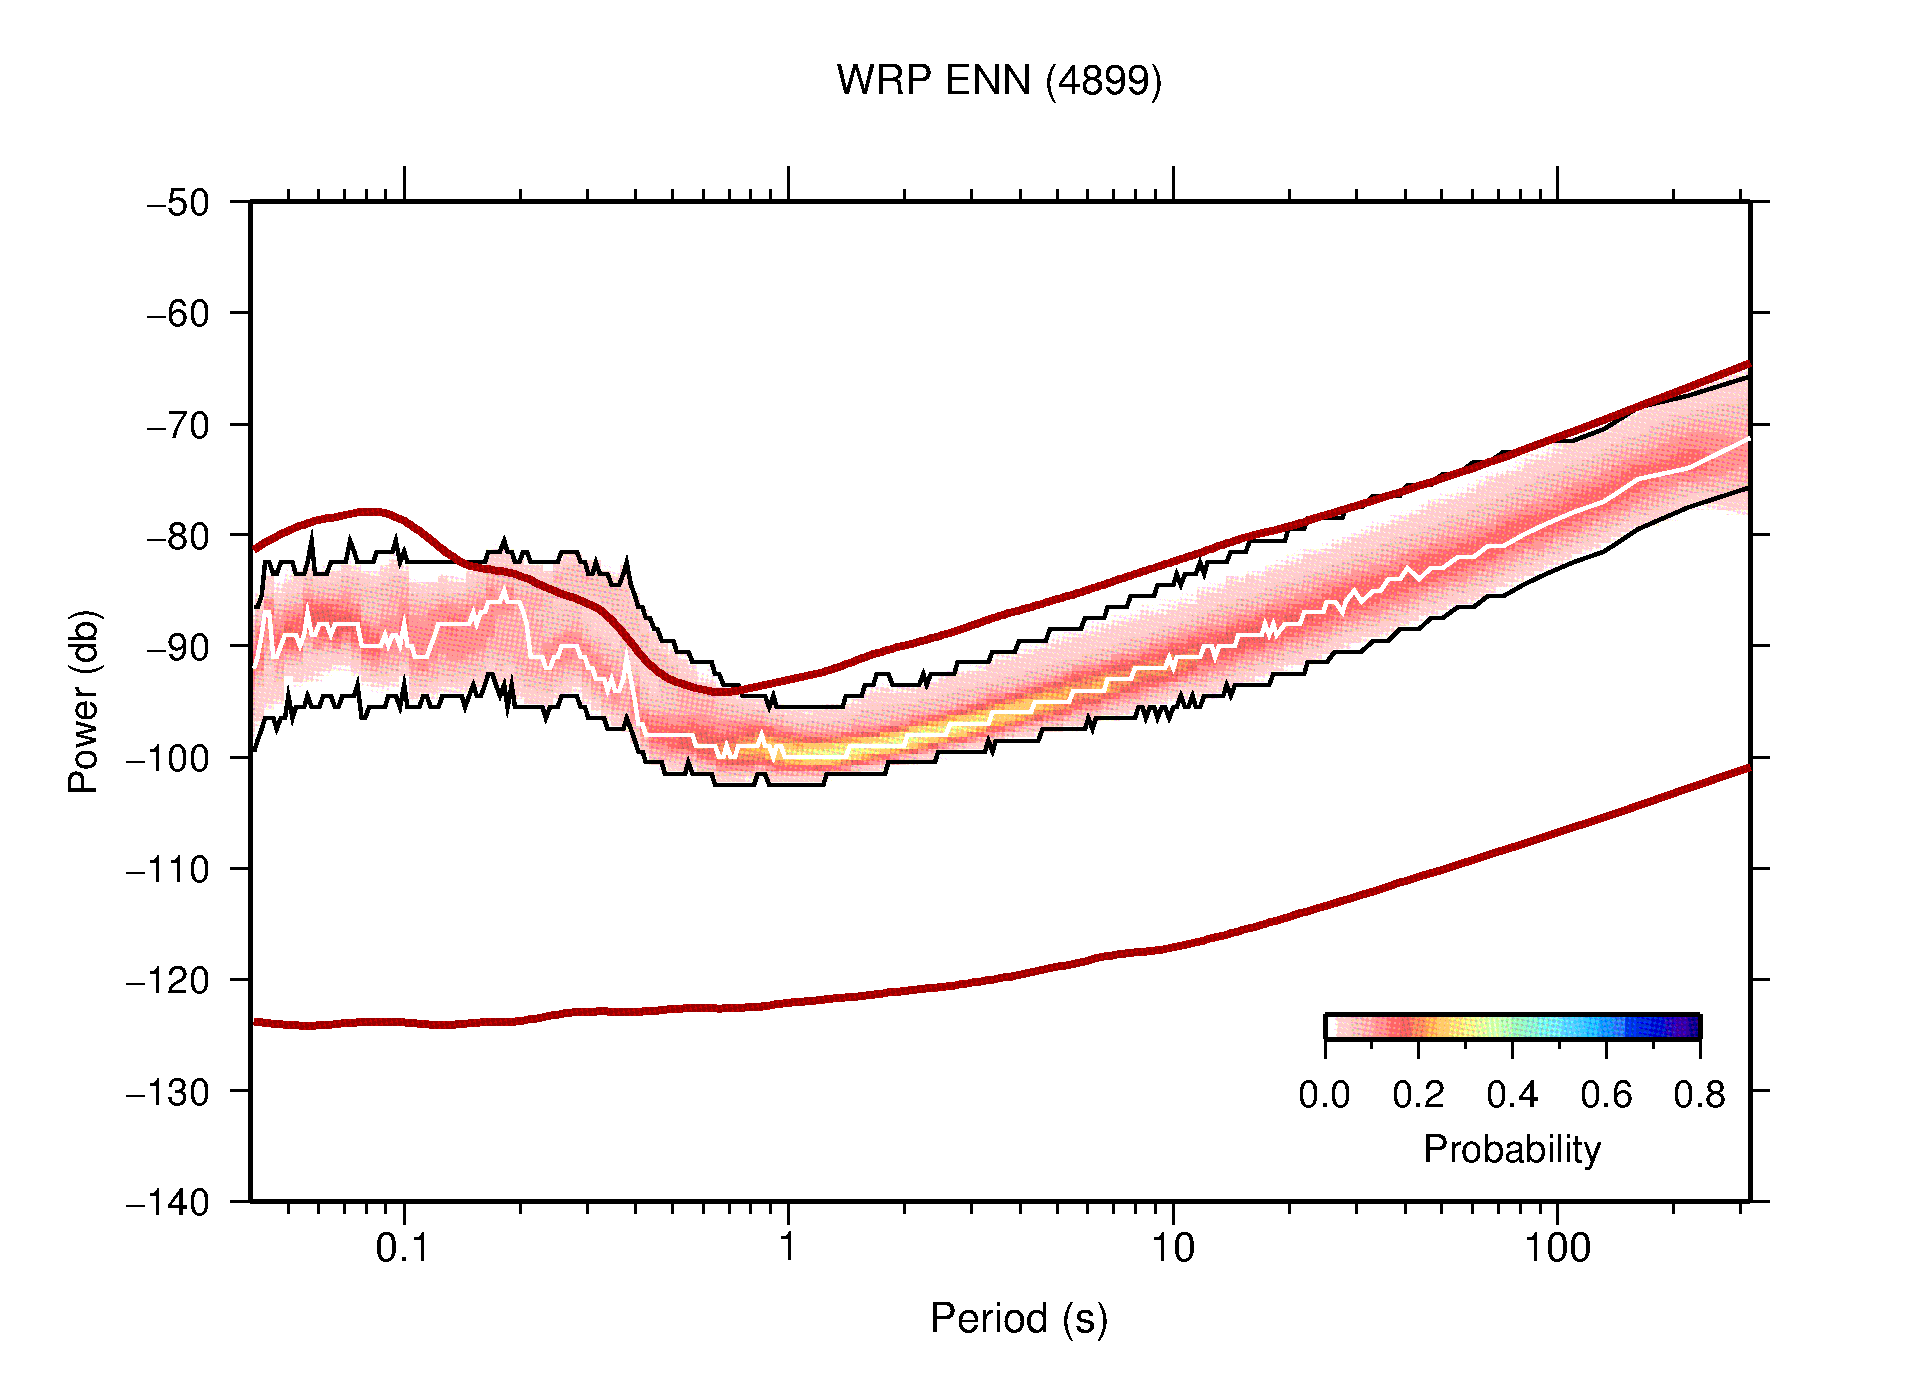
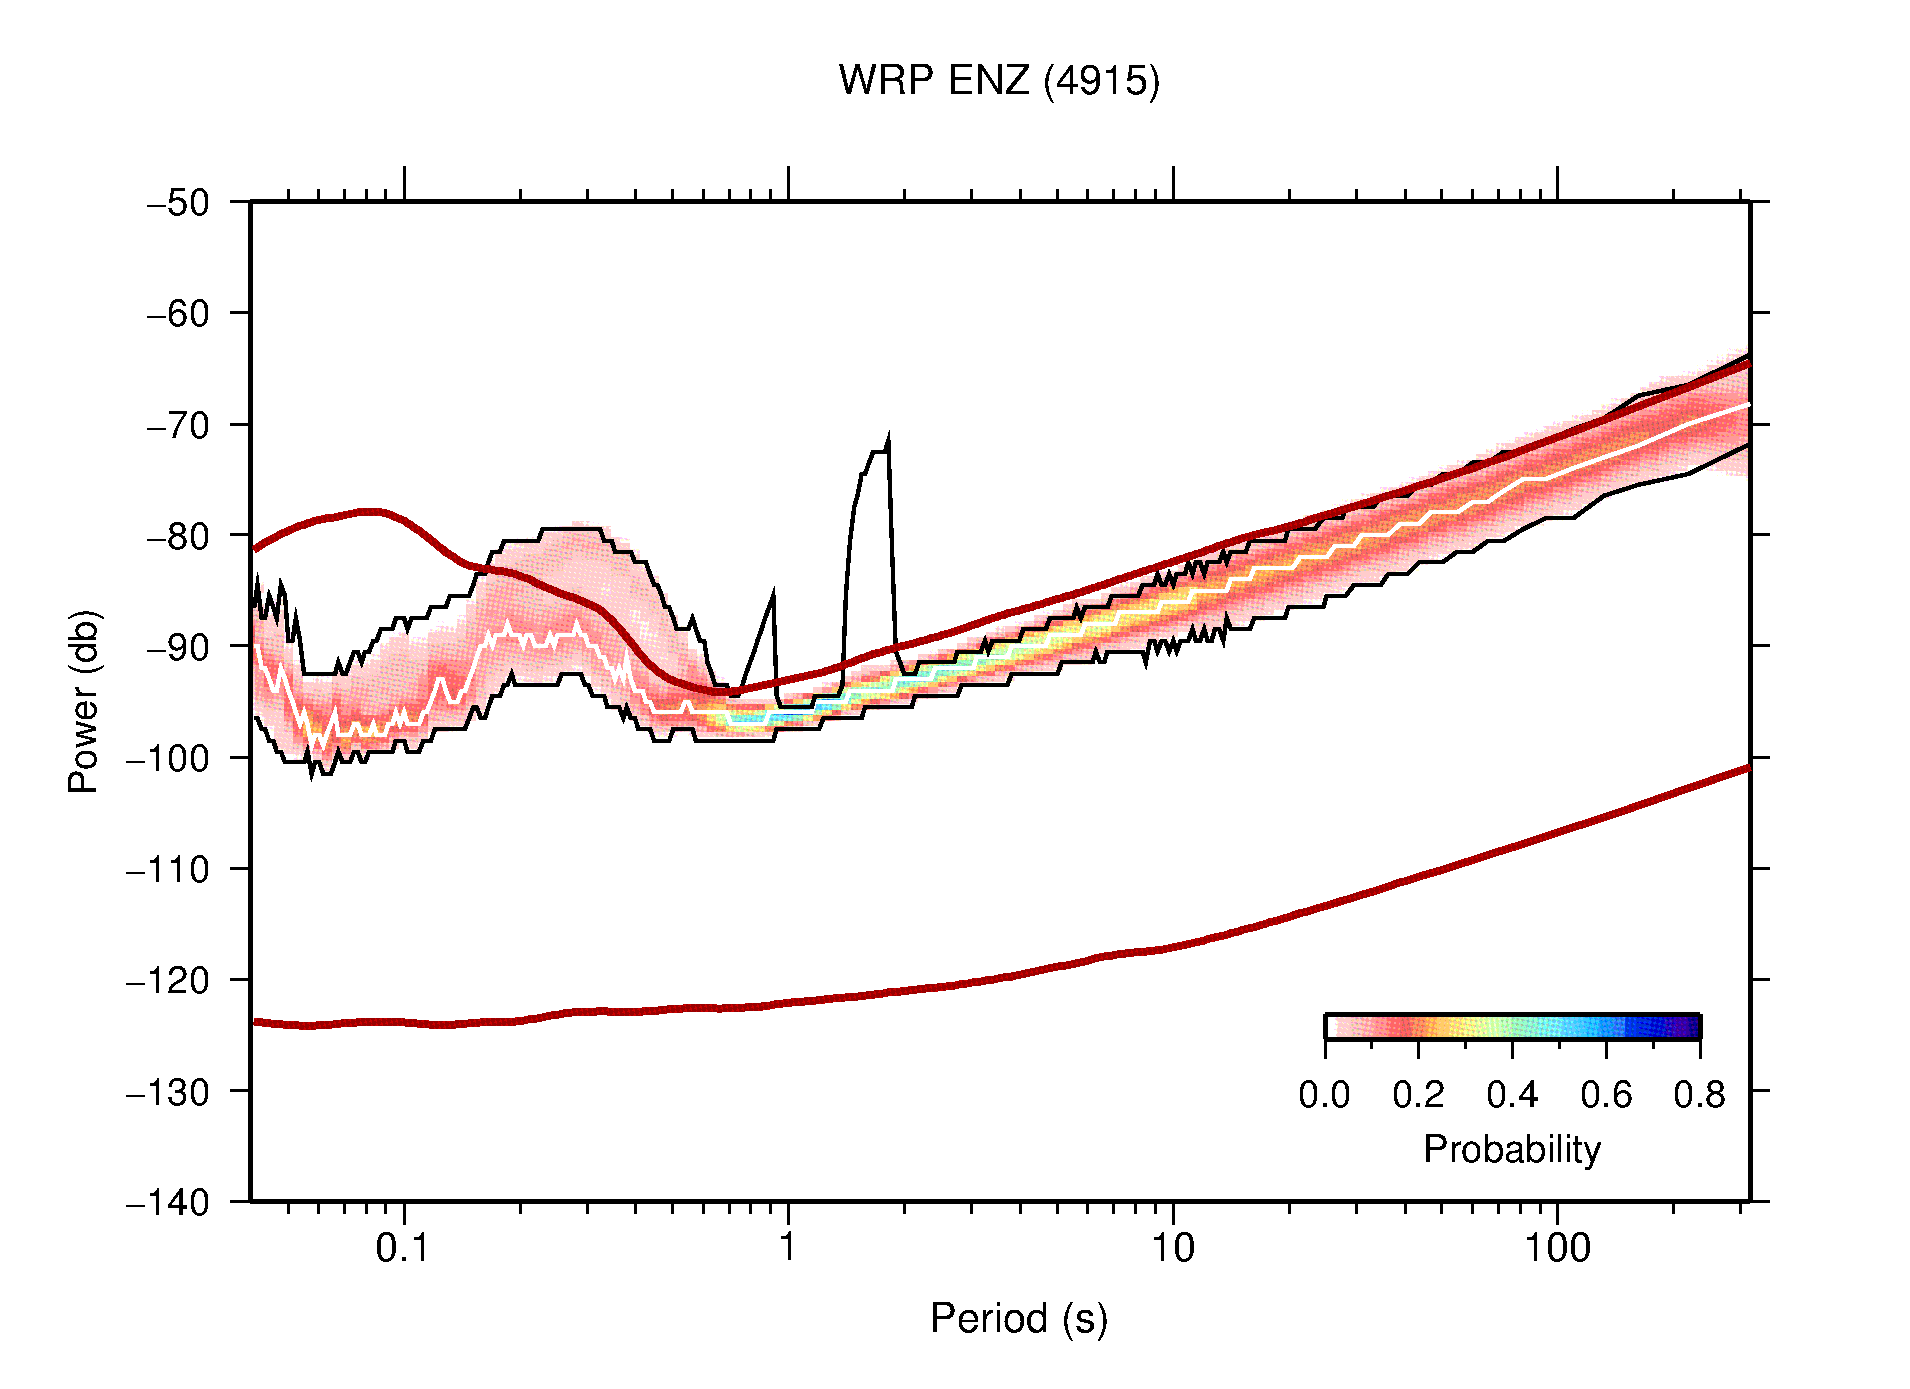
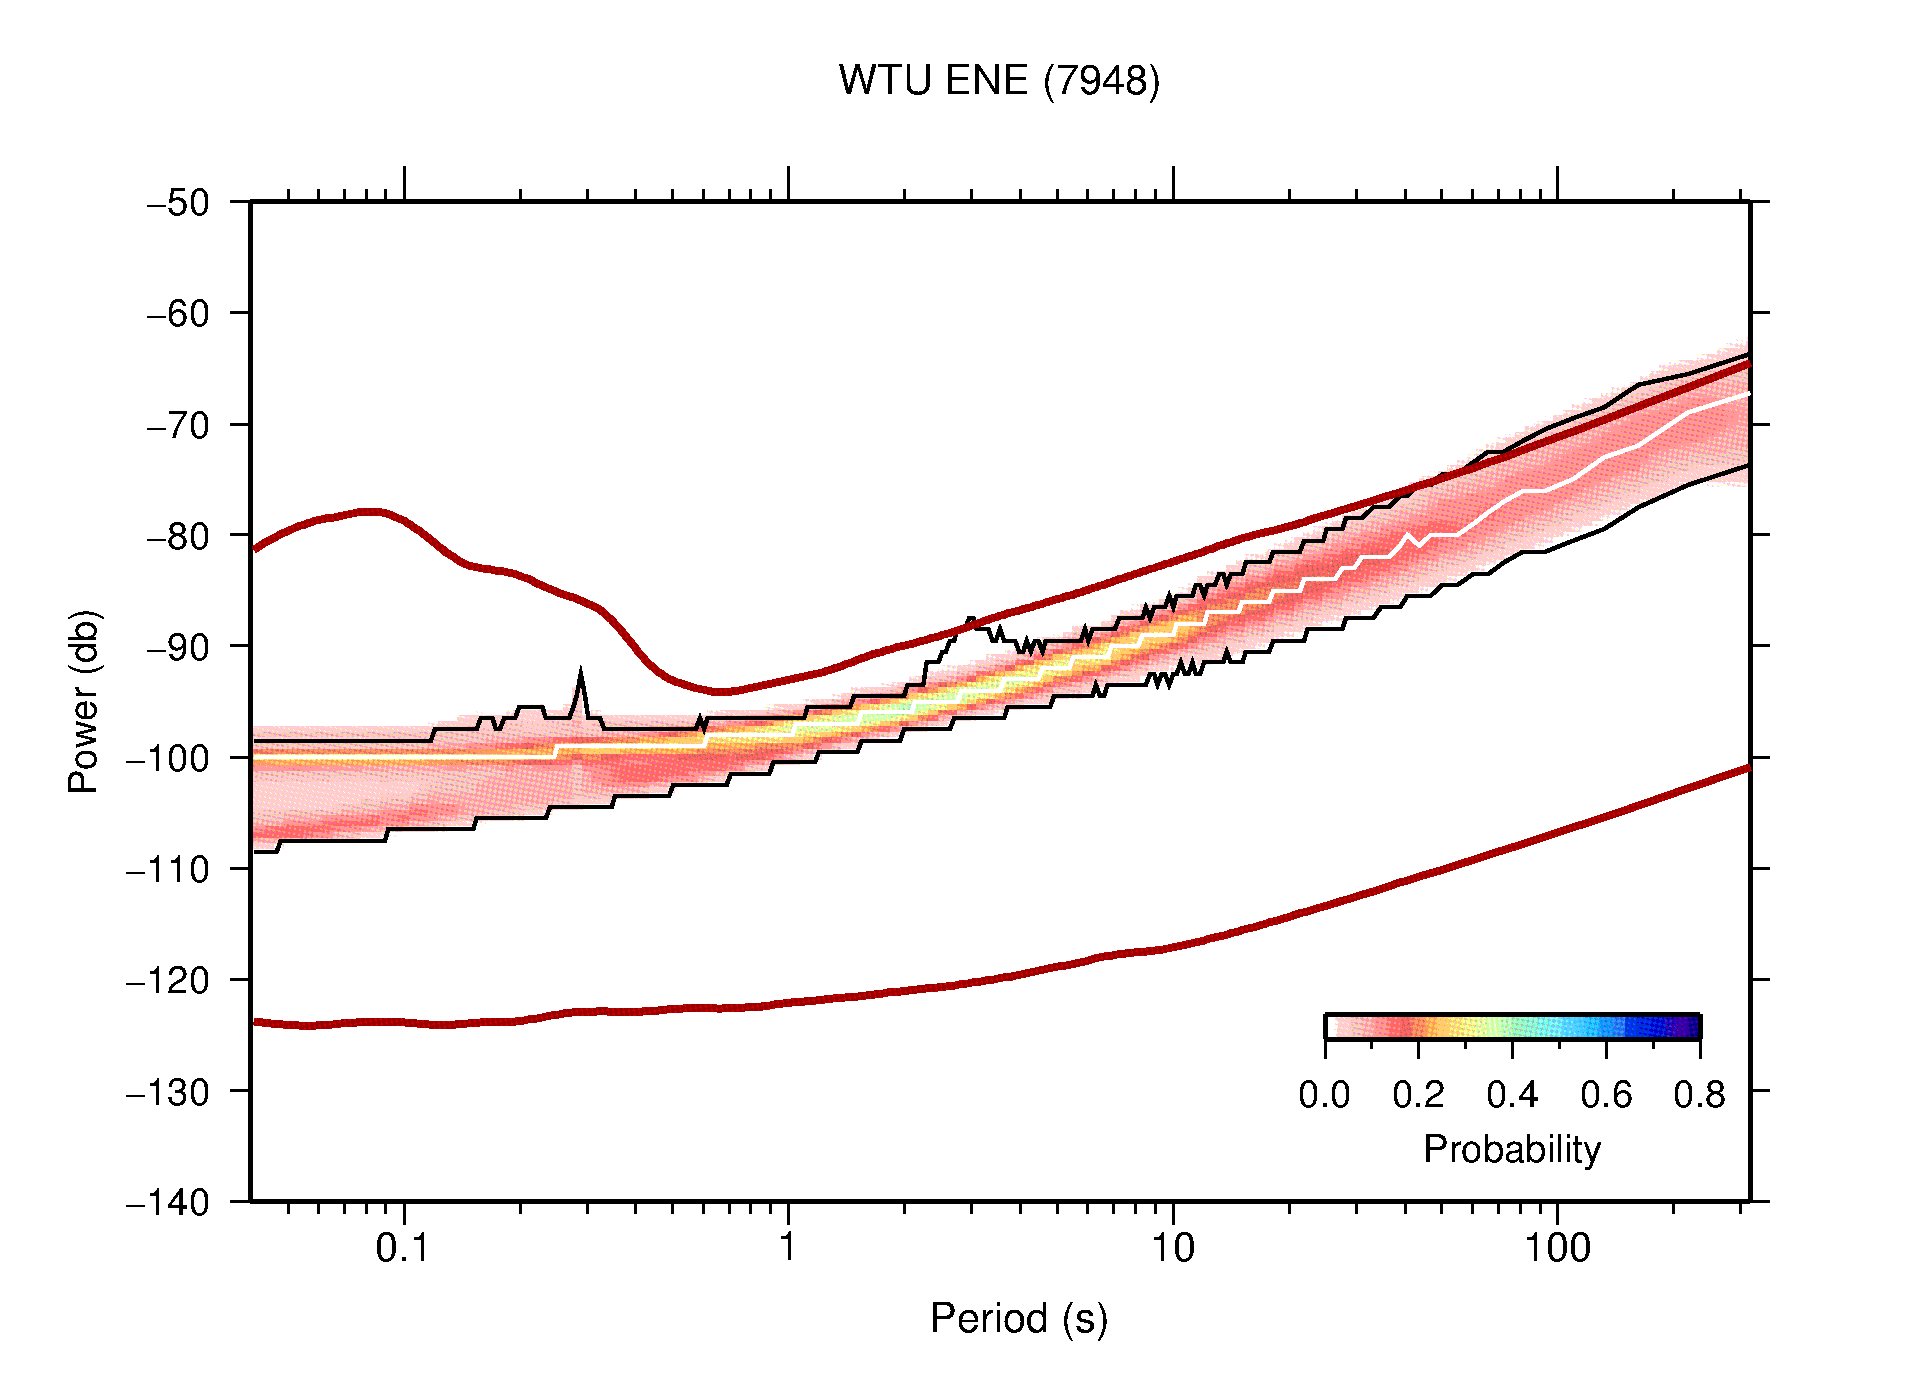
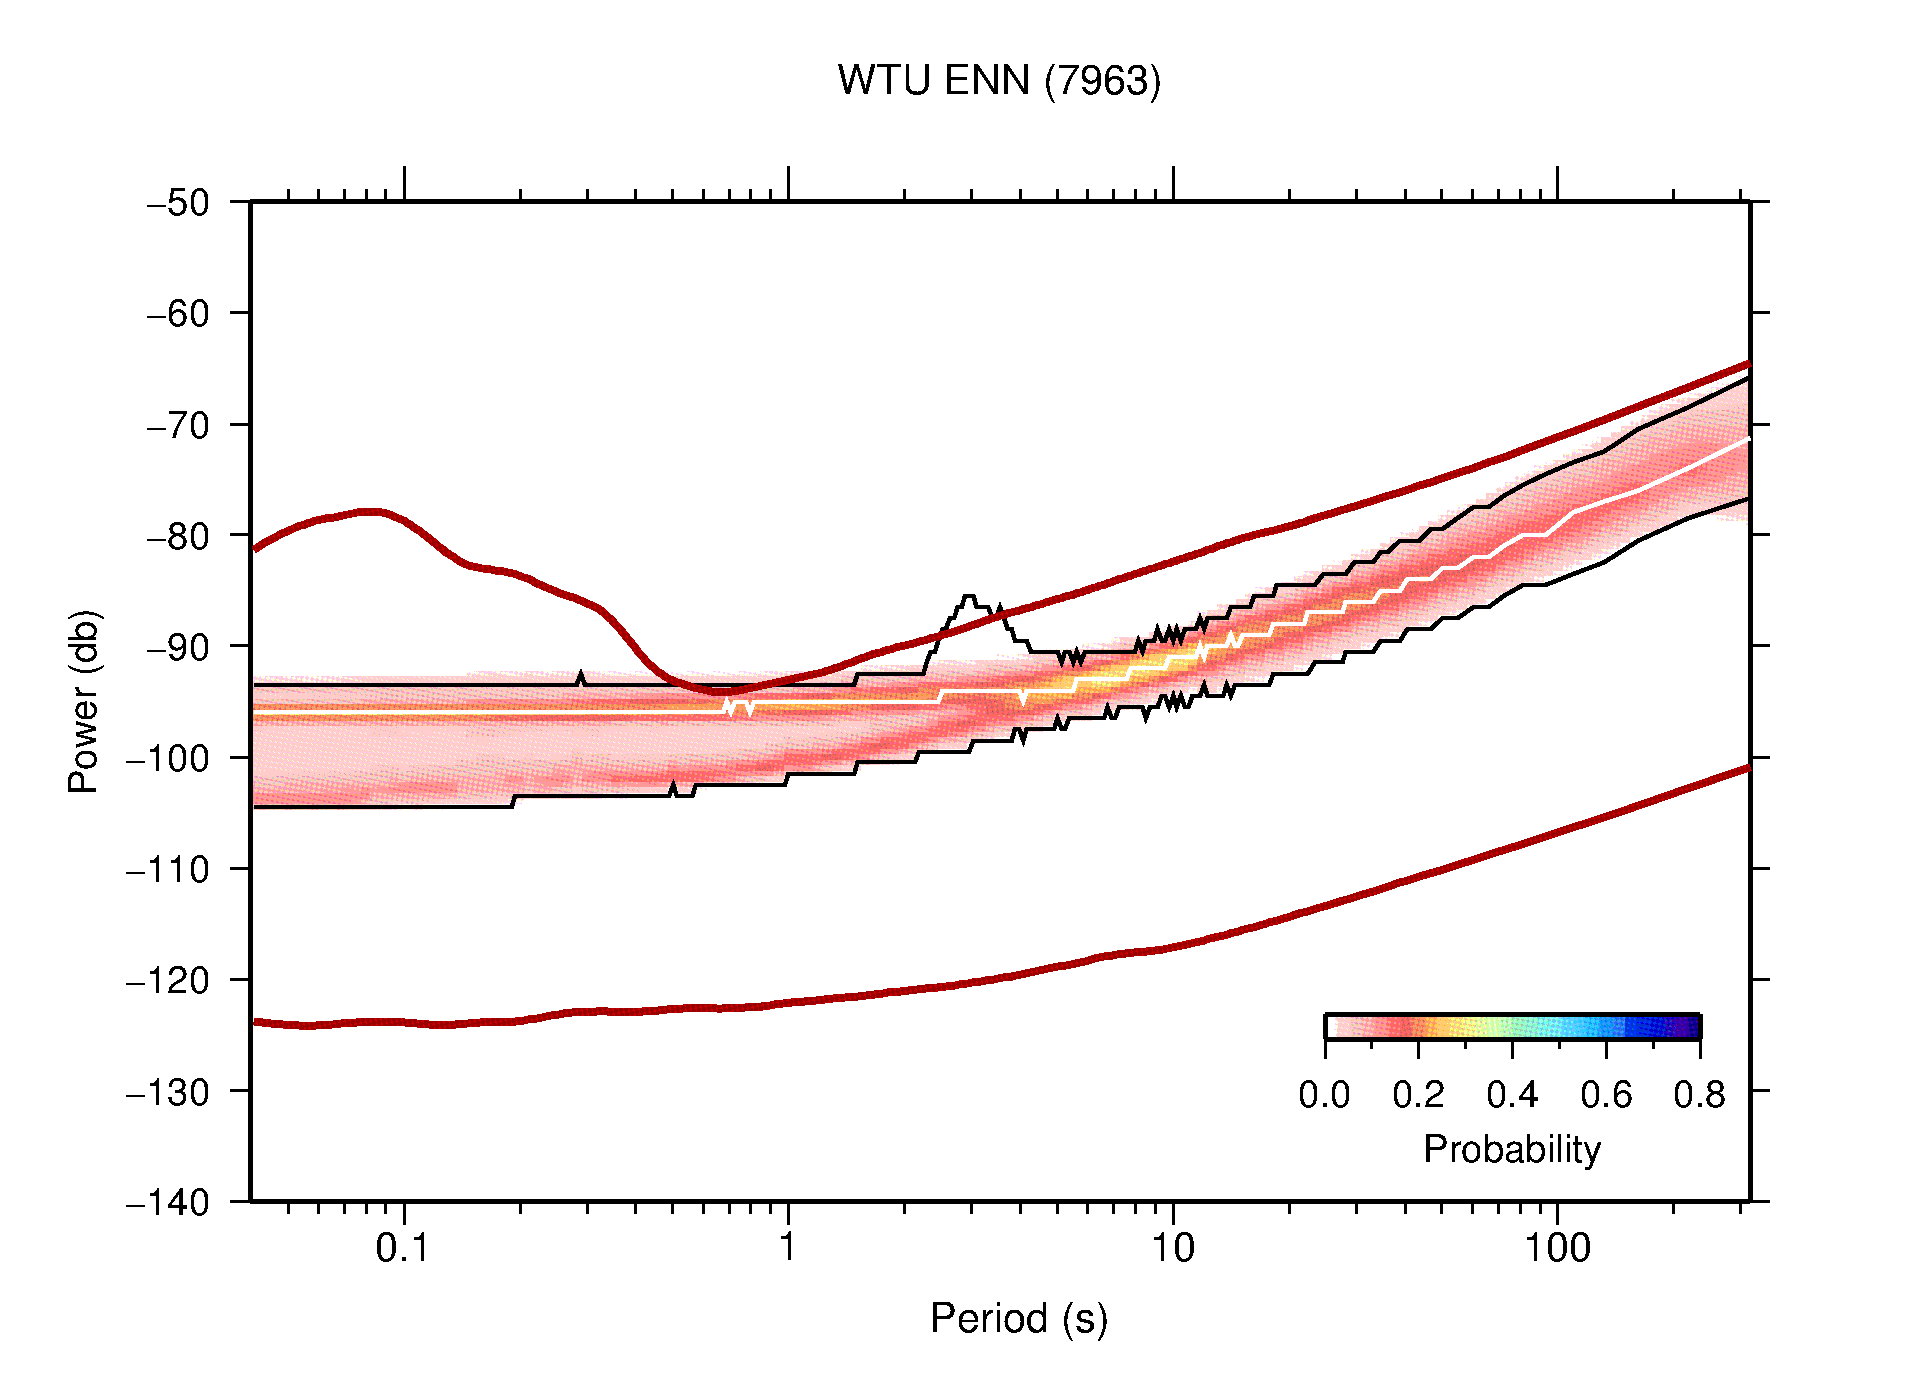
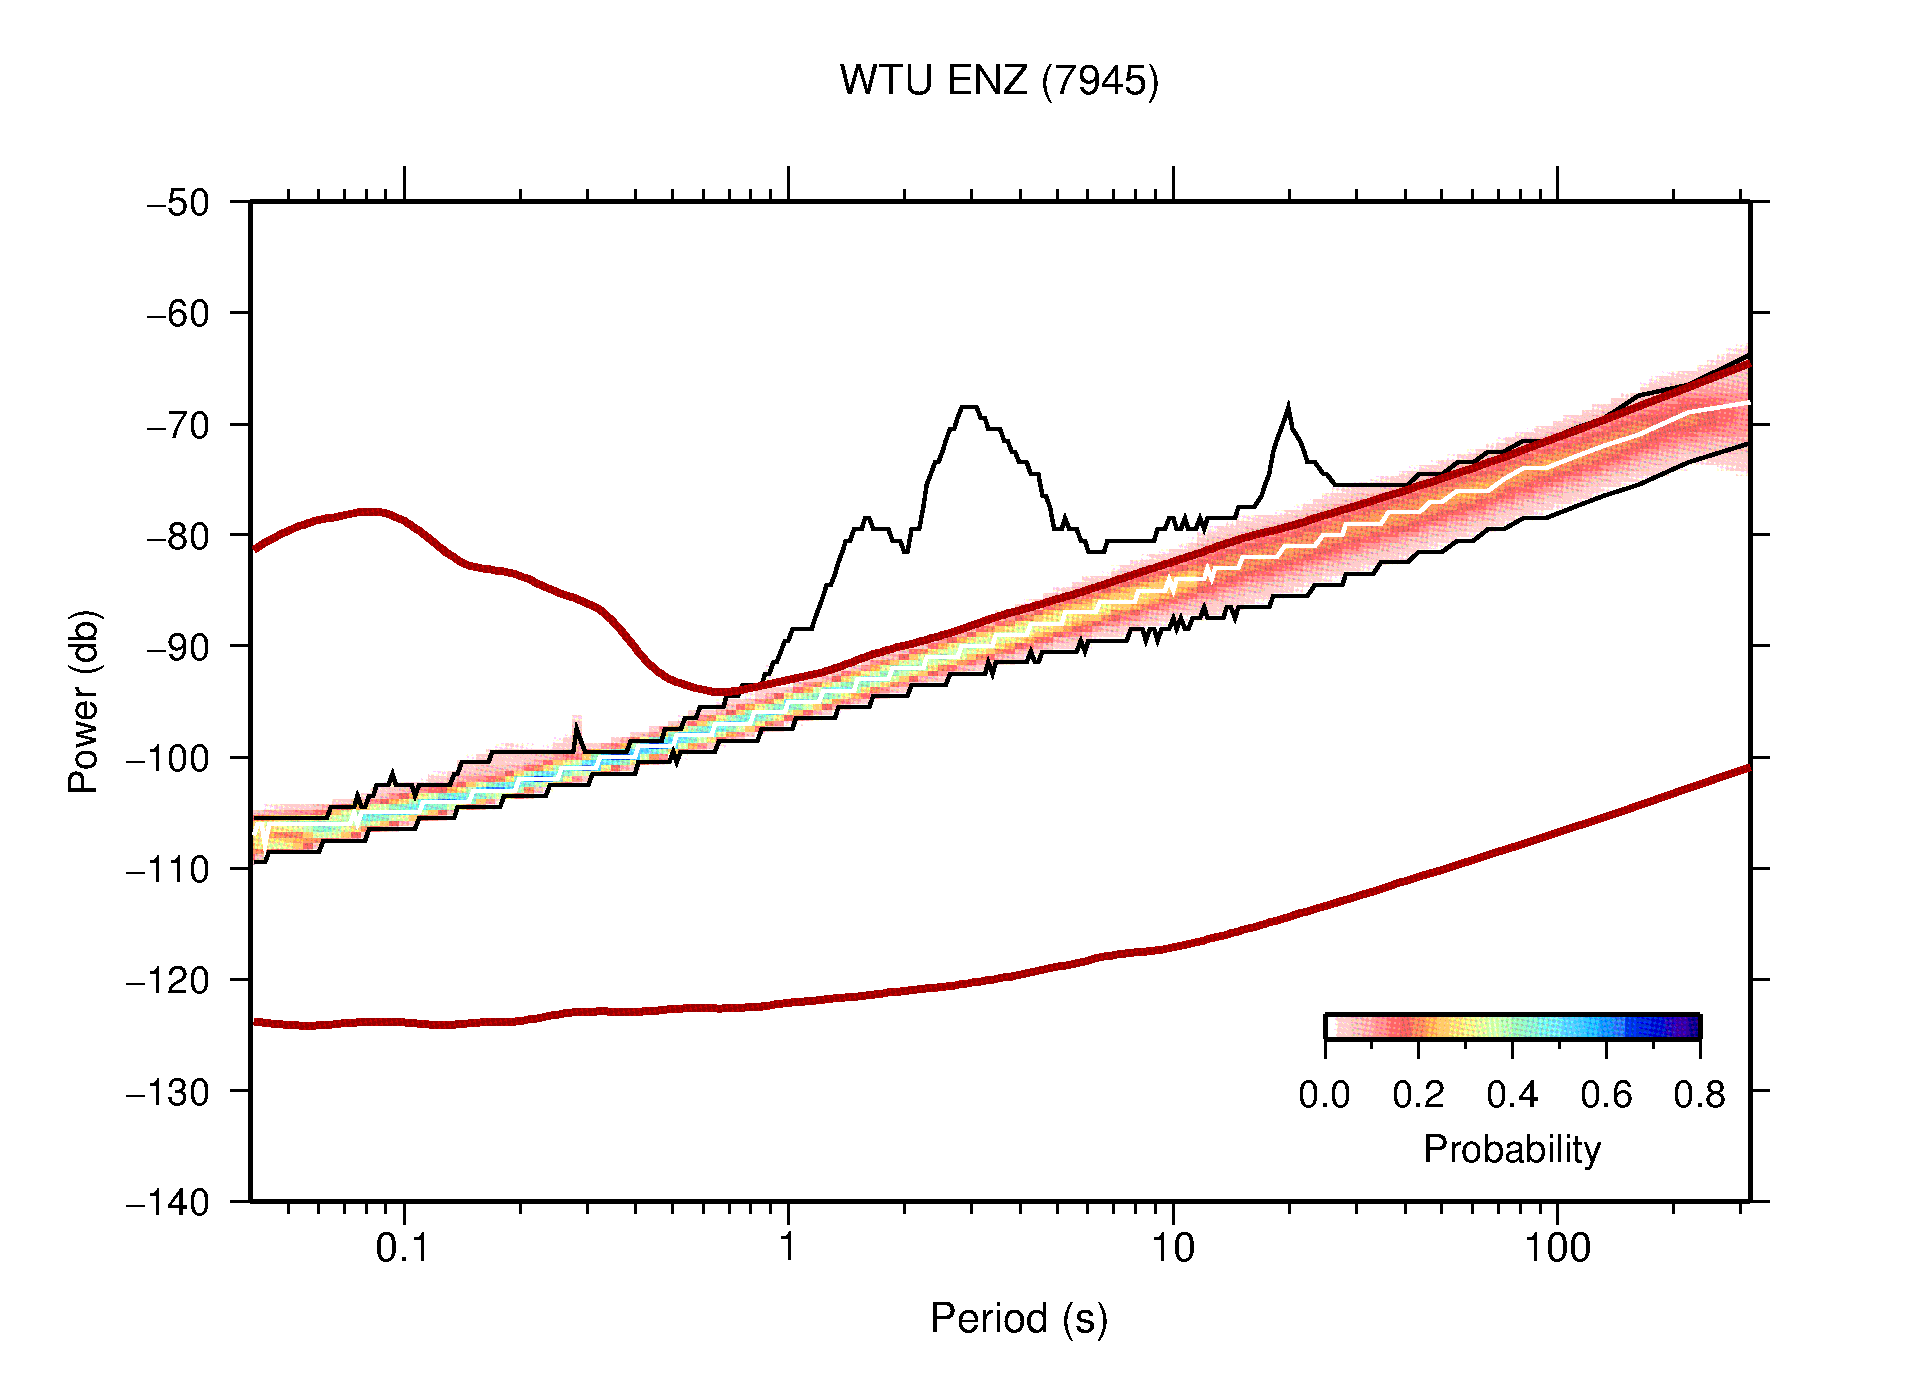
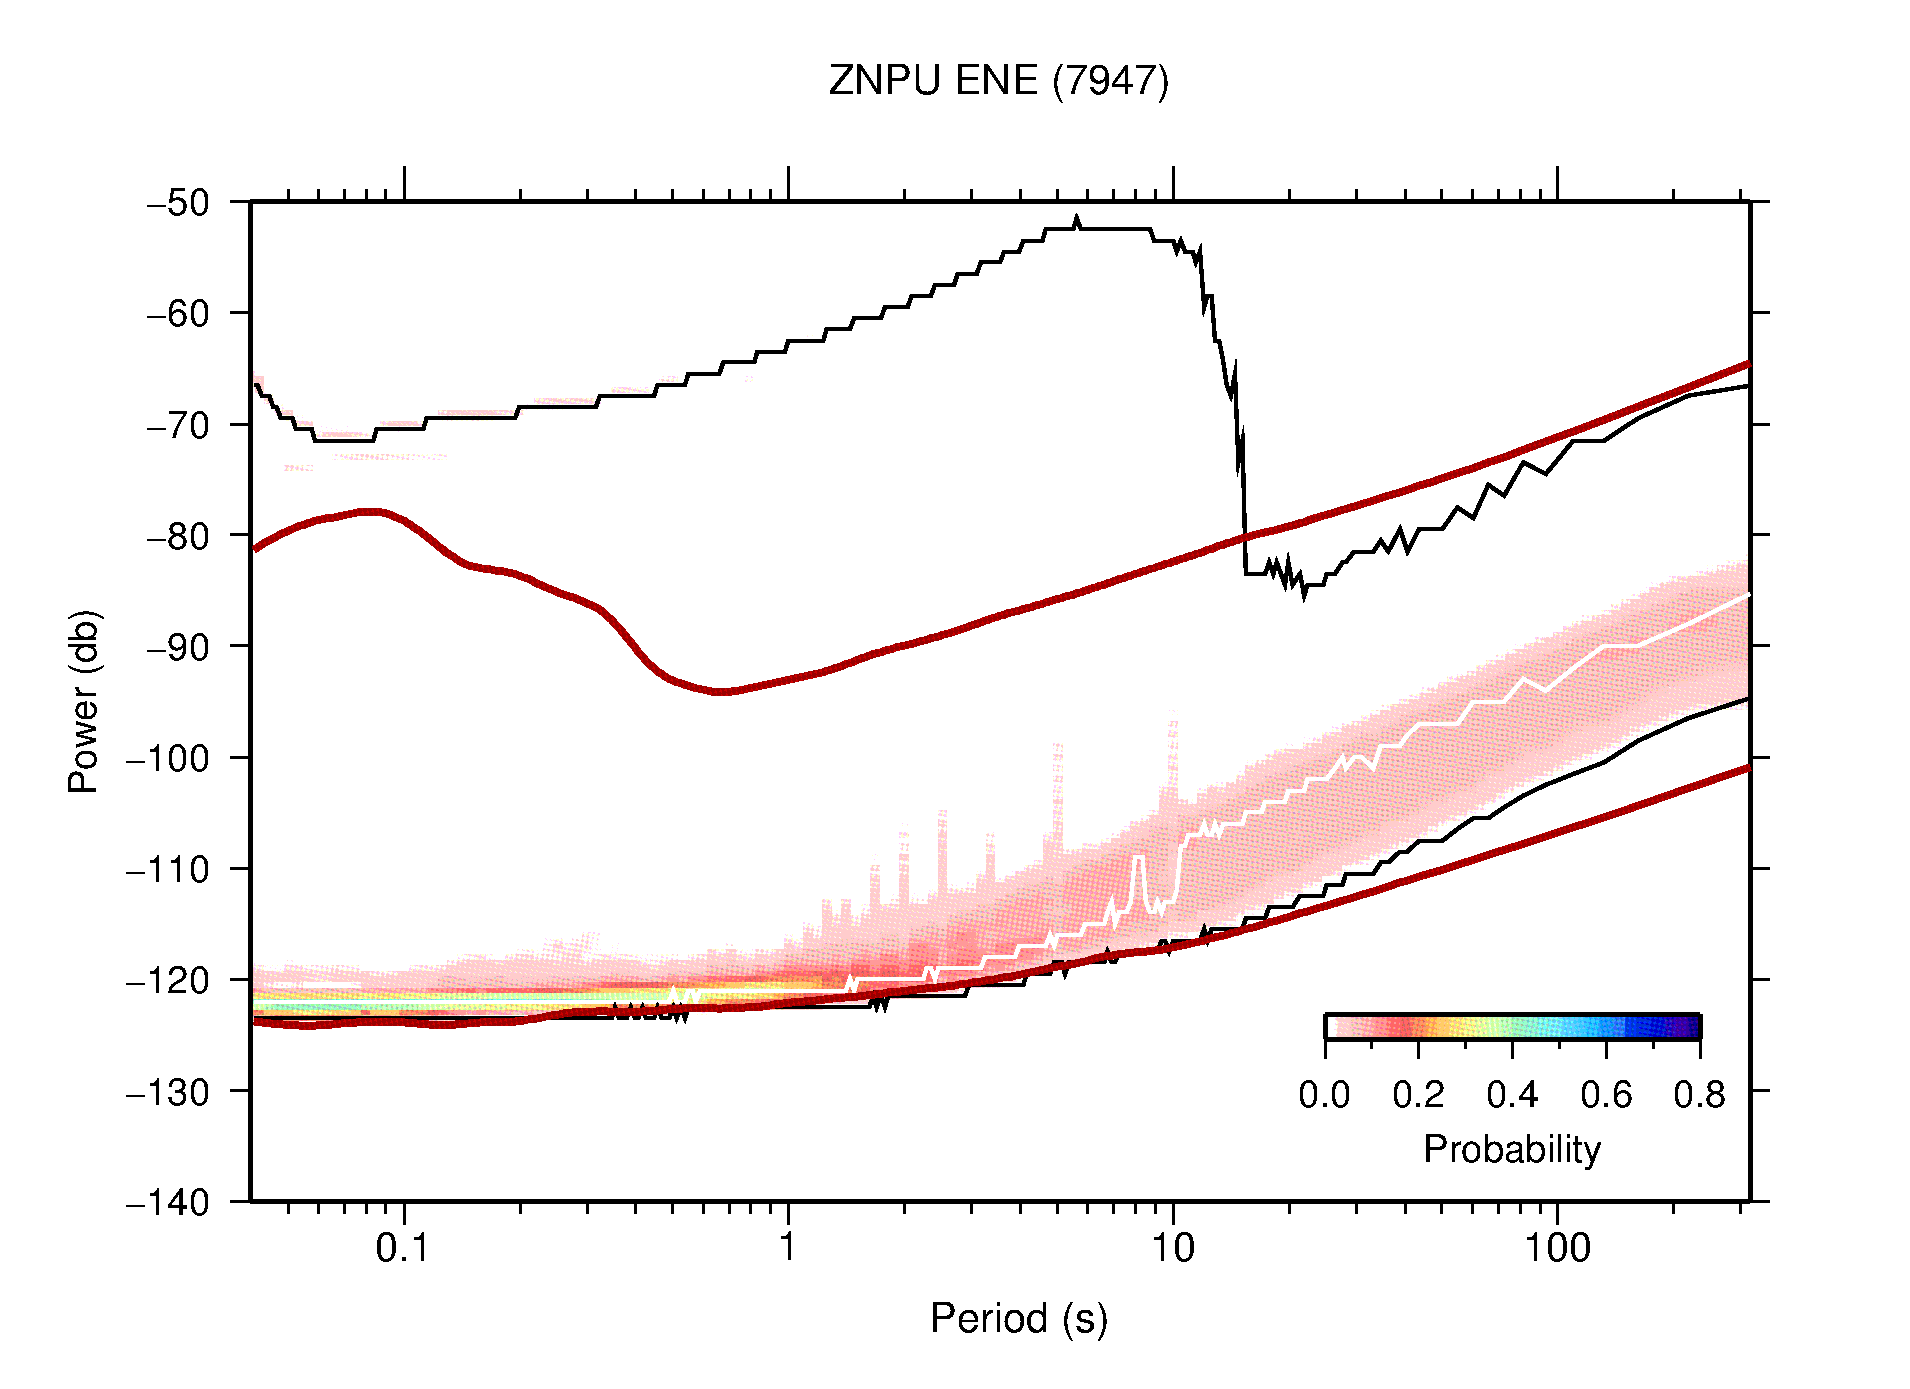
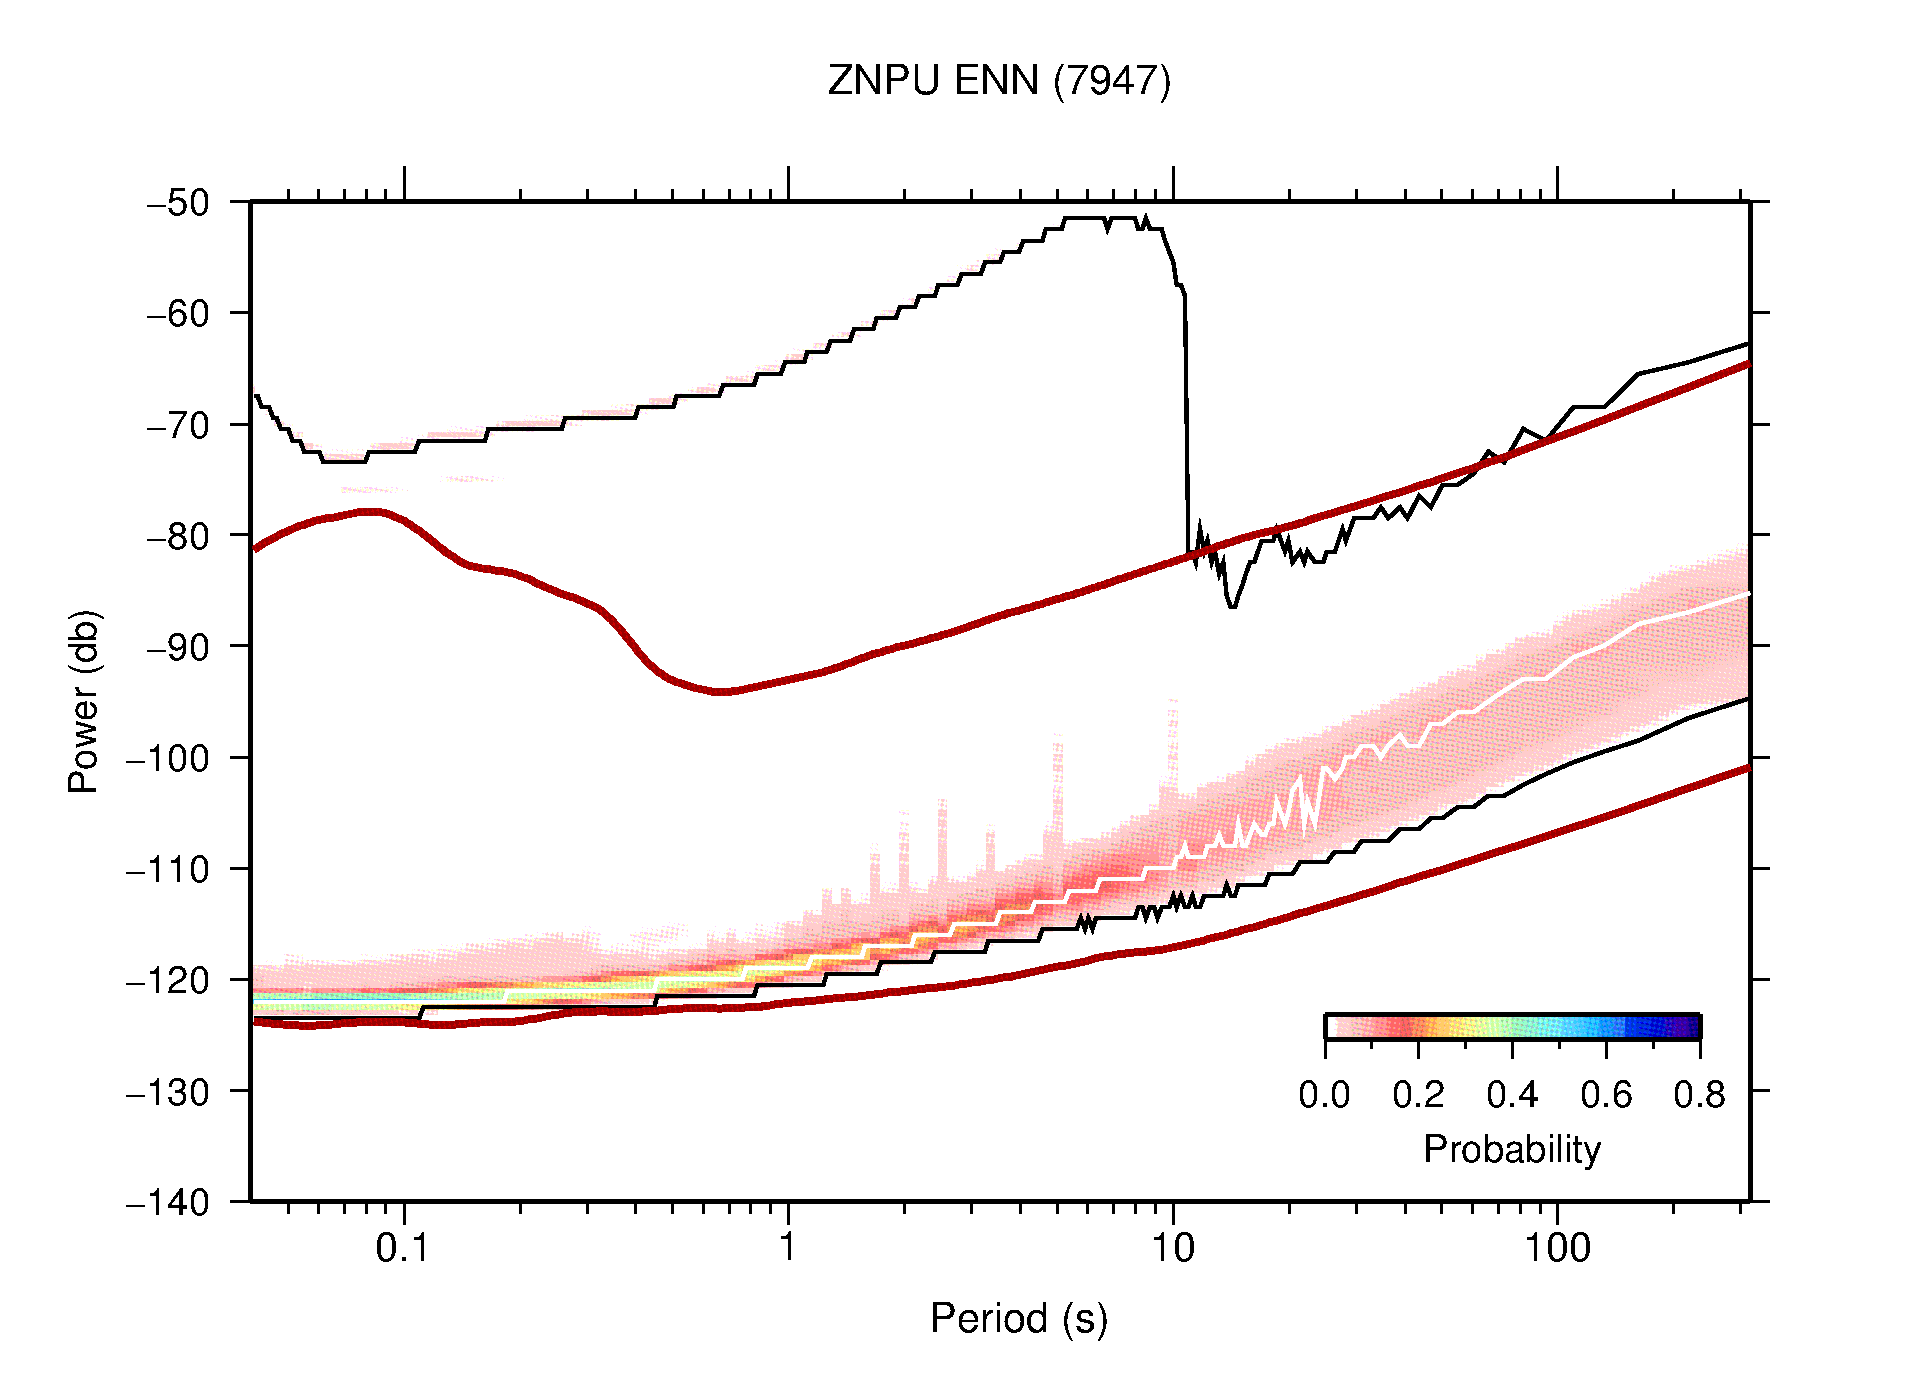
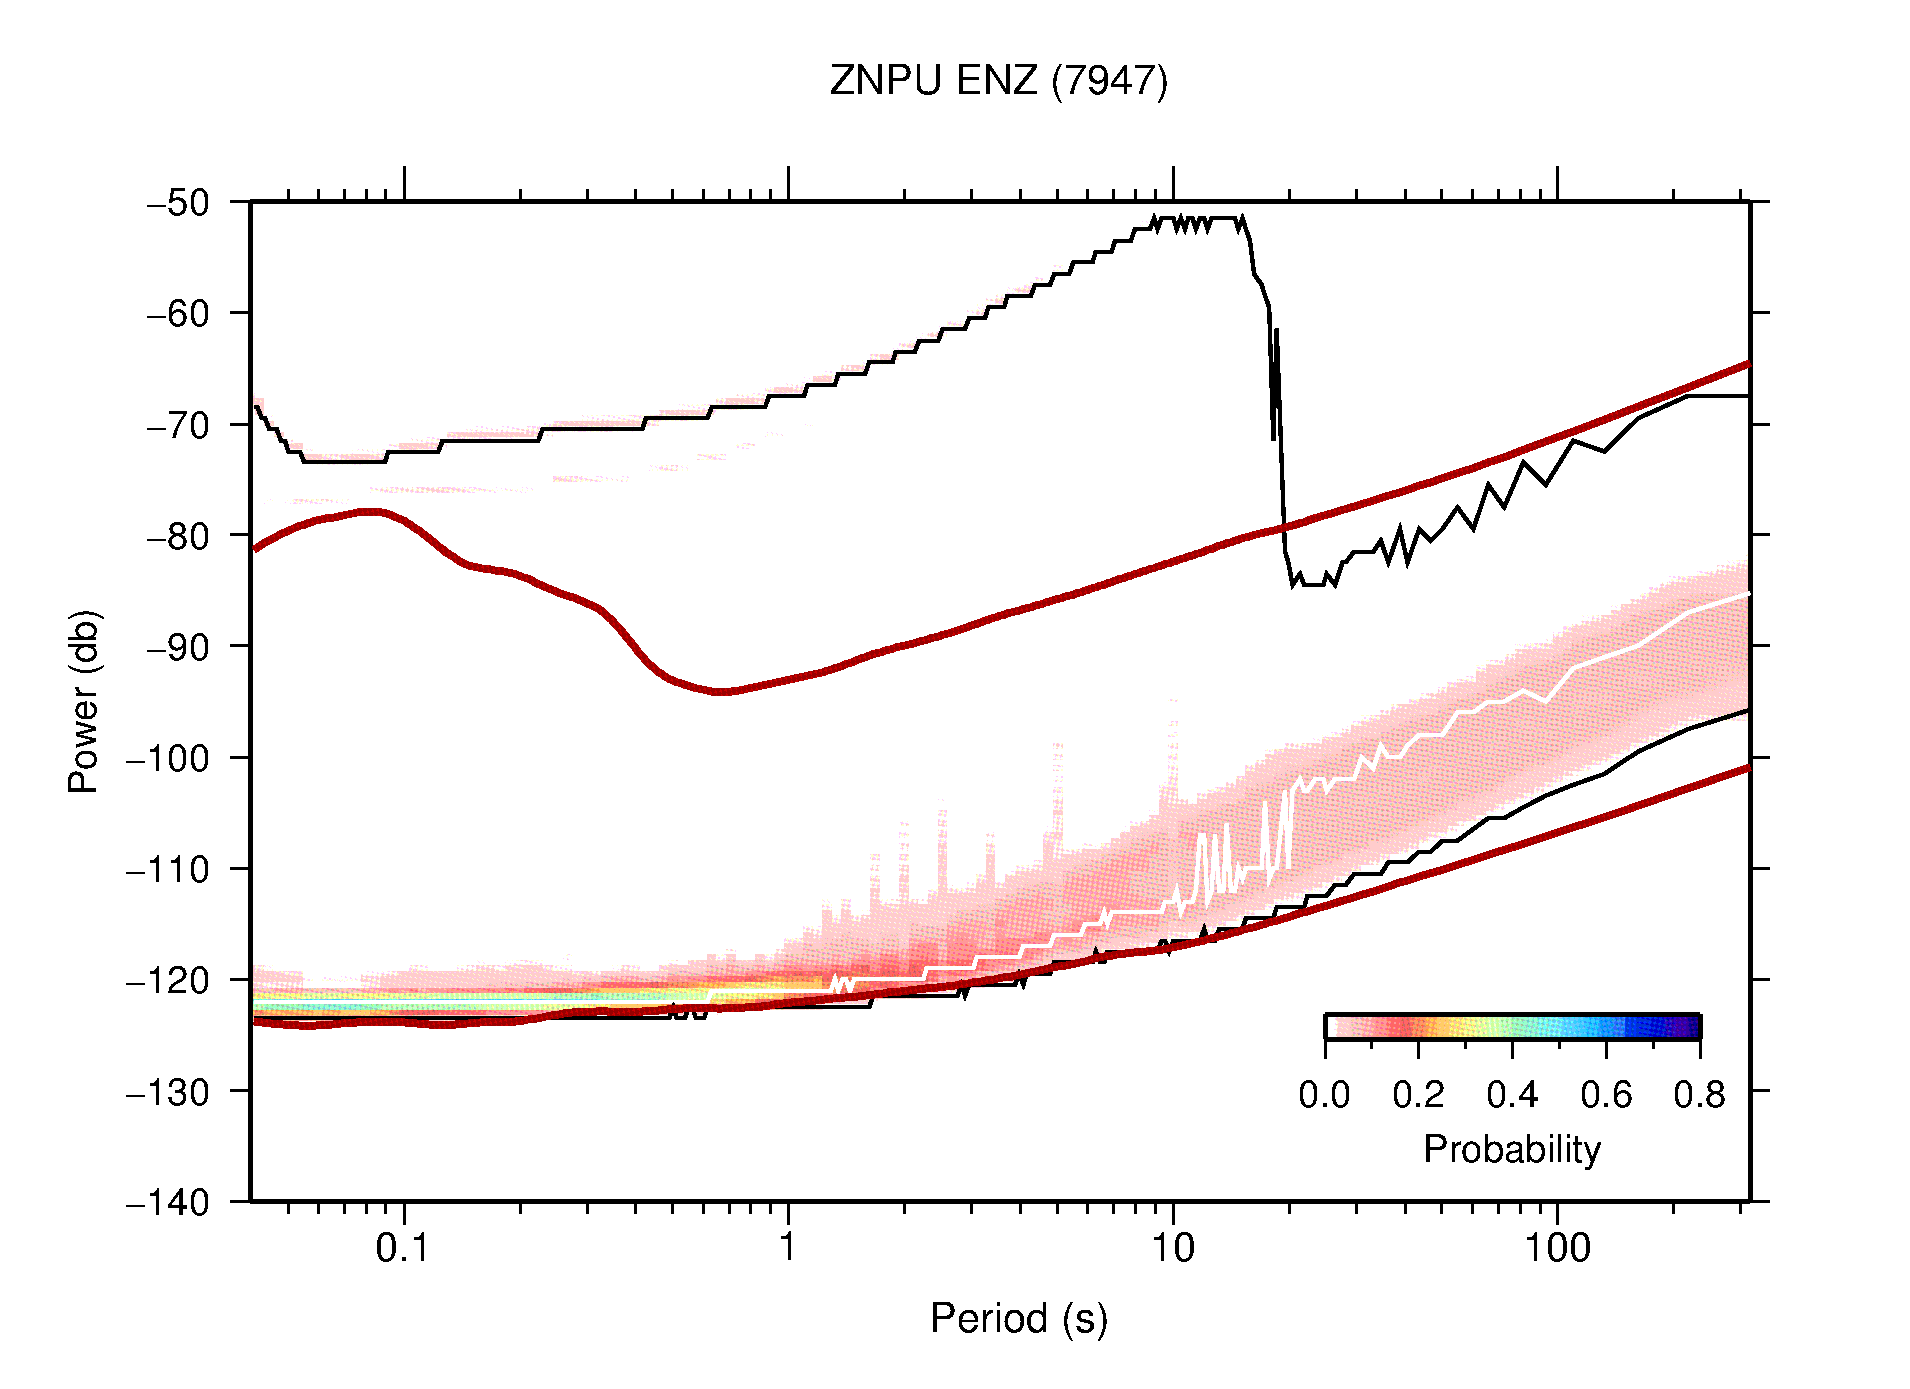
The following figures are full year PDFs for each of the 363 channels processed in this work. The same color scale is used thoughout. The black curves show 0.5 and 99.5 percentiles while the white curve shows the mode. The number of PSDs contributing to the PDF is shown in parentheses next to the station and channel names. The y-axes represent spectral acceleration amplitudes in units of db relative to 1 m/s2 [10log10(m2/s4/Hz)]. The five channels that were not included in the network PDF because of known problems were CCUT ENE,N,Z; HCSU ENE; and HER ENE.
[ Back ]