This electronic supplement contains two figures showing the results of the synthetic tests for a pure explosion and a composite source at local distances and a table of moment tensor (MT) components. The same number of stations, sources, and velocity models used in the regional tests is applied, but the source is placed between 0.01 and 1.2 km, stations at distances up to 4 km, filter passband between 0.5 and 2 s, and data are in velocity. In general, the results are comparable to the regional case but with higher variability between the different velocity models, more rapid deviations from the true moment, and decrease in variance reduction (VR). The differences are caused by short-period waves’ greater sensitivity to velocity structure and source depth. The full MT components for the three shots (production, 800, and 400) are listed in Table S1.
Table S1. Full MT elements from waveform inversion.
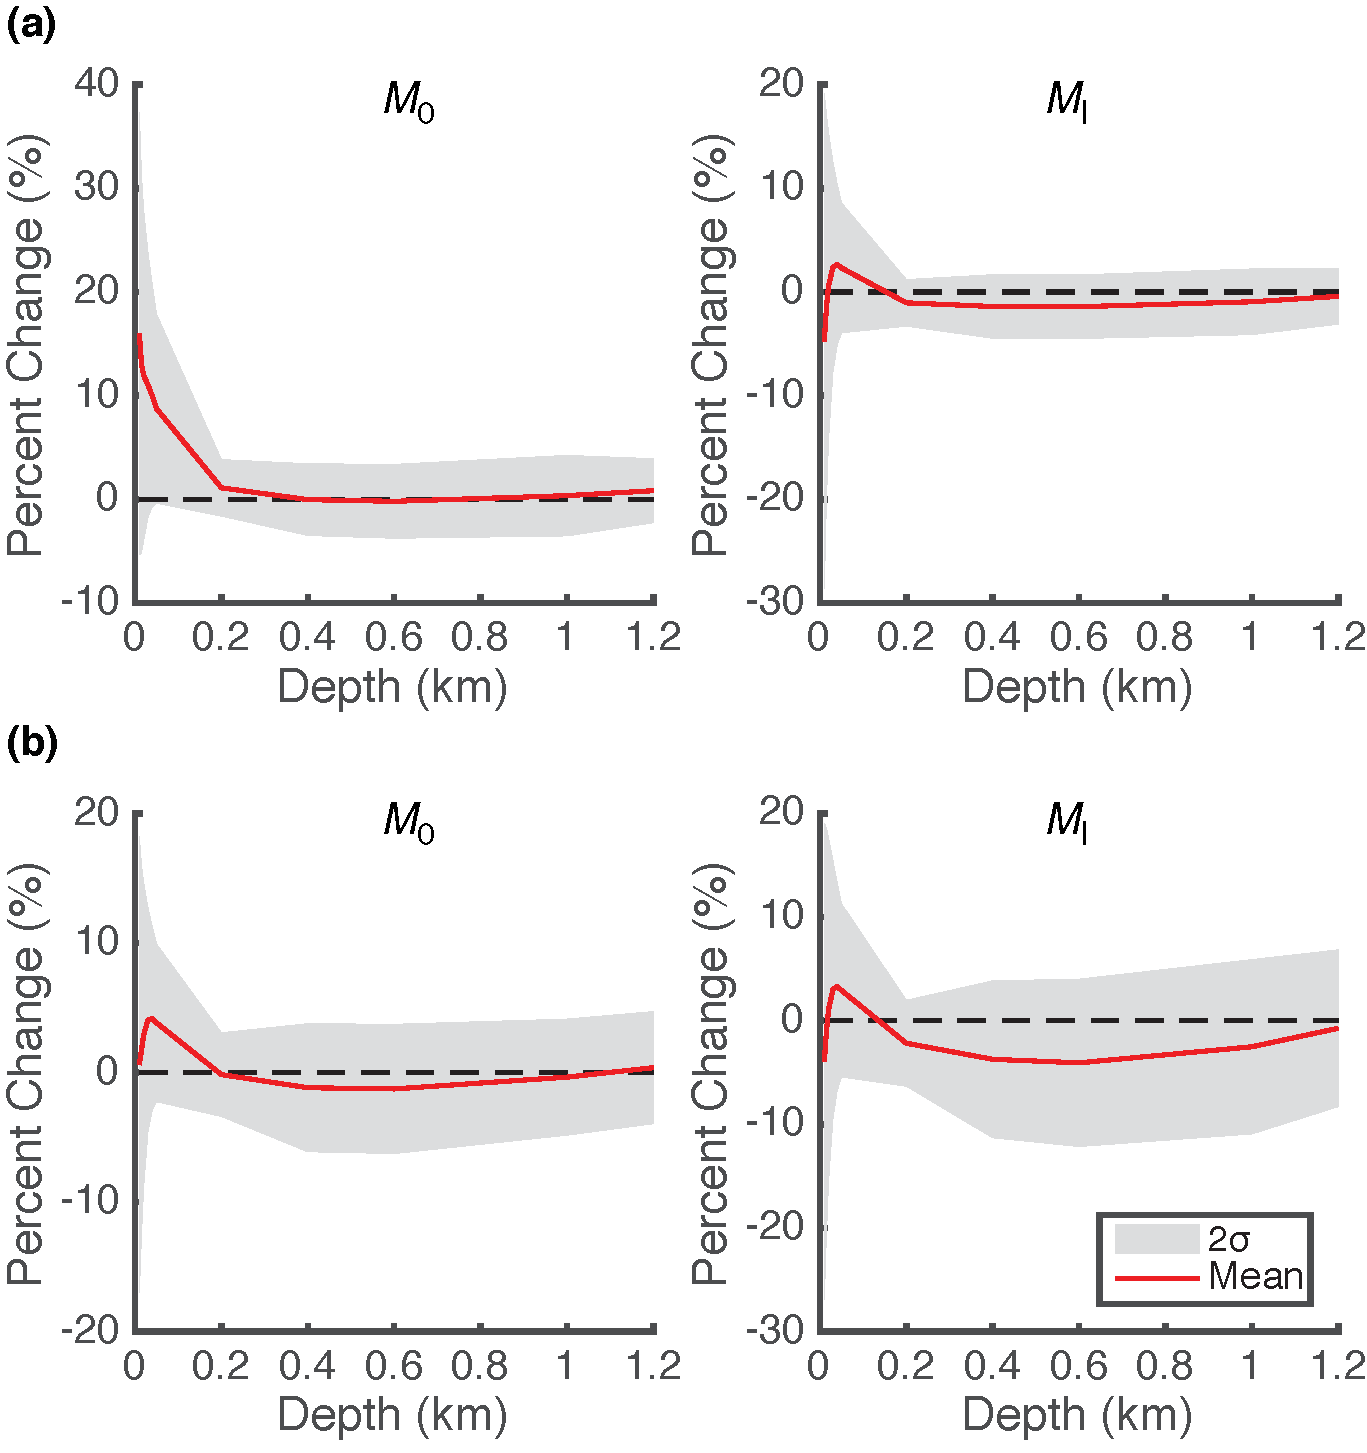
Figure S1. Isotropic moment (MI) and total seismic moment (M0) percent change for (a) a pure explosion source and (b) a composite explosion plus double-couple source plotted as functions of source depth. The average value of all 59 models is the solid line; the shaded region is 2σ from the mean; and the dashed line represents no deviation from the input seismic moments.
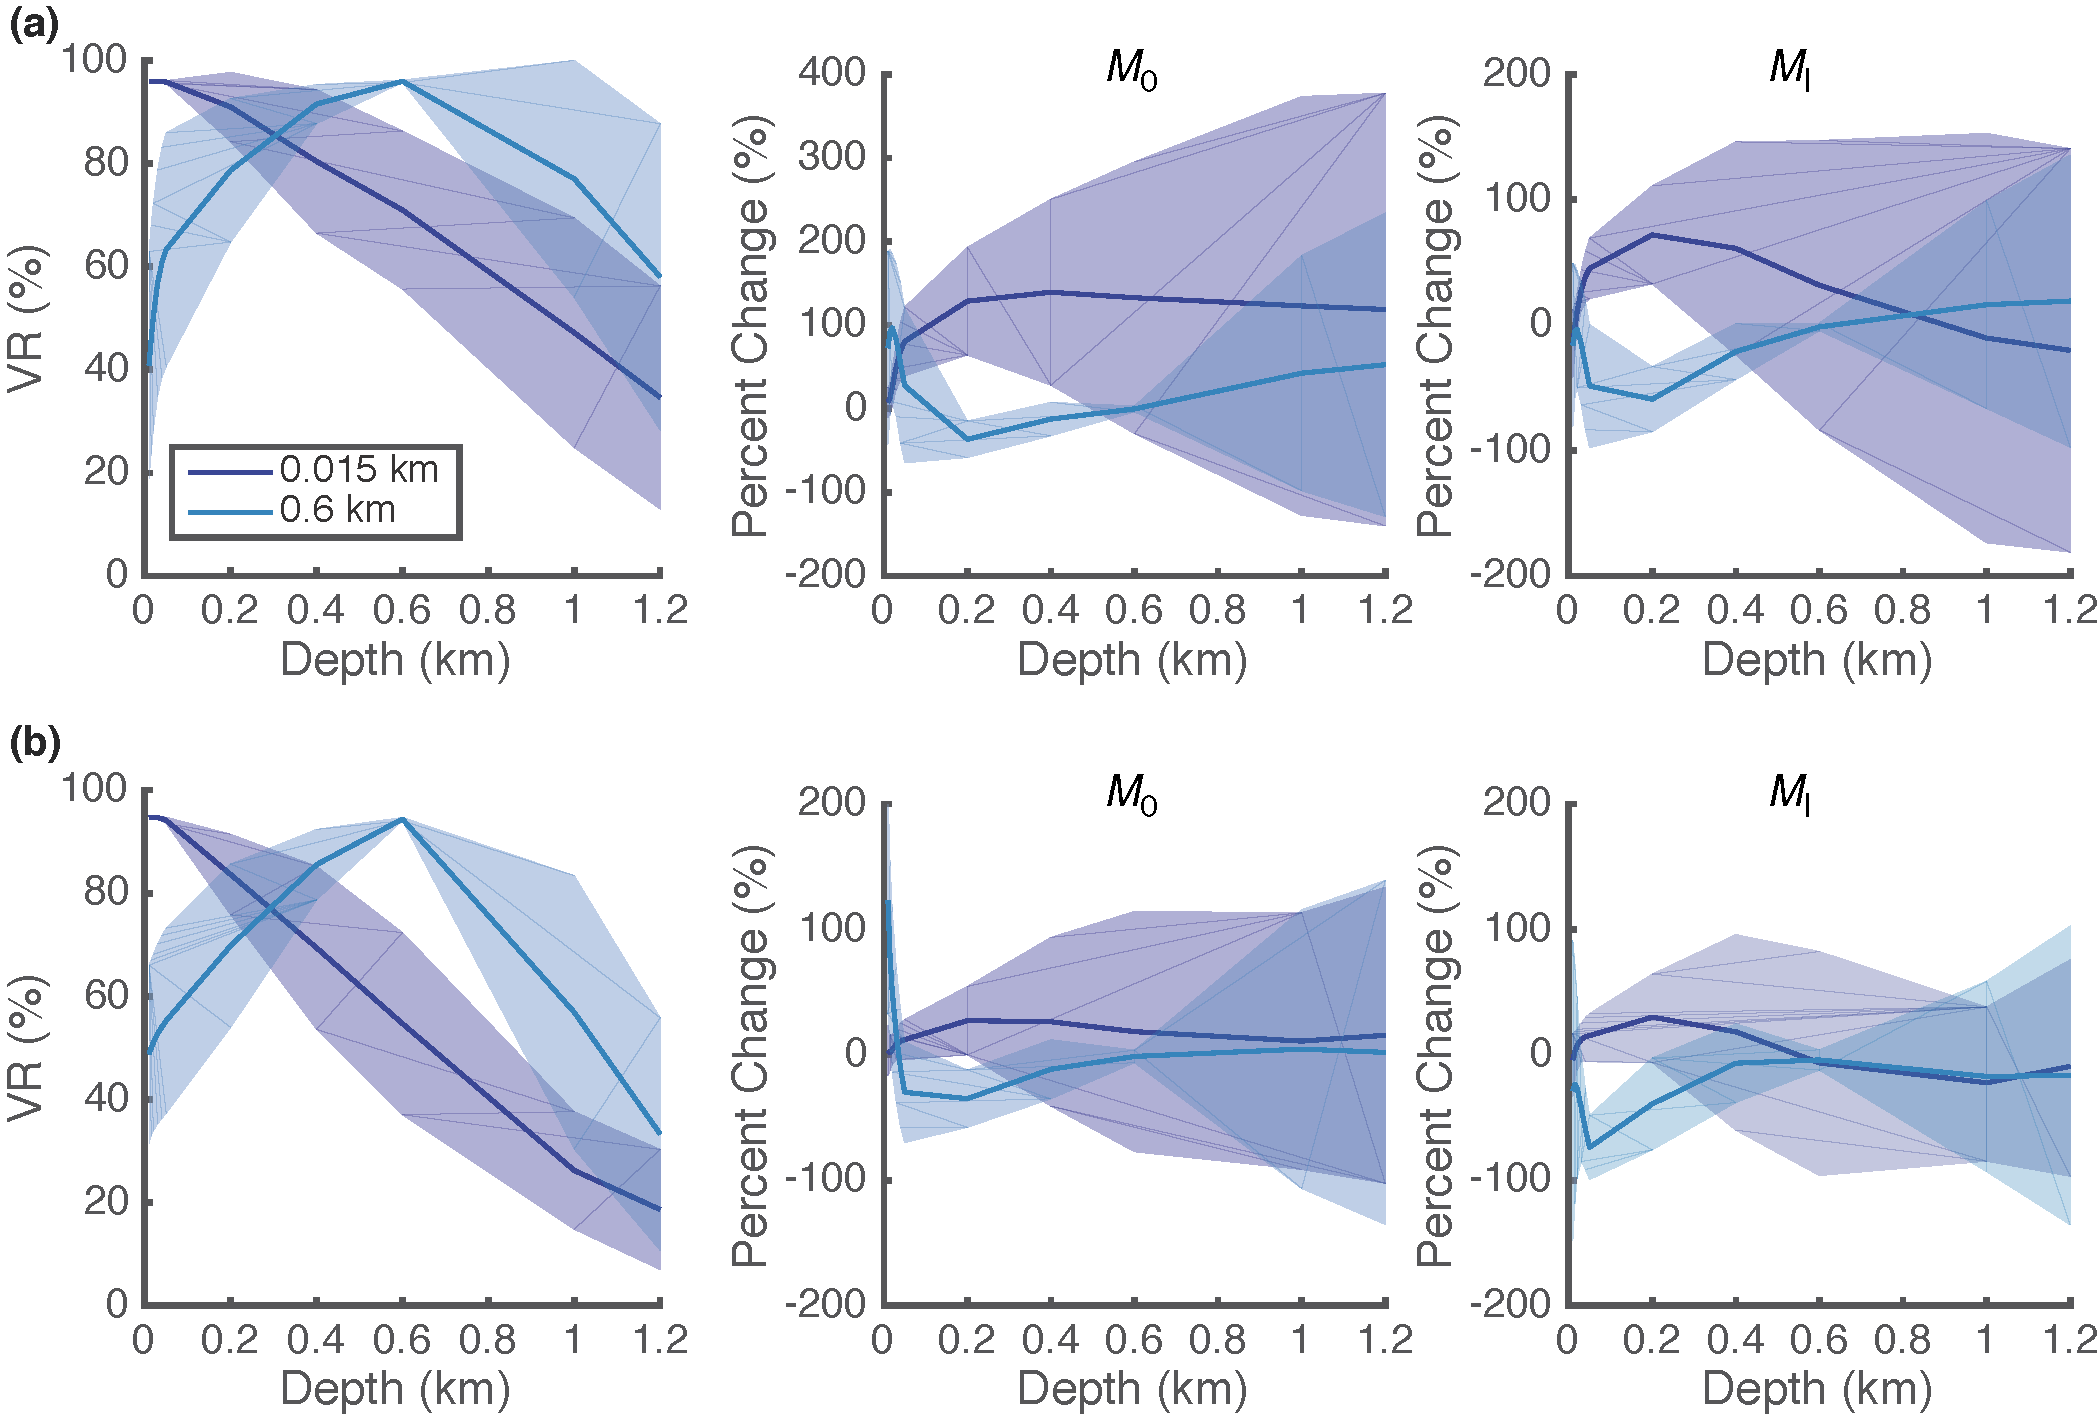
Figure S2. Source-depth sensitivity analysis in which source depth is fixed, whereas the full suite of Green’s function depths (x axis) is tested. Comparisons of VR, total moment (M0) percent change, and isotropic moment (MI) percent change as a function of varying Green’s function depth are shown for (a) a pure explosion source and (b) a composite source. The solid lines are the average values of all 59 models, and the shaded regions are 2σ from the mean.
[ Back ]