This electronic supplement contains figures showing the fits between observed and simulated data. Figures S1–S4 show the comparison between the accelerograms and acceleration response spectra of 5% damping of the 2007 Tocopilla and 2014 Iquique Chilean earthquakes not included in the main article. Figure S5 shows the residual between the observed and simulated maximum amplitude of acceleration response spectra of 5% damping in function of the period. Figures S6 and S7 show the peak ground acceleration (PGA) and peak ground velocity (PGV) of simulated and observed data in function of the distance. Figures S8 and S9 show the simulated strong-motion records considering the traditional method for Tocopilla and Iquique earthquakes. Figure 10 shows the goodness of fit (GOF) of traditional method, and Figure S11 shows the comparison of the model bias for both methods.
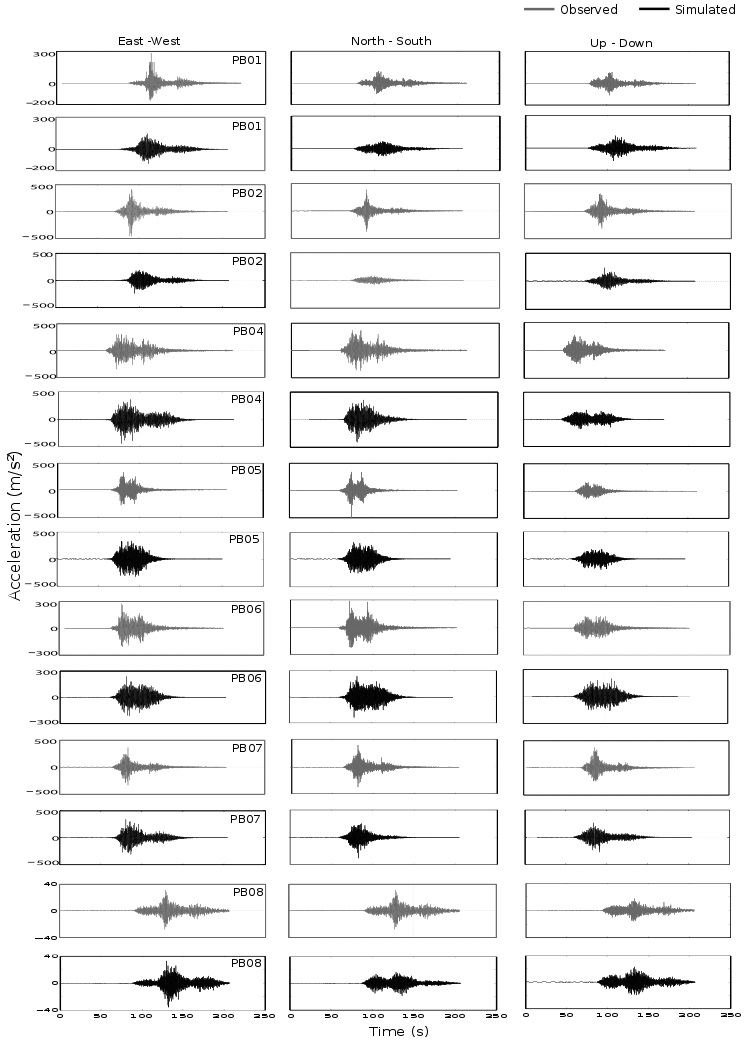
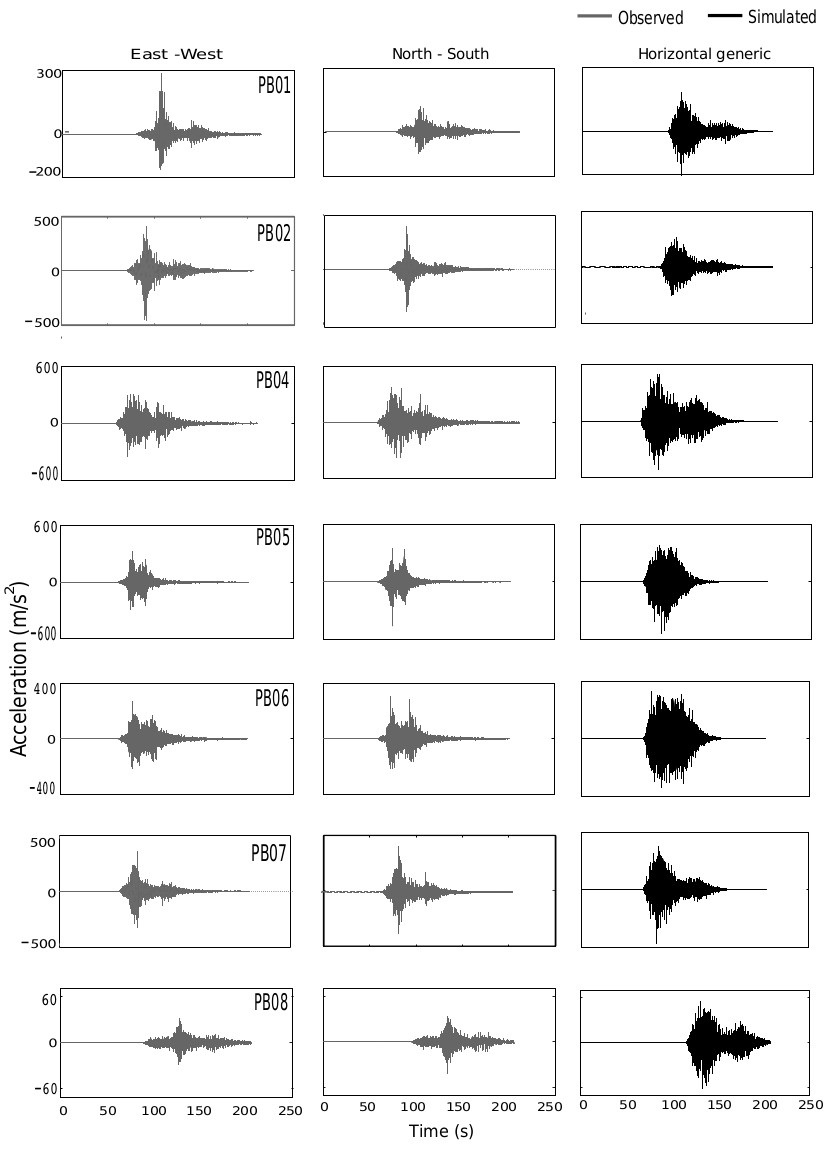
Figure S1. Simulated and observed accelerograms for the 2007 Tocopilla earthquake, which are not shown in the Simulated Accelerograms of the 2007 Tocopilla and 2014 Iquique Earthquakes section of the main article.
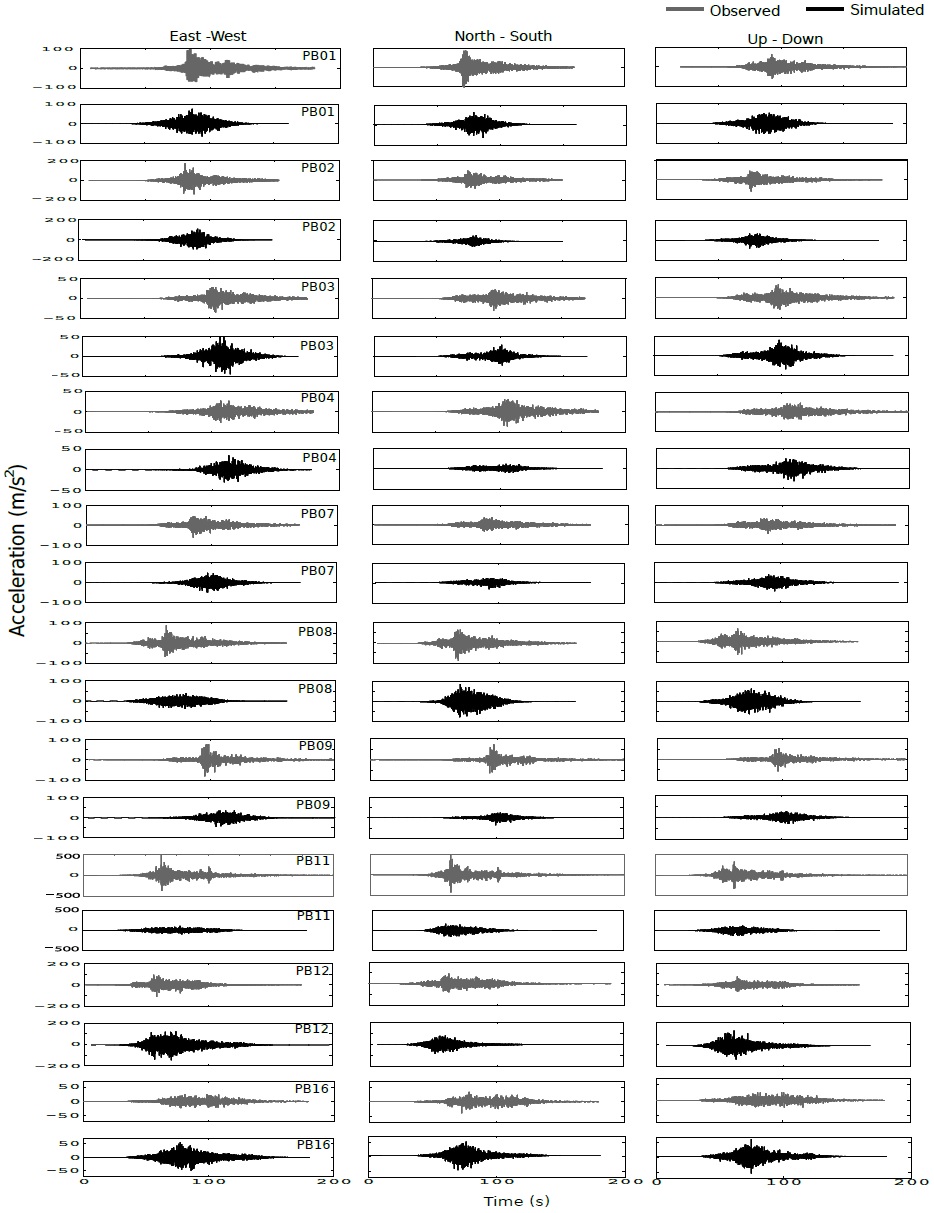
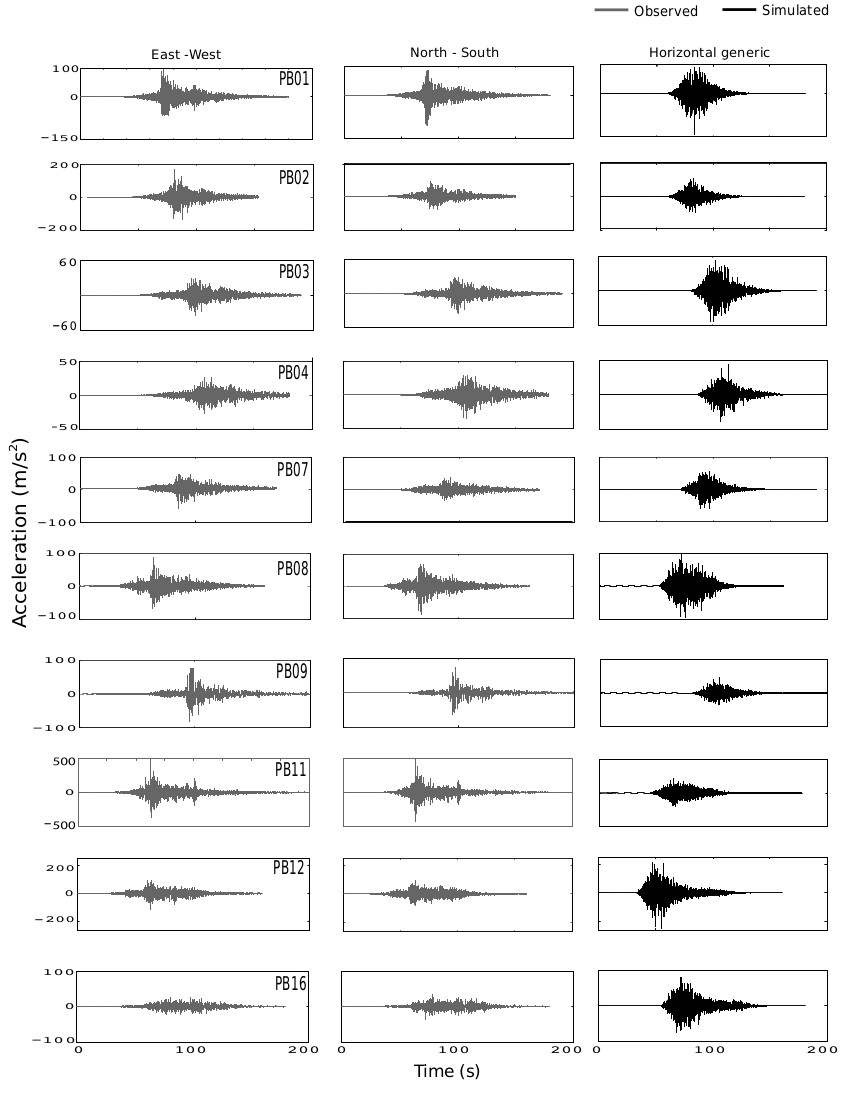
Figure S2. Simulated and observed accelerograms for the 2014 Iquique earthquake, which are not shown in the Simulated Accelerograms of the 2007 Tocopilla and 2014 Iquique Earthquakes section of the main article.
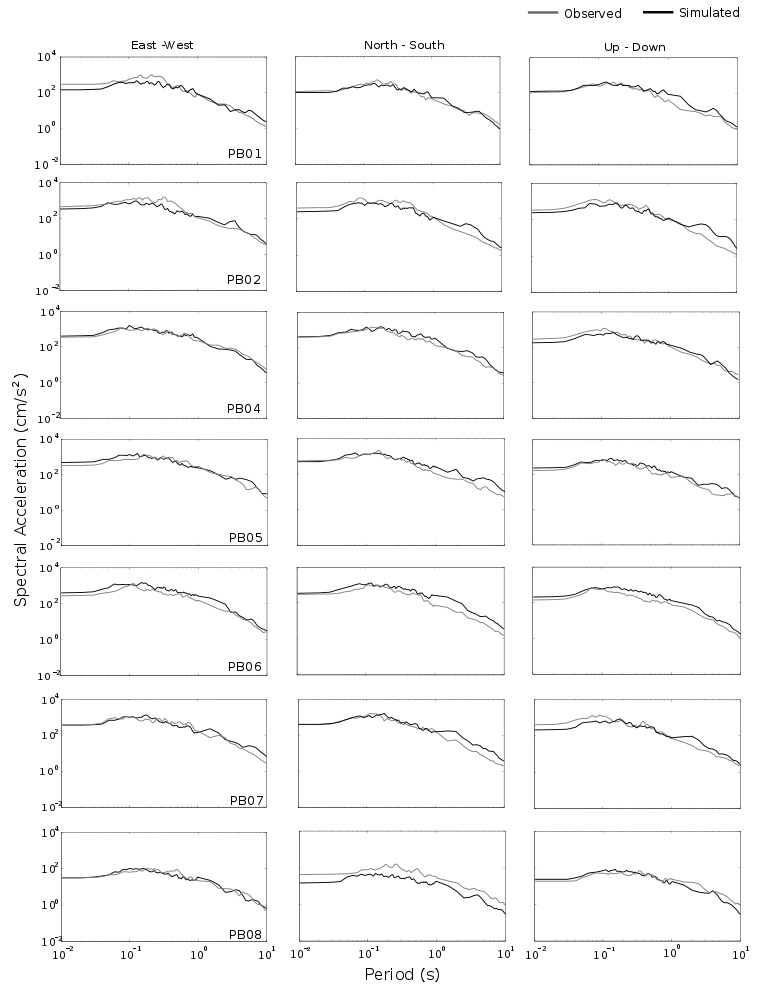
Figure S3. Simulated and observed acceleration response spectra for 5% damping of the 2007 Tocopilla earthquake, which are not shown in the Simulated Accelerograms of the 2007 Tocopilla and 2014 Iquique Earthquakes section of the main article.
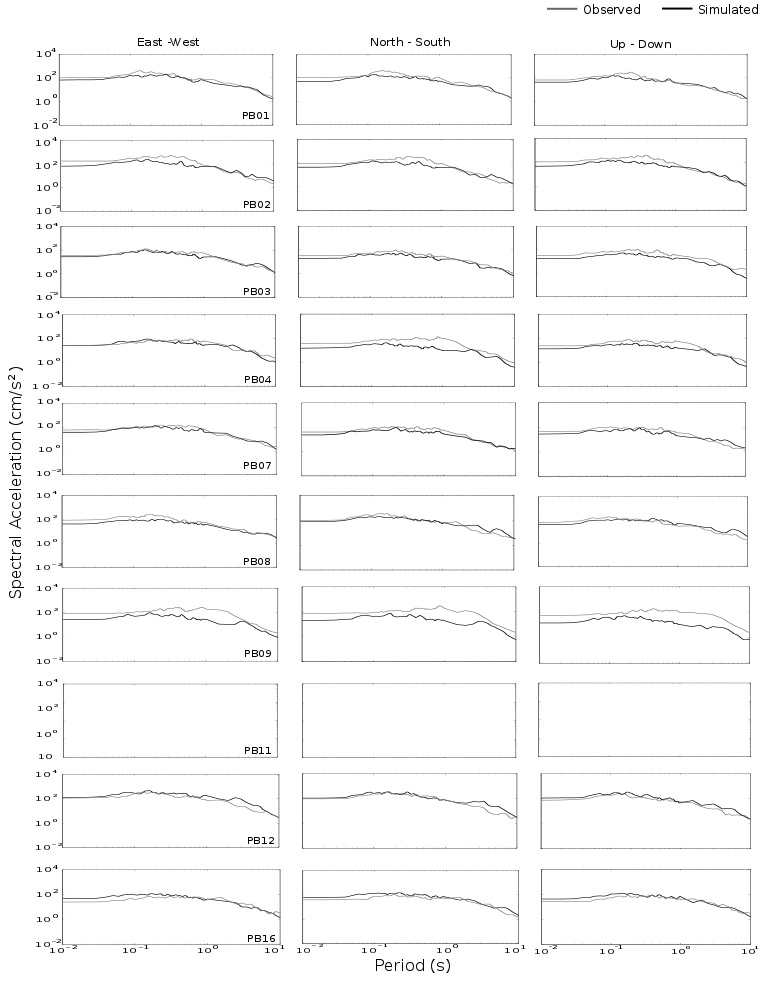
Figure S4. Simulated and observed acceleration response spectra for 5% damping of the 2014 Iquique earthquake, which are not shown in the Simulated Accelerograms of the 2007 Tocopilla and 2014 Iquique Earthquakes section of the main article.
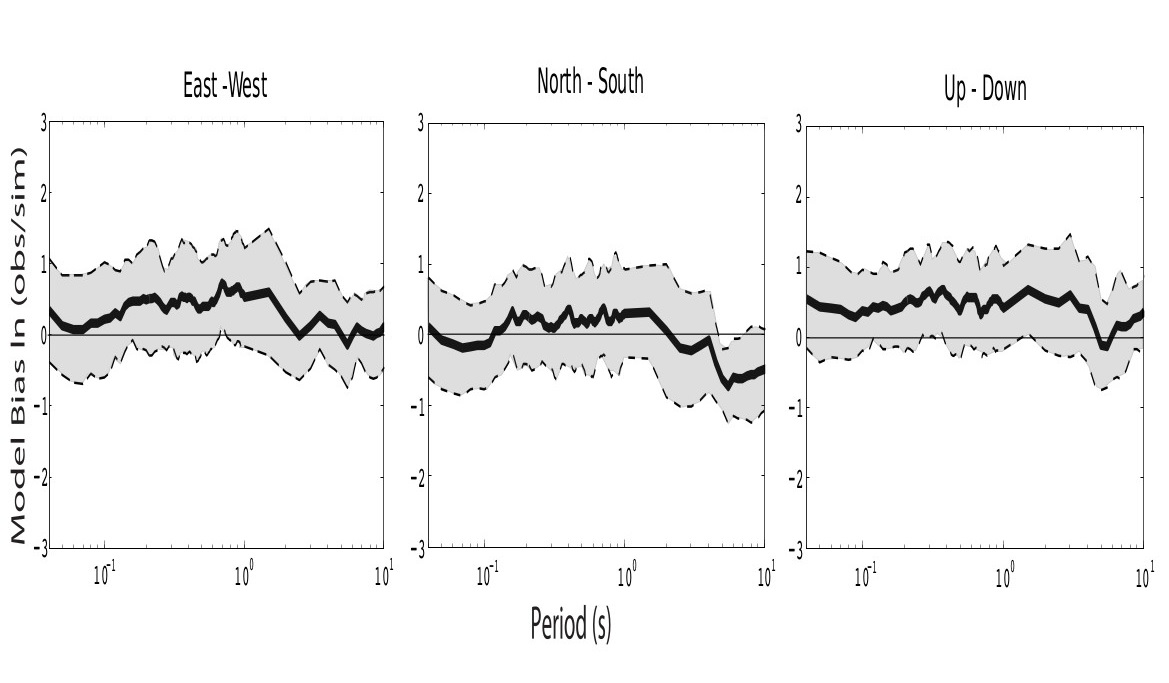
Figure S5. The GOFs between observed and simulated acceleration response spectra of 5% damping for the 2014 Iquique earthquake, incorporating the PB09 and PB11 records.
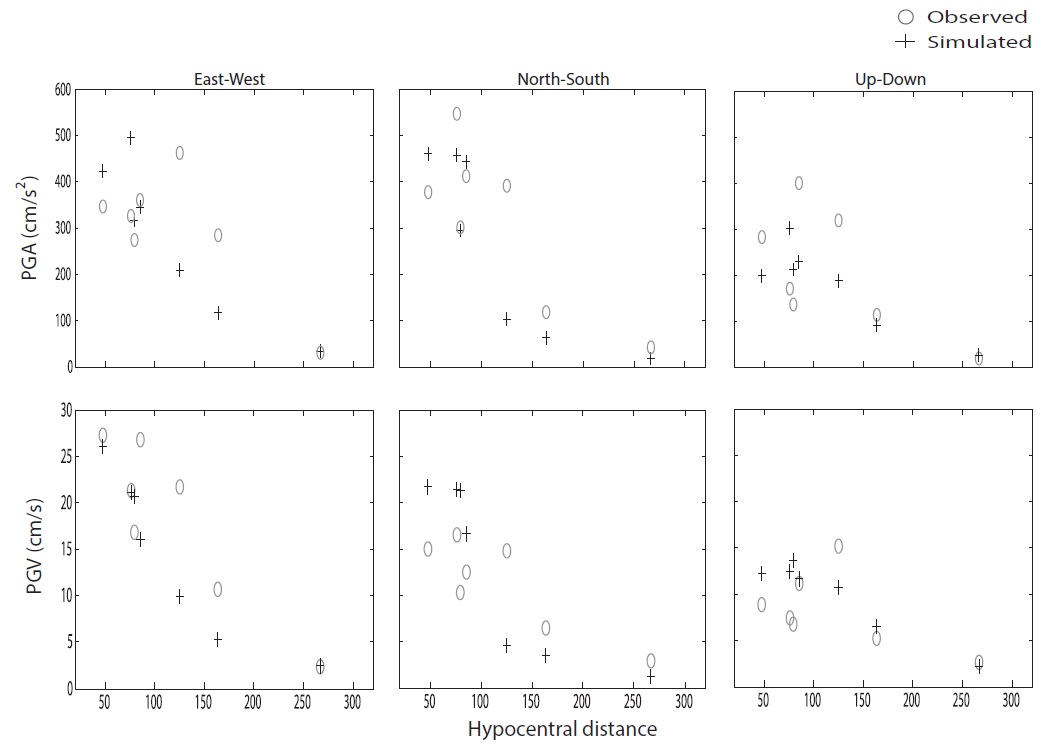
Figure S6. Comparison of observed and simulated PGA and PGV for the 2007 Tocopilla earthquake.
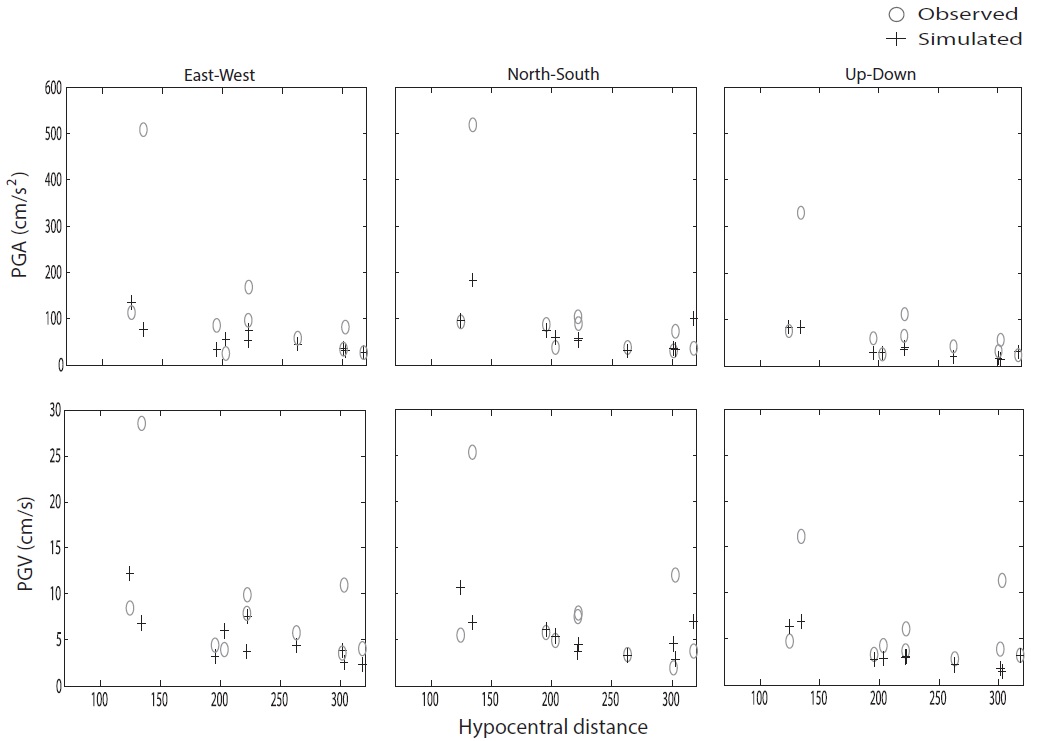
Figure S7. Comparison of observed and simulated PGA and PGV of the 2014 Iquique earthquake.
Figure S8. Simulated and observed accelerograms for the 2007 Tocopilla earthquake consider the traditional method.
Figure S9. Simulated and observed accelerograms for the 2014 Iquique earthquake consider the traditional method.
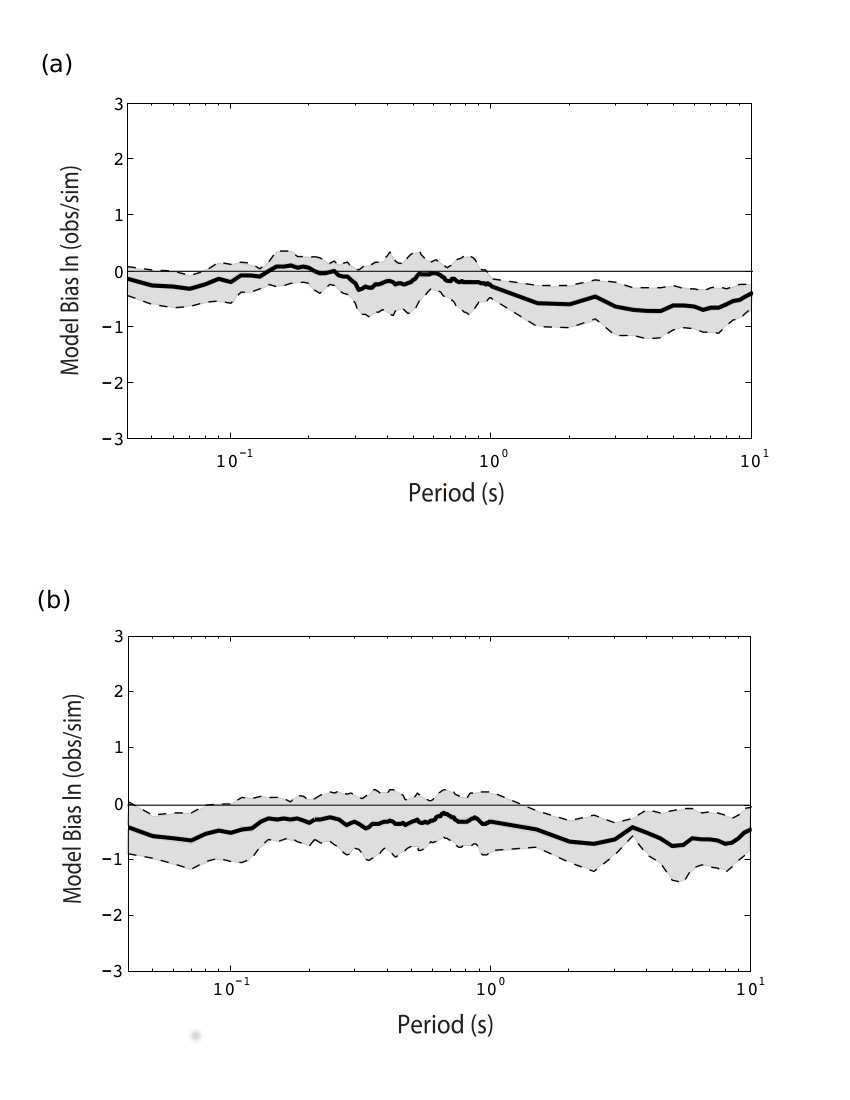
Figure S10. The GOFs between observed and simulated acceleration response spectra of 5% damping for (a) the 2007 Tocopilla earthquake and (b) the 2014 Iquique earthquake. The heavy line shows the bias and the shaded region shows the standard error.
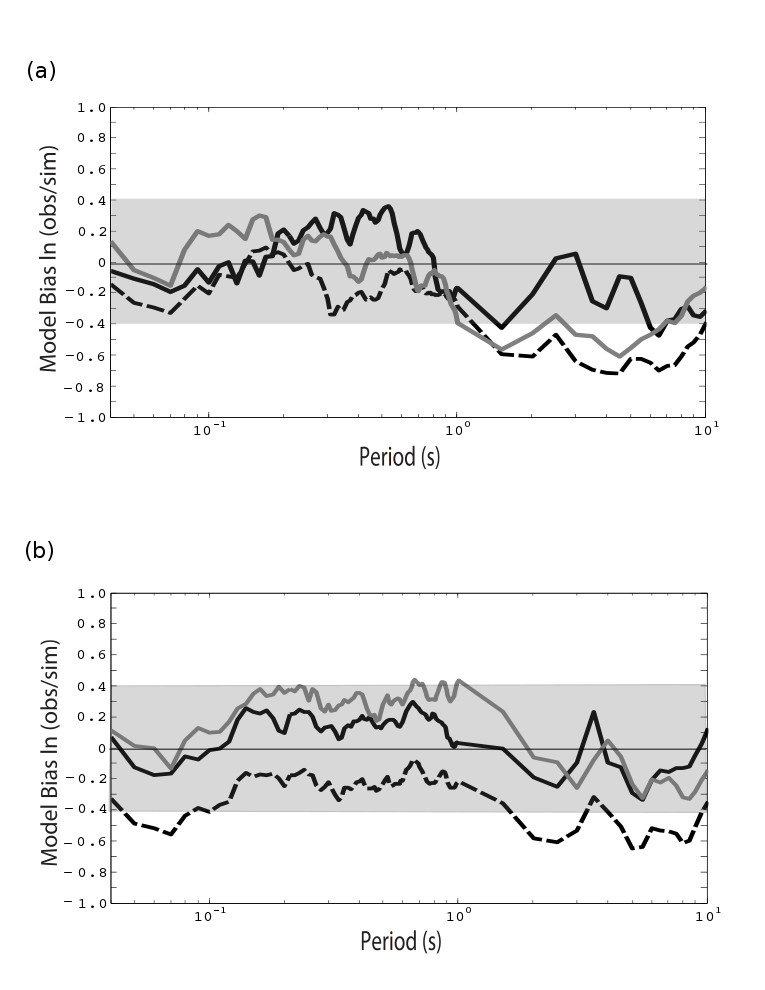
Figure S11. Comparison of spectral acceleration modeling bias from the horizontal components of proposed and traditional methodology. (a) The 2007 Tocopilla earthquake and (b) the 2014 Iquique earthquake. The black and gray solid lines show the bias for the east–west and north–south components using the proposed methodology. The black dashed line shows the bias for the average horizontal components using the traditional method. Shaded region represents range of ±40% about zero bias.
[ Back ]