This electronic supplement contains four figures and three tables. Figure S1 shows the comparison of earthquake relocations between different distance thresholds for an event pair. Figure S2 shows two grouped profiles based on Figure 6 of the main article to show the generous features of two seismicity clusters along the St. Lawrence River. Figure S3 shows the Natural Resources Canada (NRCan) reported catalog locations in 3-km interval profiles. Figure S4 shows the seismic activity on a larger area. The three tables list the details of NRCan-reported catalog (Table S1), relocated catalog (Table S3), and the parameters we applied in double-difference hypocenter relocation (hypoDD) inversion (Table S2).
Table S1 [Plain text comma-separated values; ~82 KB]. NRCan catalog. 1639 reported earthquakes with the MN 0.2–5.4 magnitude range that occurred in the Charlevoix seismic zone (CSZ; 71°–69° W, 47°–48° N) between January 1988 and October 2010.
Table S2. Parameters applied during the hypoDD inversion. Niter indicates number of iterations; max residual time, residual threshold in seconds for cross, catalog data; max distance, maximum distance (km) between cross, catalog linked pairs; damp, damping for least-squares method (LSQR); CT, time differences based on manually picking phases; CC, time differences based on cross correlation.
Table S3 [Plain text comma-separated values; ~66 KB] Relocated catalog. 1242 earthquakes that have been relocated in this study.
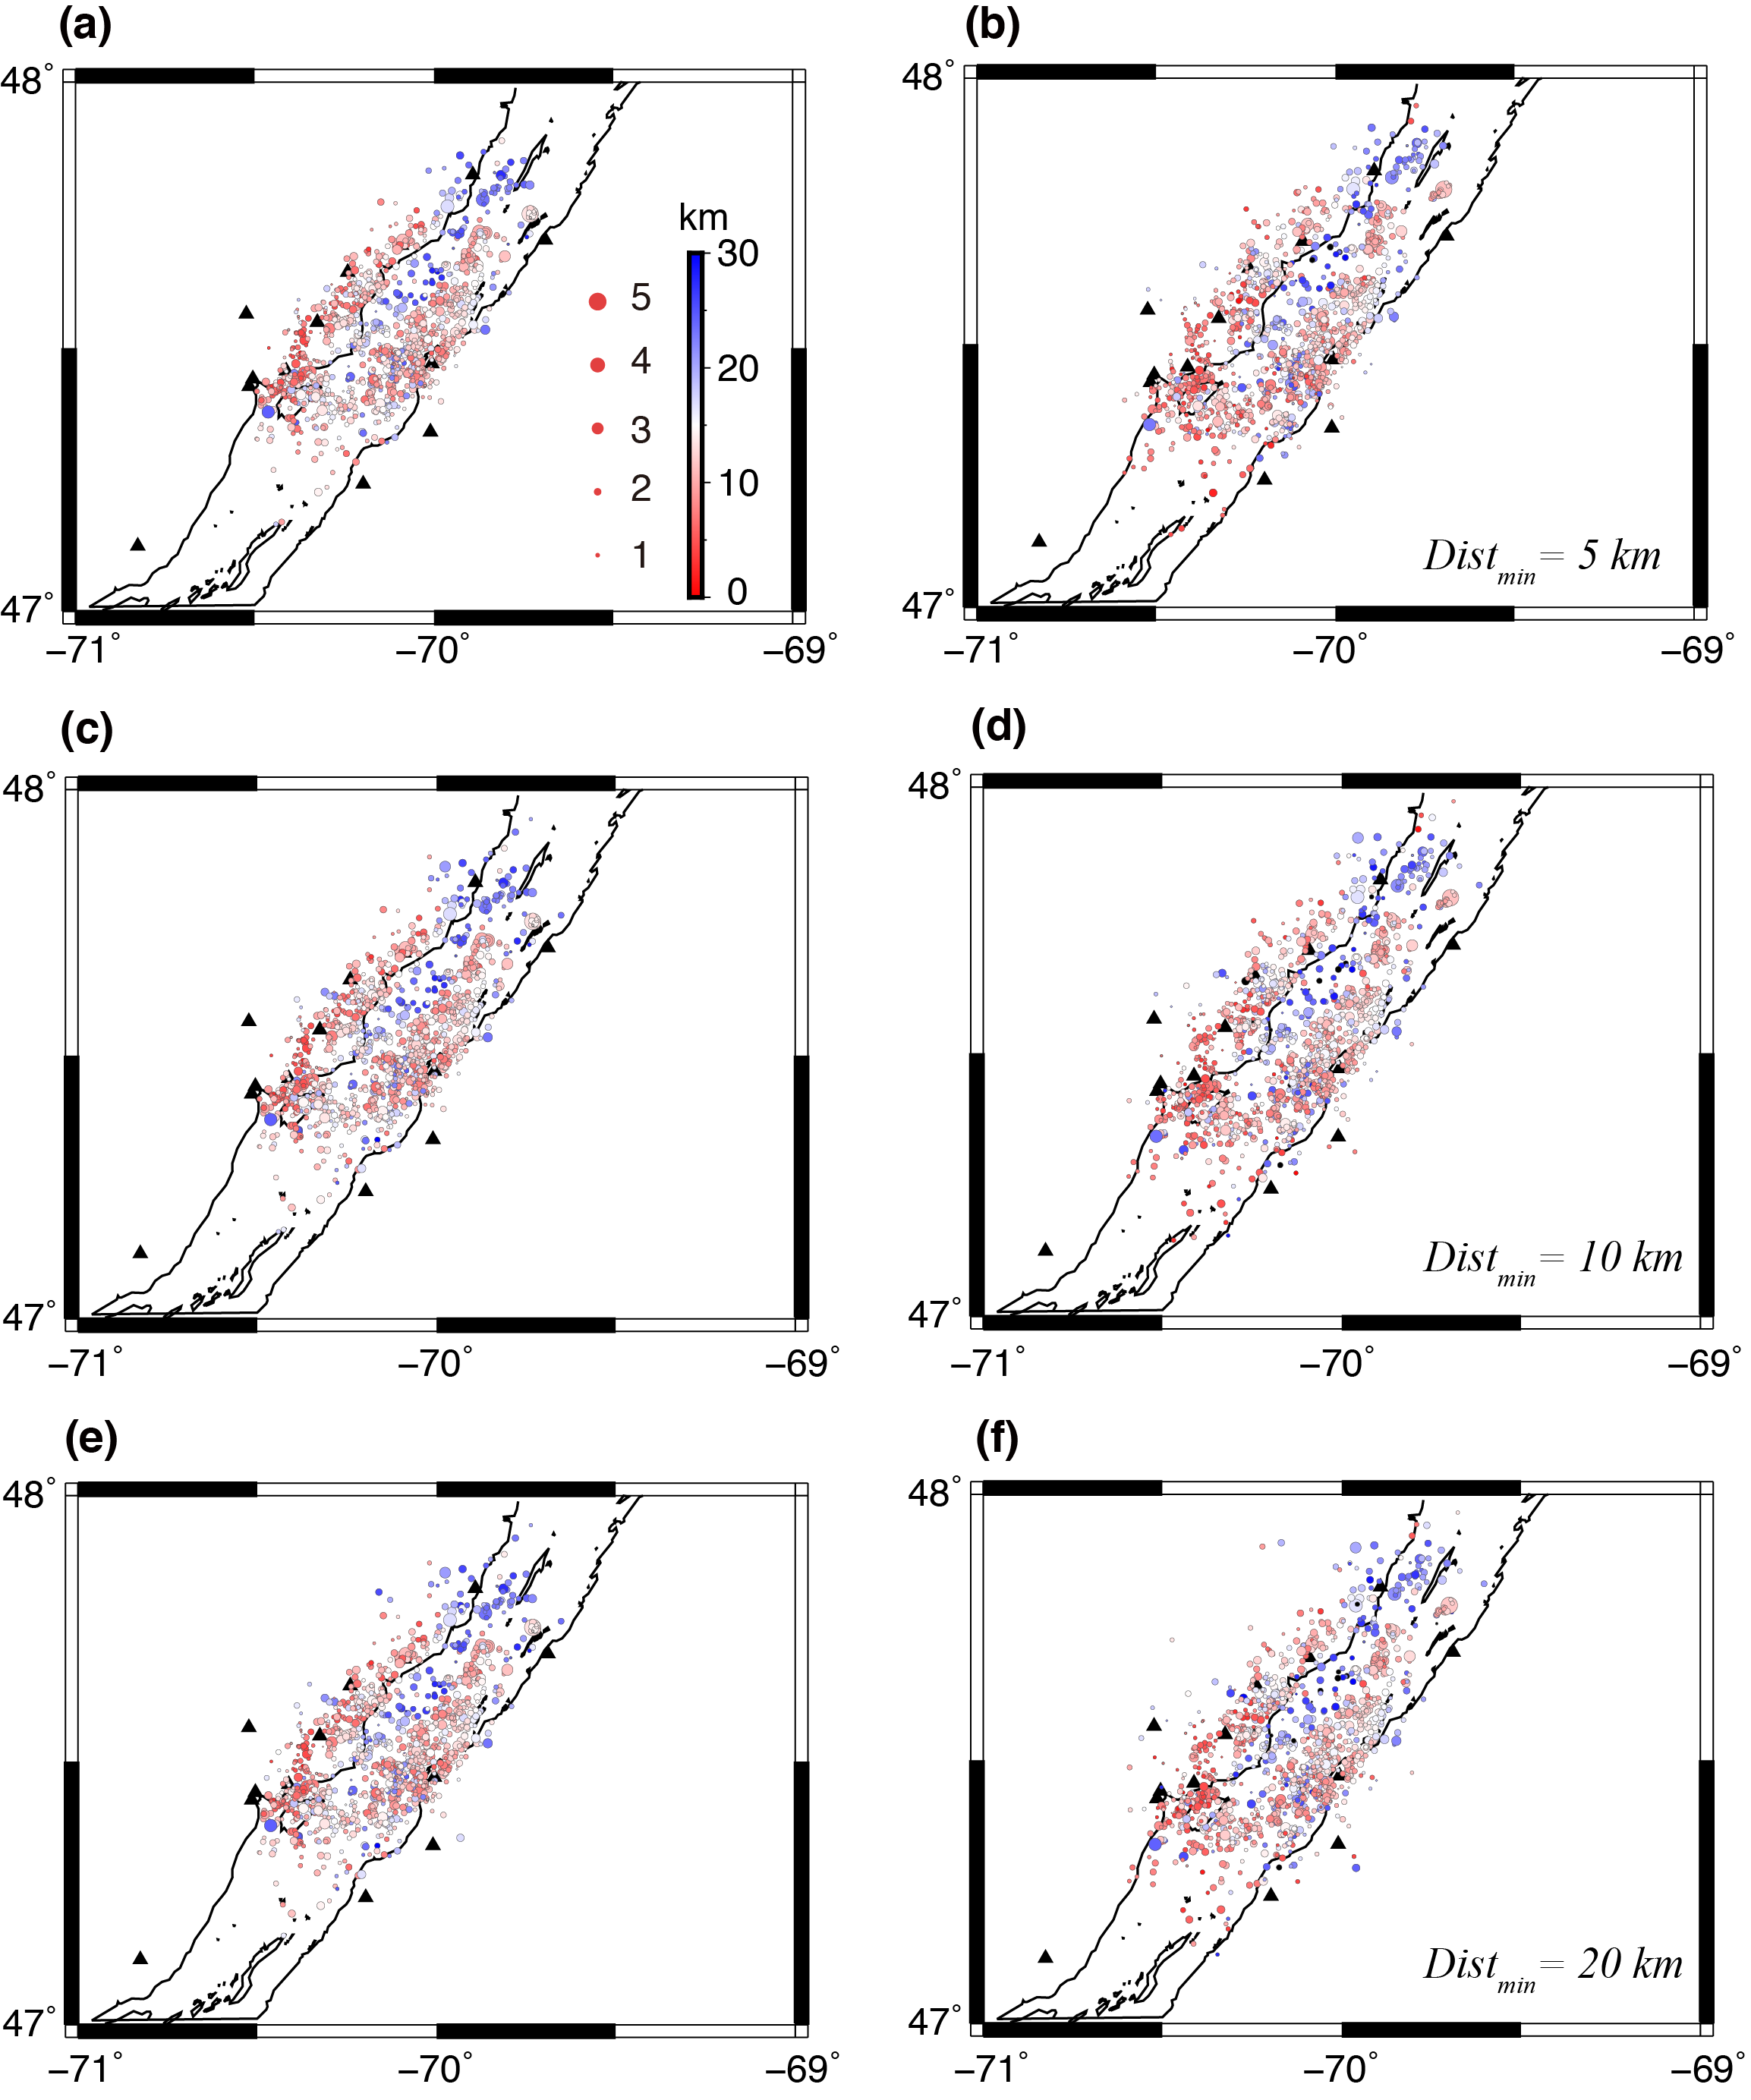
Figure S1. Comparison of relocated locations with different distance threshold of an event pair. (a) NRCan-reported locations of 1278 events that could be relocated when setting the distance threshold as 5 km. (b) Relocated locations as setting the distance threshold as 5 km. (c) The same as (a) but for 1345 events setting the distance threshold as 10 km. (d) The same as (b) but for setting the distance threshold as 10 km. (e) The same as (a) but for 1347 events setting the distance threshold as 10 km for picking arrivals and 20 km for cross correlation. (f) The same as (b) but for setting the distance threshold as 10 km for picking arrivals and 20 km for cross correlation.
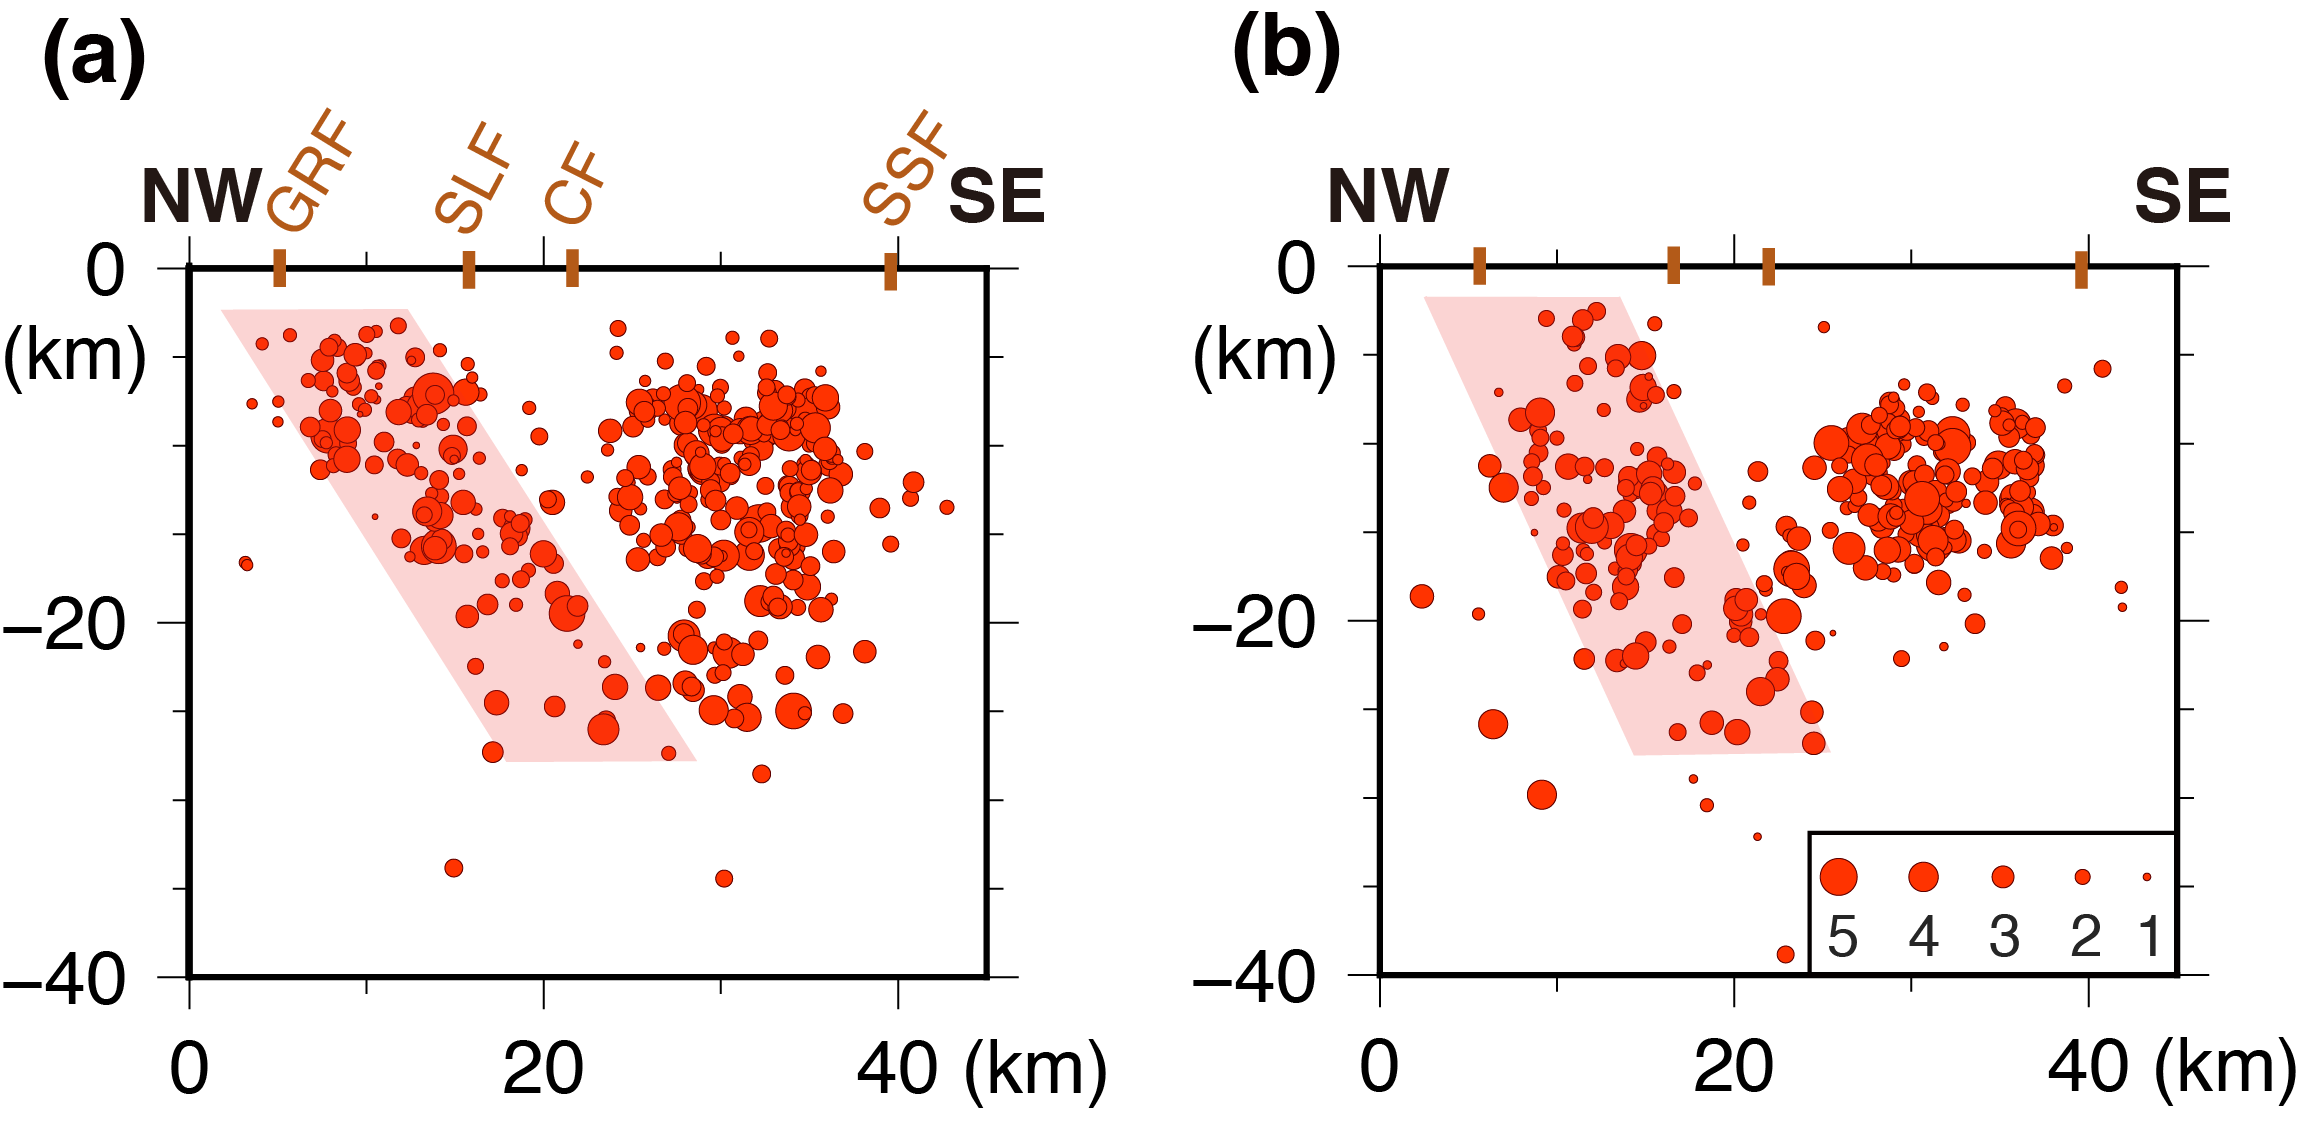
Figure S2. Profile grouped from (a) profiles (a)–(e) in Figure 6 of the main article, (b) profiles (f)–(i) in Figure 6 of the main article. Pink transparent areas indicate the 10-km-wide seismicity band under the north shore of the St. Lawrence River. Thick ticks mark the projected traces of Gouffre northwest River fault (GRF), Saint-Laurent fault (SLF), Charlevoix fault (CF), and south shore fault (SSF).
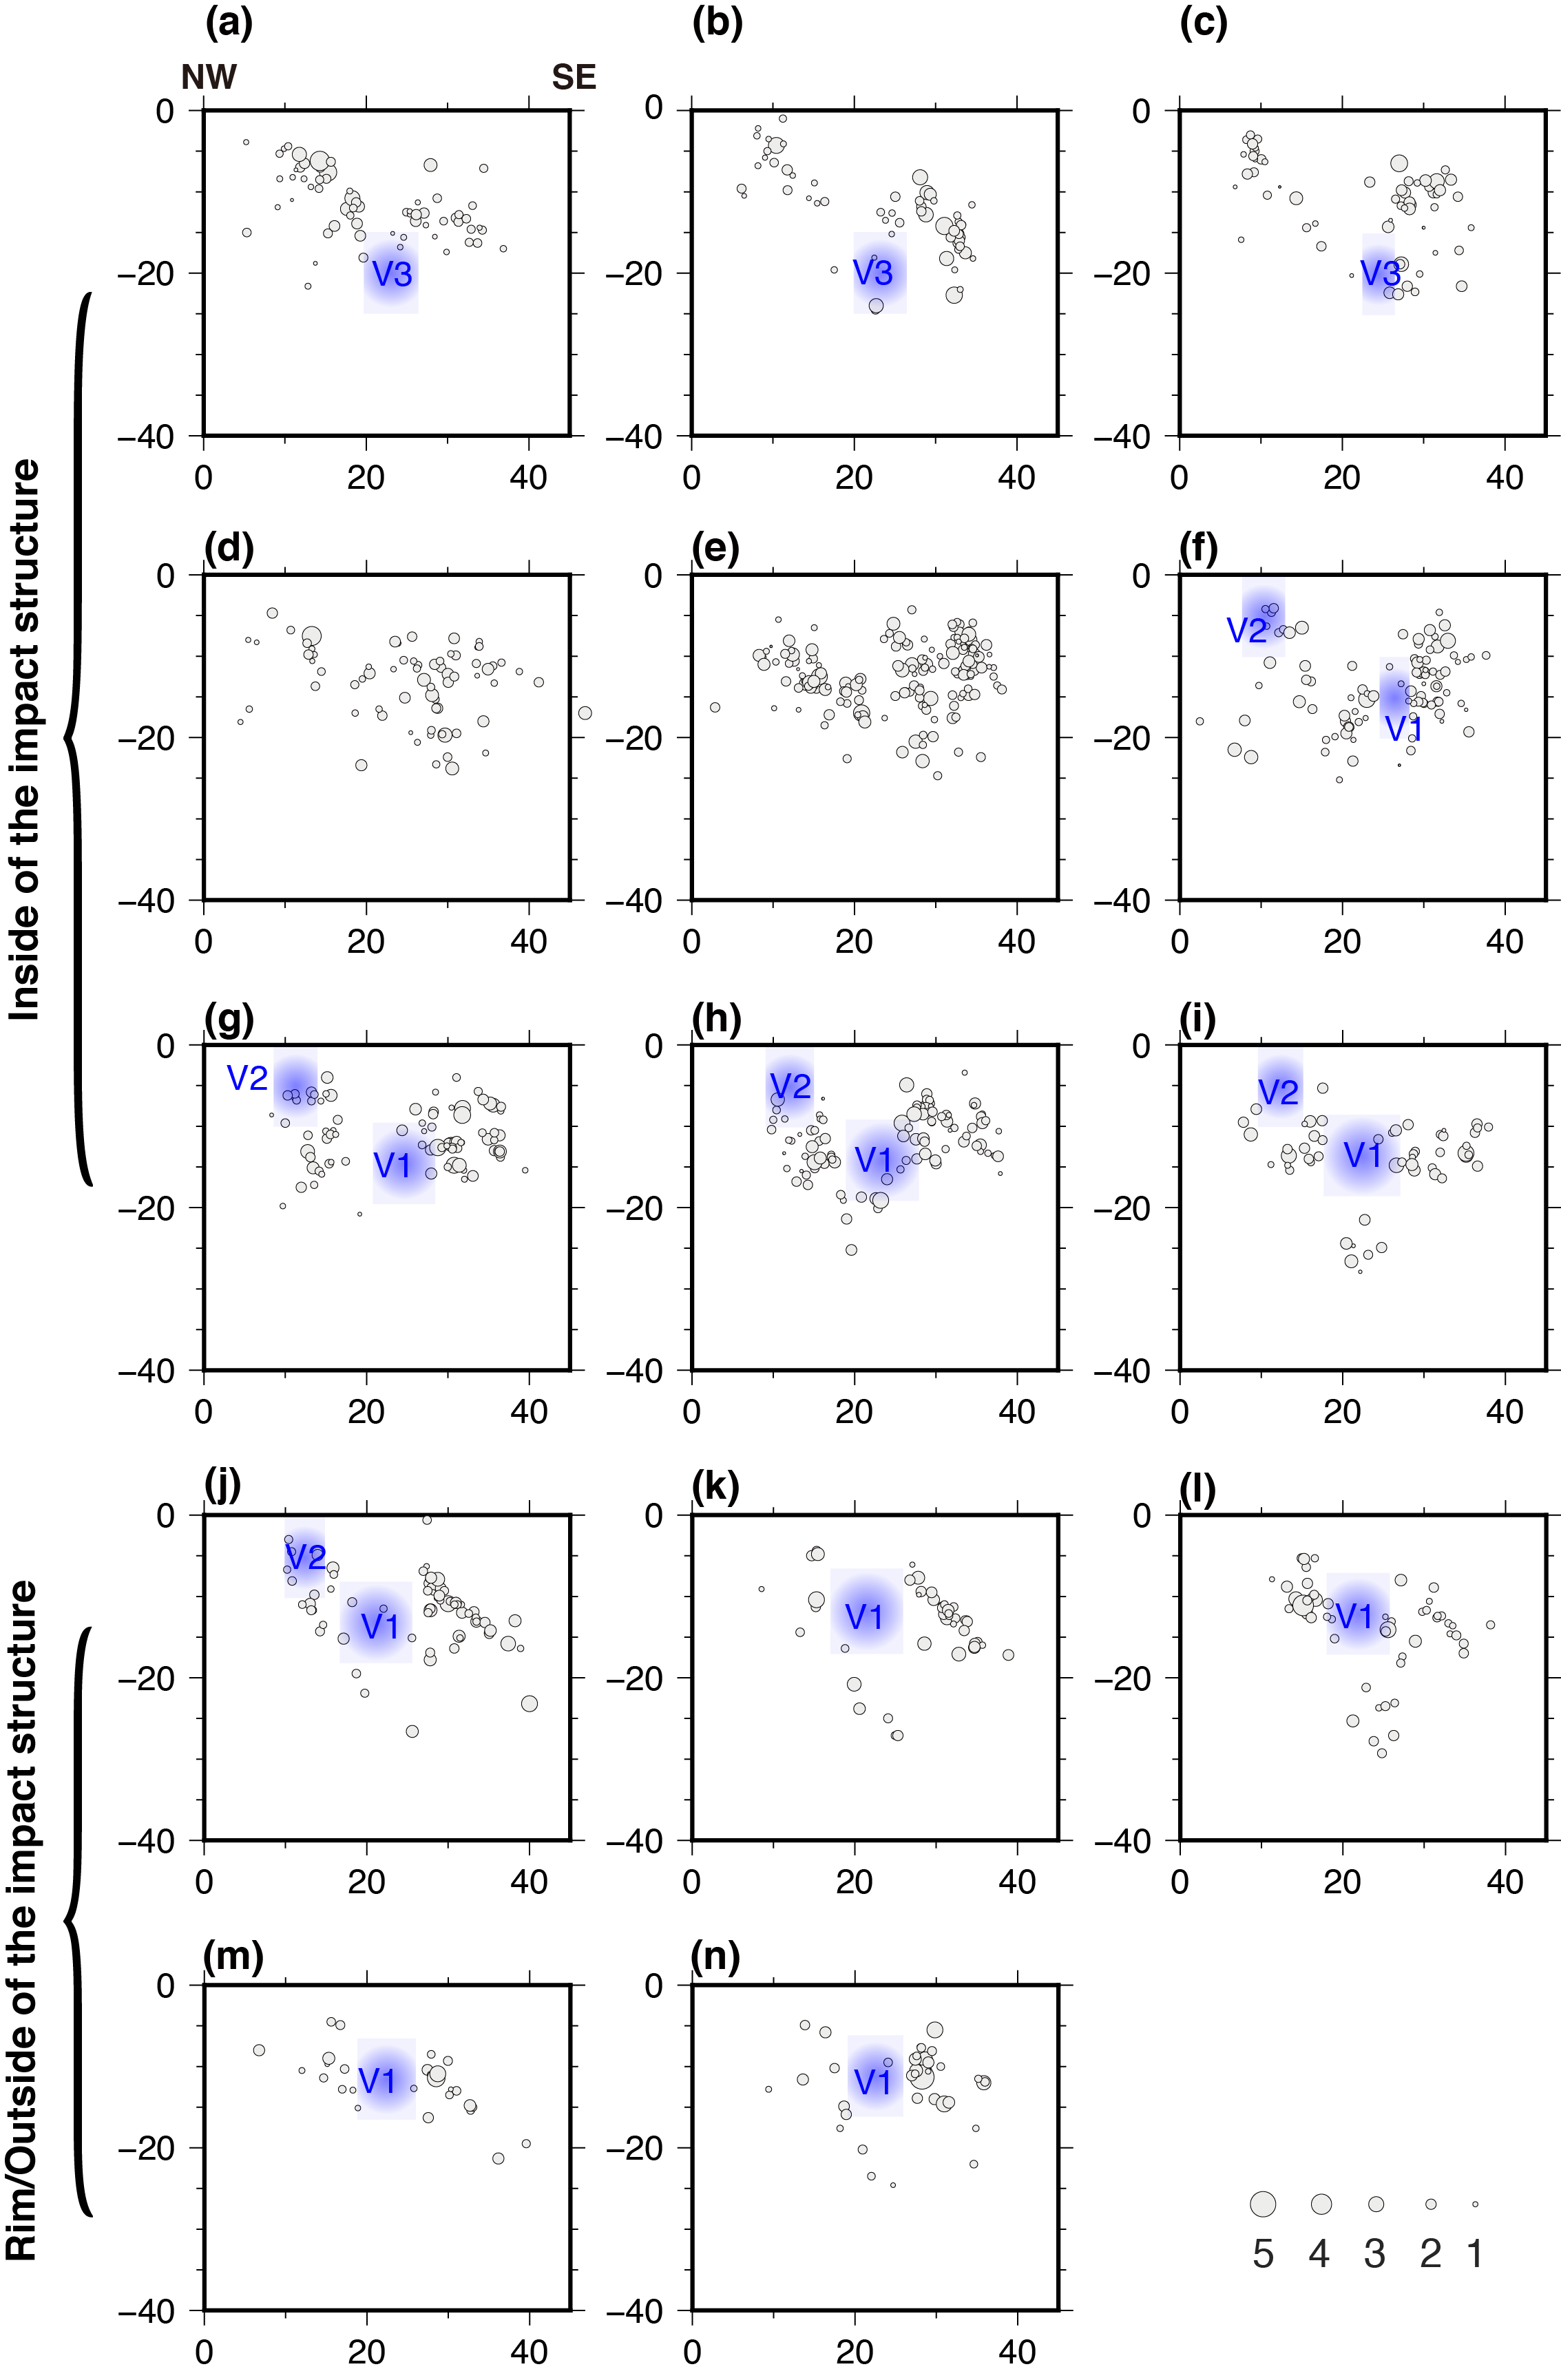
Figure S3. Cross sections with a uniform 3-km interval within the gray area in Figure 4 of the main article. Dots are NRCan reported locations. (a)–(n) show each profile from southwest to northeast along the St. Lawrence River. Shadow areas indicate projected locations of high-velocity material, the same as in Figure 6 of the main article.
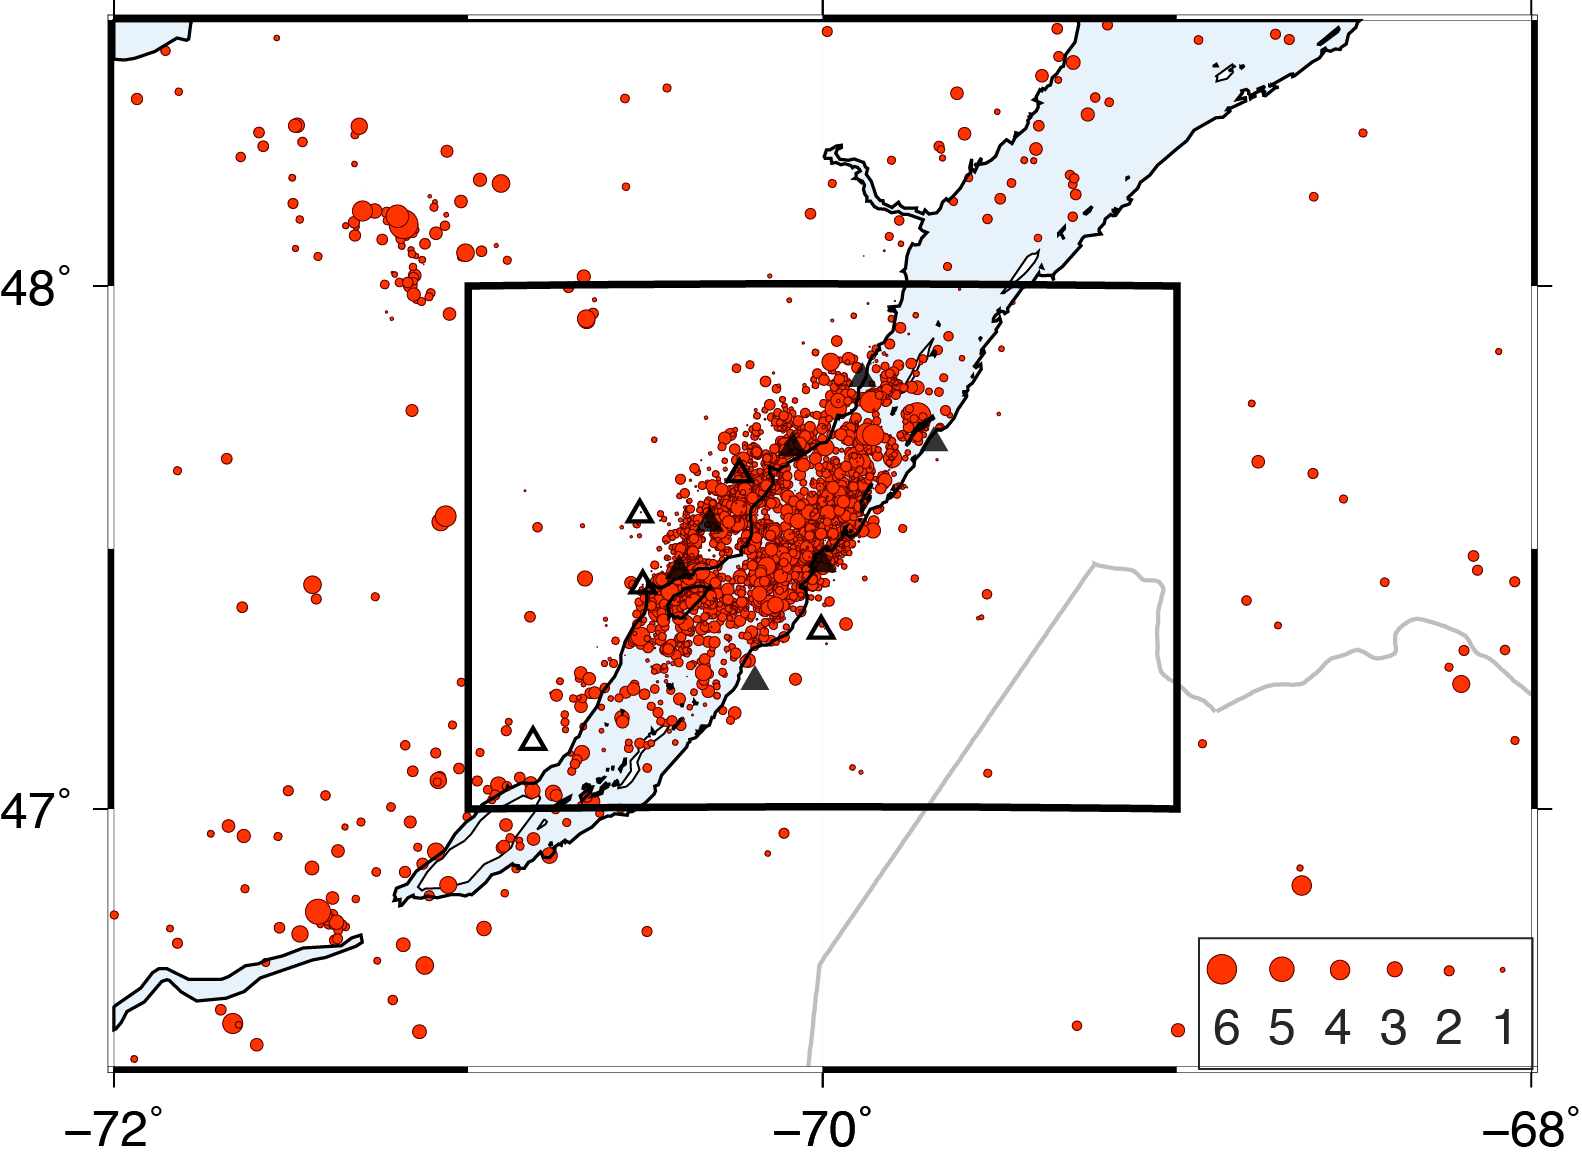
Figure S4. NRCan catalog earthquakes (January 1988 to October 2010, 4243 events). The black rectangle shows the study area of the CSZ. Red dots indicate detected earthquakes. Triangles denote stations the same as in Figure 1 of the main article.
Earthquake catalogs are from Canadian National Seismograph Network (CNSN), Natural Resources Canada (NRCan) and can be accessed at http://www.earthquakescanada.nrcan.gc.ca/stndon/NEDB-BNDS/bull-en.php?time_start=1978/01/01+00:00&time_end=2015/11/29+58:00&depth_min=0&depth_max=100&mag_min=0&mag_max=9.9&shape_type=region&radius_center_lat=50&radius_center_lon=-95&radius_radius=1000®ion_north=48.0®ion_south=47.0®ion_east=-69®ion_west=-71.0&eq_type_L=1&display_list=1&list_sort=date&list_order=a&tpl_output=html&submited=Submit+equest&no_embargo=1 (last accessed December 2015).
[ Back ]