This electronic supplement contains a table summarizing the data from the 463 boreholes with profile depth zp > 30 m that is described in the main article (Table S1); example of VS profiles in which VS does not gradually increase with depth (Fig. S1); comparison of estimated VS30 values (VS30 est.) based on conditional independence property model with observed VS30 (Fig. S2); and two figures (Figs. S3 and S4) of topographic ground slopes obtained from the digital elevation models (DEMs) of 3, 15, 30, and 60 arcsec resolution.
Table S1. Summary of the 463 boreholes with profile depth zp > 30 m used in this study for developing VSZ-to-VS30 extrapolation models.
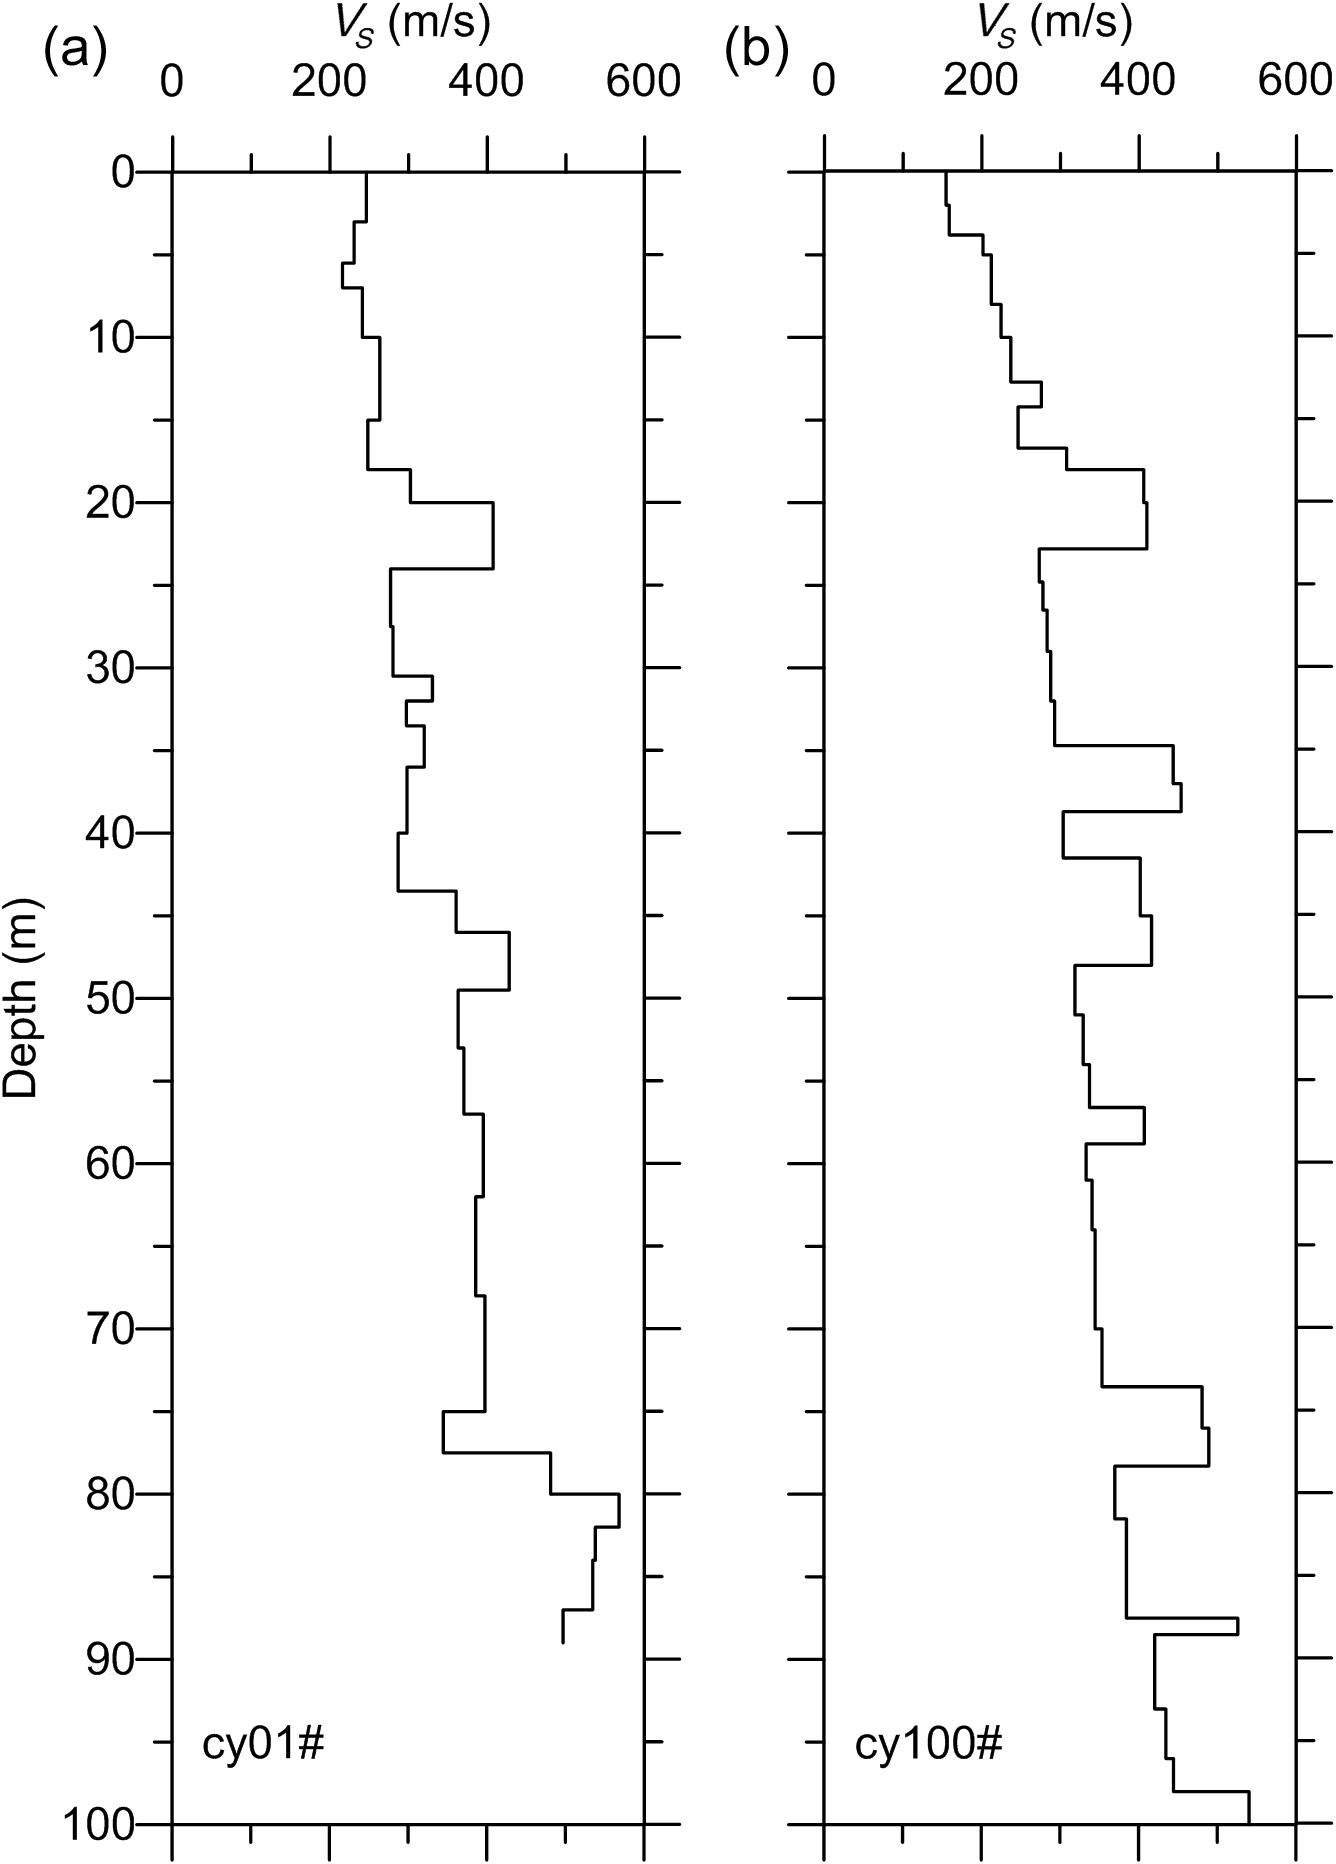
Figure S1. Example of VS profiles in which VS does not gradually increase with depth in the Beijing plain area. (a) Borehole cy01#; and (b) borehole cy100#.
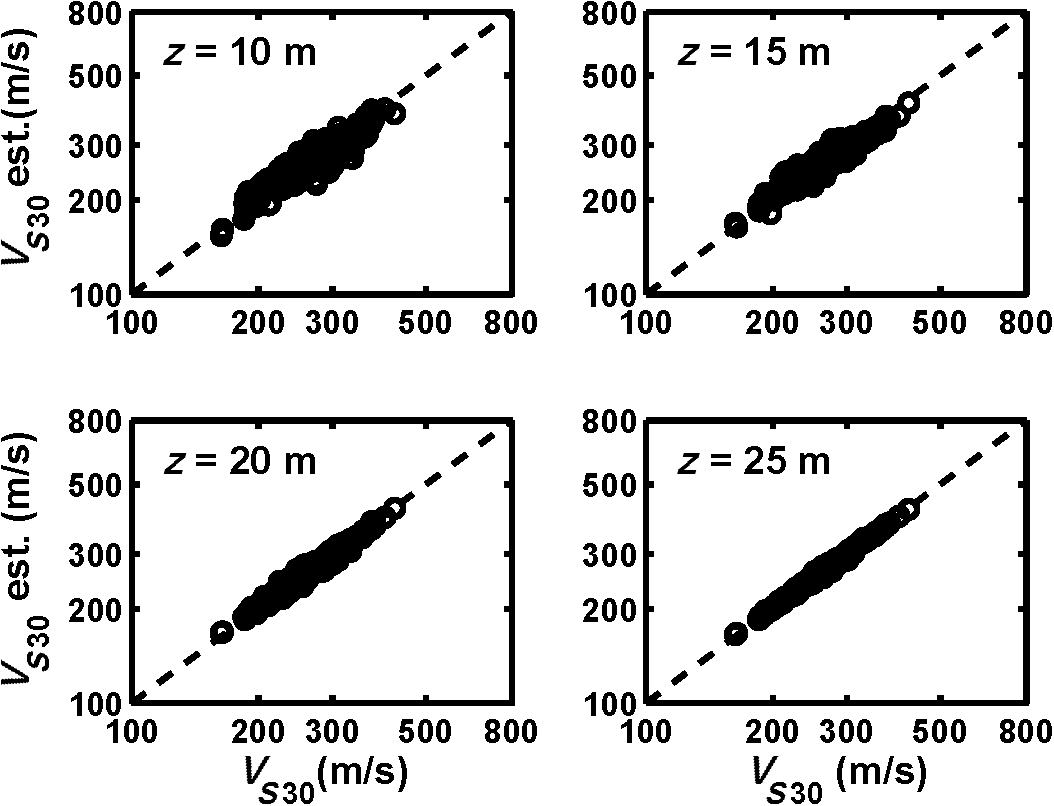
Figure S2. Comparison of estimated VS30 values (VS30 est.) for depth z equal to 10, 15, 20, and 25 m, obtained using the conditional independence property model (Dai et al., 2013, their equation 5), versus observed VS30 for the 463 boreholes with profile depth zp > 30 m.
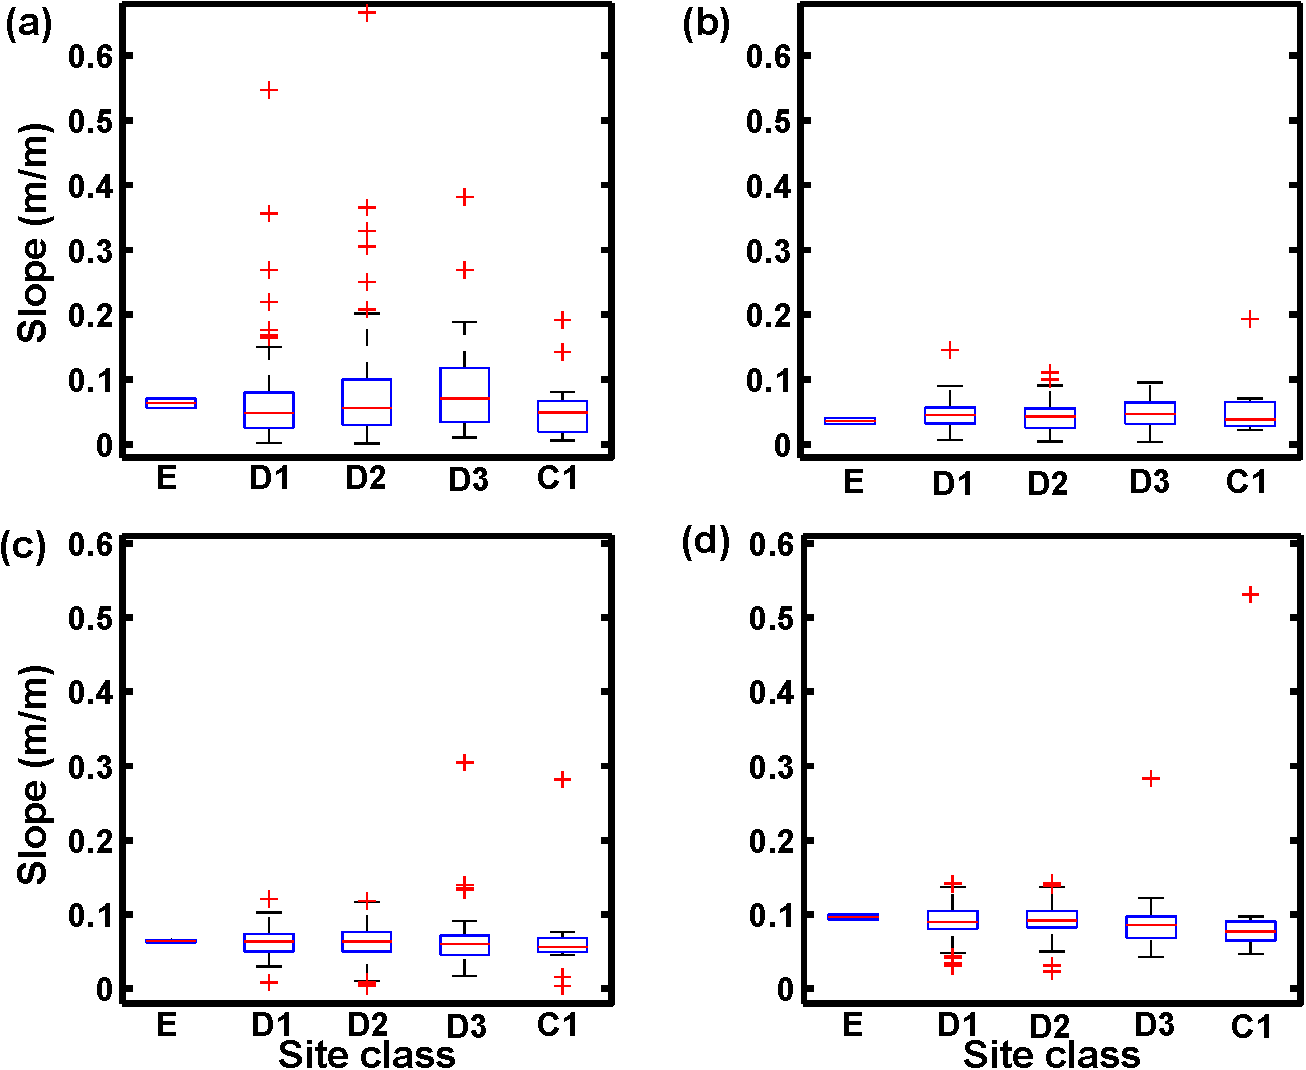
Figure S3. Comparison of topographic ground slopes from (a) 3 arcsec, (b) 15 arcsec, (c) 30 arcsec, and (b) 60 arcsec resolution DEM data, for site classes E (VS30 < 180 m/s), D1 (180 m/s < VS30 < 240 m/s), D2 (240 m/s < VS30 < 300 m/s), D3 (300 m/s < VS30 < 360 m/s), and C1 (360 m/s < VS30 < 490 m/s). In the box-and-whisker plot, the central mark in the box represents the median of the data (50th percentile). The edges of the box are the 25th and 75th percentiles (first and third quartile of the distribution, respectively). The whiskers represent the lowest and highest values still within 1.5 times the interquartile range. Plus symbols represent the outliers, defined as values outside the whiskers. Note that our data points are mainly classified as site classes D1, D2, and D3; only two sites are classified as class E.
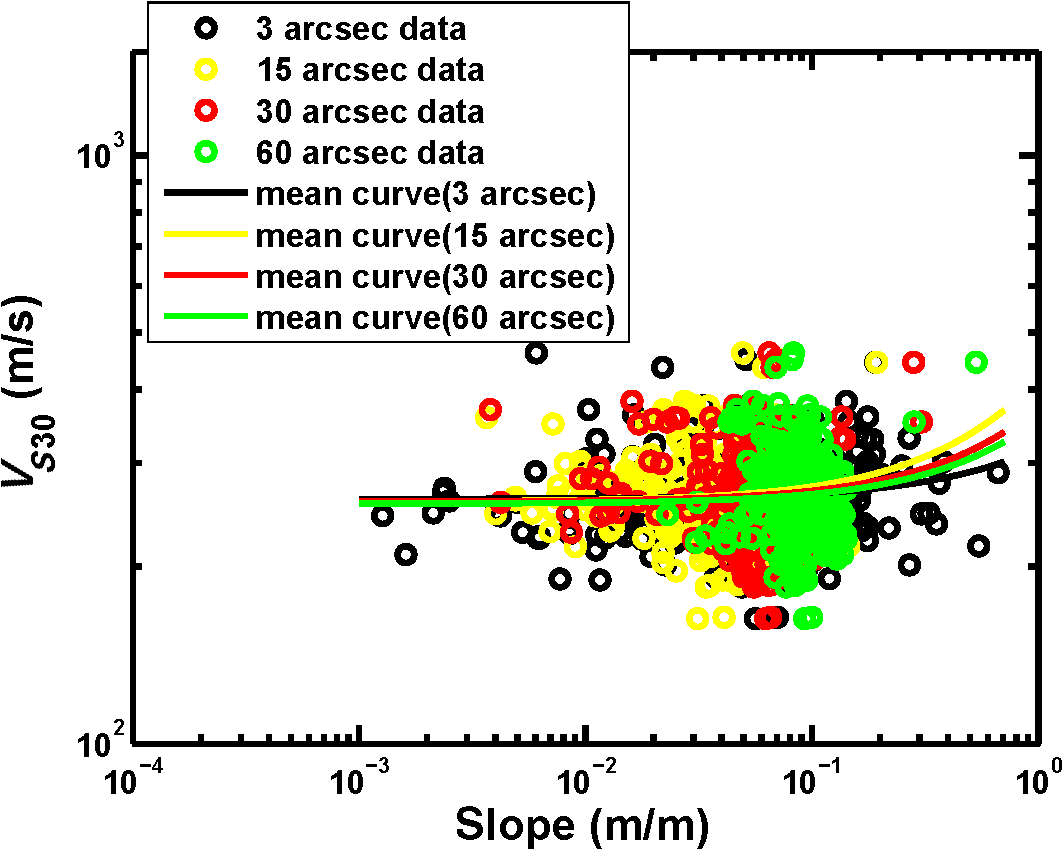
Figure S4. Comparison of correlations of VS30 with topographic slope from DEM data of 3, 15, 30, and 60 arcsec resolution. Correlations are developed from all 479 boreholes. VS30 values for the 16 boreholes with zp < 30 m are estimated using the bottom constant velocity (BCV) model. The mean curves are fitted based on a simple linear model.
Dai, Z., X. Li, and C. Hou (2013). A shear-wave velocity model for VS30 estimation based on a conditional independence property, Bull. Seismol. Soc. Am. 103, no. 6, 3354–3361.
[ Back ]