This electronic supplement contains figures of inversion results, waveform fits, directivity, and ground-motion prediction analysis, and table of crustal model. Figure S1 displays results from a preliminary study on the 2008 Chino Hills earthquake. Figures S2 and S4 show the comparison of waveforms for the two Mw 4.4 events near Fontana recorded at stations along the corridor between the San Bernardino Valley and the Los Angeles basin and the complete cut-and-paste (CAP) inversion results of them. Figure S3 shows the results of a previous study on the Mw 4.6 Inglewood earthquake inside the Los Angeles basin. Figures S5–S8 are related to the directivity and ground-motion prediction analysis. Table S1 refers to the crustal model used for this study.
Table S1. 1D crustal model for the region studied.
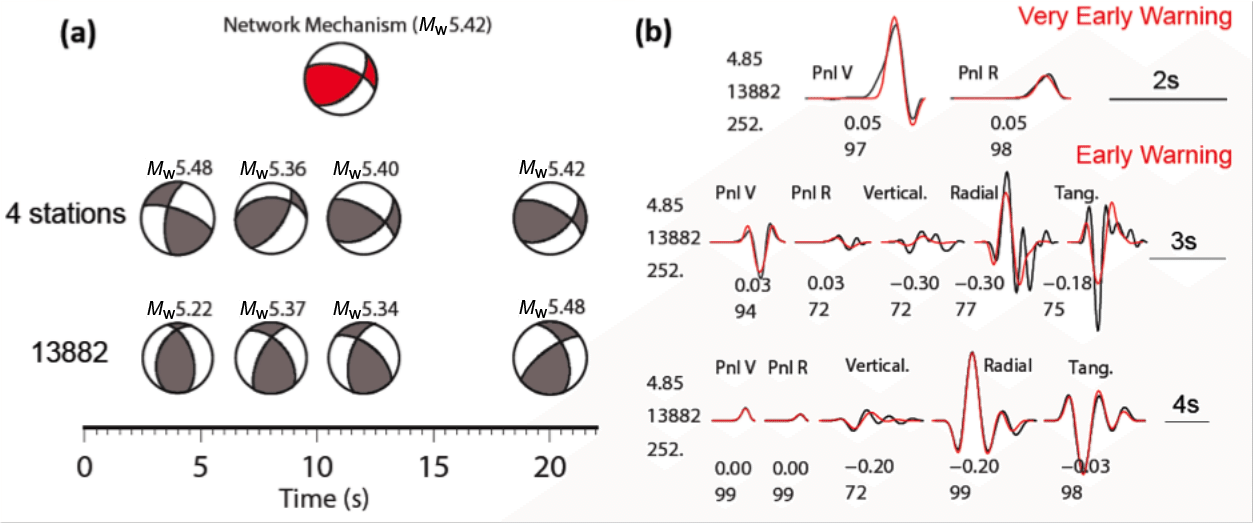
Figure S1. Preliminary study on the 2008 Chino Hills earthquake. (a) Waveform inversion as a function of time after the first P-wave arrival at close-in stations. Inversions were performed using the four nearest stations and one station (13882), respectively. (b) Waveform comparison for station 13882 at 4, 8, and 12 s. Data are shown in black and synthetic waveform in red. The format of seismogram labeling is identical to that of Figure 2 in the main article.
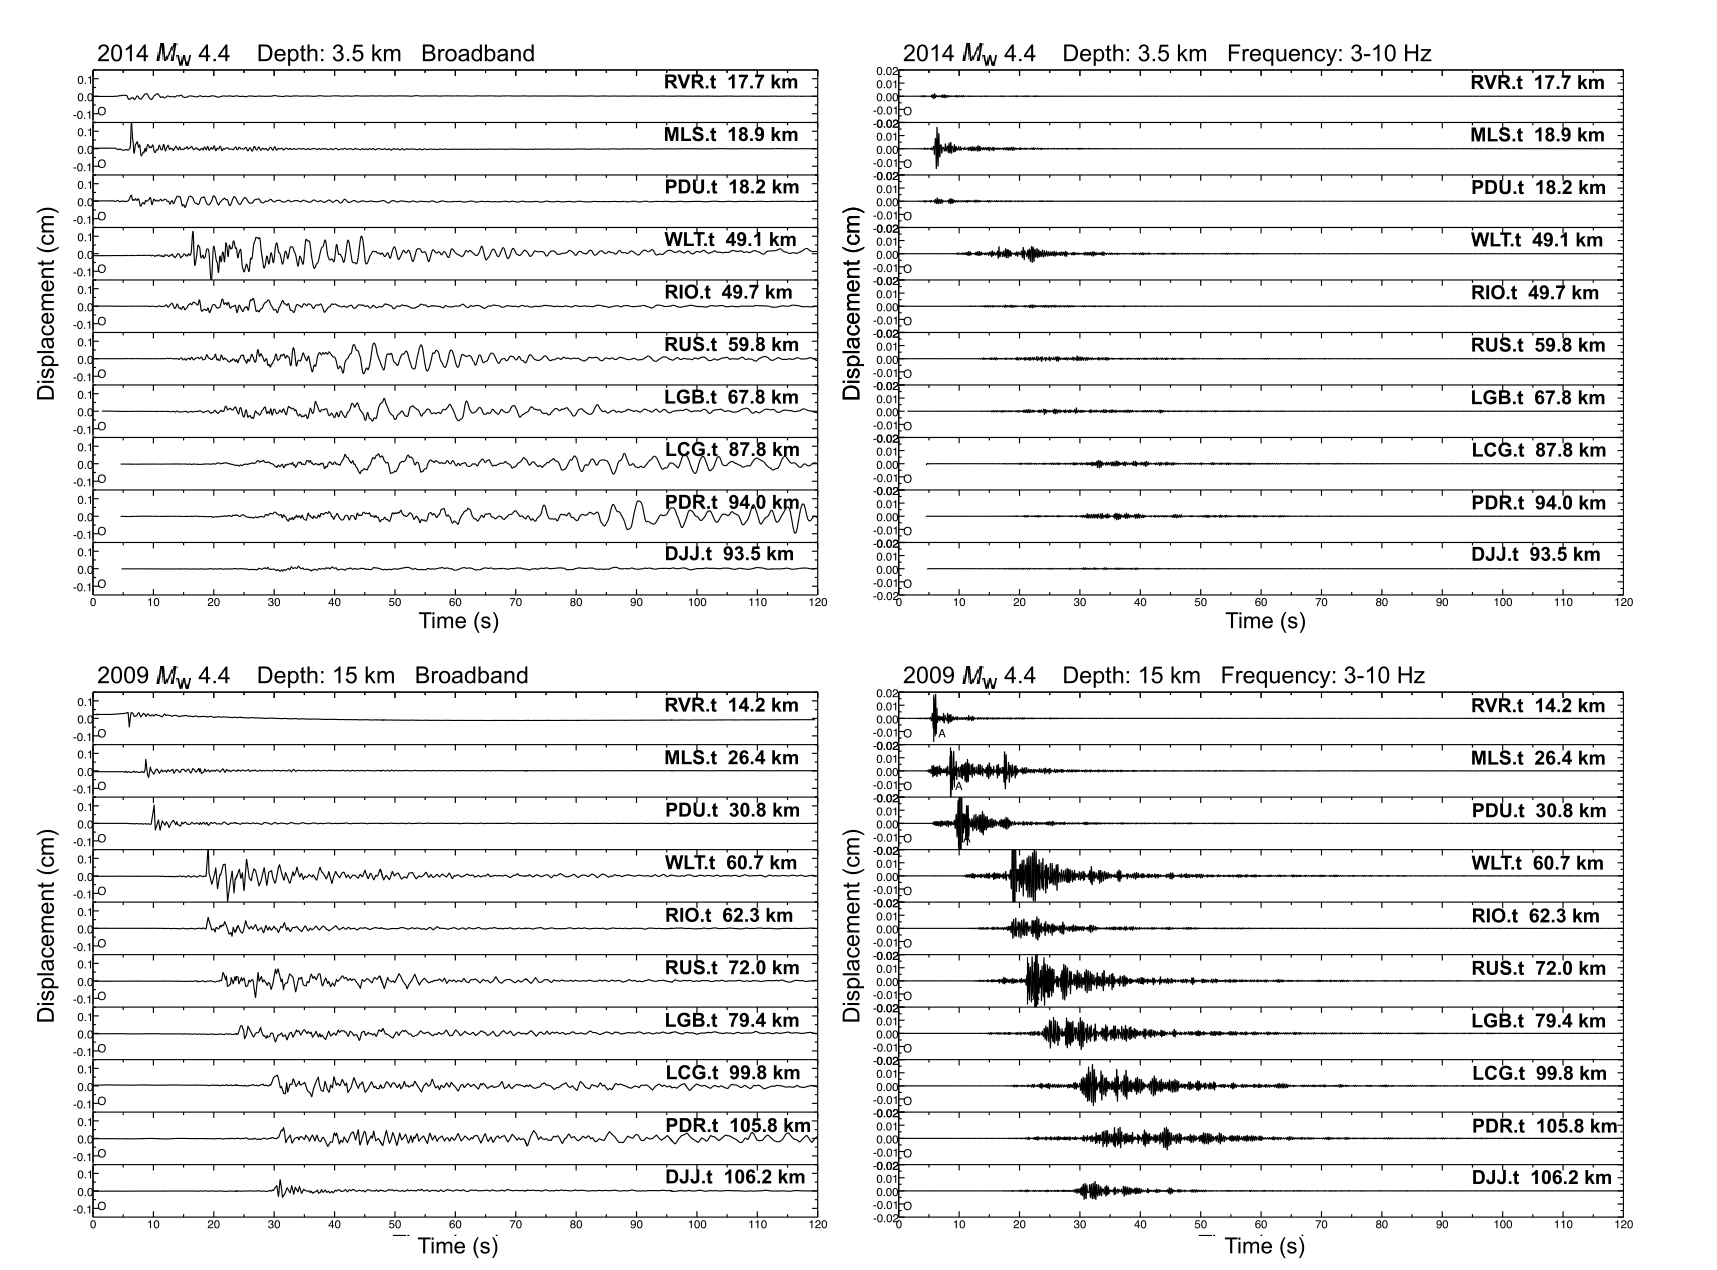
Figure S2. Waveform recorded at stations within the Los Angeles basin. (Top row) Shallow event near Fontana, California, in 2014. (Bottom row) Deep event near Fontana, California, in 2009. Note that the significant difference in energy content between (left column) broadband waveform and (right column) waveform filtered at high frequency (3–10 Hz).
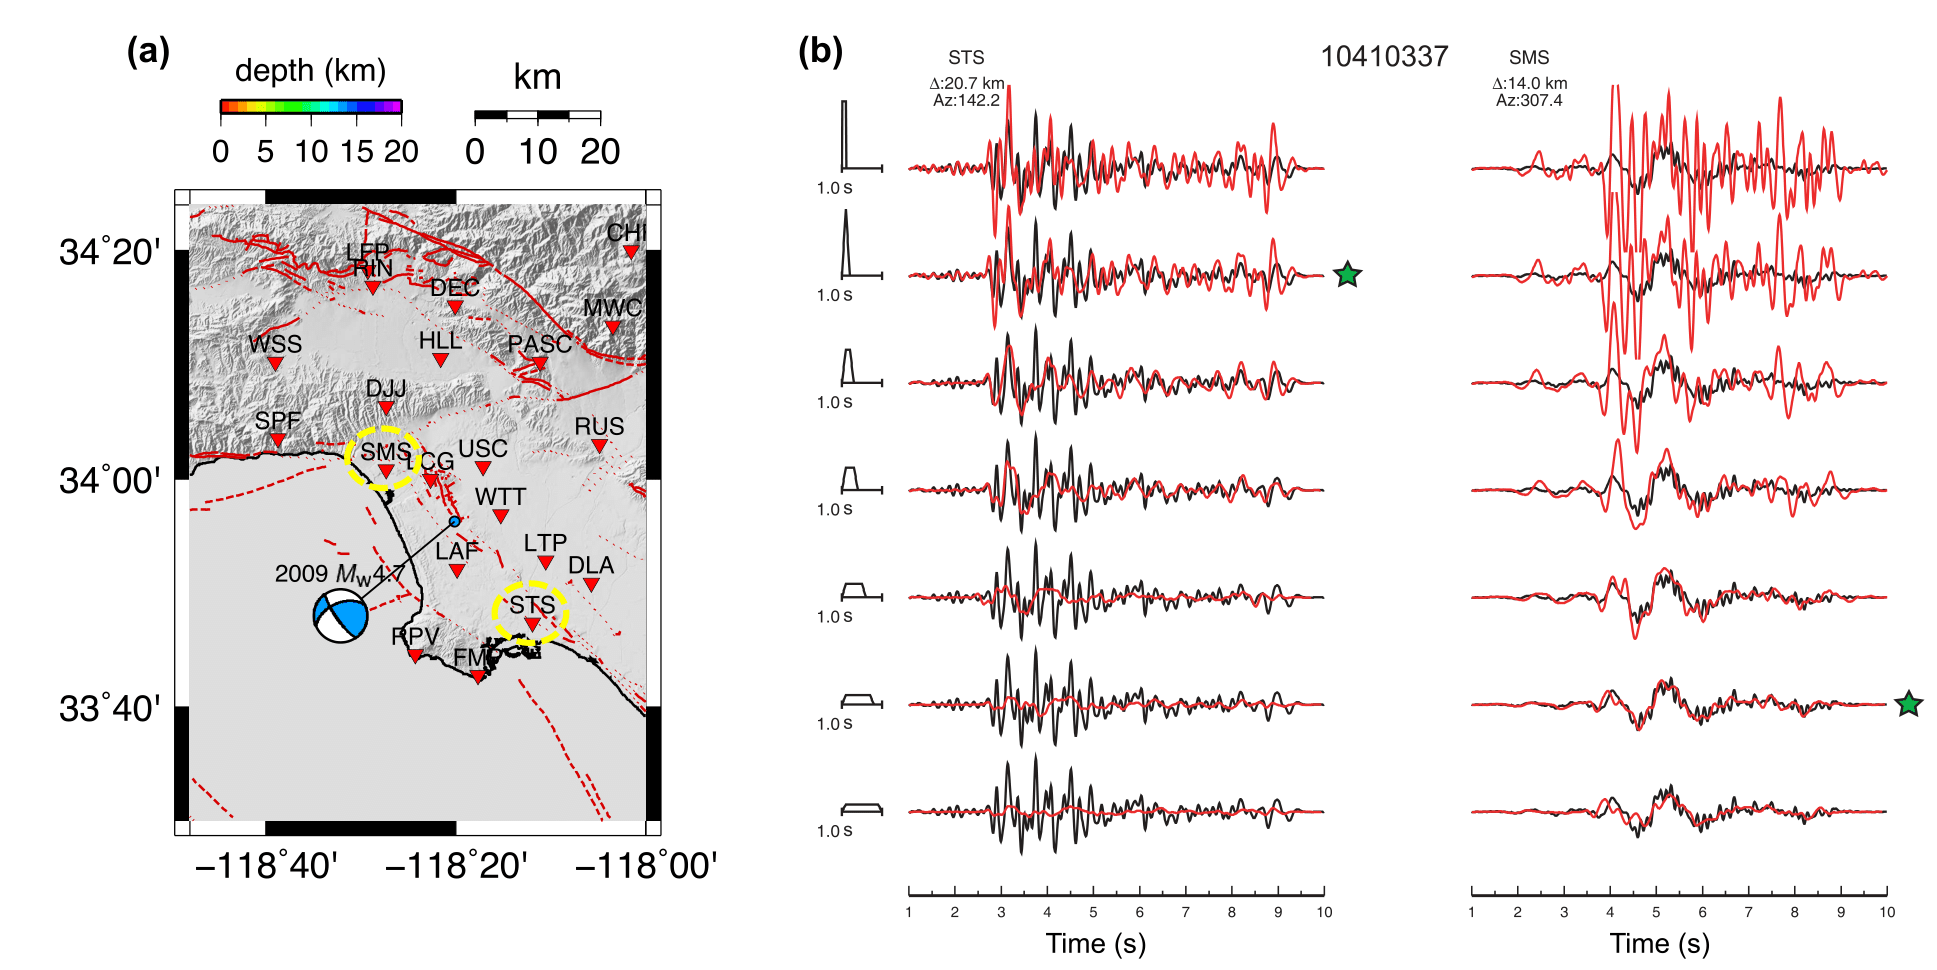
Figure S3. The study on the Mw 4.6 Inglewood earthquake by Luo et al. (2010). (a) Map showing the location of the two stations STS and SMS. (b) Directivity validation test using various trapezoidal source time functions (STFs) to simulate the main event (10410337). The predictions at both stations are labeled with green stars. Reprinted with permission from Luo et al. (2010).
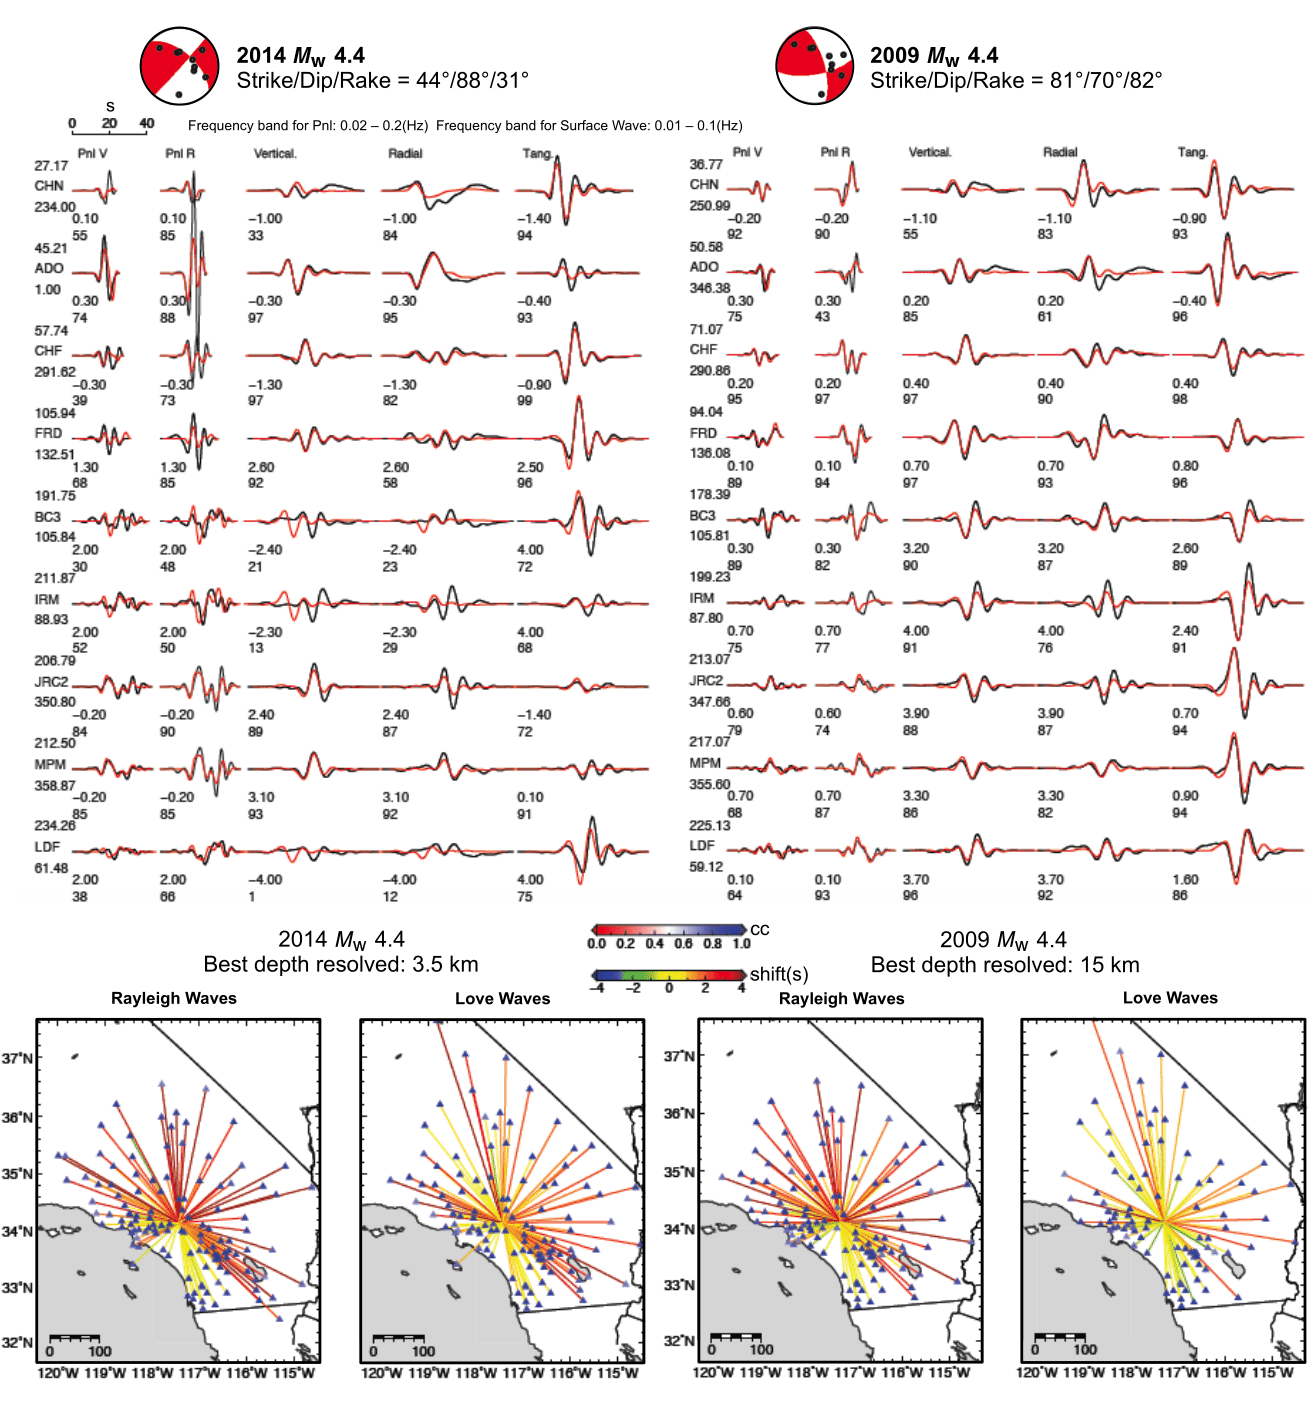
Figure S4. Waveform inversion of the two events using the whole network. (Top) Waveform comparison between data (black) and 1D synthetics (red) at selected stations. The format of labeling is identical to that of Figure 2b in the main article. (Bottom) Spider diagrams show the timing shift (line color) and cross correlation (triangle color) between data and 1D synthetics at each station. When comparing waveform cross correlations at various stations, for those with cross-correlation values above 70%, Rayleigh waves show similar time-shift values (lines in dark orange) for both events. Time-shift values for Love waves differ slightly more, but it can be concluded that the lateral location of the earthquakes is reliable. This also validates the 1D velocity model used to generate the Green’s functions at these periods for hard-rock sites.
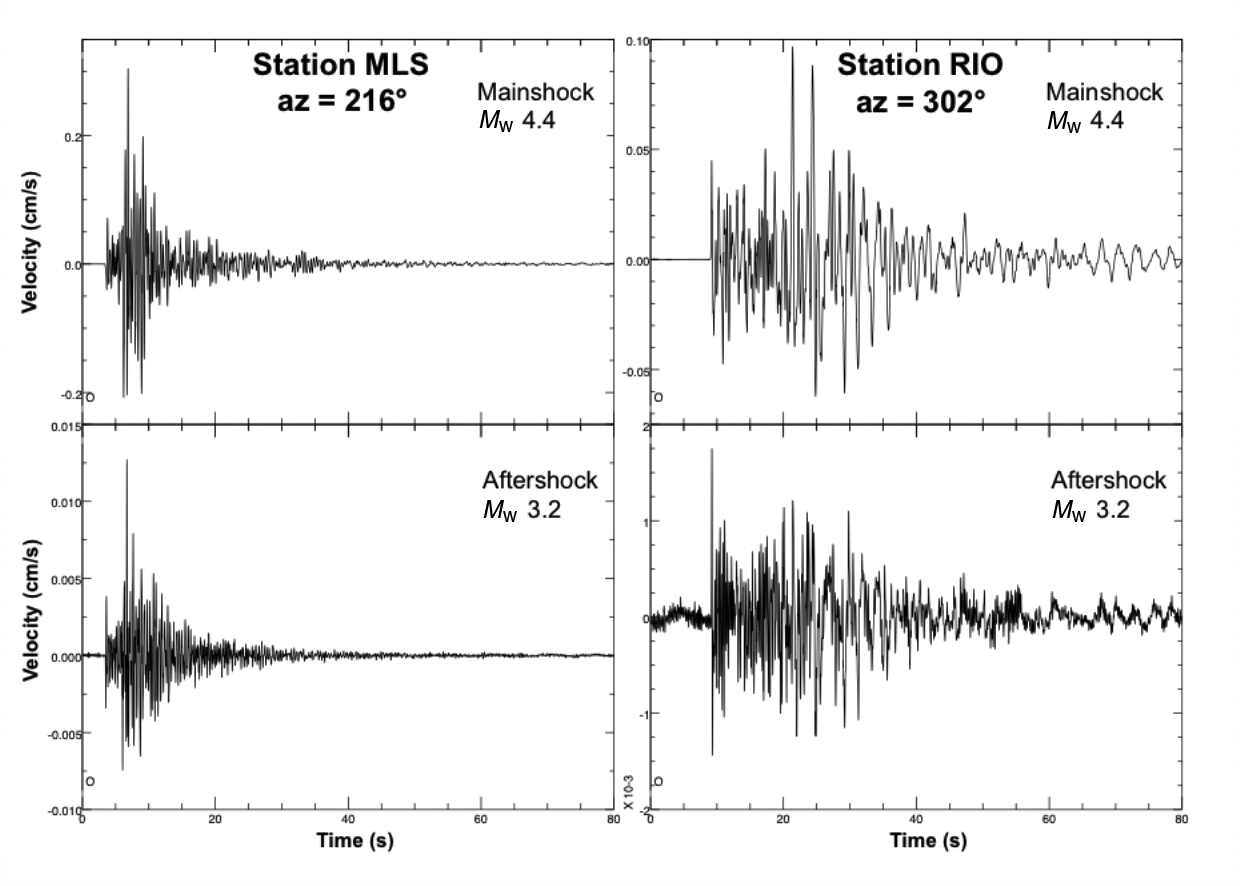
Figure S5. Small event can be used as empirical Green’s functions (EGFs) for studying directivity. The Mw 4.4 shallow earthquake and its biggest Mw 3.2 aftershock have almost identical epicenter locations as well as similar velocity waveform.
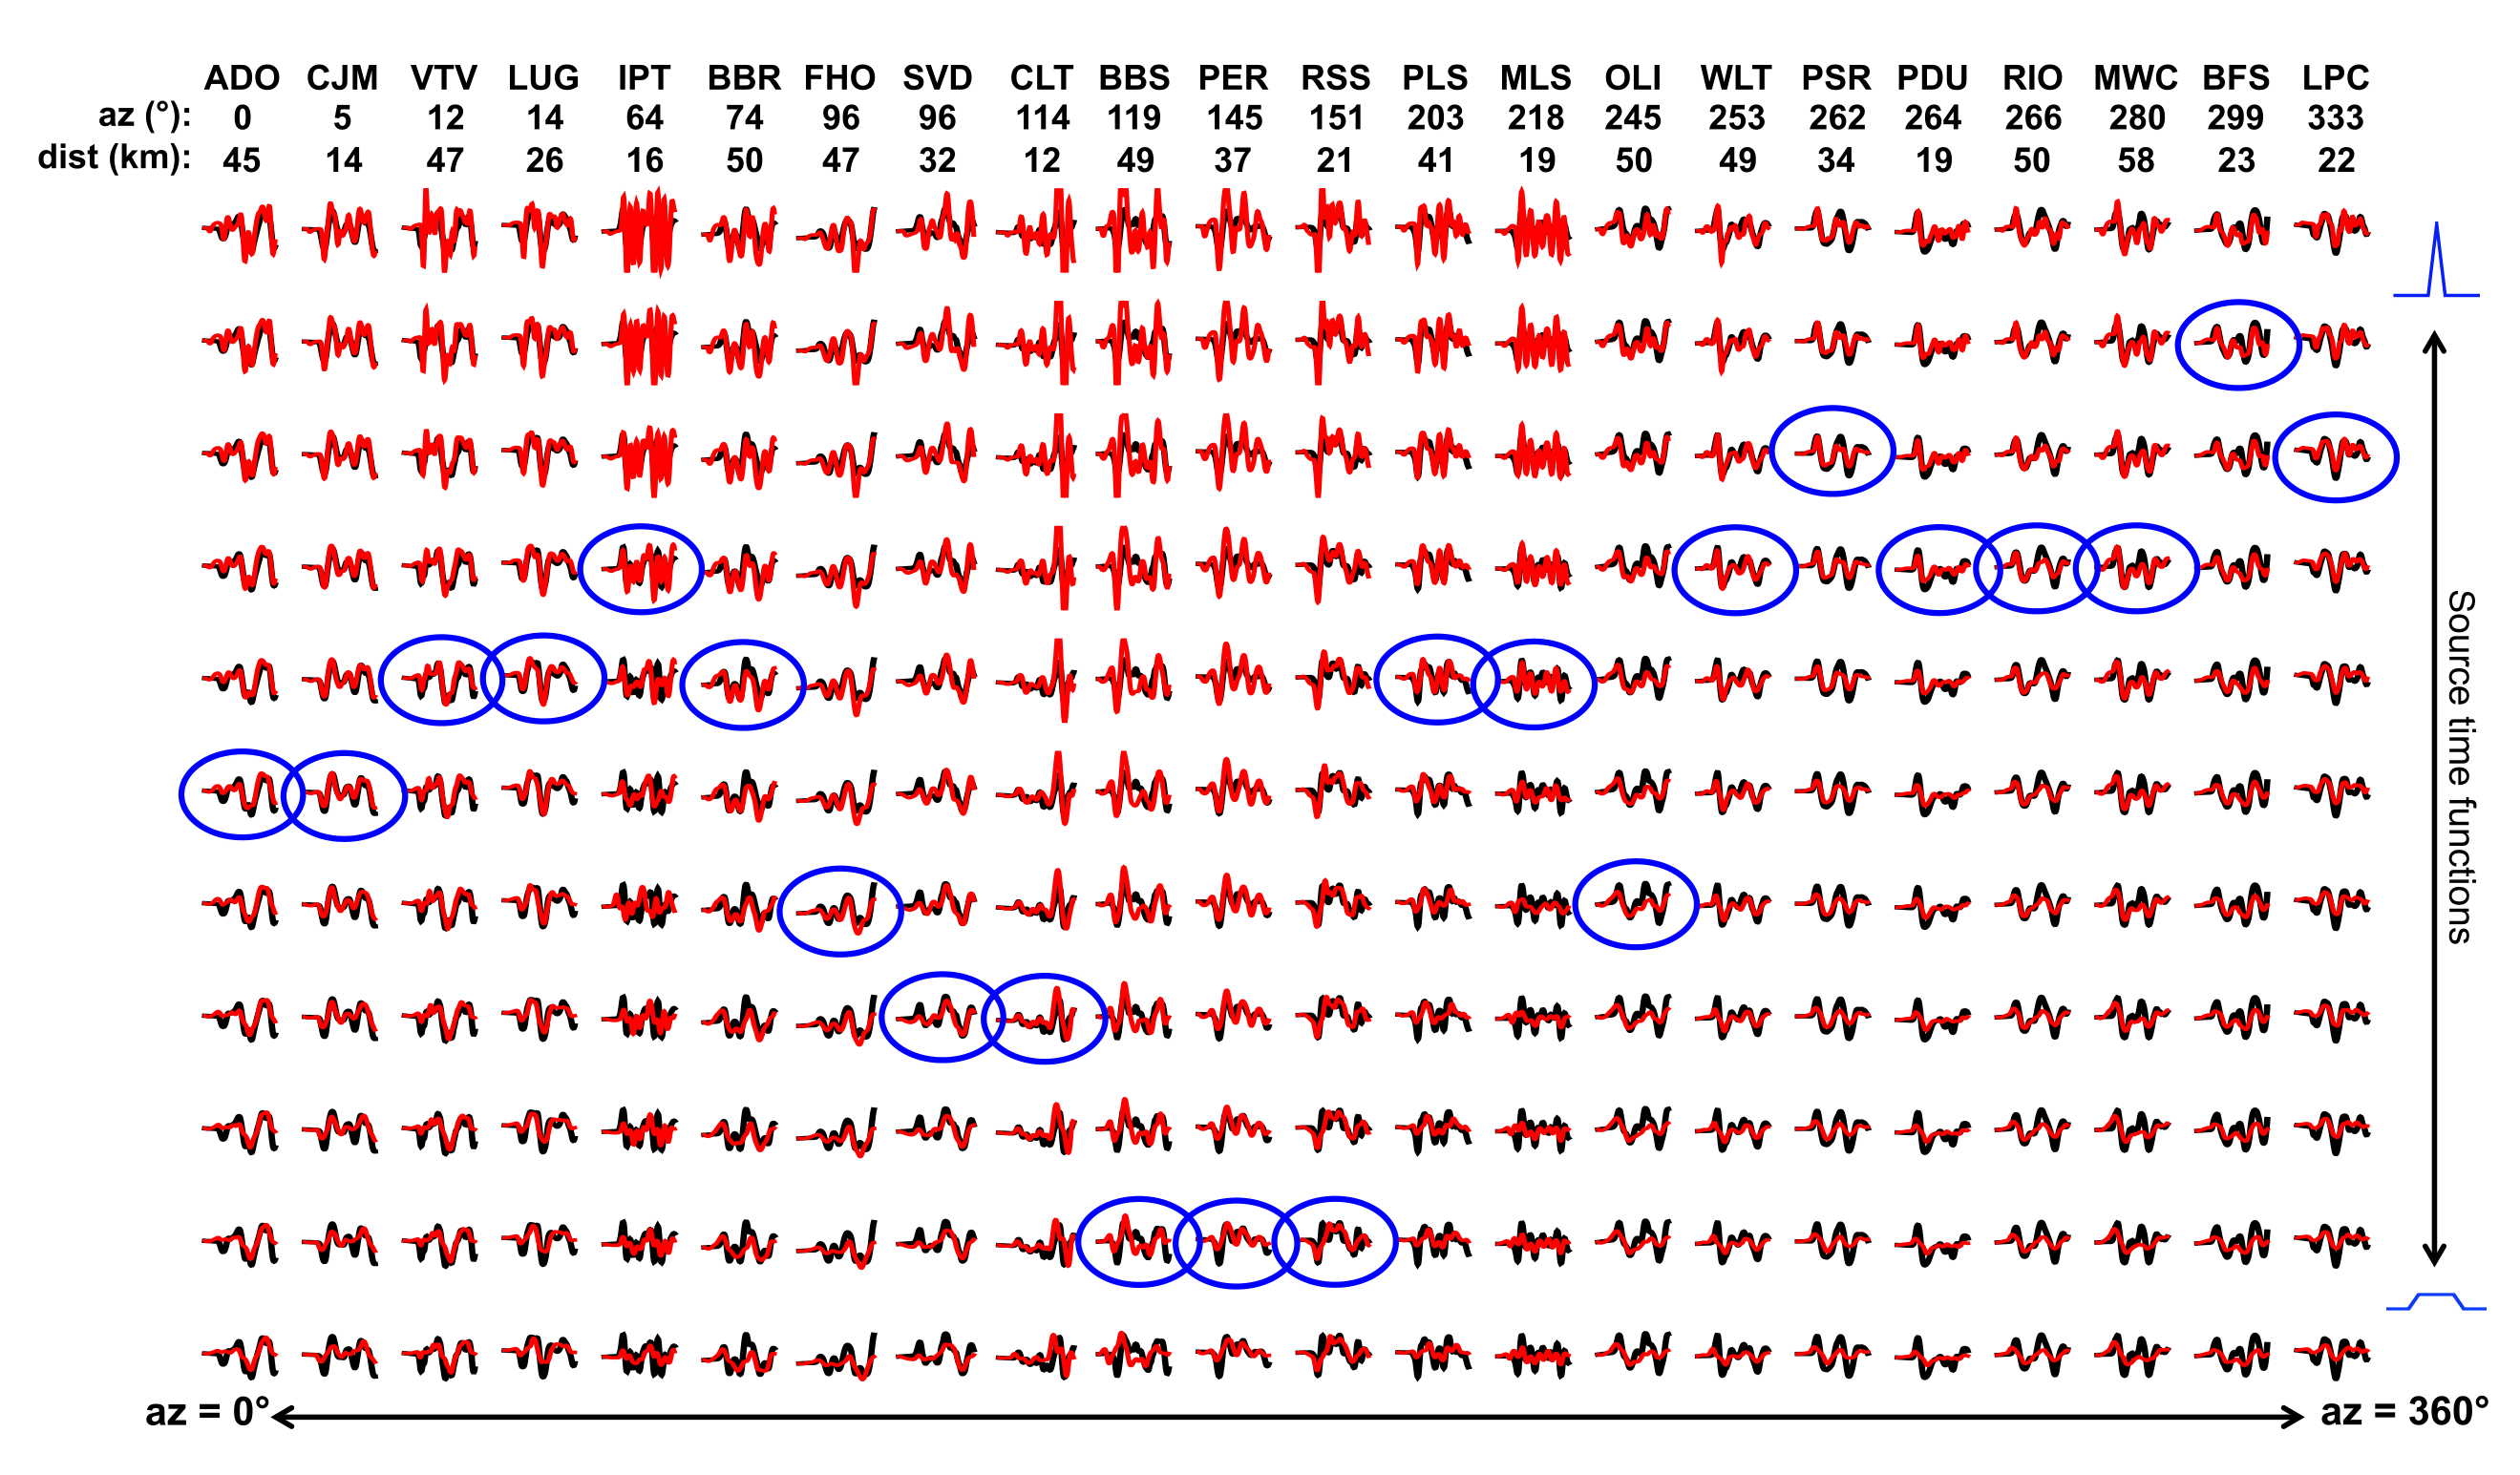
Figure S6. Detailed results of the directivity analysis with 3 s of incoming P wave. A range of STFs, which are used to generate EGFs—convolving with the small event data. Each column represents waveform comparison at each station between data and different EGFs. Data are shown in black and synthetic waveform in red. This analysis includes all CI stations triggered during the small event. Circled are ones with the lowest misfit. Note that stations BBS, PER, and RSS (southeast) and station BFS (northwest) have the best fit with the flattest and sharpest STF, respectively, including rupture directing to northwest.
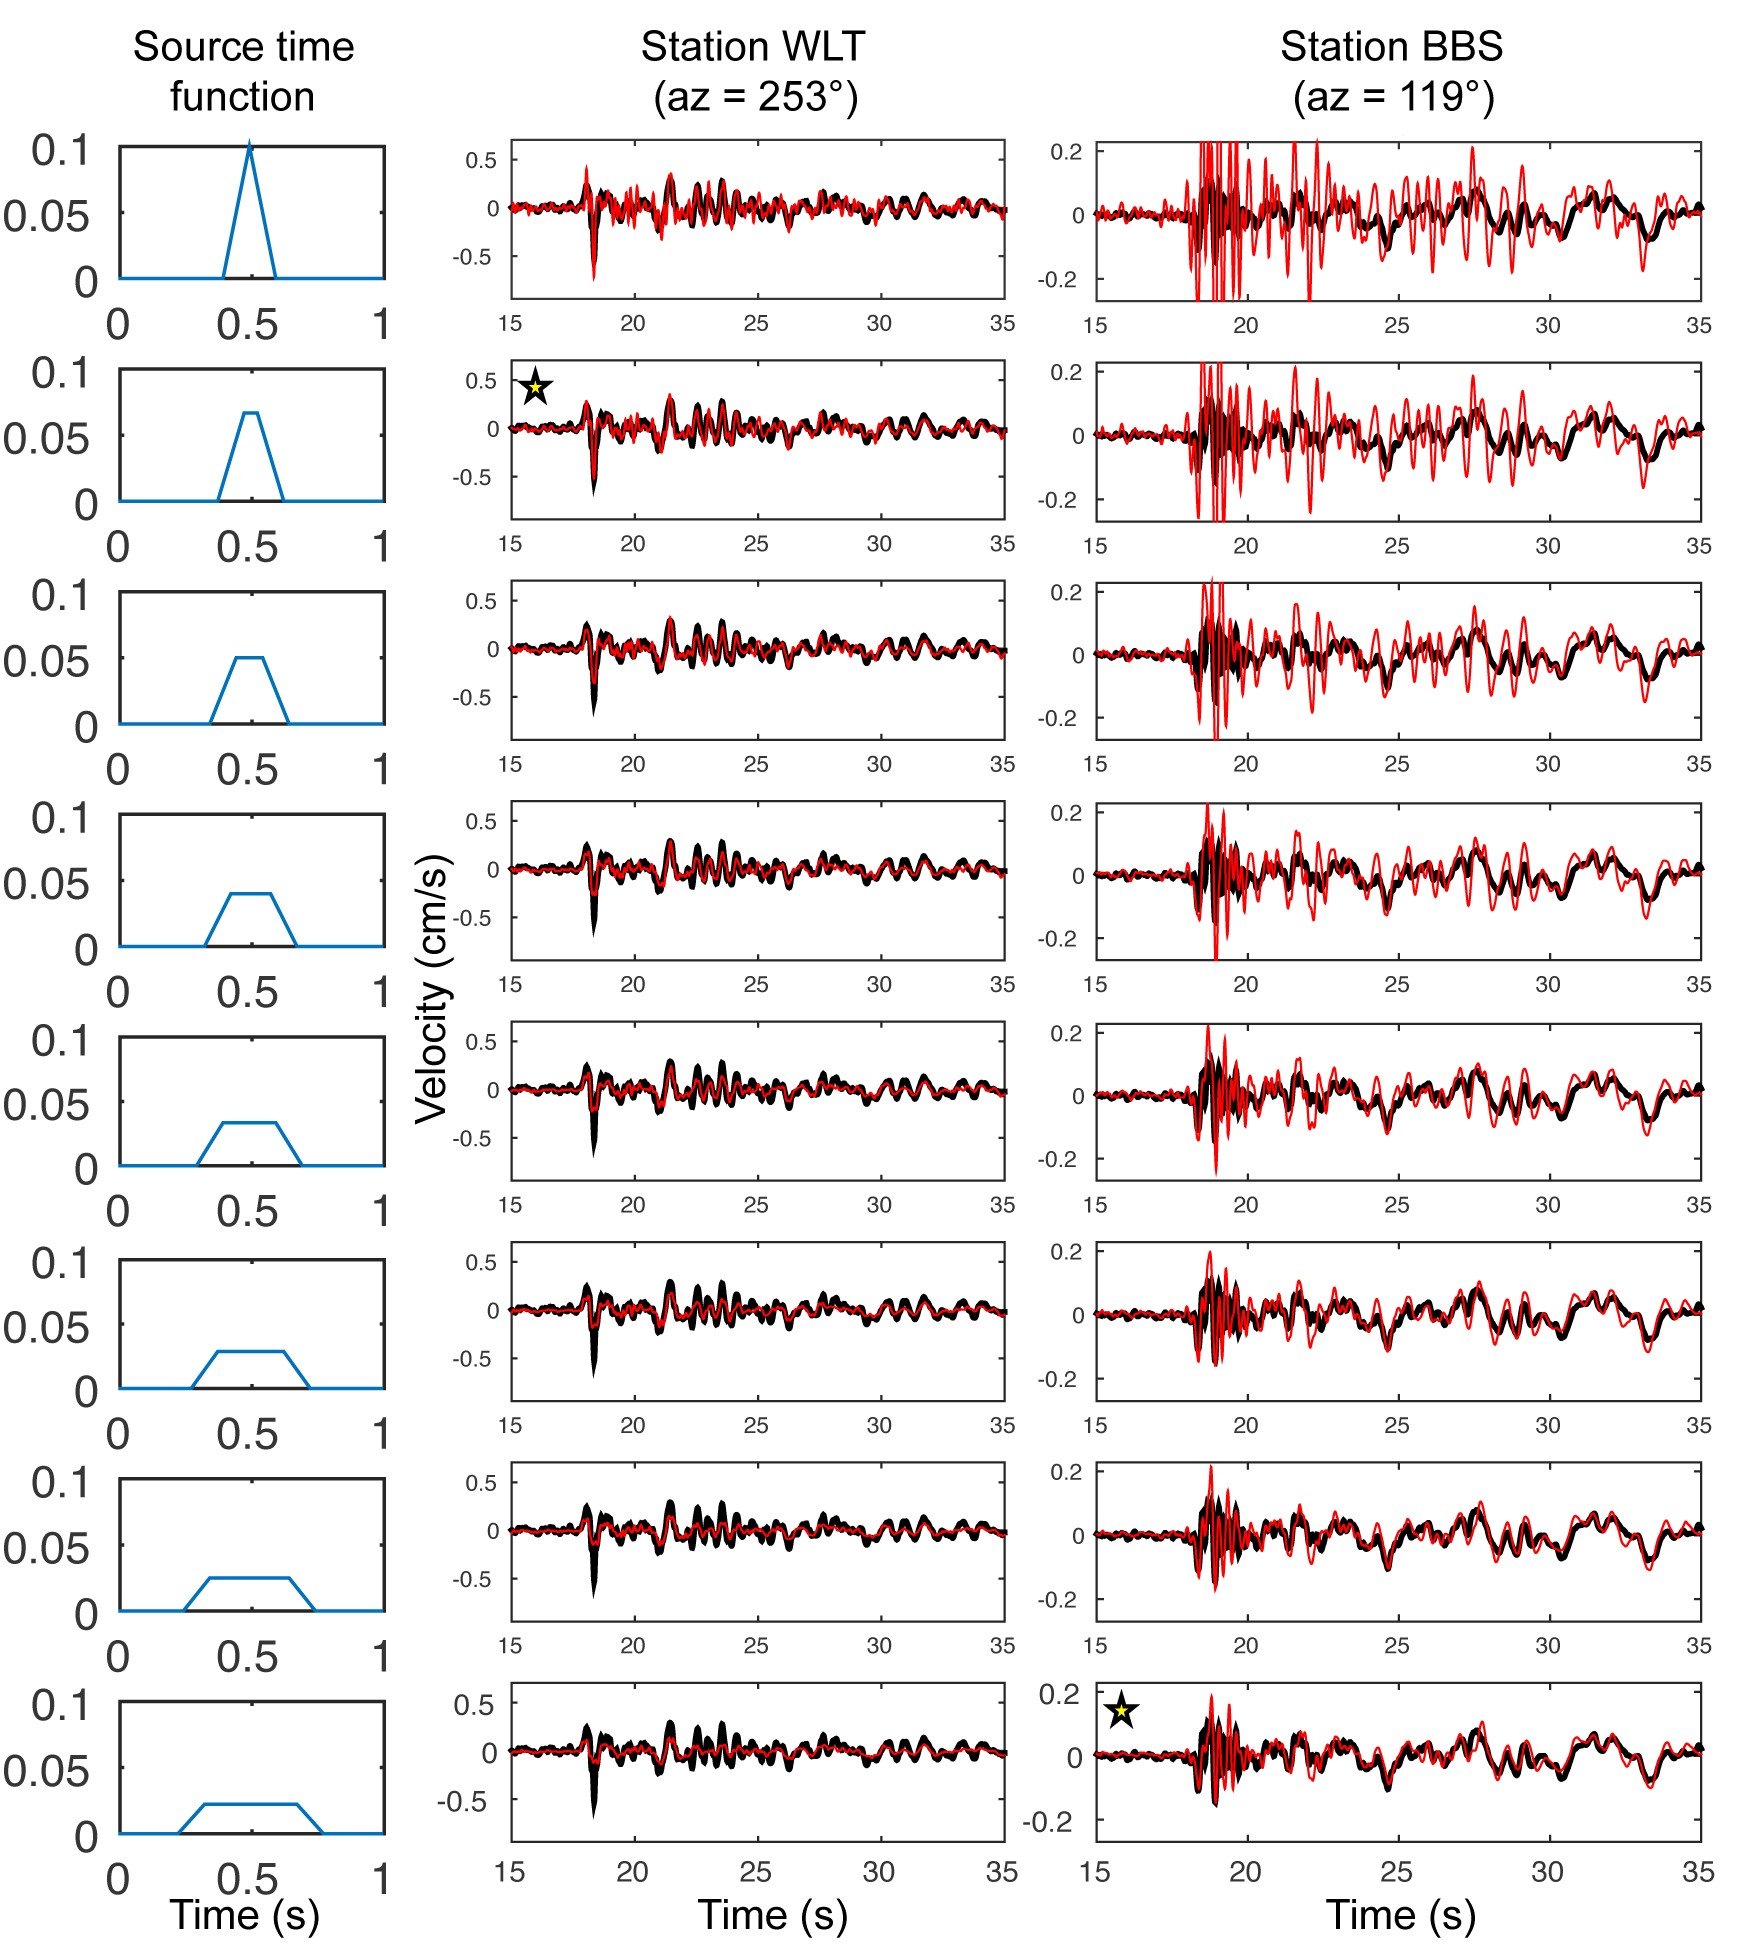
Figure S7. Validating the prediction test. We use different trapezoidal STF to generate EGFs and fit them with the SH waves of the Mw 4.4 shallow event. Yellow stars indicate the best fit between EGF (red) and data (black).
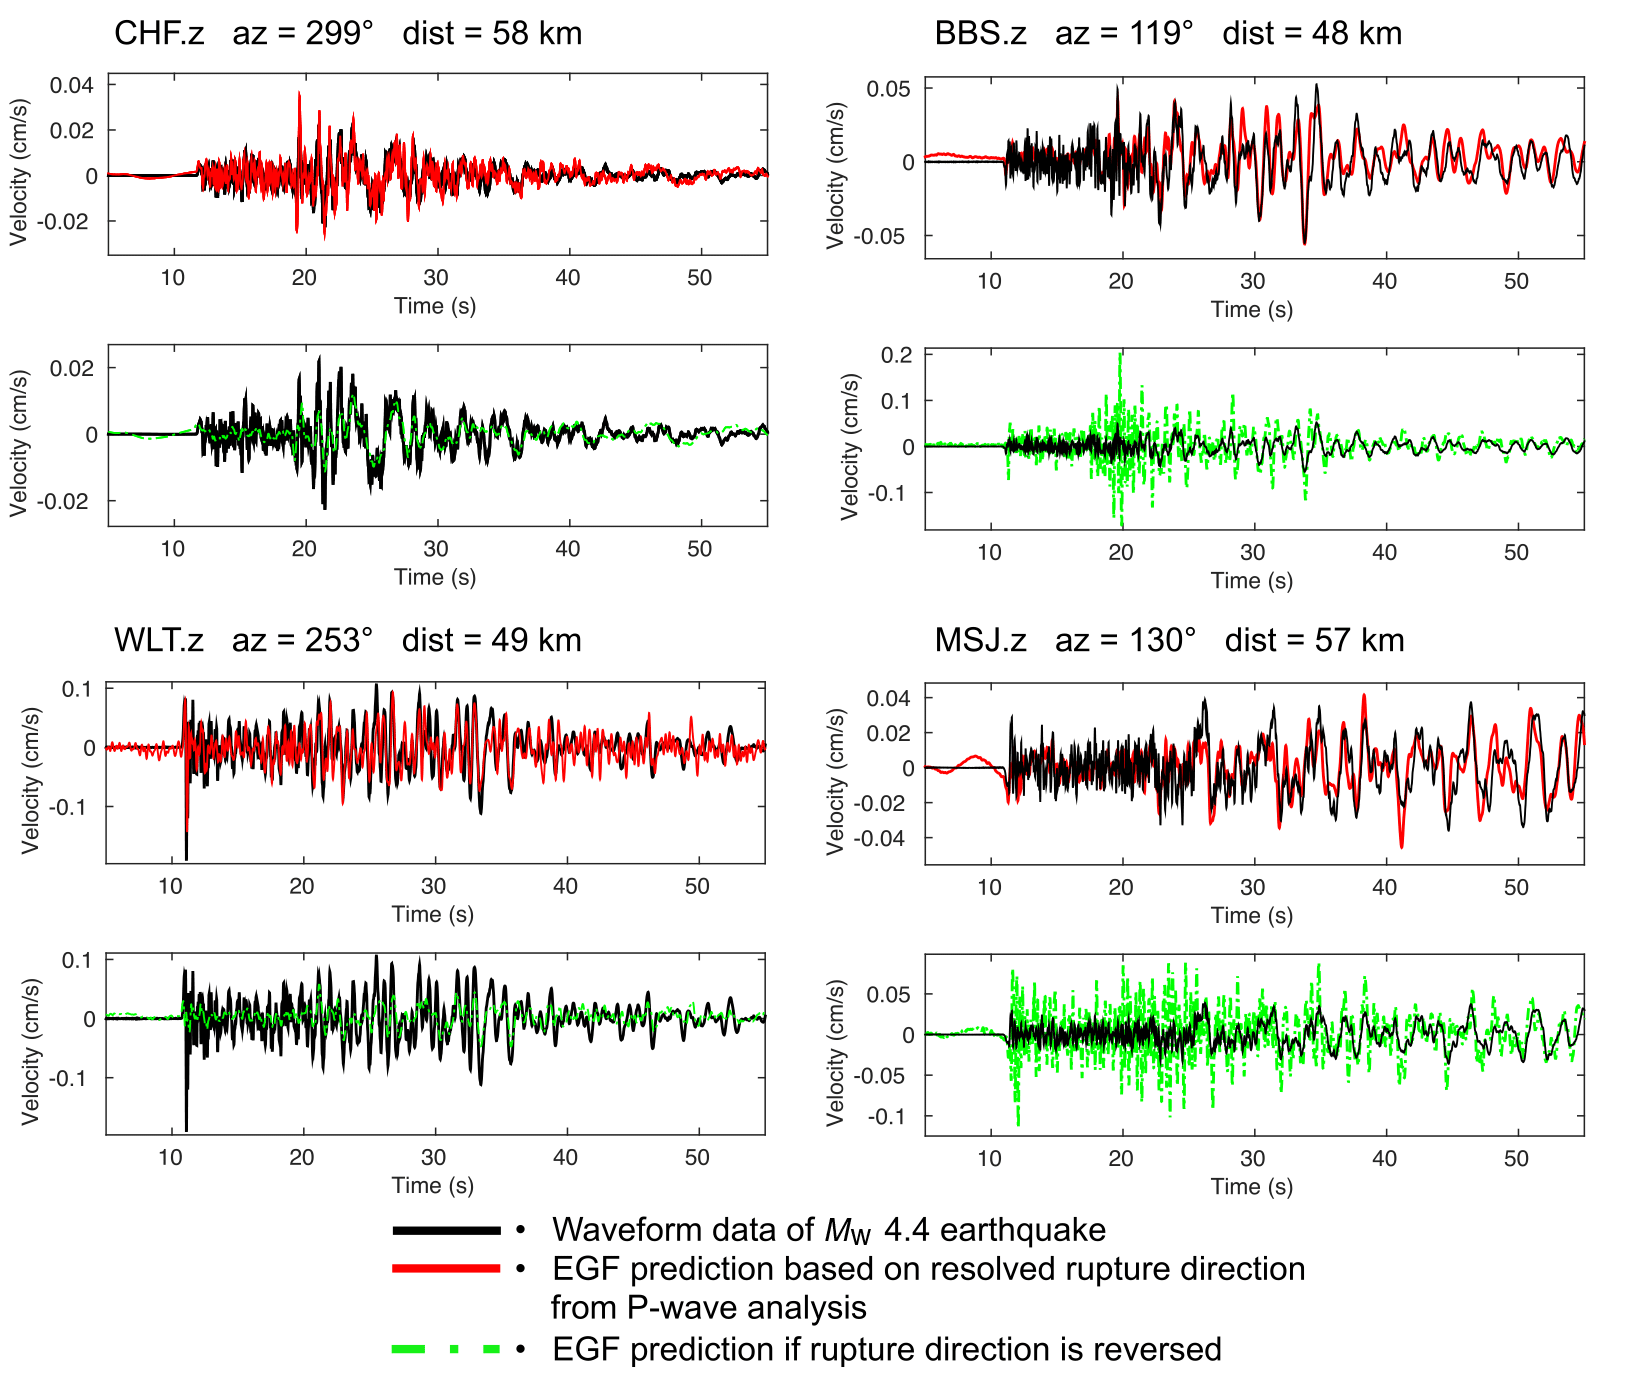
Figure S8. Rayleigh-wave prediction for the same four stations. The analytical STFs are formulated with VS = 3.18 km/s. Results obtained are consistent with the SH-wave prediction—EGFs with a northwest rupture (red) fit the waveform data (black) much better than when rupture direction is reversed (green).
Luo, Y., Y. Tan, S. Wei, D. Helmberger, Z. Zhan, S. Ni, E. Hauksson, and Y. Chen (2010). Source mechanism and rupture directivity of the 18 May 2009 Mw 4.6 Inglewood, California, earthquake, Bull. Seismol. Soc. Am. 100, no. 6, 3269–3277.
[ Back ]