Electronic Supplement to
The Waveform Browser, an Interactive and Intuitive Tool for Exploring Seismic Event Data
by Maximiliano J. Bezada
The following supplementary information gives more technical details on running the Waveform Browser and the format of the input variables. Example files are provided for download.
Calling the Waveform Browser
In order to run the Waveform Browser both wfBrowser.m and wfBrowser.fig must be in the current directory or a directory included in the MATLAB path. Calls to the Waveform Browser admit the following syntax:
>>wfBrowser(traces,eventData)
or
>>wfBrowser(traces,eventData,colorby)
the input arguments must be supplied in that order.
Format of the input variables
The variable holding the trace data should be a 1xN array of structures where N is the number of traces, such as is produced by a call to irisFetch.traces. The structure fields that are used by the Waveform Browser are: “data”, “station”, “latitude”, “longitude”, “sensitivity”, “sensitivityUnits”, “sampleCount” and “sampleRate”.
The variable holding the event data should be a 1x1 structure containing the fields: “lat” (latitude in degrees), “lon” (longitude in degrees) and “depth” (in km). The structure may contain additional fields and this should not interfere with the operation of the browser.
The optional “colorby” input should be a 1x1 structure containing an arbitrary number of fields defined by the user. Each field corresponds to an attribute, and field names should be descriptive, as they will appear in a drop-down menu that allows the user to select between them. Each field should contain a 1xN (or Nx1) vector – where N is the number of traces – containing the attribute values for each trace.
The file SpanishDeepEQ.mat contains an example of each of the input variables. For general information on creating and working with MATLAB structures see http://www.mathworks.com/help/matlab/structures.html.
Running the provided example
To run the provided example, download the three files (wfBrowser.fig, wfBrowser.m, SpanishDeepEQ.mat). Loading the .mat file will put three variables in your workspace (traces, eventData, colorby). Use these variables to call the function wfBrowser as described above.
Matlab Files
- Download/View: wfBrowser.m [MATLAB code; 25 KB]
- Download: wfBrowser.fig [Matlab GUI figure; 16 KB]
- Download: SpanishDeepEQ.mat [Sample Dataset; 770 KB]
Color Figures
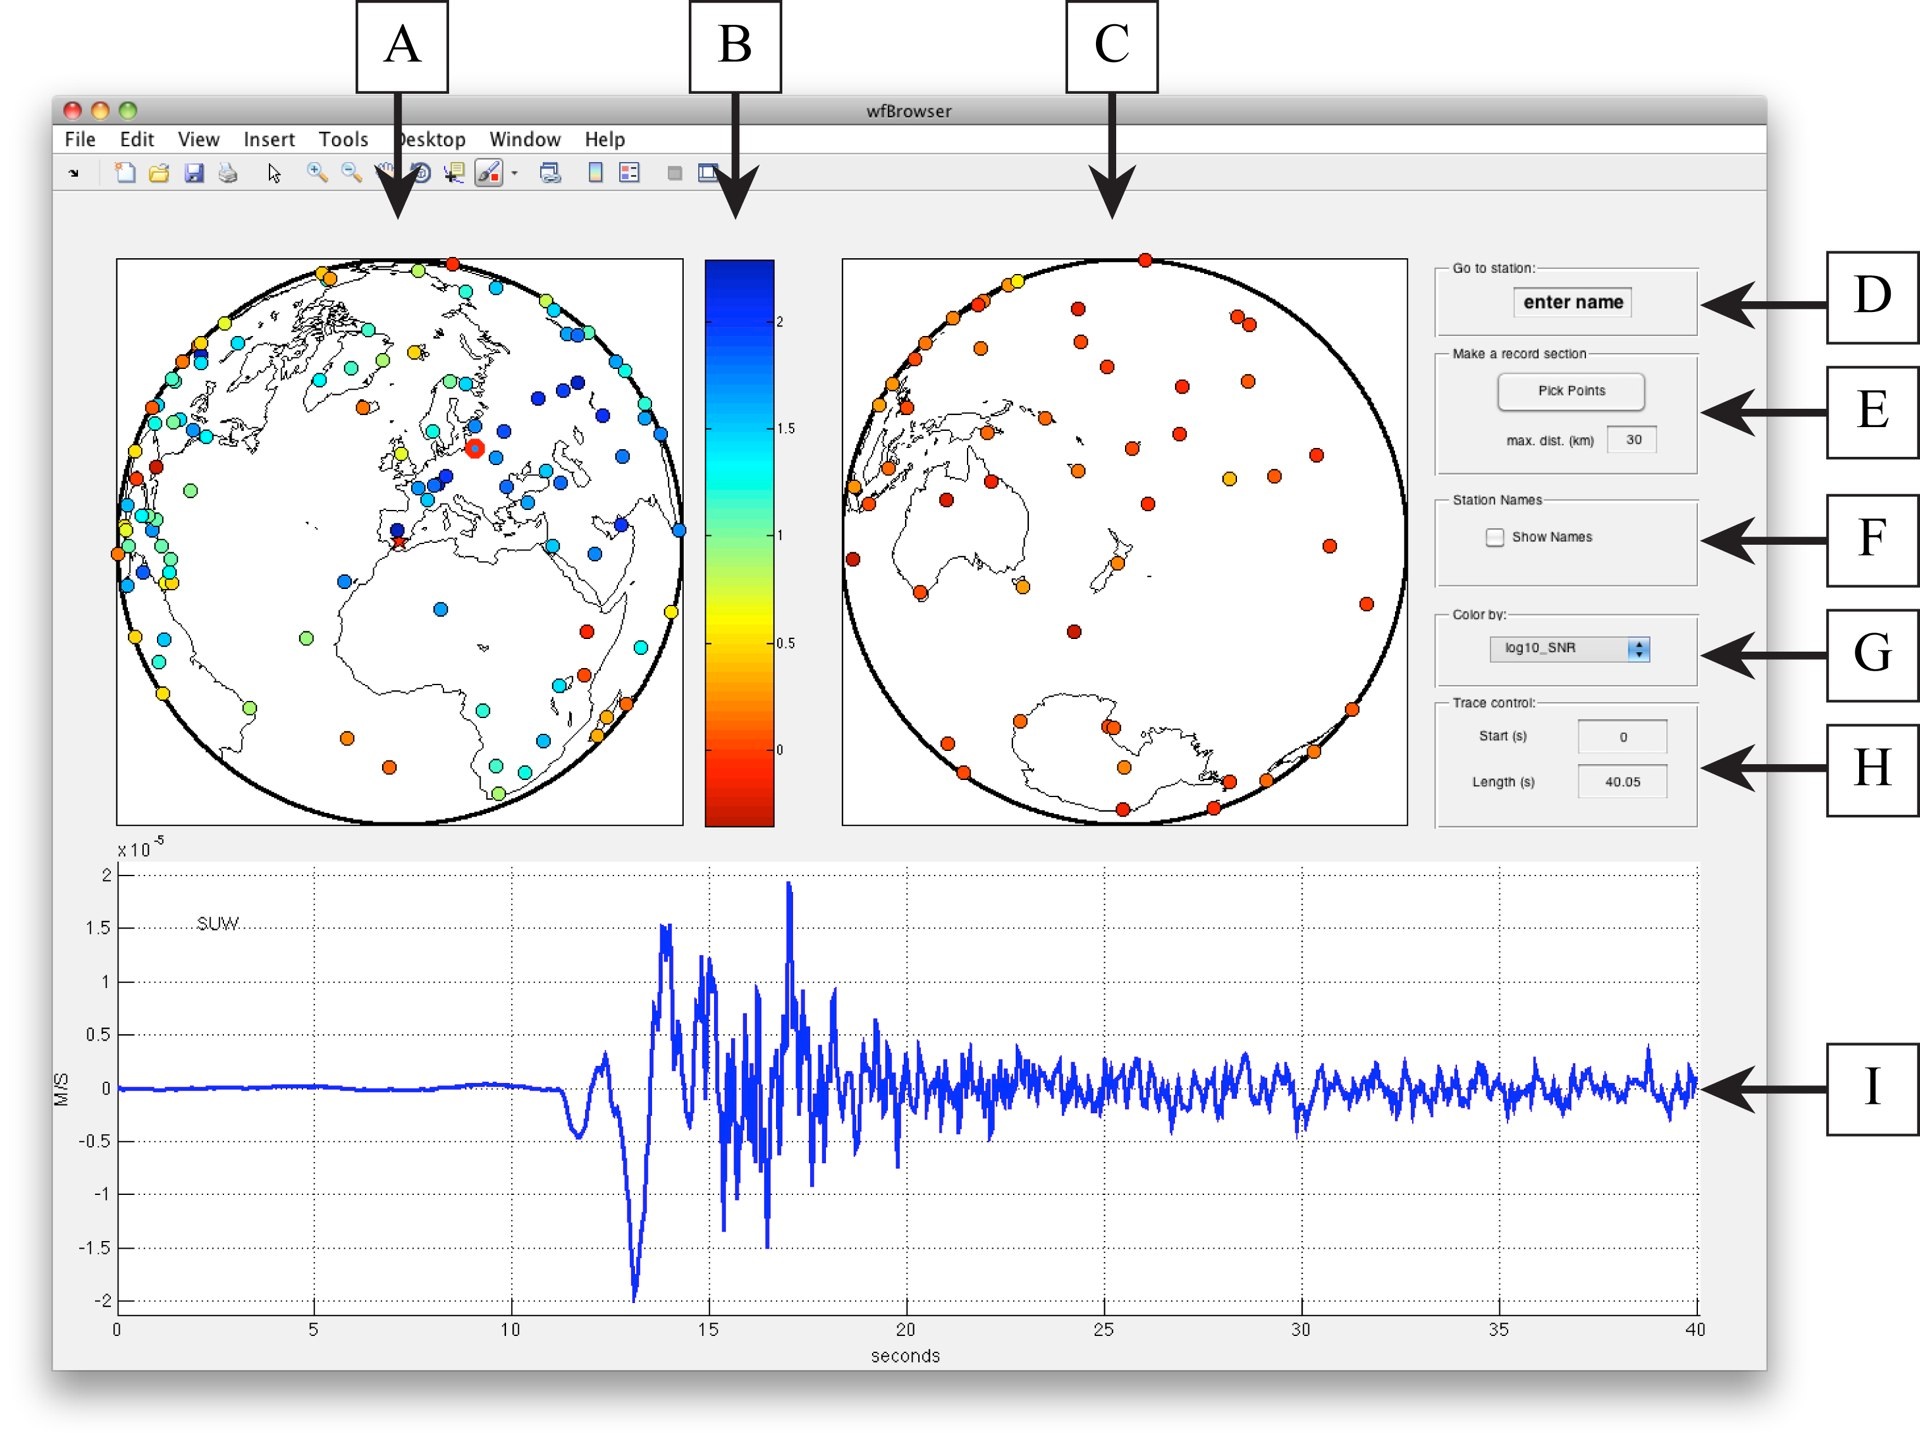
Figure S1. Screenshot of the Waveform Browser indicating each of its elements. A single trace is selected for plotting. A – map centered on event epicenter; B – color scale, only present if the input “colorby” is supplied; C – map centered on the event antipode; D – “Go to station” panel, allows for selecting a station by name; E – “Make a record section” panel, allows the user to draw a profile on the map, the browser then displays a record section along that profile; F – “Station names” panel, allows the user to enable/disable the display of station names; G – “Color by” panel, only active if a “colorby” input was supplied, allows the user to choose attributes for color-coding the stations; H – “Trace control” panel, specifies the length and location along the trace of the plotting window; I – waveform axes, where the trace or record section is plotted. Click on the image for a larger version.
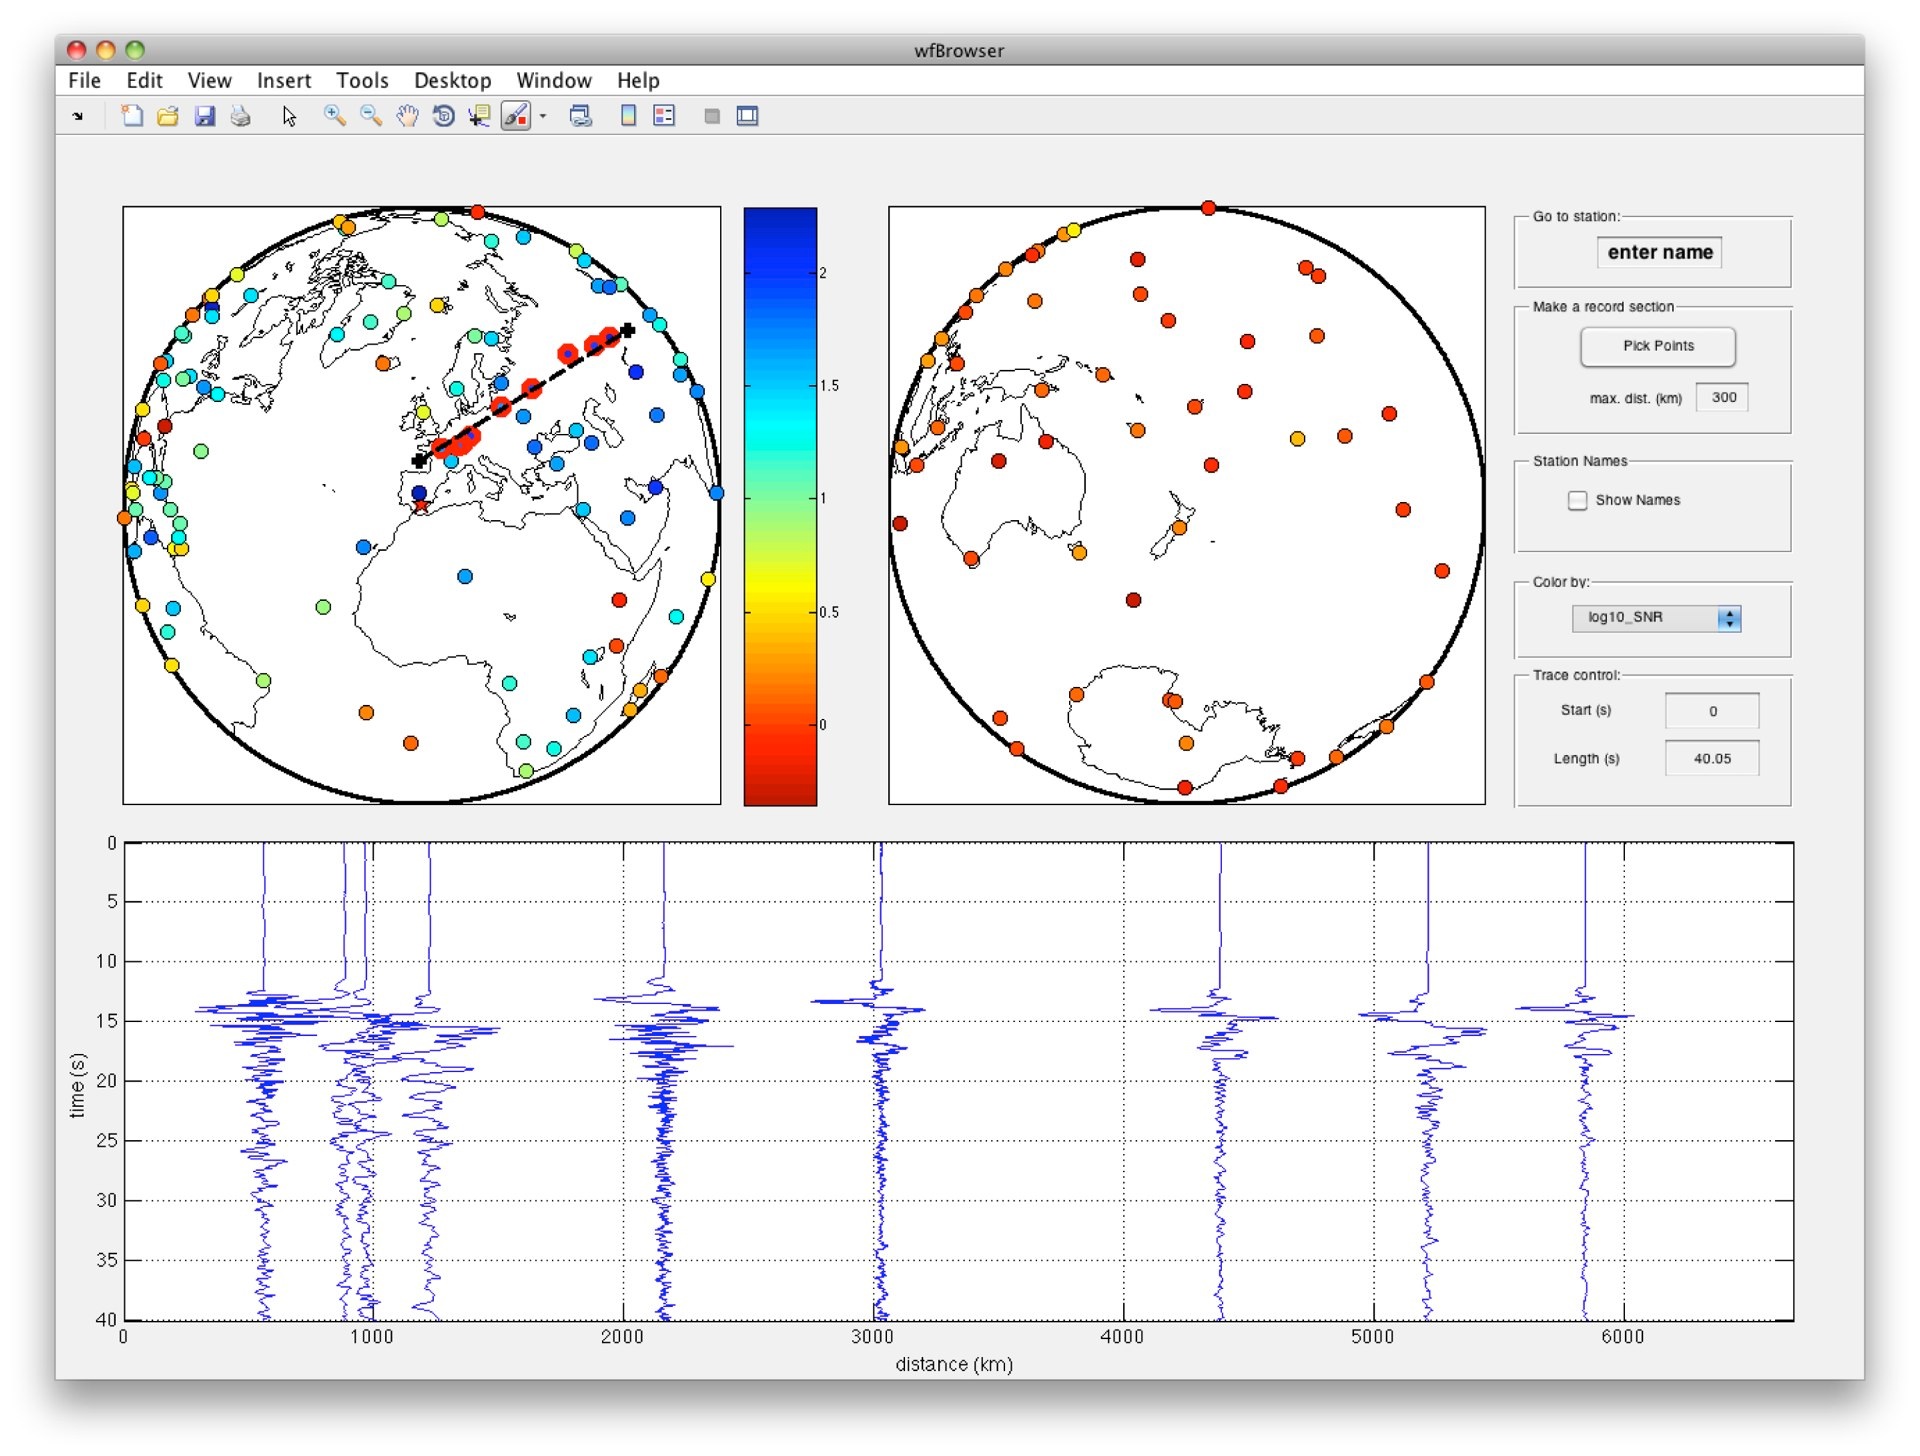
Figure S2. Screenshot of Waveform Browser showing a record section. A profile has been drawn on the map and all stations within 300 km from the profile are included in the section. The horizontal position of the records on the axes corresponds to their location along the profile. Click on the image for a larger version.
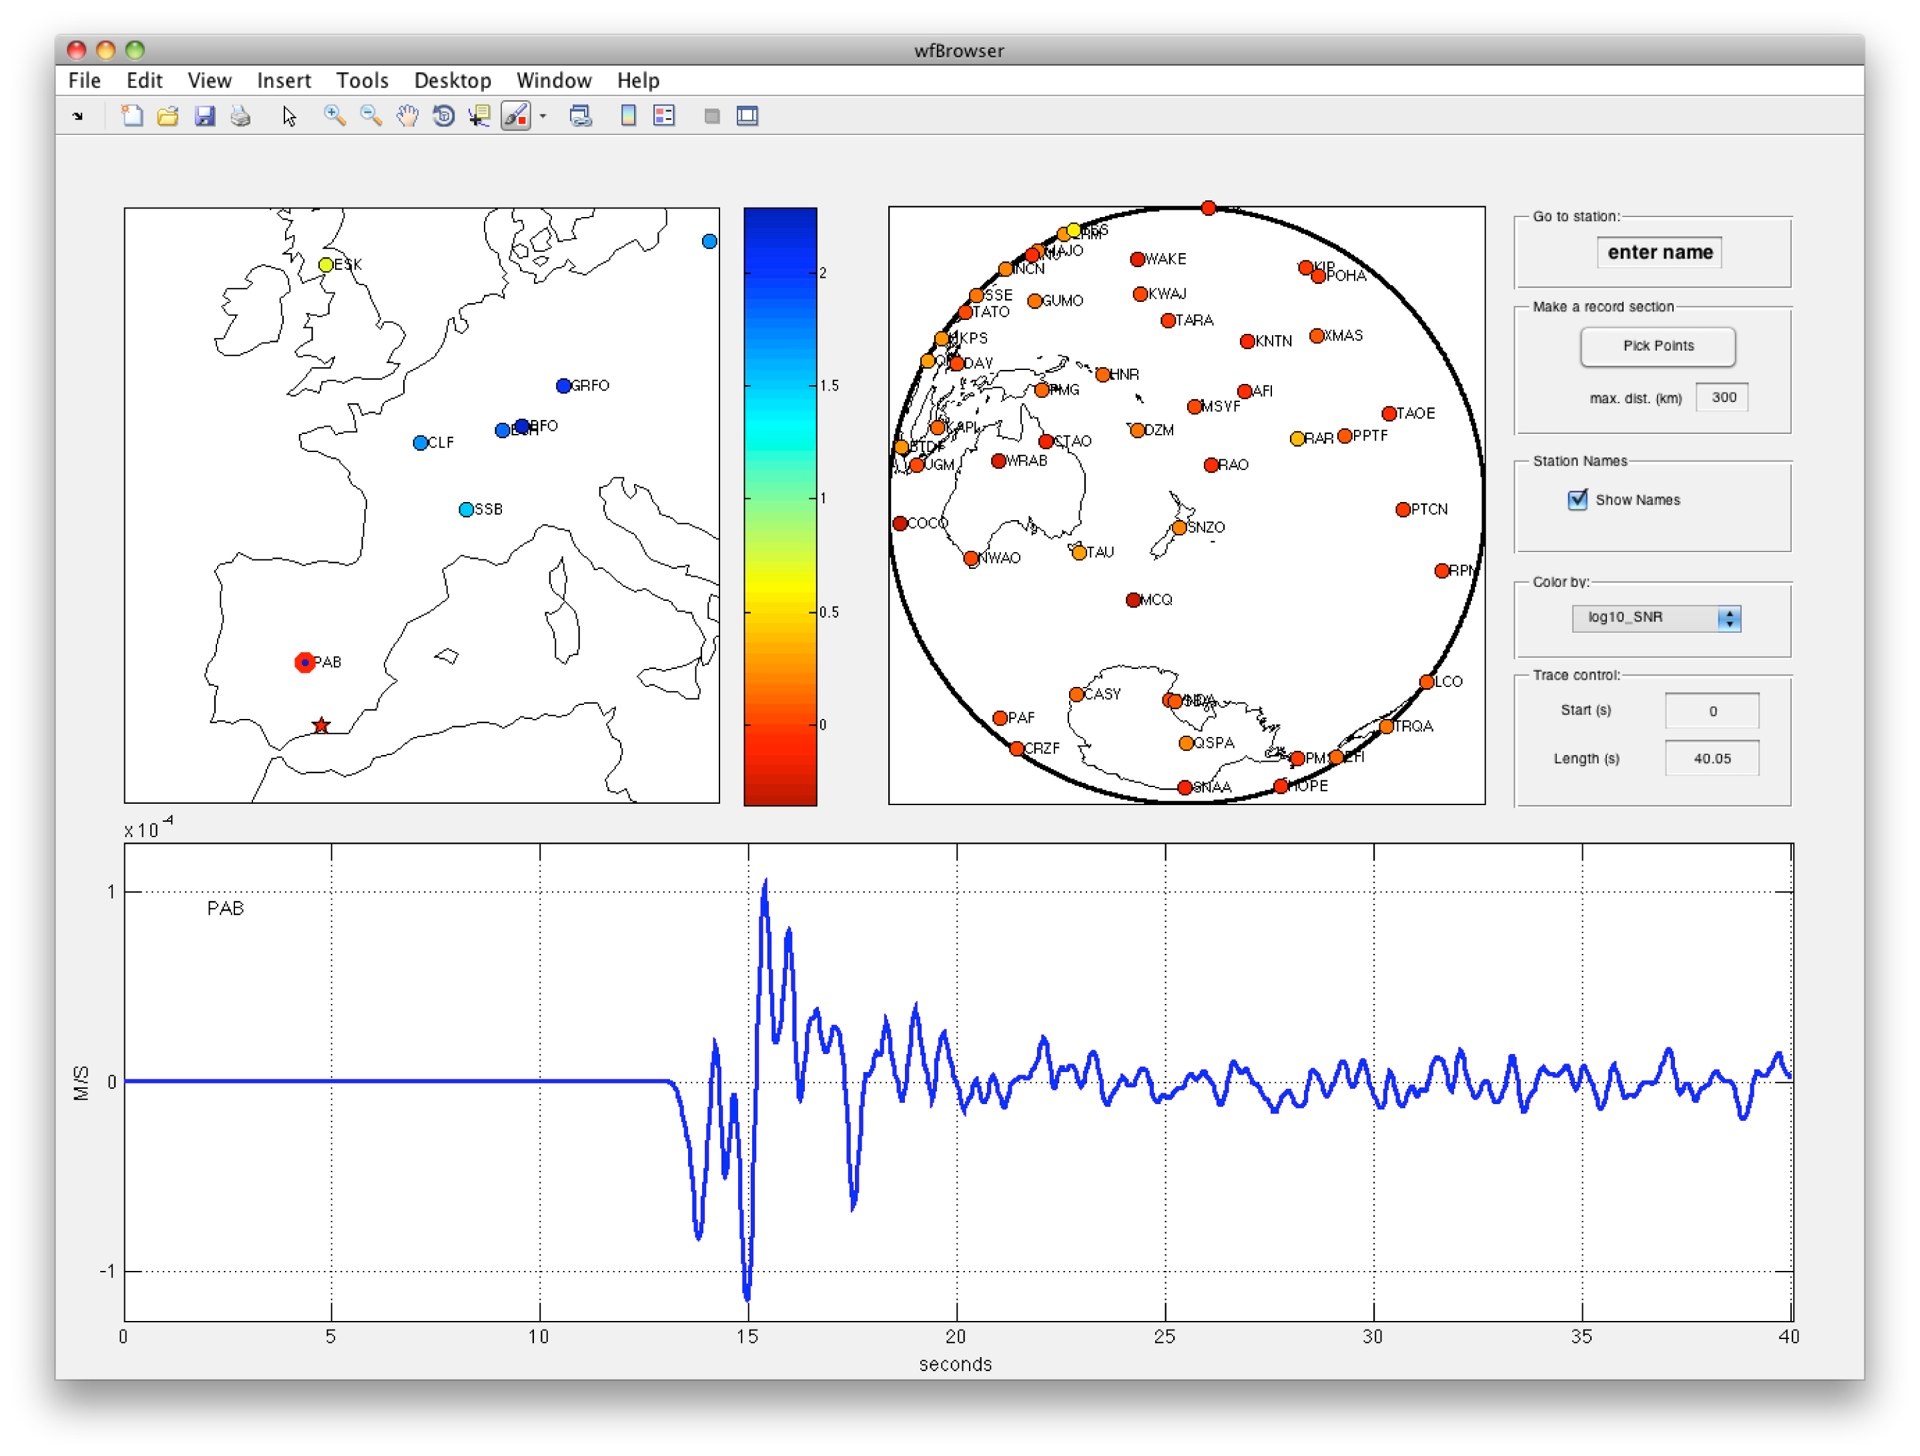
Figure S3. Screenshot of Waveform Browser, showing a zoomed-in map with station names plotted. Station name plotting is disabled by default and can be toggled with a checkbox (Fig. S1F). Click on the image for a larger version.
[ Back ]