Electronic Supplement to
MSATSI: A MATLAB Package for Stress Inversion Combining Solid Classic Methodology, a New Simplified User-Handling and a Visualization Tool
by Patricia Martínez-Garzón, Grzegorz Kwiatek, Michèle Ickrath and Marco Bohnhoff
Complete results from 3D example
This supplement shows the complete stress inversion results obtained in the example of 3D synthetic analysis for the different values of fraction of correctly picked fault planes tested. Red:S1, Green:S2, Blue:S3. Solid lines: best solution. Colored dots: 95% confidence interval.
Figures
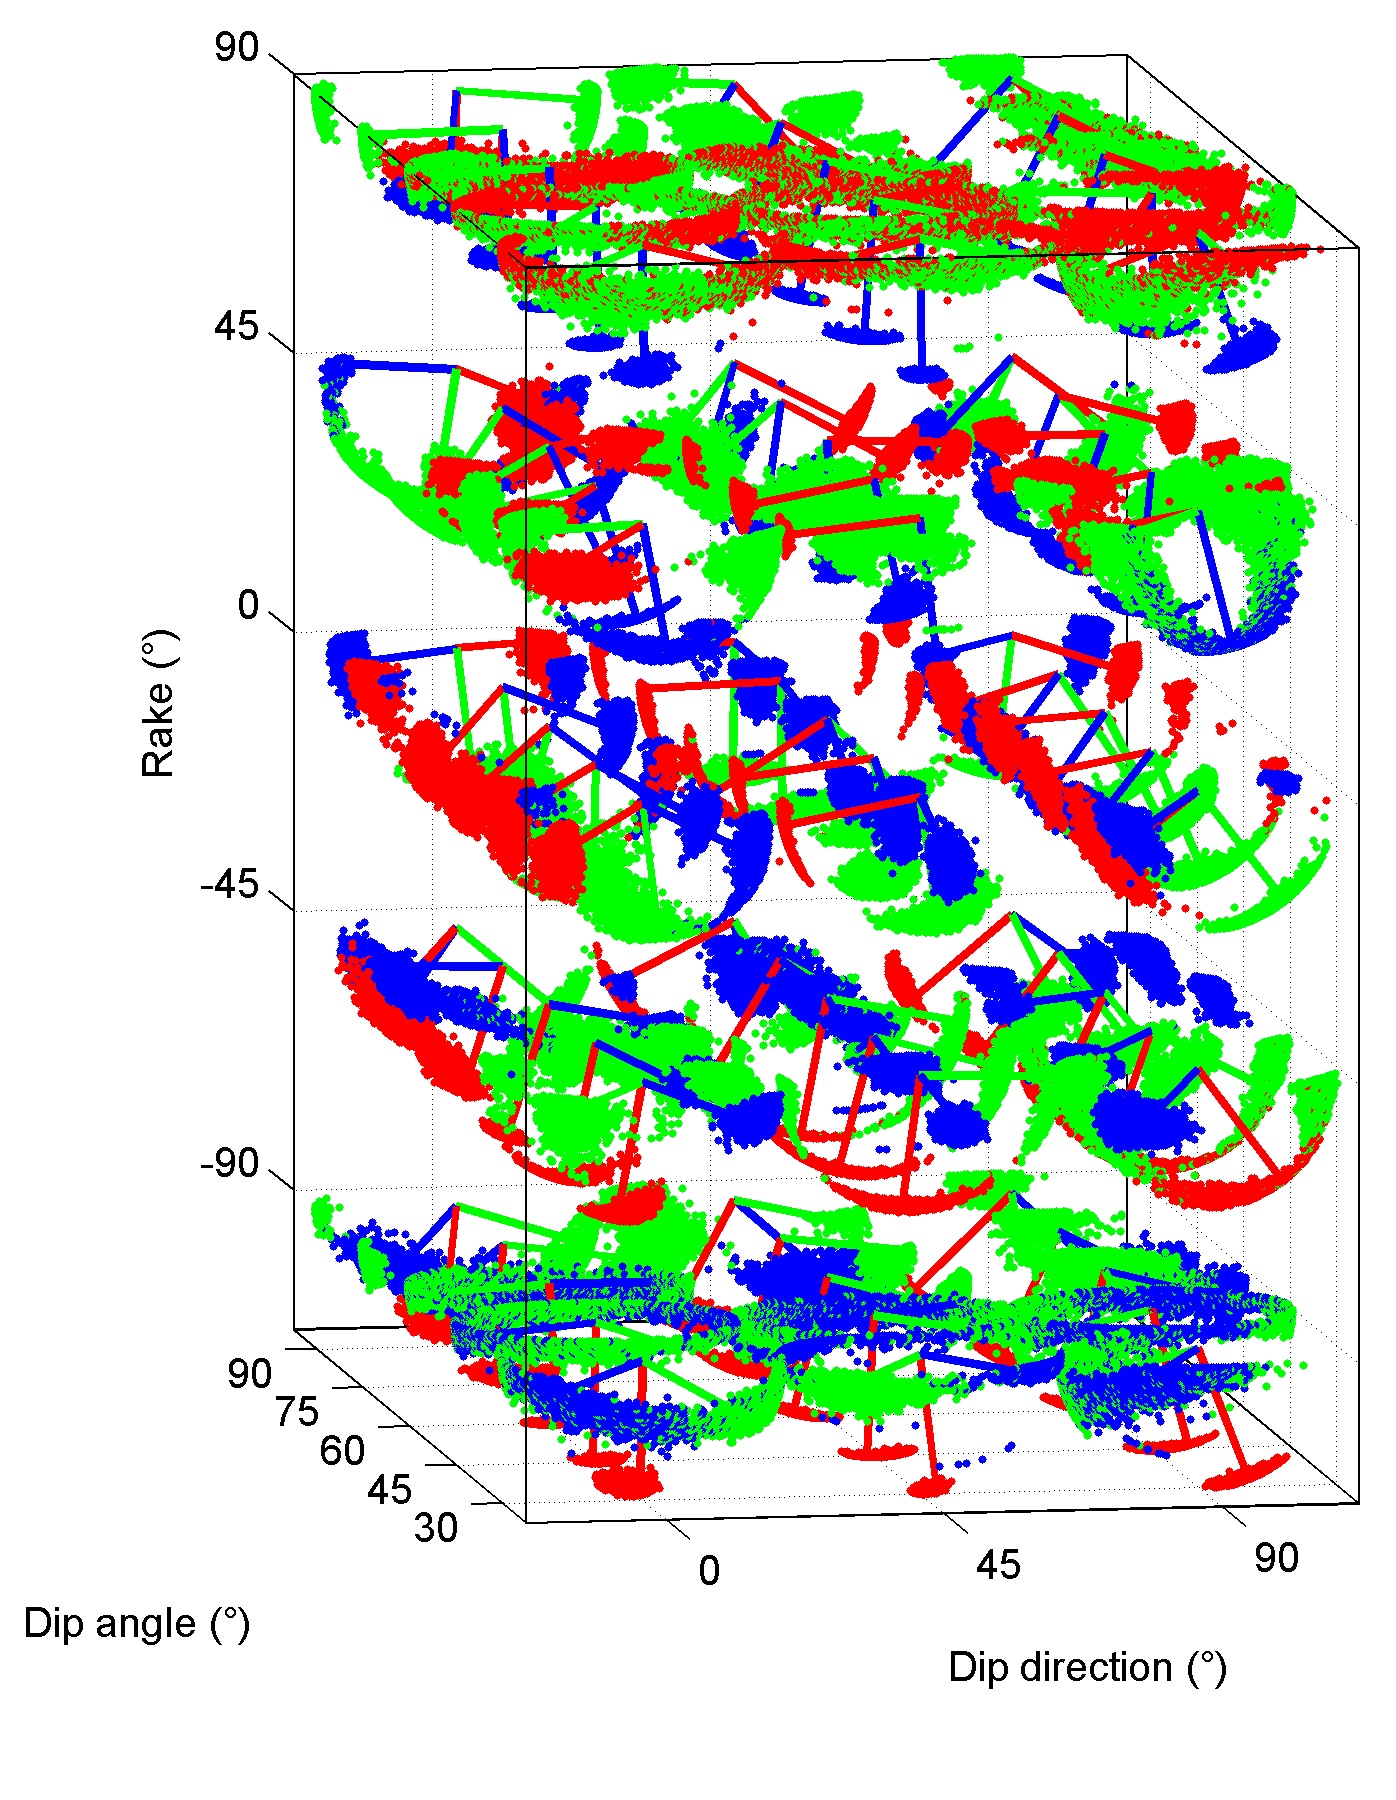
▲Figure S1a. 3D stress field orientation map assuming that all specified fault planes are correct (i.e. the fraction of correctly picked fault planes F = 1).
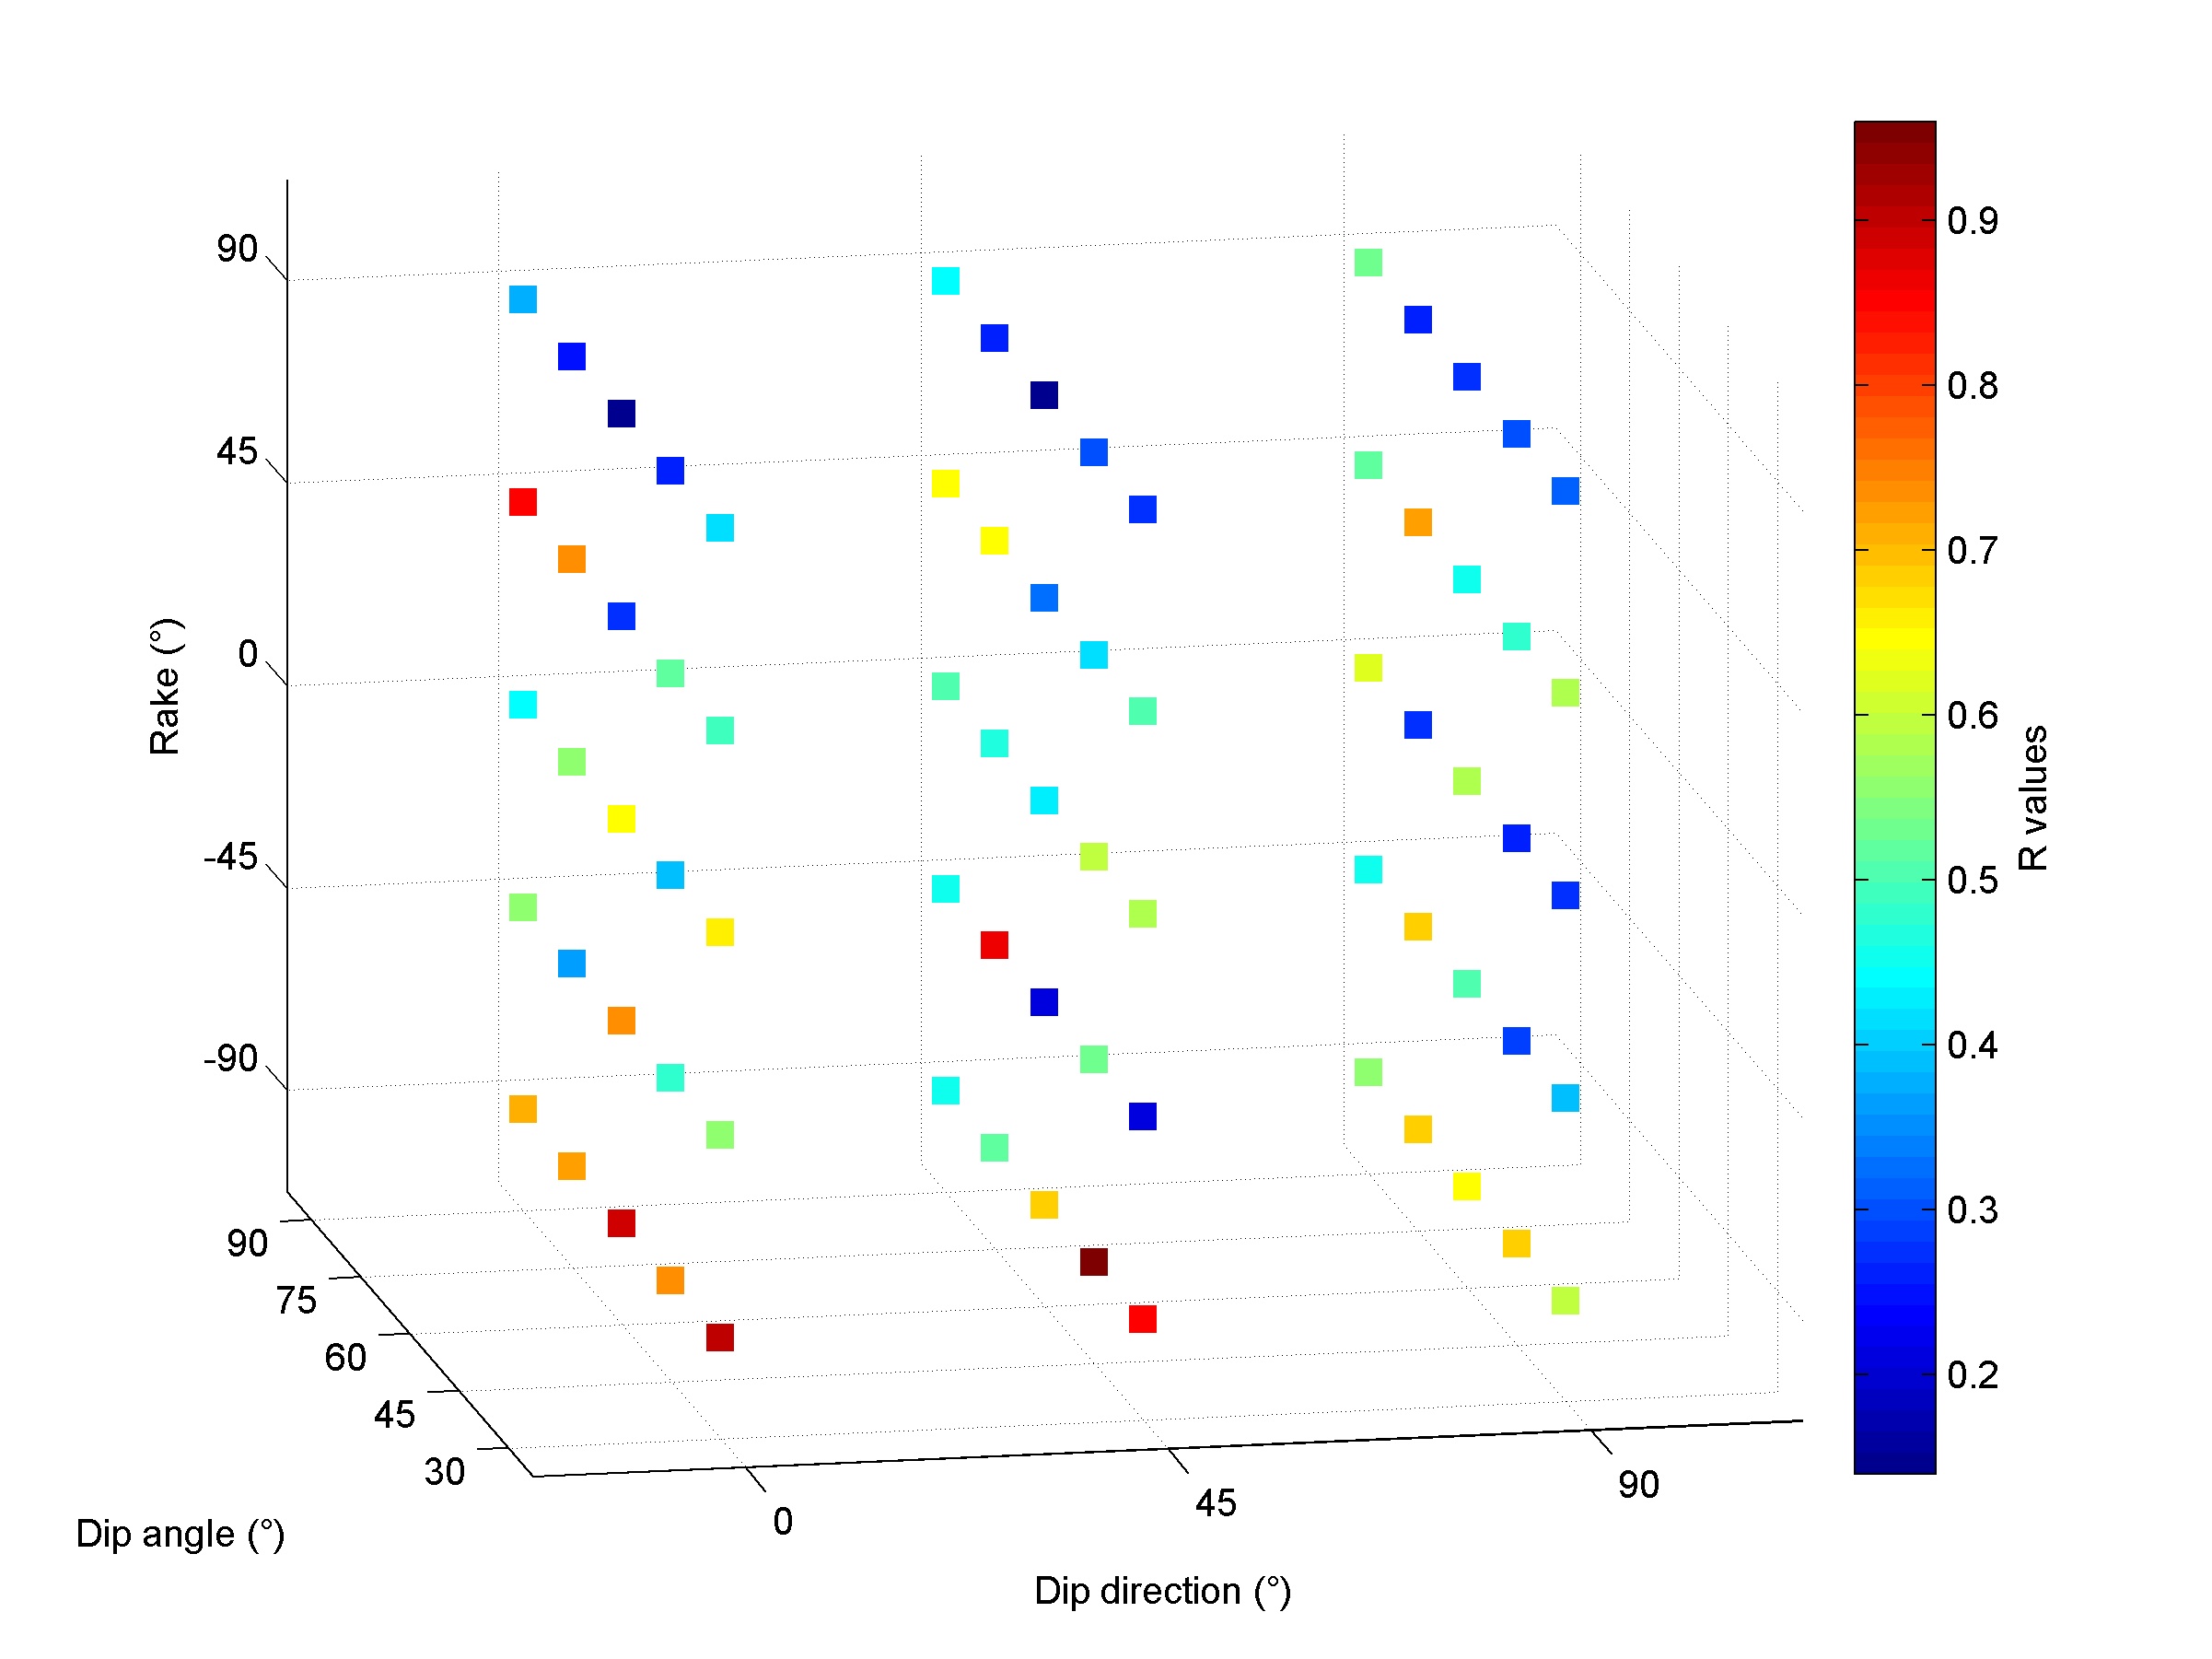
▲Figure S1b. Relative stress magnitude for the stress inversions results shown in figure S1a.
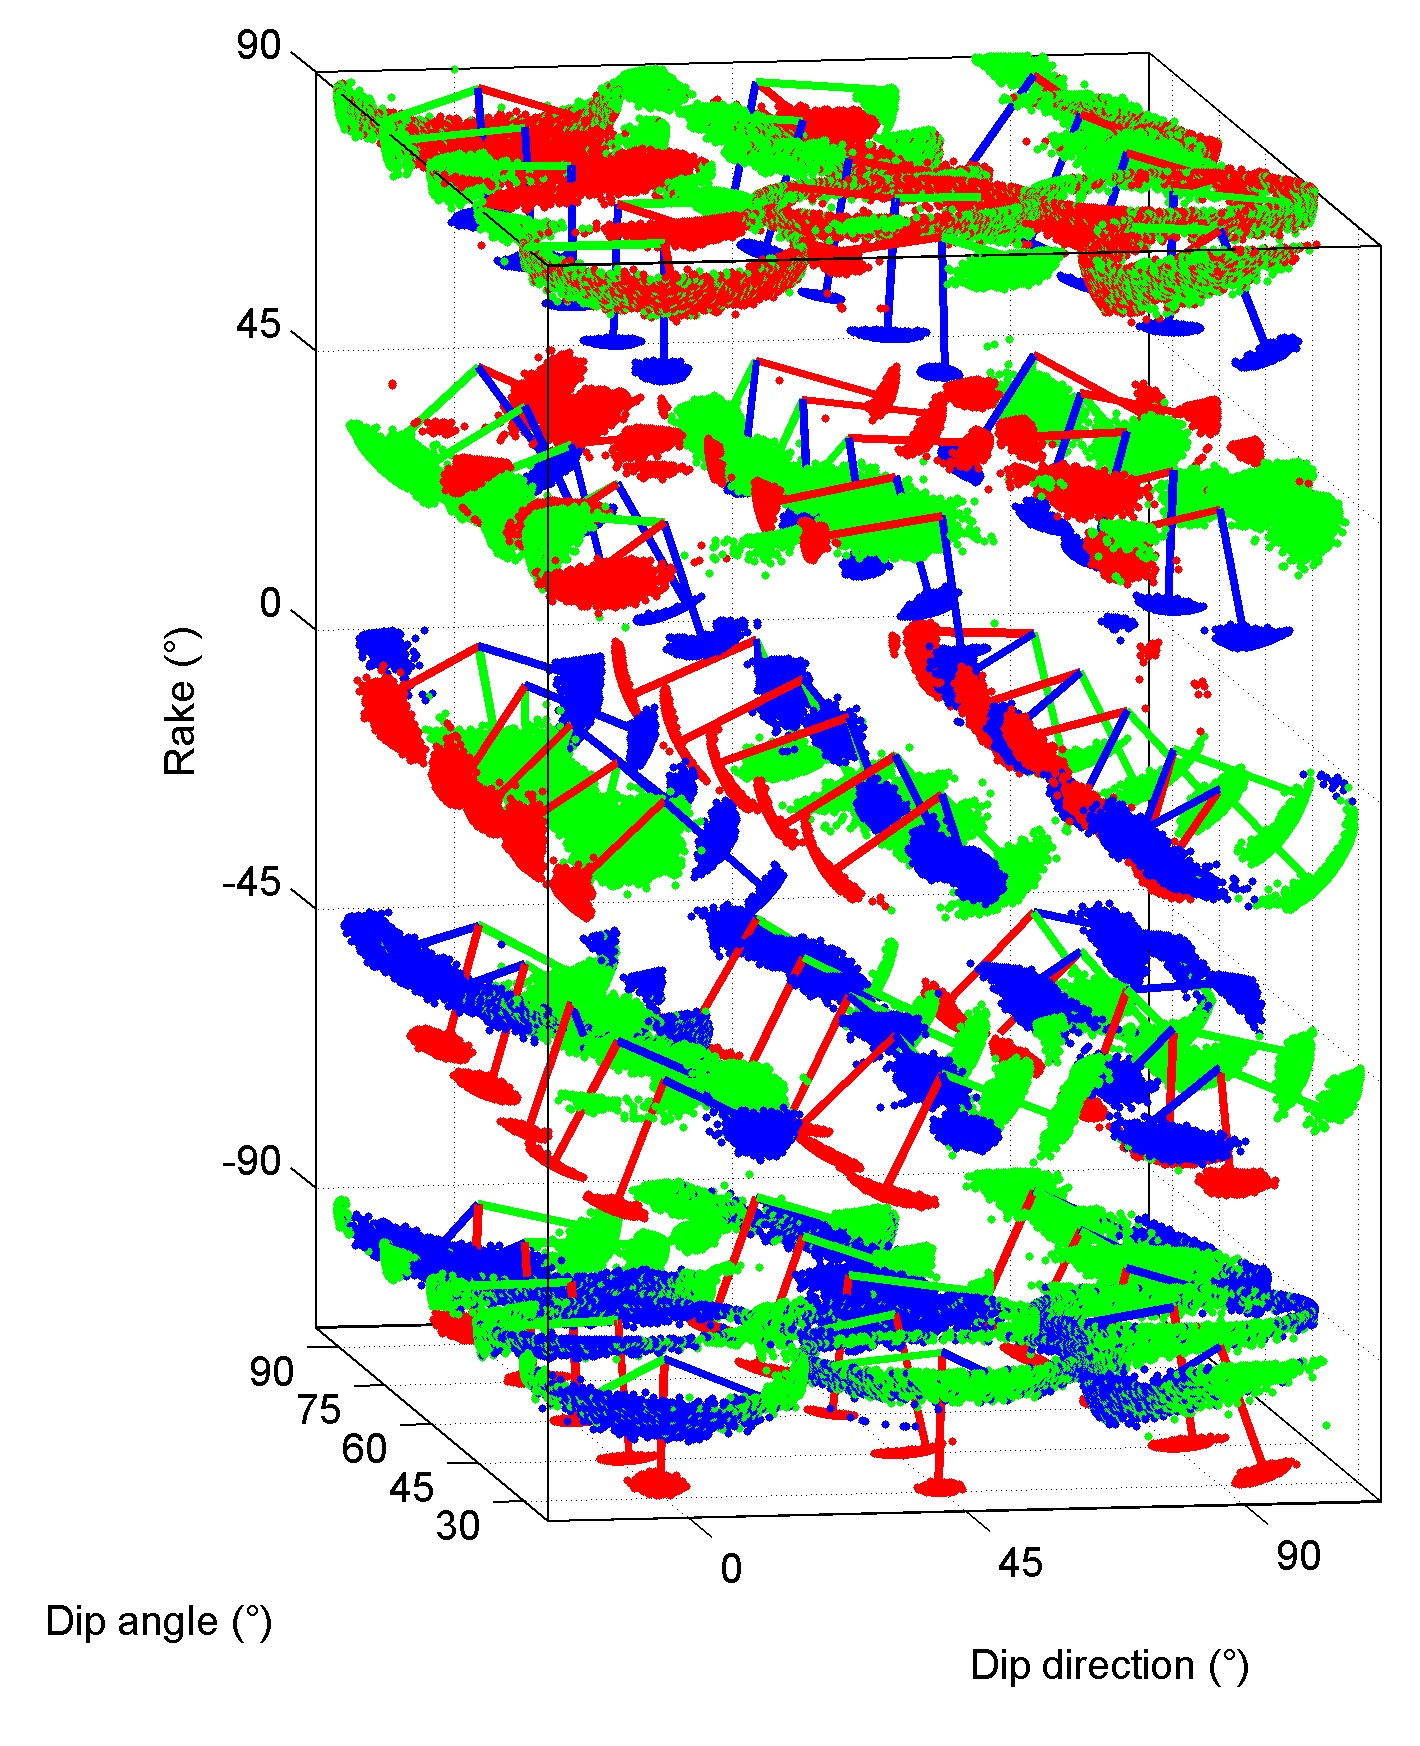
▲Figure S2a. 3D stress field orientation map assuming that the fraction of correctly picked fault planes is F = 0.5.
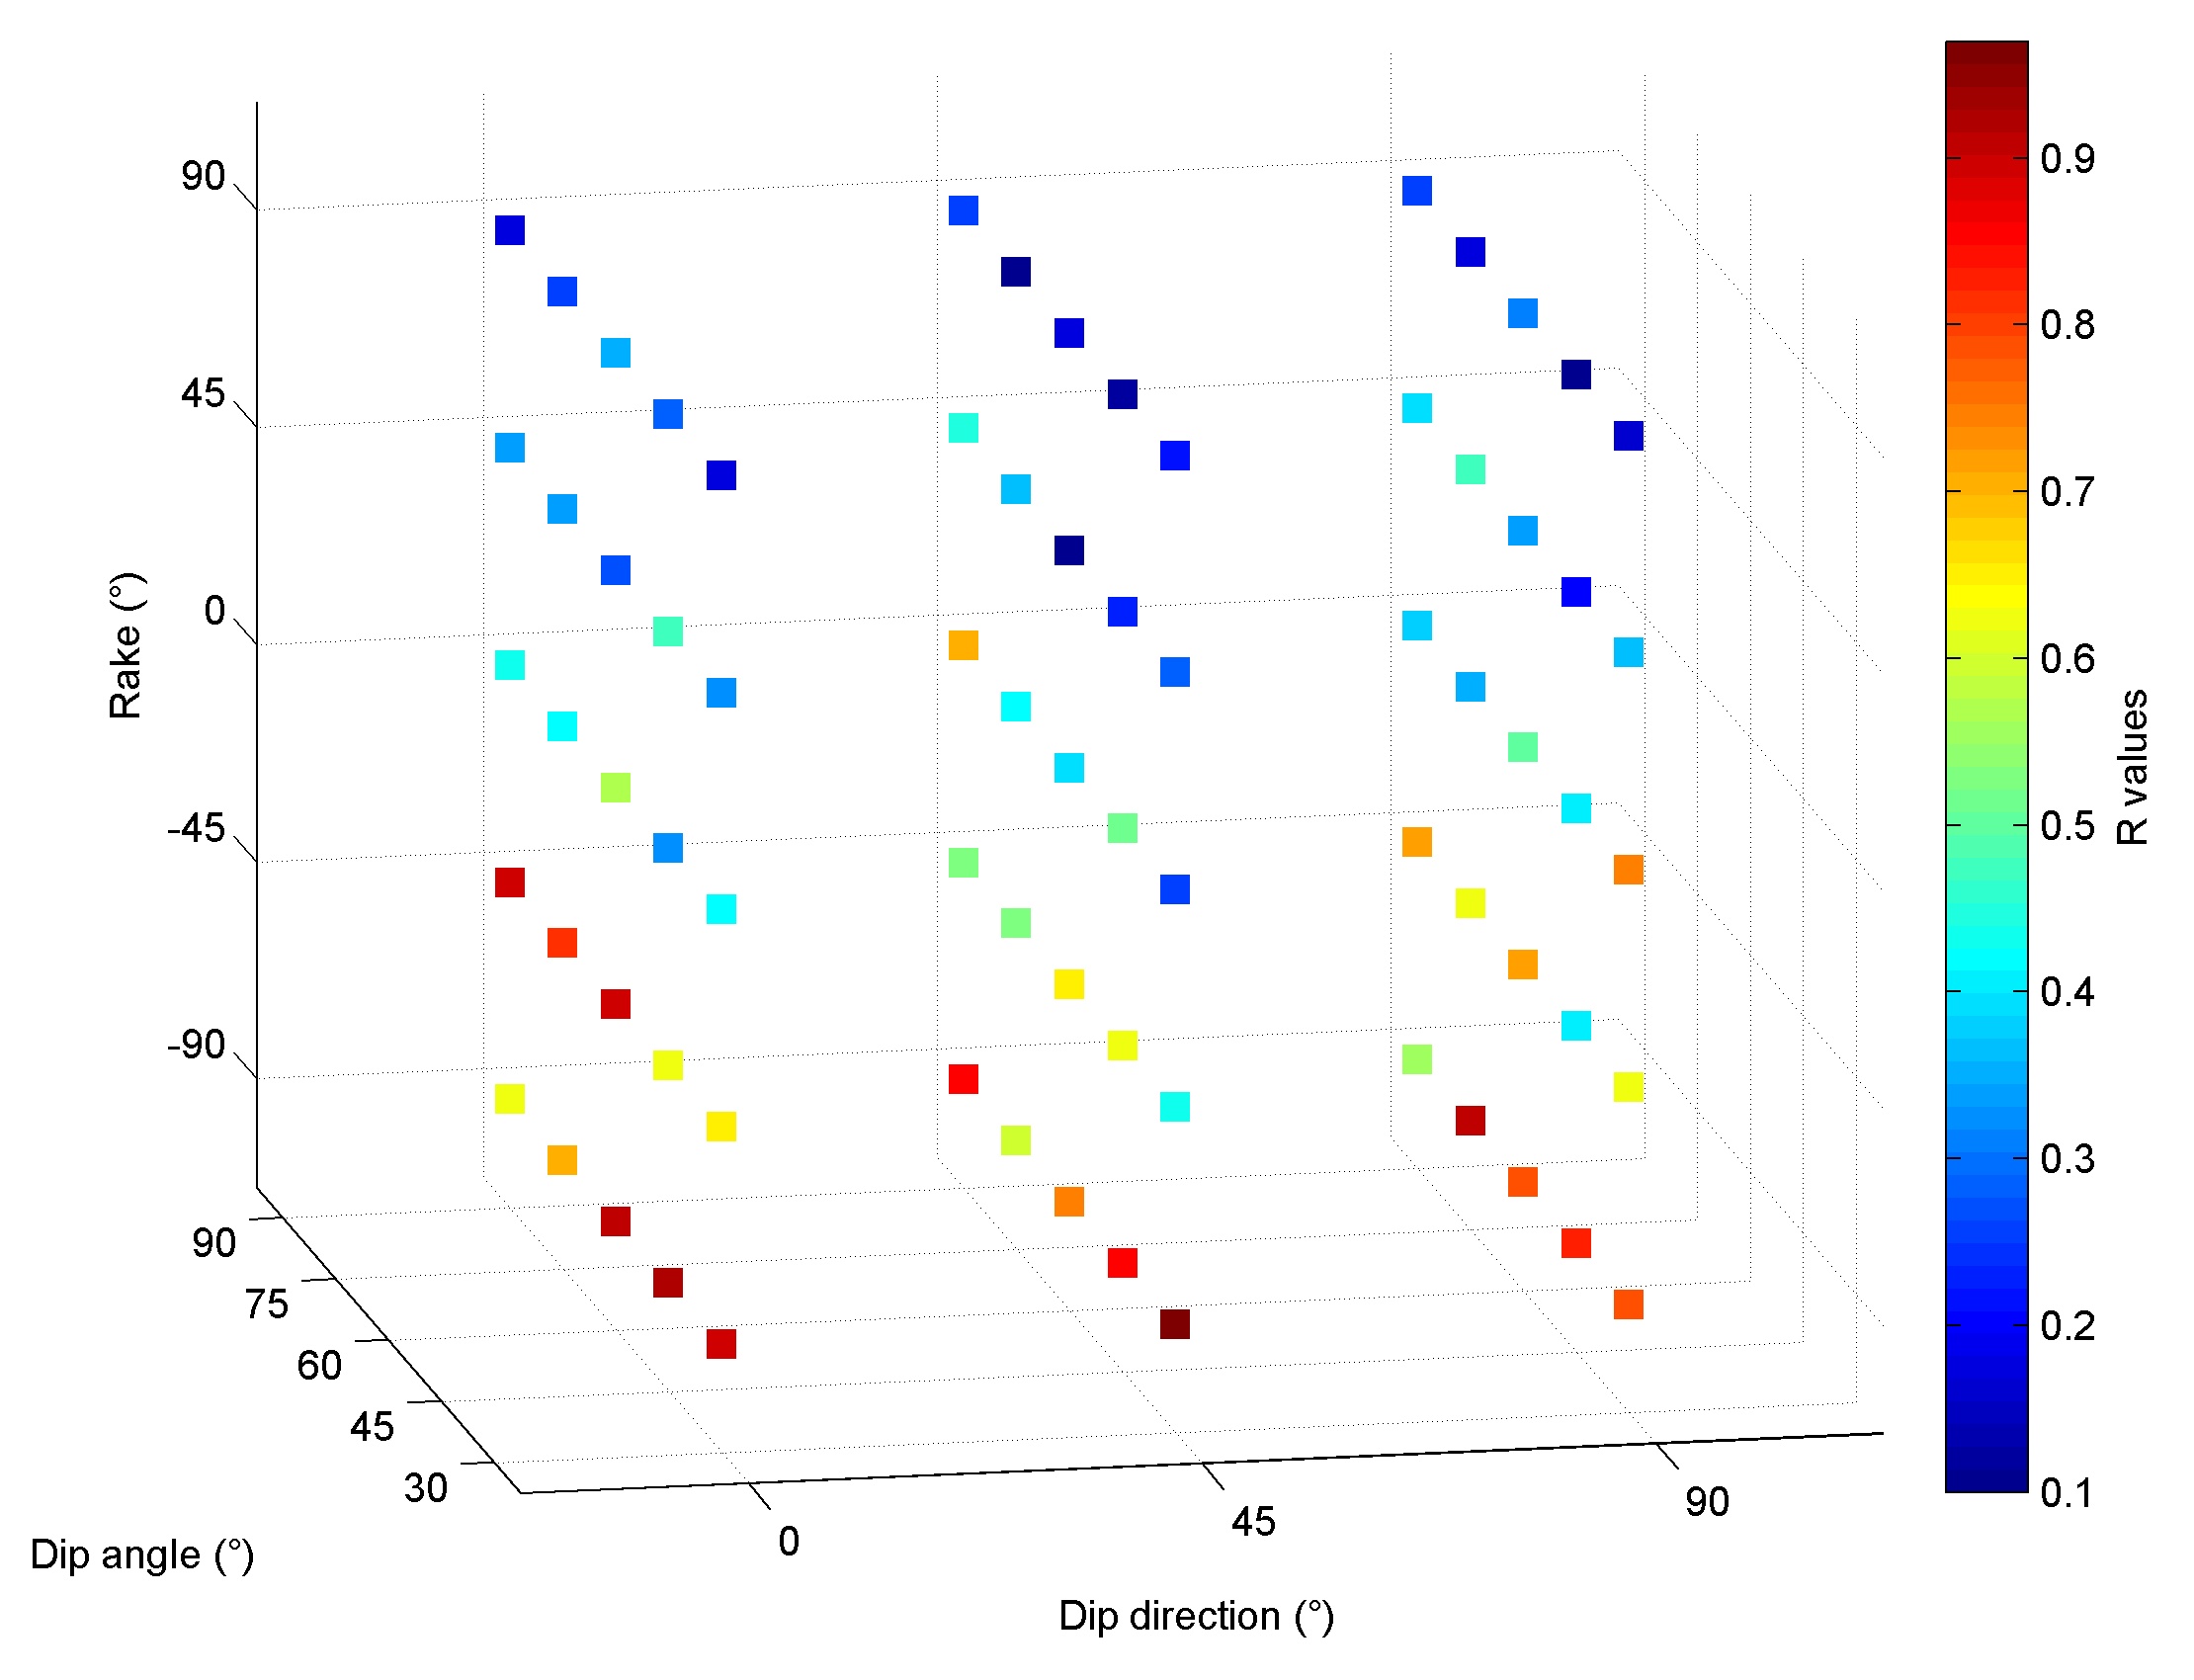
▲Figure S2b. Relative stress magnitude for the stress inversions results shown in figure S2a.
[ Back ]