This electronic supplement contains figures illustrating the performance of the AICDpicker and the KTpicker. Some technical details of the PhasePApy are included.
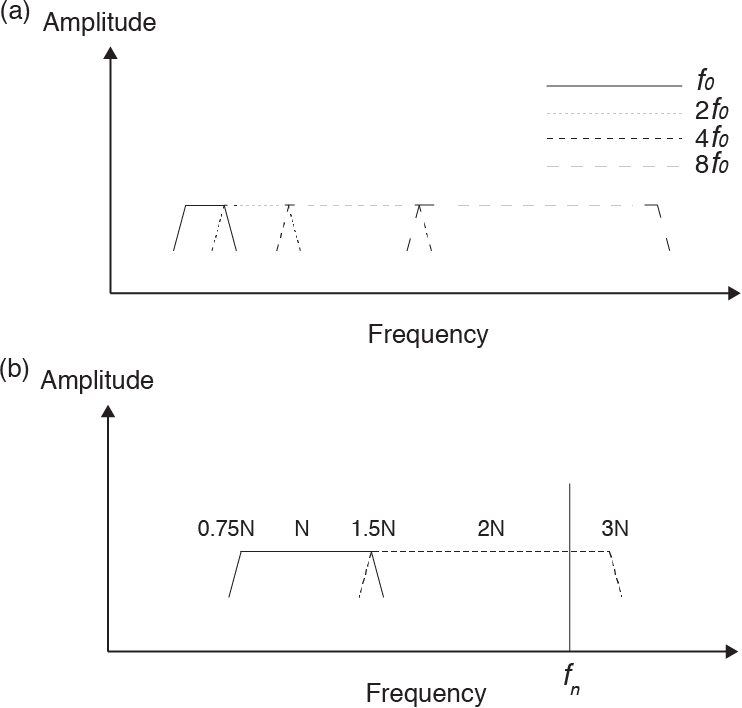
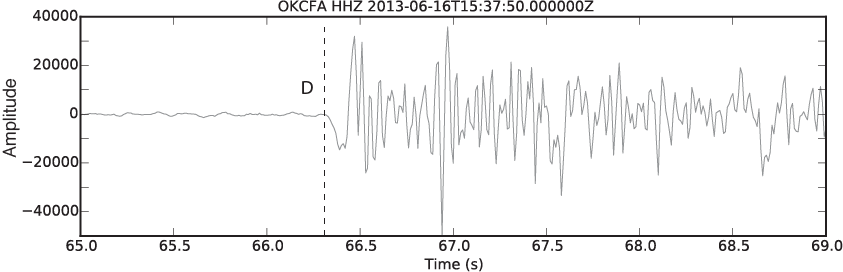
Octave band-pass filtering of the FBpicker is shown in Figure S1. The consecutive bands double the central frequencies until the high corner of the next band exceeds the Nyquist frequency. If the central frequency of a filtering band is N Hz, the low and high corners are 0.75×N and 1.5×N Hz, respectively. For the next band, the central frequency is 2×N Hz; the low and high corners are 1.5×N and 3×N Hz, respectively, and as such can ensure that there is no gap and significant overlap in filtering band and that all signal components below Nyquist frequency can be resolved. We take the window length of 10 in samples and the coefficient of 10 for pick polarity determination (Fig. S2). The polarity method determines the polarity of the first pick from the vertical component as dilatation (denoted as D). The normalized characteristic functions of the AICDpicker and the KTpicker are in Figures S3 and S4, respectively.
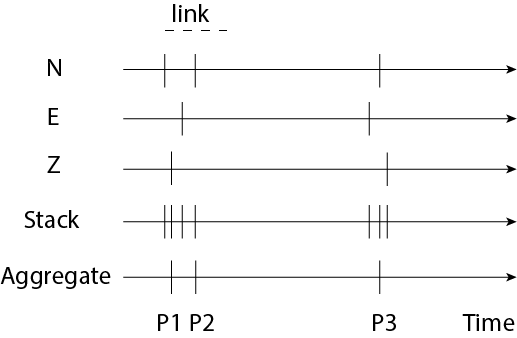
The Associator stacks and aggregates picks with a user-defined link length. The picks from different components of the same station are stacked for aggregation. If the succeeding pick is close to the preceding one (less than the link length), the succeeding pick will be linked for the pick aggregation. However, if a pick from the same component has already been linked, the succeeding pick will be treated as the first pick in the next pick aggregation process (Fig. S5). Although P1 and P2 are less than link length, they are treated as different aggregated picks.
Figure S1. Determination of frequency bands for octave filtering of the FBpicker. (a) The central frequency of a band is doubled to that of its previous band. (b) The high-corner frequency of the last band (central frequency is N Hz) cannot exceed the Nyquist frequency fN.
Figure S2. Example with the polarity determination (D stands for dilatation) of a pick on the vertical-component signal. Dashed line indicates the pick. Amplitude is in counts.
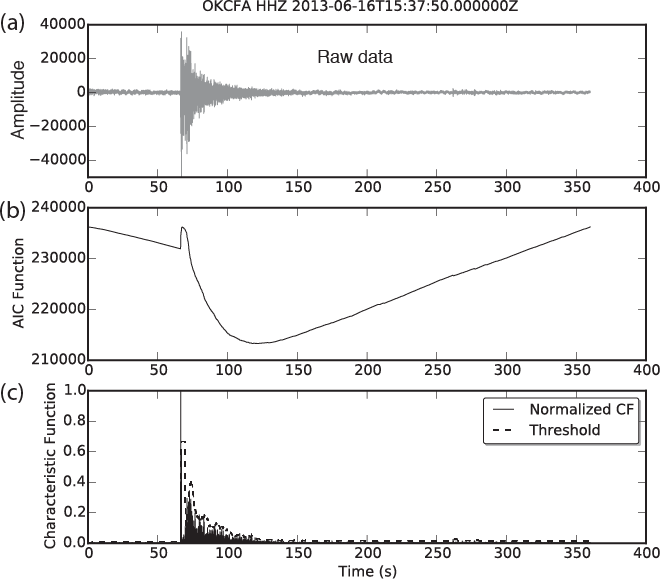
Figure S3. (a) Detrended raw seismogram on the vertical channel from station OKCFA. (b) Akaike information criterion (AIC) function of data. (c) The normalized derivative of the AIC function. The dynamic threshold level of 6σ is in dashed line. Amplitude is in counts.
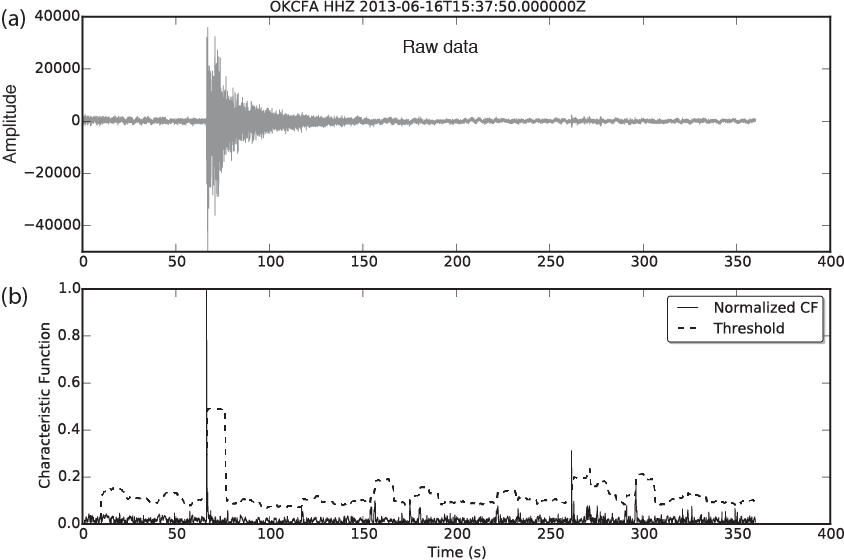
Figure S4. (a) The detrended vertical channel seismogram from OKCFA. (b) The KTpicker normalized characteristic function (CF). The dynamic threshold level of 6σ is in the dashed line. Amplitude is in counts.
Figure S5. Stack and aggregate picks to obtain the modified picks from different components on the same station. N, E, and Z indicate two horizontal components and a vertical component, respectively. The dashed line represents the link length to group the picks from different components for aggregation. P1, P2, and P3 are the aggregated picks from the stacking picks.
[ Back ]