This electronic supplement includes four supplementary figures and a zipped QuakeML file containing the full catalog of located earthquakes.
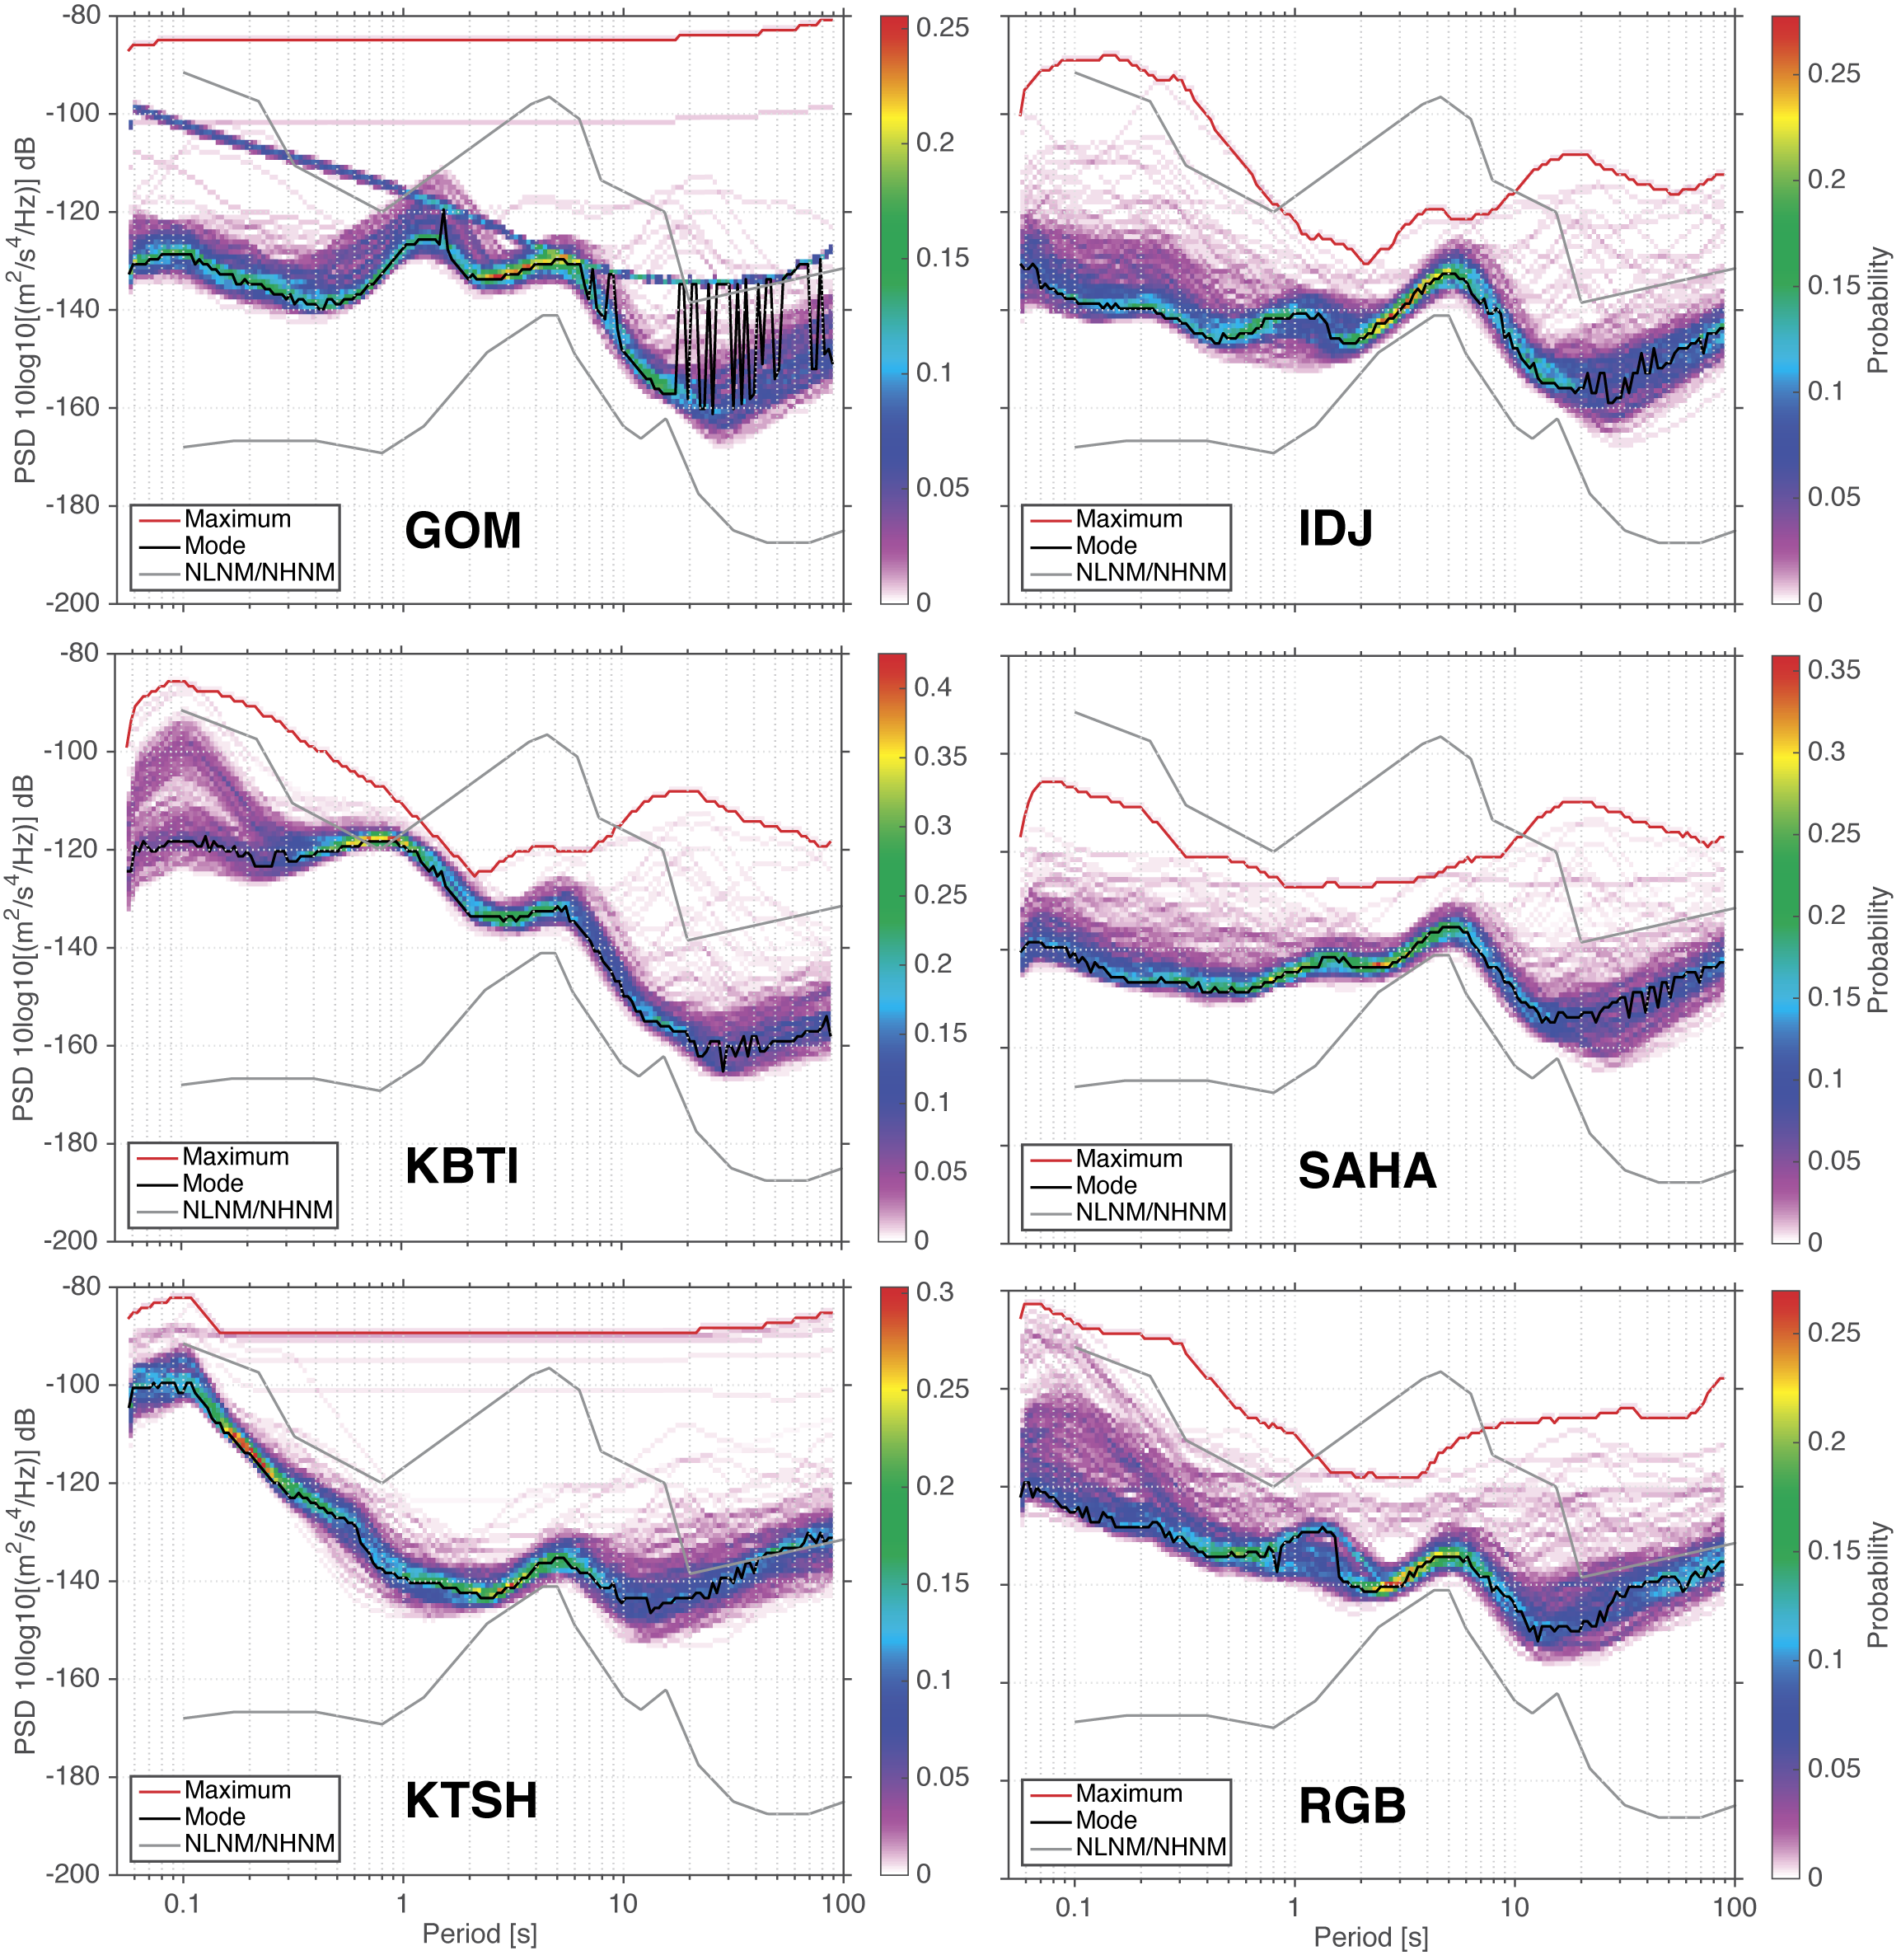
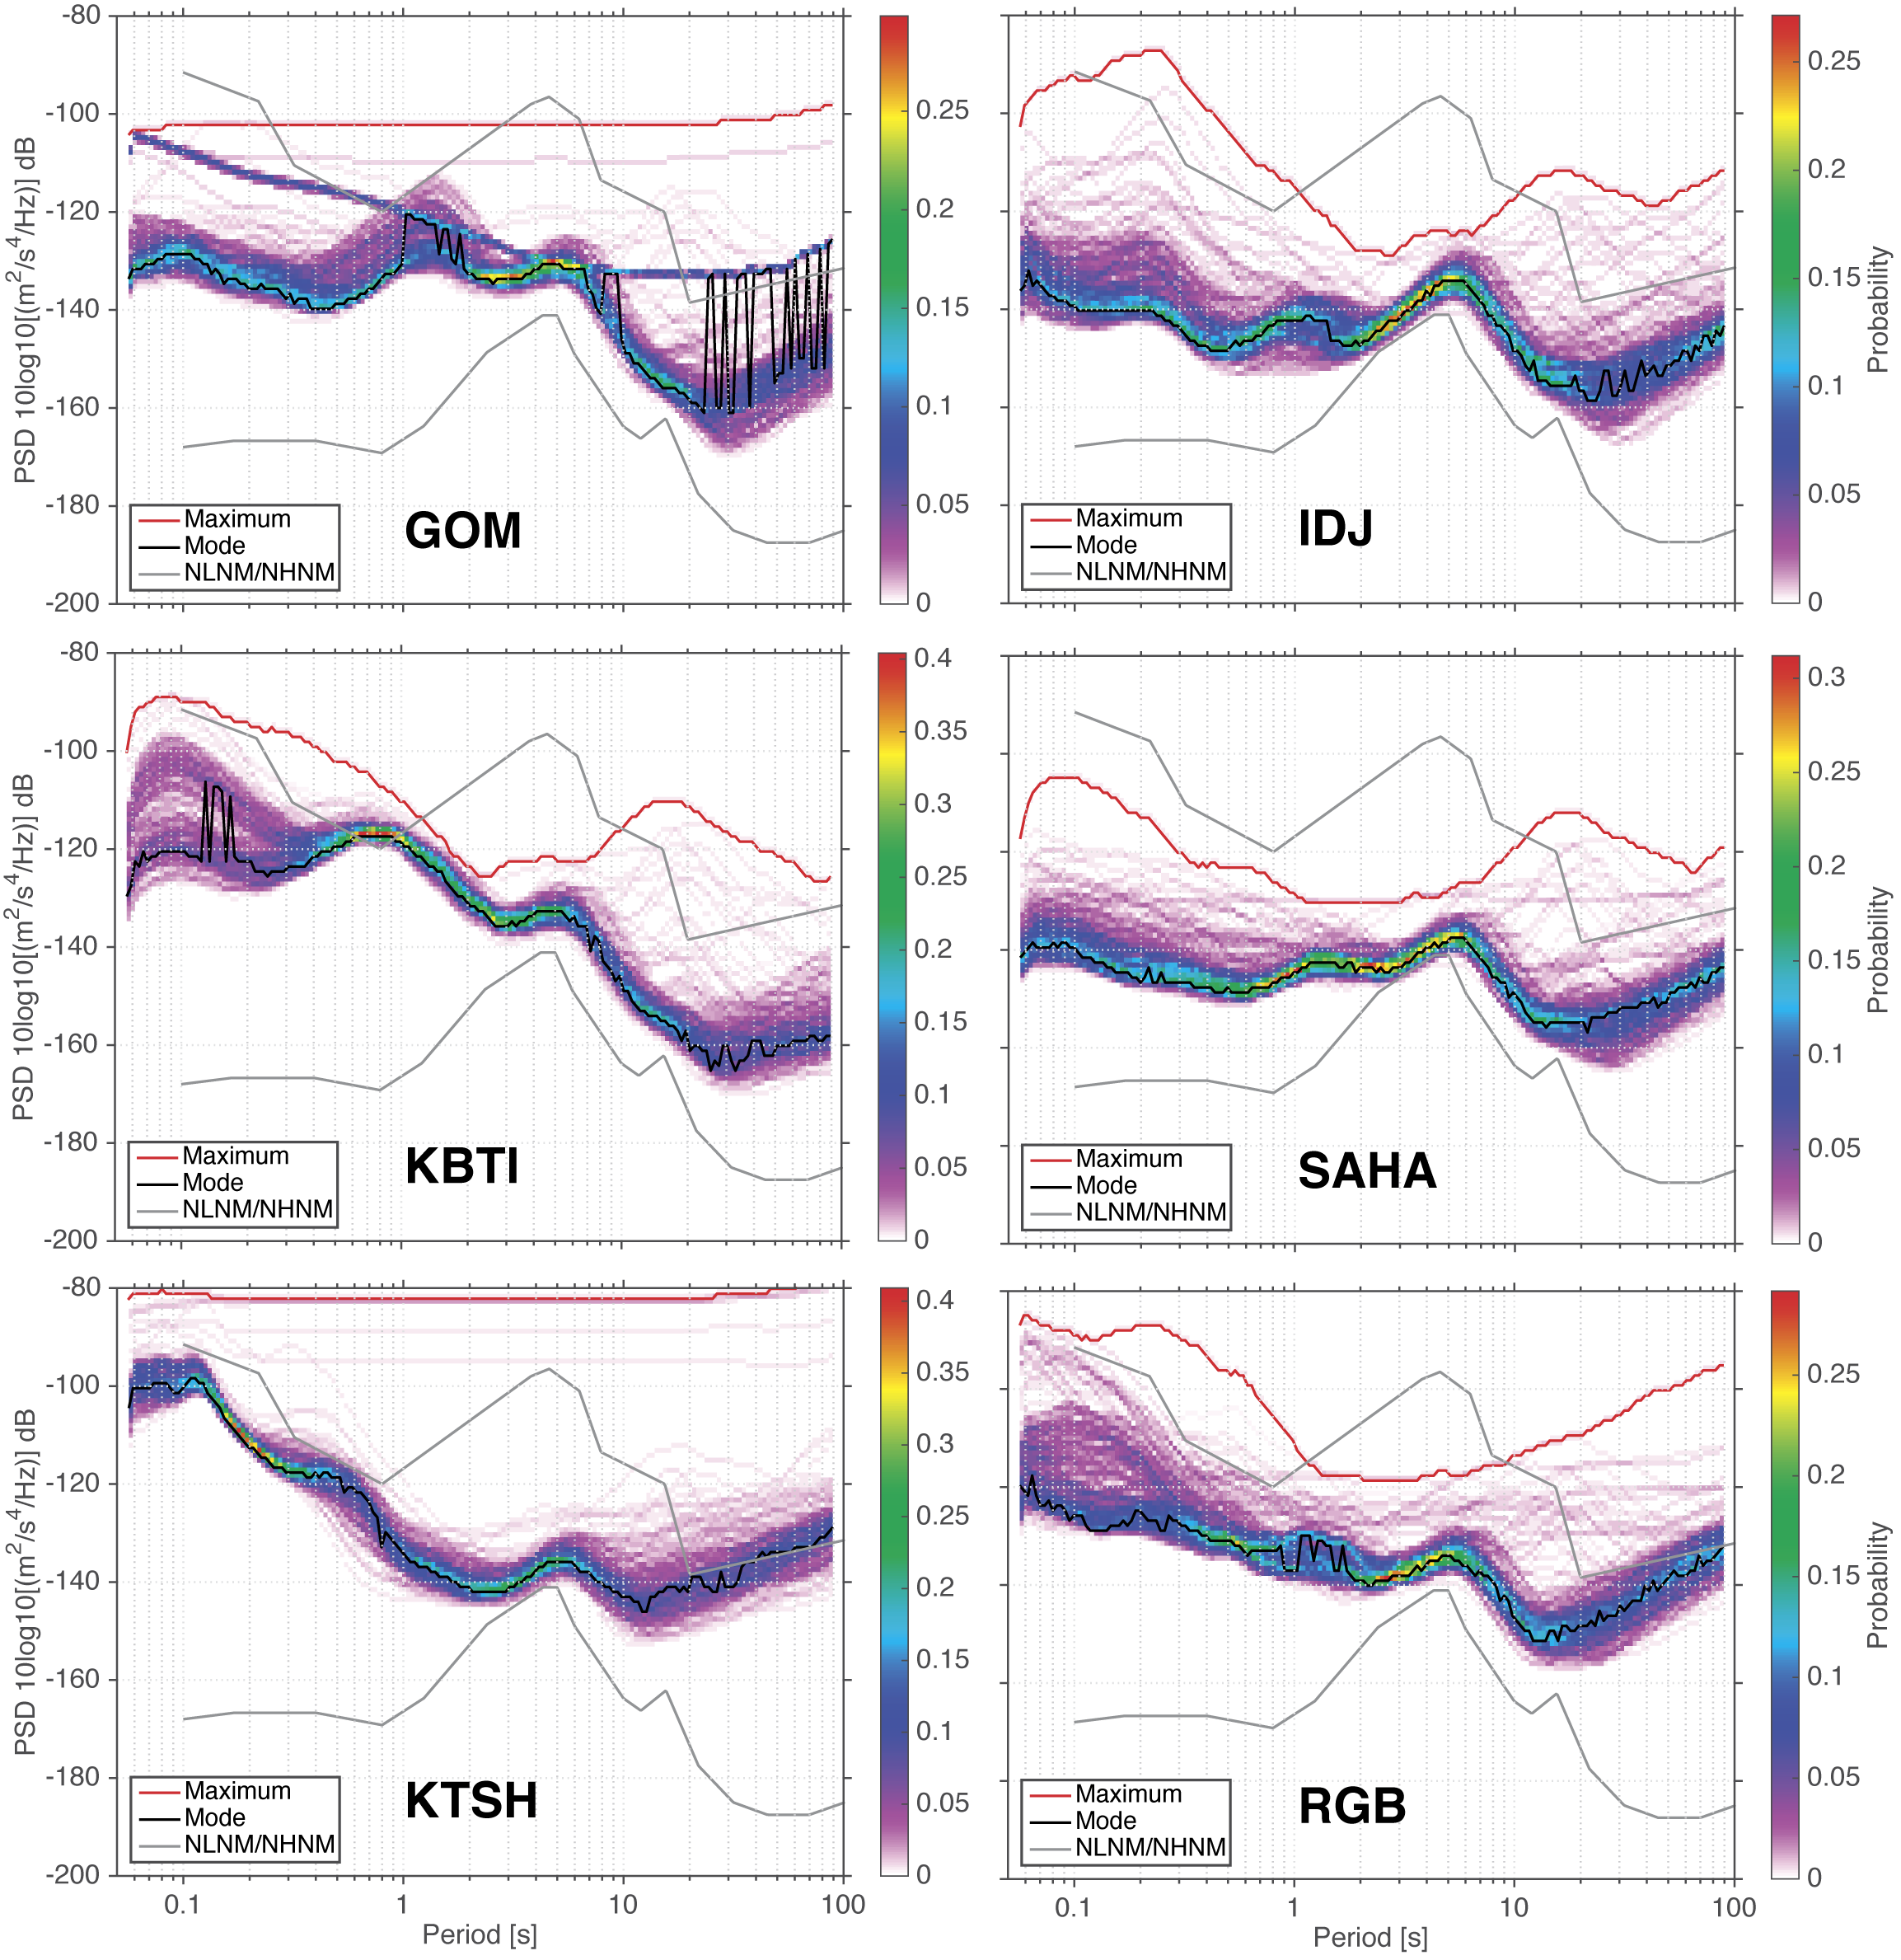
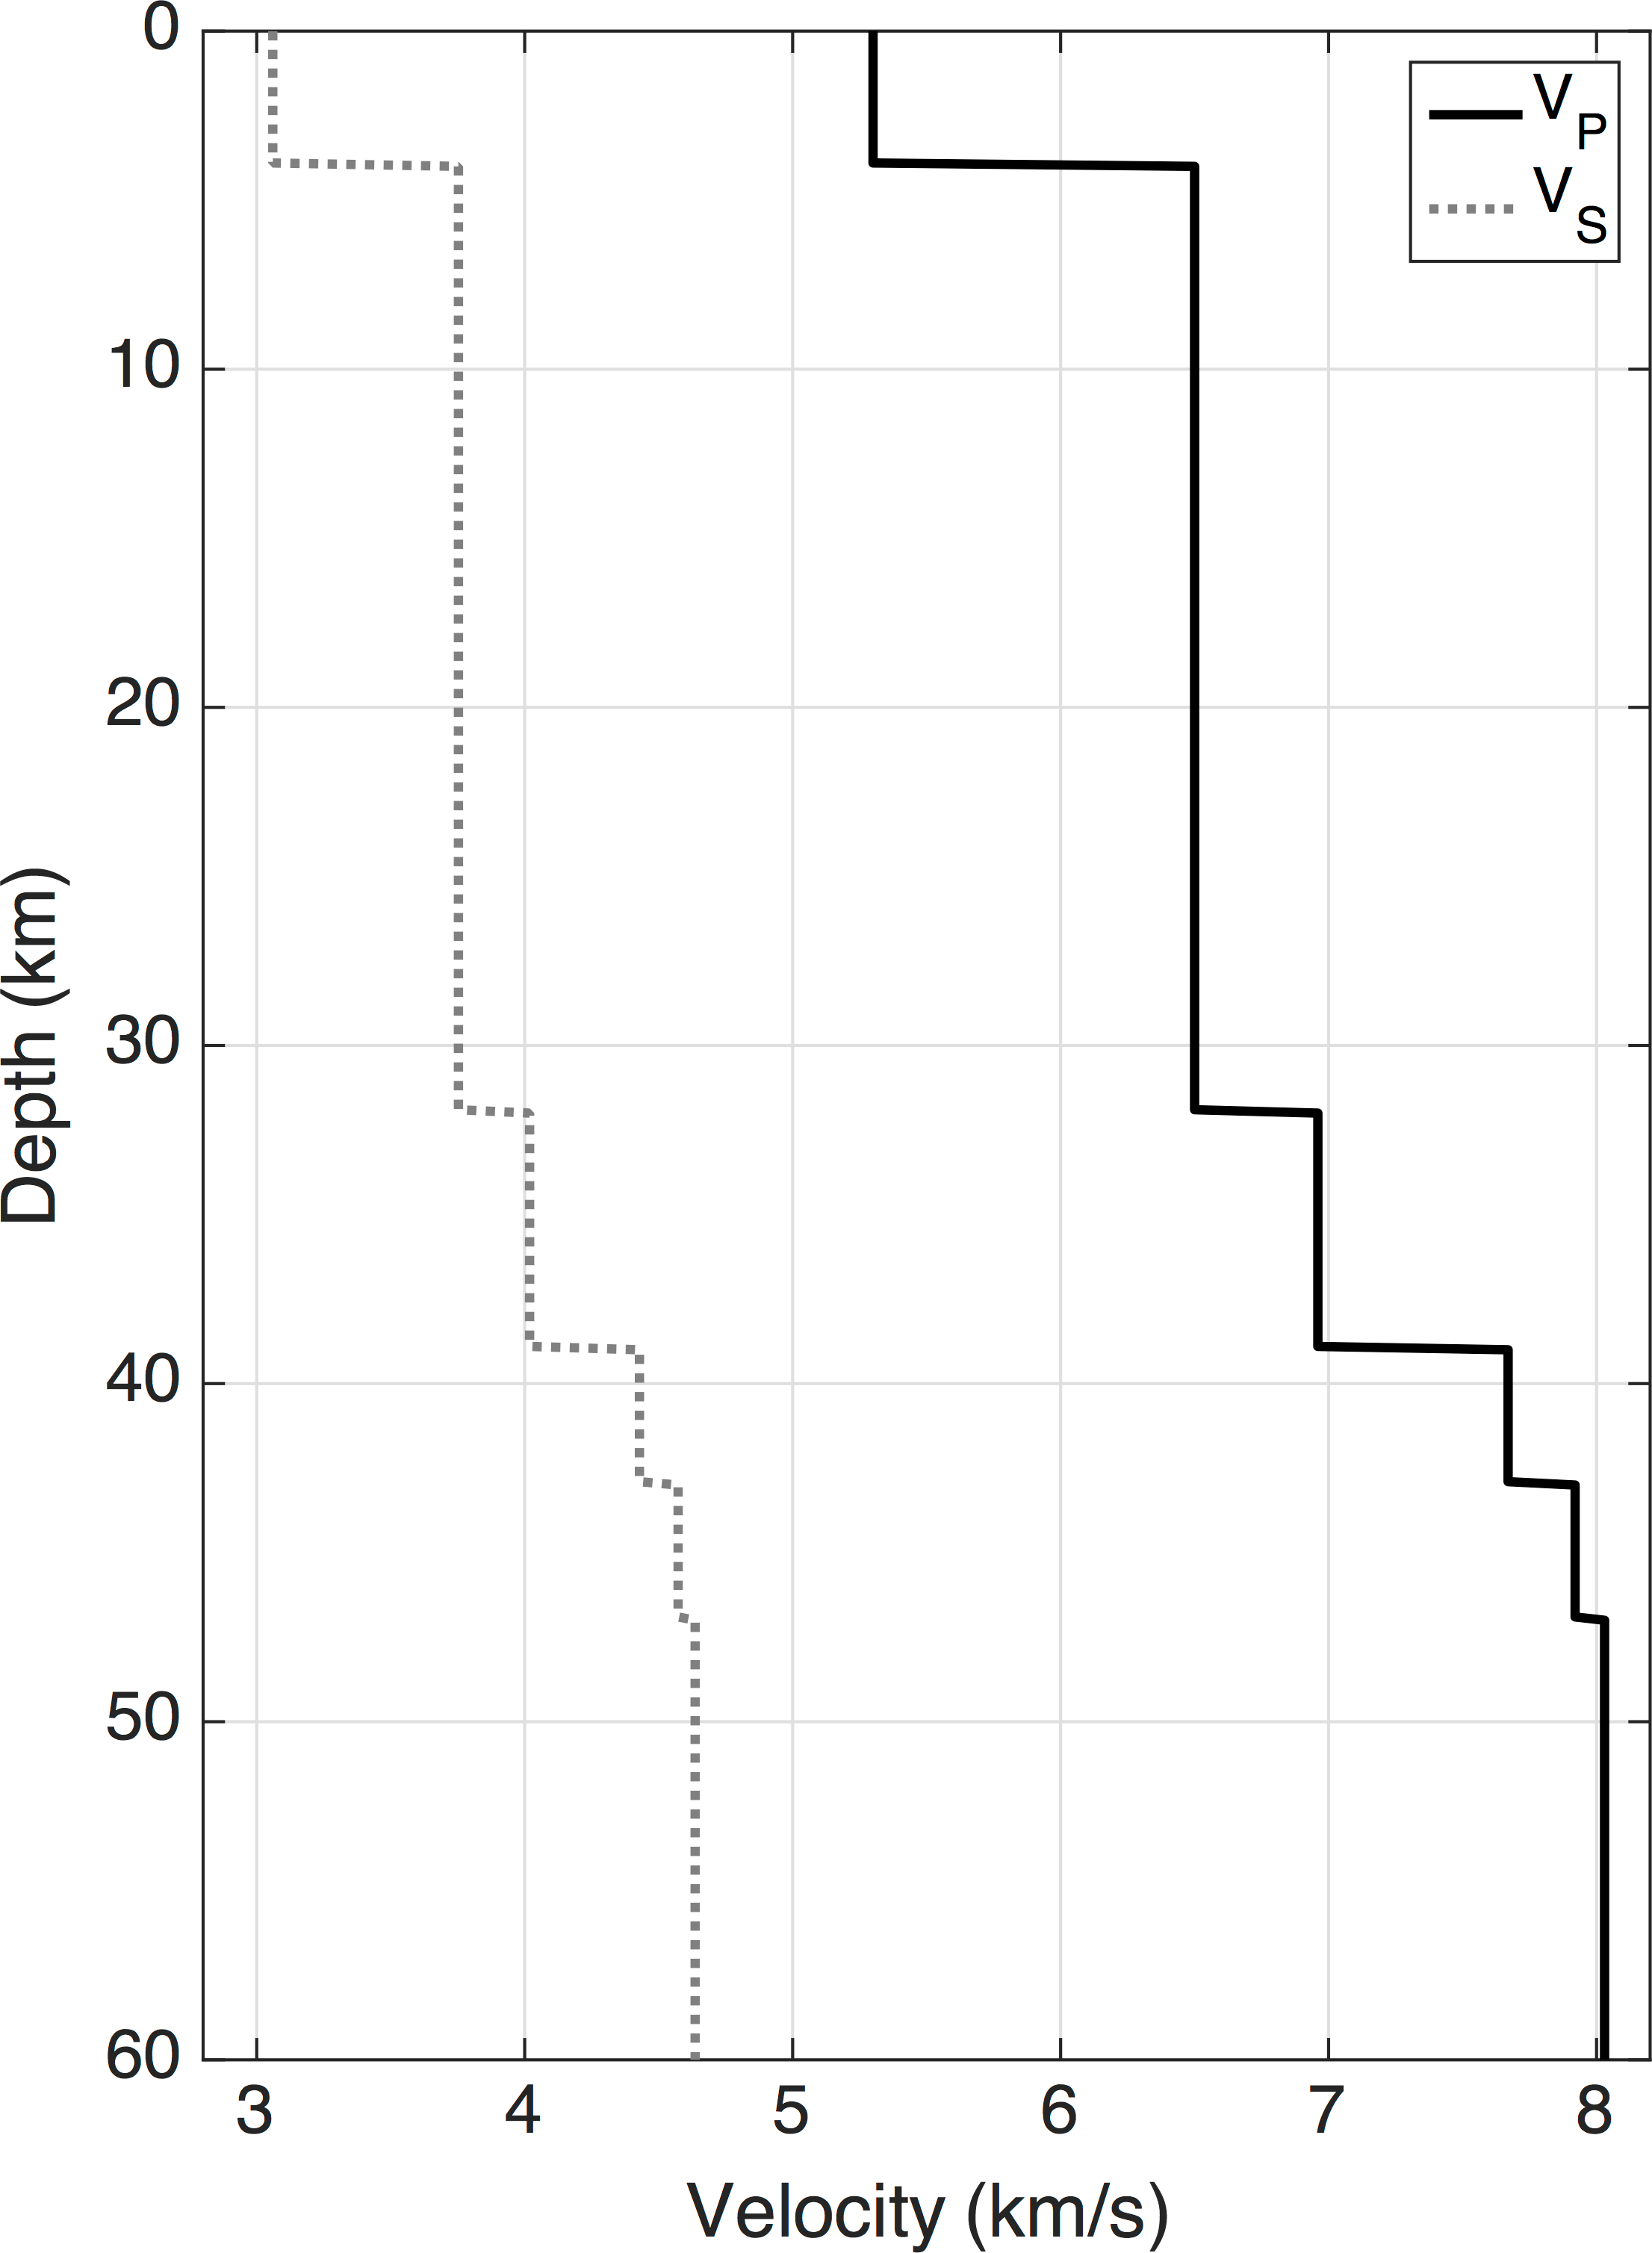
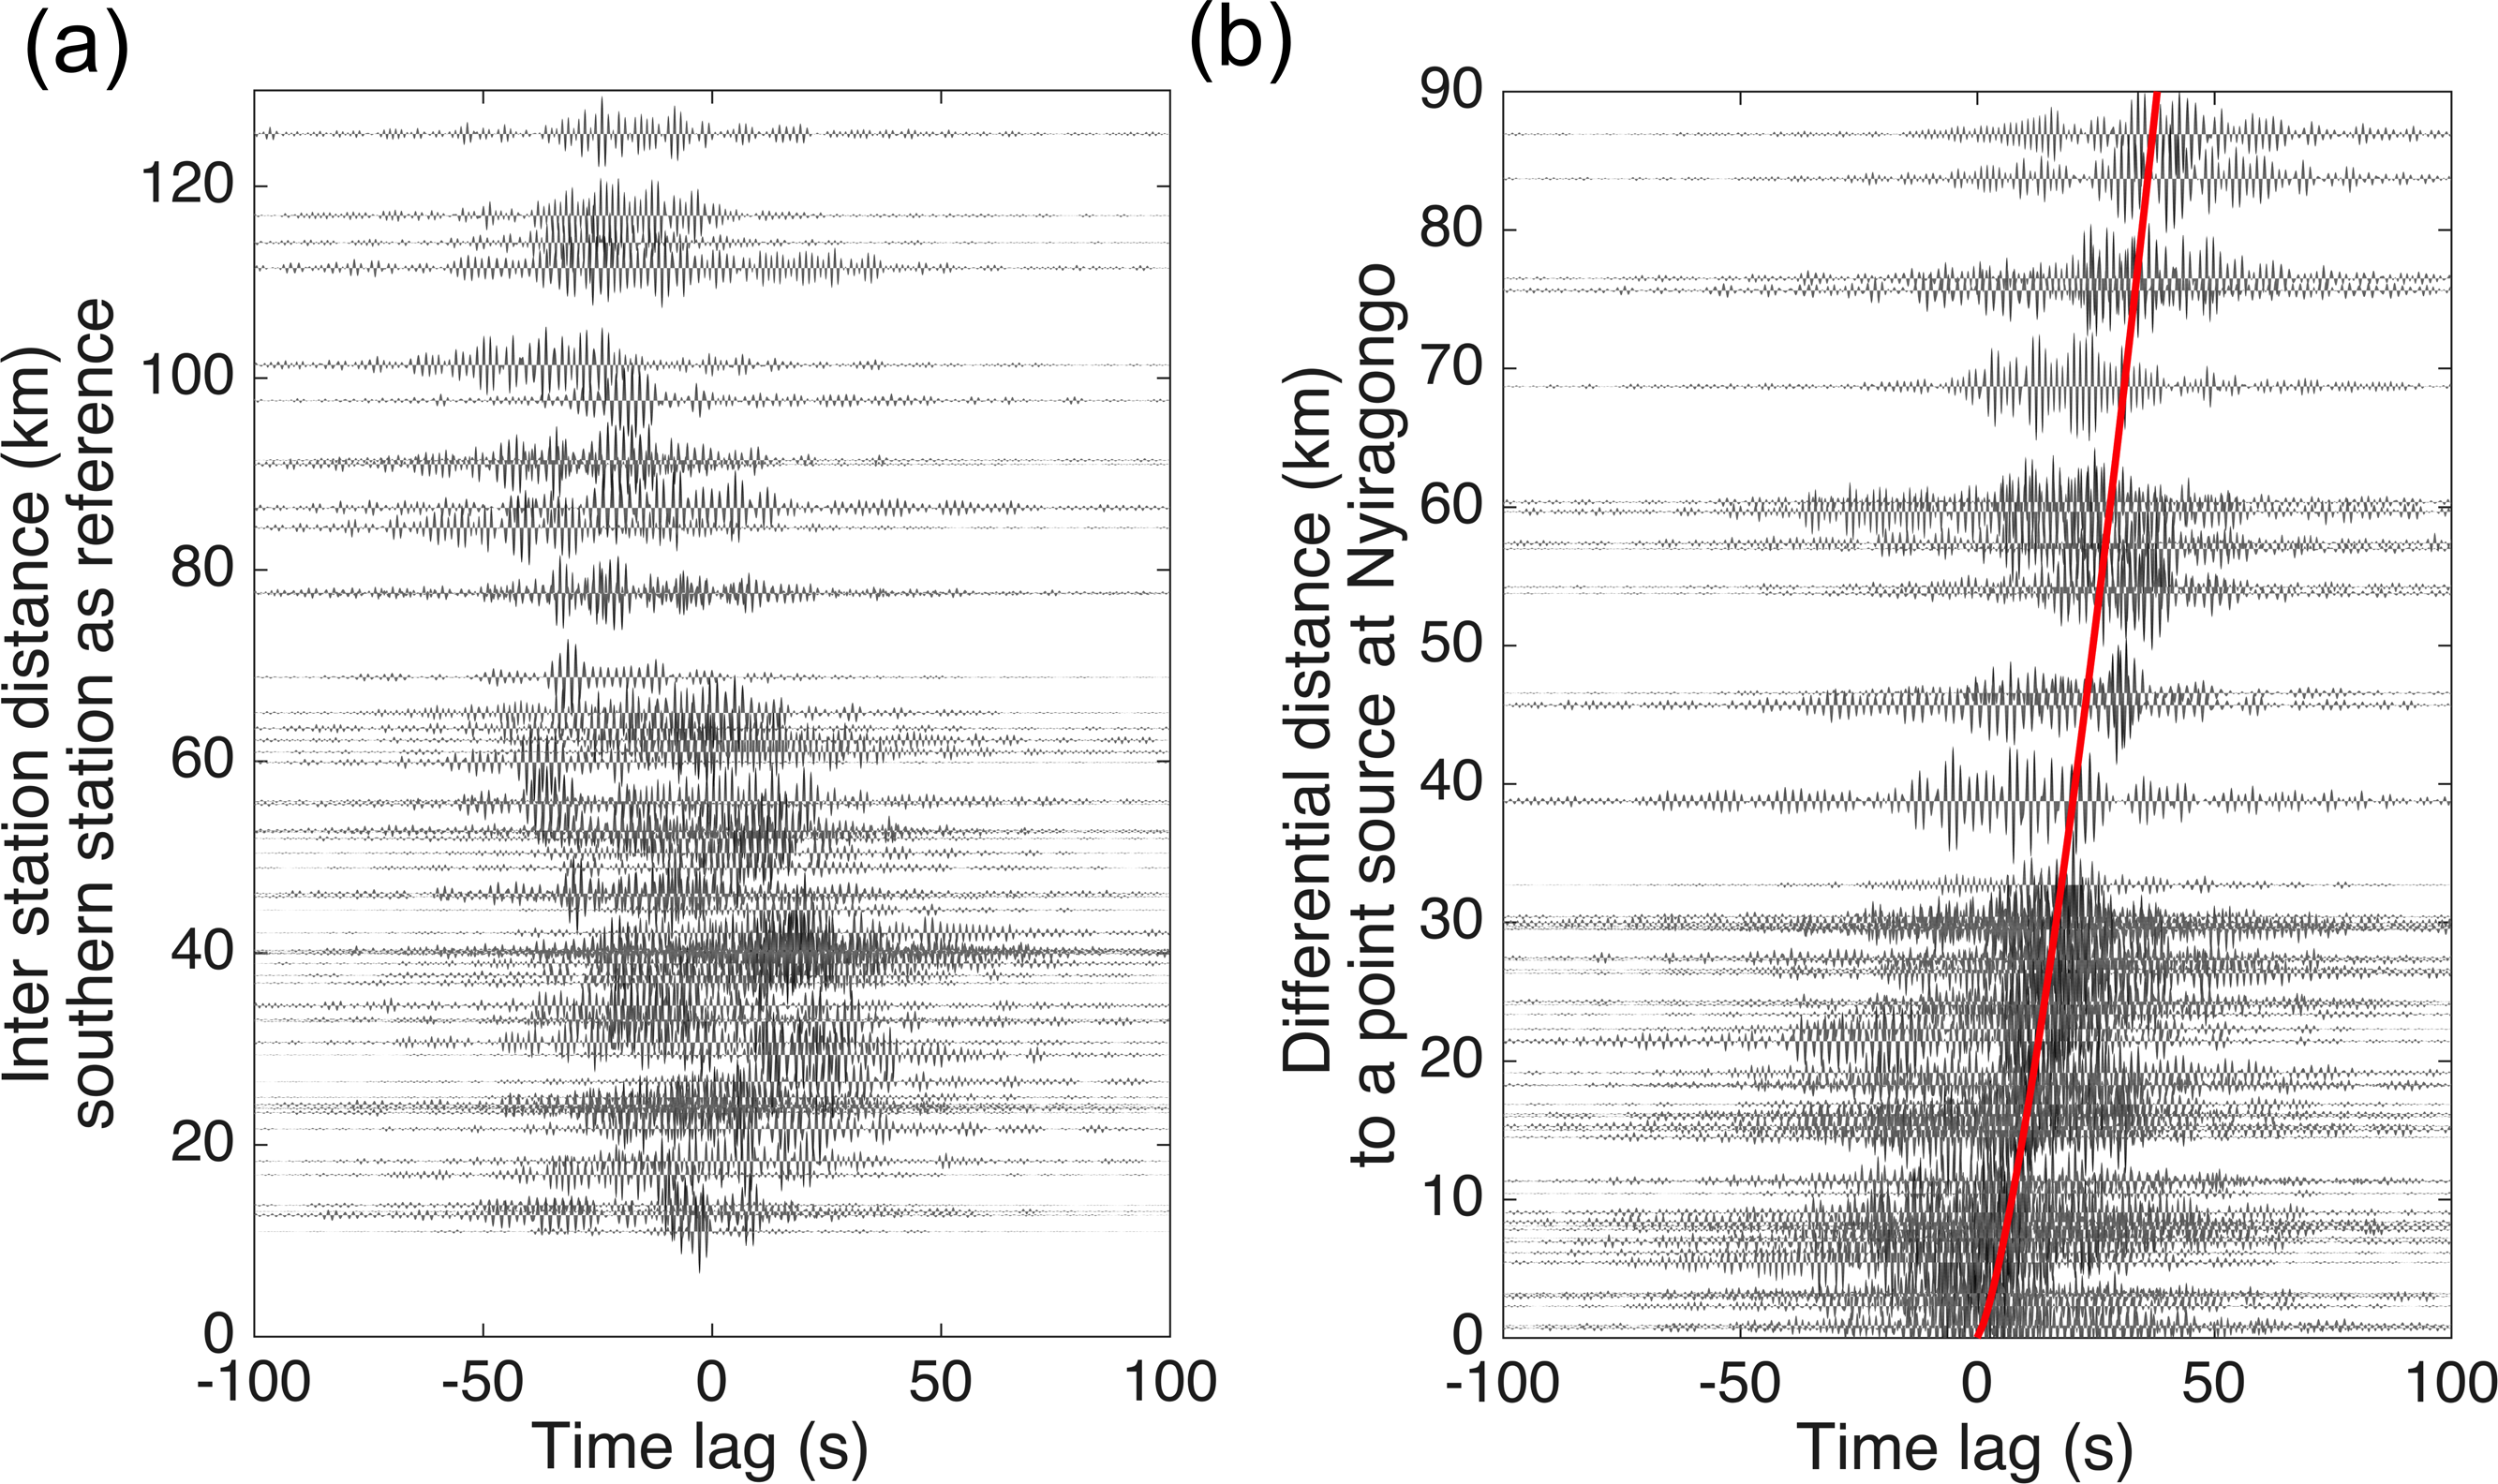
Figure S1 shows the power spectral density (PSD) plots (same as Fig. 4 in the main article) for the east–west component; Figure S2 shows the PSD plots (same as Fig. 4 in the main article) for the north–south component; Figure S3 shows the 1D velocity model derived by Mavonga et al. (2010) for the Virunga Volcanic Province region used for earthquake locations in the main article; and Figure S4 shows an example of the interstation cross-correlation functions calculated for the purpose of tremor location and the determination of the velocity model used. QuakeML catalog file of all detected and located earthquakes during the time period August 2014–June 2016 depicted in Figure 5 of the main article.
Figure S1. Examples for the seismic background noise level using PSD analysis. Shown are the east–west component PSD probability density function (PDF) estimates for the time period October 2015–June 2016, calculated following the processing described by McNamara and Buland (2004), with 50% overlapping 1-hr time windows subdivided into 13 segments overlapping by 75%. Smoothing was done by calculating full-octave averages in 1/16th octave intervals. The plots cover the period range 0.05–100 s (respectively 0.01–20 Hz). The New Low/High Noise Model (NLNM/NHNM) range from Peterson (1993) is indicated by gray lines.
Figure S2. Examples for the seismic background noise level using PSD analysis. Shown are the north–south component PSD PDF estimates for the time period October 2015–June 2016 calculated following the processing described by McNamara and Buland (2004), with 50% overlapping 1-hr time windows subdivided into 13 segments overlapping by 75%. Smoothing was done by calculating full-octave averages in 1/16th octave intervals. The plots cover the period range 0.05–100 s (respectively 0.01–20 Hz). The NLNM/NHNM range from Peterson (1993) is indicated by gray lines.
Figure S3. 1D seismic-velocity model of Mavonga et al. (2010) used for event locations in the Virunga Volcanic Province and Lake Kivu region.
Figure S4. Stacked noise correlation functions (NCFs) from 1 February to 31 March 2016 for the frequency band 0.5–0.9 Hz. (a) NCFs ordered as function of interstation distance using the most southern station as reference for the cross-correlation calculation. (b) NCFs ordered as function of differential distance to the most probable source located at Nyiragongo after scanning each potential point source using a grid-search approach. The corresponding best-fitting travel-time curve (t = 1.3d0.75) is depicted as a solid red line.
Download: QuakeML Catalog File [Zipped QuakeML Catalog File; ~1 MB]. Standard QuakeML file containing the catalog of 882 earthquakes detected and located by KivuSNet in the period August 2014–June 2016 (see also Fig. 5 in the main article).
Mavonga, T., N. Zana, and R. J. Durrheim (2010). Studies of crustal structure, seismic precursors to volcanic eruptions and earthquake hazard in the eastern provinces of the Democratic Republic of Congo, J. Afr. Earth Sci. 58, 623–633, doi: 10.1016/j.jafrearsci.2010.08.008.
McNamara, D. E., and R. P. Buland (2004). Ambient noise levels in the continental United States, Bull. Seismol. Soc. Am. 94, 1517–1527.
Peterson, J. (1993). Observation and modeling of seismic background noise, U.S. Geol. Surv. Open-File Rept. 93-322.
[ Back ]