|
|
Publications: SRL: EduQuakes |
EduQuakes
September/October 2008
Using SeisMac to Turn Your Laptop into a Seismograph for Teaching
Michael Wysession
Washington University
Michael Hubenthal and John Taber
Incorporated Research Institutions for Seismology
You probably are familiar with the situation. You’re trying to explain the arrival of seismic waves to your class. Or maybe it is your spouse (or child, grandparent, parole officer, whatever). You are excited and enthusiastic, talking about frequencies and wavelengths, dispersion, Hilbert transforms, and so on, and all you get in return is blank stares. They don’t get it. The problem is that you are showing them a static black-and-white image of squiggly lines, and you just can’t get them to see the dynamic motions and transfers of energy involved. You wish you had an actual seismometer to whip out and use to demonstrate your points. Well, your wish has been granted! In fact, you very well may have access to it already.
SeisMac is a free Mac OS X application that runs on a MacBook or MacBook Pro and turns built-in accelerometers into a three-component seismograph. These Mac laptops are installed with a sudden-motion sensor, similar to automobile air-bag accelerometers, that is designed to lock up your hard drive if your laptop falls to the ground. It works. Trust us (or, rather, trust the dents in our laptops). Early on, Mac users discovered this feature and were using it to do things like turn their laptops into Star Wars light sabers (complete with sound effects). However, freelance programmer Daniel Griscom realized the potential and created SeisMac (which he wrote about in Electronic Seismologist for SRL volume 77, issue 6 (November/ December 2006) pp. 731–733). With some seed funding and guidance from the Incorporated Research Institutions for Seismology (IRIS), SeisMac was honed into a real seismograph. Yes, of course, you could achieve the same results by purchasing a separate three-component accelerometer and developing a graphical user interface (GUI) that could display the signal in a user-friendly manner. But most likely, you haven’t. By accessing SeisMac, you have a fully portable seismograph with no peripherals needed that can be set up instantly anywhere and anytime. The software downloads in seconds from
http://www.suitable.com/tools/seismac.html.
It is worth noting that this is a fairly respectable accelerometer. It has a sample rate that can be changed from 10 Hz to 500 Hz. It has a ±2 g range with 0.003 g resolution. At the recent Seismological Society of America meeting in Santa Fe (16–April 2008) we set a laptop on the floor on one side of the poster hall and stomped on the other, and we could see the distinction between the P and S waves! The dynamic range and time window length can be varied to suit your observation/ demonstration needs. At the 10-Hz sample rate the buffer is 200 hours long, and an update in the near future will allow a time segment to be saved as a SAC file.
A wonderful benefit of SeisMac is that students (neighbors, in-laws, your bookie, whatever) don’t have to take your word for many of the concepts that you may be trying to demonstrate. They can see it firsthand in real time. For instance, you start with the idea of three components, as shown in Figure 1. How do the three components directly relate to motions in three dimensions? Have the members of your audience begin to play with SeisMac and they quickly see what “up” on each of the three components means. The top component is right-left (X), with “up” on the seismograph representing motion to the right (+X); the middle component is front-back (Y), with “up” representing motion toward the back (+Y); the bottom component is vertical (Z), with “up” being true “up” (+Z). Understanding it takes a fraction of the time that it takes to explain it, and more importantly, people remember it because they “found” it themselves.
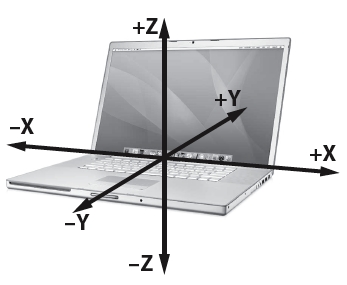
▲ Figure 1. An Apple MacBook, showing the orientations of the three components of the accelerometers accessed by the software program SeisMac.
Another easy demonstration shows that seismographs can measure displacement, velocity, or acceleration. A good exercise for students is to ask them to predict what the seismograms will show if they give the laptop a shove to the right. If you refrain from using the word “accelerometer” until this point (or even if you say it at introductory levels), your students will probably predict a step-function on the X-component. Then you go to the blackboard (whiteboard, back of a racing form, whatever) and give a quick demonstration of differentiation. Take the derivative of the step-function and you get a delta function (velocity). Take the derivative of delta function and you get a positive delta function followed by a negative delta function (acceleration). Then go back to the SeisMac screen, and son of a gun, there it is—a positive delta-function-like spike followed by a negative delta-function-like spike. Sure enough, you have proved that SeisMac is recording accelerations.
Your bright students have probably already noticed that the units of the signal amplitudes are measured in “g,” but this is just another teaching opportunity. Have your students notice that the top two seismograms (X, Y) are centered around a mean of 0 g, but the bottom one (Z) is centered around a mean of 1 g. For those who still haven’t figured out what is going on, a very simple and elegant demonstration will bring them along: Take the laptop and tilt it on its side (Figure 2). The Z component is now horizontal and drops to zero, but the X component is now the vertical component and rises to a mean of 1 g. Tilt the laptop 90° toward the back and the same thing happens with the Y component.
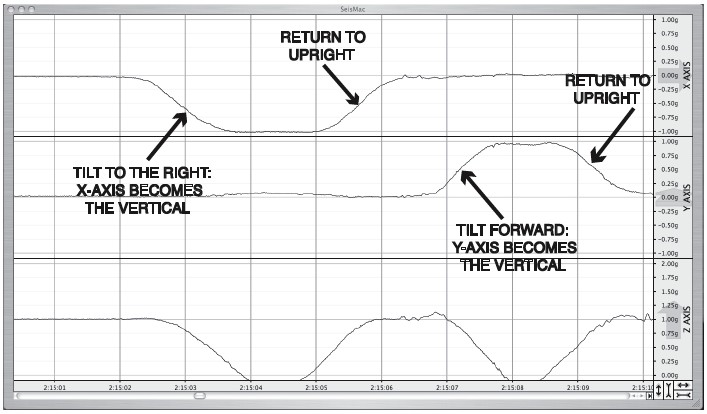
▲ Figure 2. Students can discover that the sensors are accelerometers by looking at the axis units and tilting the laptop. Initially, the Z axis is at “1” and the X and Y axes are at zero. So, the units are in terms of “g,” or 9.8 m/s2. When students rotate the laptop, either side to side or front to back, they find that the Z axis is no longer vertical and the X or Y axis is vertical.
At this point, you are now ready to demonstrate just about any concept of seismic waves you like. You can show the different motions needed to make P, SH, and SV waves. You can change the rate of your shakes to demonstrate wavelength and period. You can even show the motions needed to create an SS or PP wave (a 90° phase change from the S or P wave). If you have more than one laptop, place them along the length of a table and bang the table at one end; you have just demonstrated attenuation. You could even measure the amplitude decay across the seismometers and compute the Q of the table (though we haven’t yet done this ourselves).
One of the most elegant demonstrations with SeisMac is to have students try to recreate surface waves (Figure 3). They fairly quickly can figure out how to shake the laptop so that the Love waves are entirely on the X component (SH), and the Rayleigh waves show up equally on the Z and Y components (P and SV). However, upon close inspection they can see that the rolling motion required to make the Rayleigh waves creates Z and Y components that are exactly 90° apart! (Deriving this gets LOTS of blank stares, but the stares fade to surprise when they actually recreate this with their own hands.) And while SeisMac can’t demonstrate the reason for surface wave dispersion, it nonetheless helps students to understand the topic if they have to model the decrease in surface wave period through their own changing rates of shaking.
The pièce de résistance is putting up a complete three-component teleseismic seismogram, with body and surface waves, and having a contest to see which student can best model all of the phases though a complex sequence of taps, bumps, and shakes. By the end, the students will have an intuitive understanding of the physical process of recording waves on a seismograph in way they could never have by looking at still images in a book or on a screen. The winning student can even get to … erase the whiteboard (throw away the ink-scribbled barroom napkins, place the next bet, etc.).

▲ Figure 3.With practice, students can replicate the appearance of surface waves. The Love waves have to come in nearly entirely on the transverse component and the Rayleigh waves on the radial and vertical components. The surface waves undergo geometric dispersion that is seen in the decreasing wavelengths of the stretched-out arrival. The Rayleigh wave also shows the strong “beating” that occurs when waves of different frequencies interfere with each other.
There are many more applications for SeisMac. It works remarkably well for quantifying the turbulence on an airplane. We have measured turbulence on rough flights with peaks of more than 0.4 g (by the way, flight attendants find this fascinating). Jesse Lawrence (Stanford) and Elizabeth Cochrane (University of California, Riverside) have even developed their own Mac laptop seismogram display using the Apple accelerometer but have taken it to a much more advanced level. Through the use of Internet connection points for laptops, they are developing the world’s largest strong-motion seismic network by networking the output of laptop accelerometers (they may soon have sampling from every Starbucks in the country!). Their program, the Quake-Catcher Network (QCN), can be found at http://qcn.ucr.edu.
So far these laptop seismographs only work with newer Apple computers. However, many PC-based laptops also have built-in accelerometers, and it is hoped that eventually these can be accessed as well so that many more laptops can run programs such as SeisMac or the QCN.
You need never put up with those seismic-wave blank stares again. Wherever you go (class, home, tailgate party) you can always have a seismometer with you, ready at a moment’s notice to demonstrate in a fun and dynamic manner nearly any concept of recording seismic waves.
To get you started using SeisMac to convey seismological concepts, sample activities dealing with waveforms and ground accelerations can be downloaded from the IRIS Web site at:
http://www.iris.edu/hq/resource/seismac_activity_1
http://www.iris.edu/hq/resource/seismac_activity_2 ![]()
Department of Earth and Planetary Sciences
Washington University
St. Louis, Missouri 63130 USA
michael@wucore.wustl.edu
(M.W.)
Incorporated Research Institutions for Seismology
1200 New York Avenue NW
Washington DC 20005 USA
hubenth@iris.edu
(M. H.)
taber@iris.edu
(J. T.)
[Back]
Posted: 25 September 2008