This electronic supplement presents a unique dataset of measurements and photographs of liquefaction features including sand blows, sand fissures, and blisters that formed at the Hardwick and Marchand sites southwest of Christchurch during the 4 September 2010 M 7.1 Darfield event, the 22 February 2011 M 6.2 Christchurch event, and the 13 June 2011 M 6.0 Christchurch event in the Canterbury earthquake sequence. Detailed information about the liquefaction features—such as their location, triggering event(s), feature type and number, sediment vented, and approximate thickness, width, and length—is summarized in Tables S1, S2, and S3. Figure S1 shows the locations of the liquefaction features on an aerial photograph of the Hardwick site taken on 22 September 2010. Liquefaction features that formed at the site are shown in Figures S2–S38. Figure S39 shows the locations of the liquefaction features on an aerial photograph of the Marchand site, also taken on 22 September 2010. A few of those features are shown in Figure S40. The photographs of liquefaction features were taken within several hours to several weeks of the events and at some locations recorded the formation of compound sand blows as the result of recurrent liquefaction.
Table S1. Surface effects of liquefaction during the 2010–2011 earthquakes at the Hardwick site.
Table S2. Surface effects of liquefaction during the 2010 Darfield earthquake in turf grass at the Marchand site.
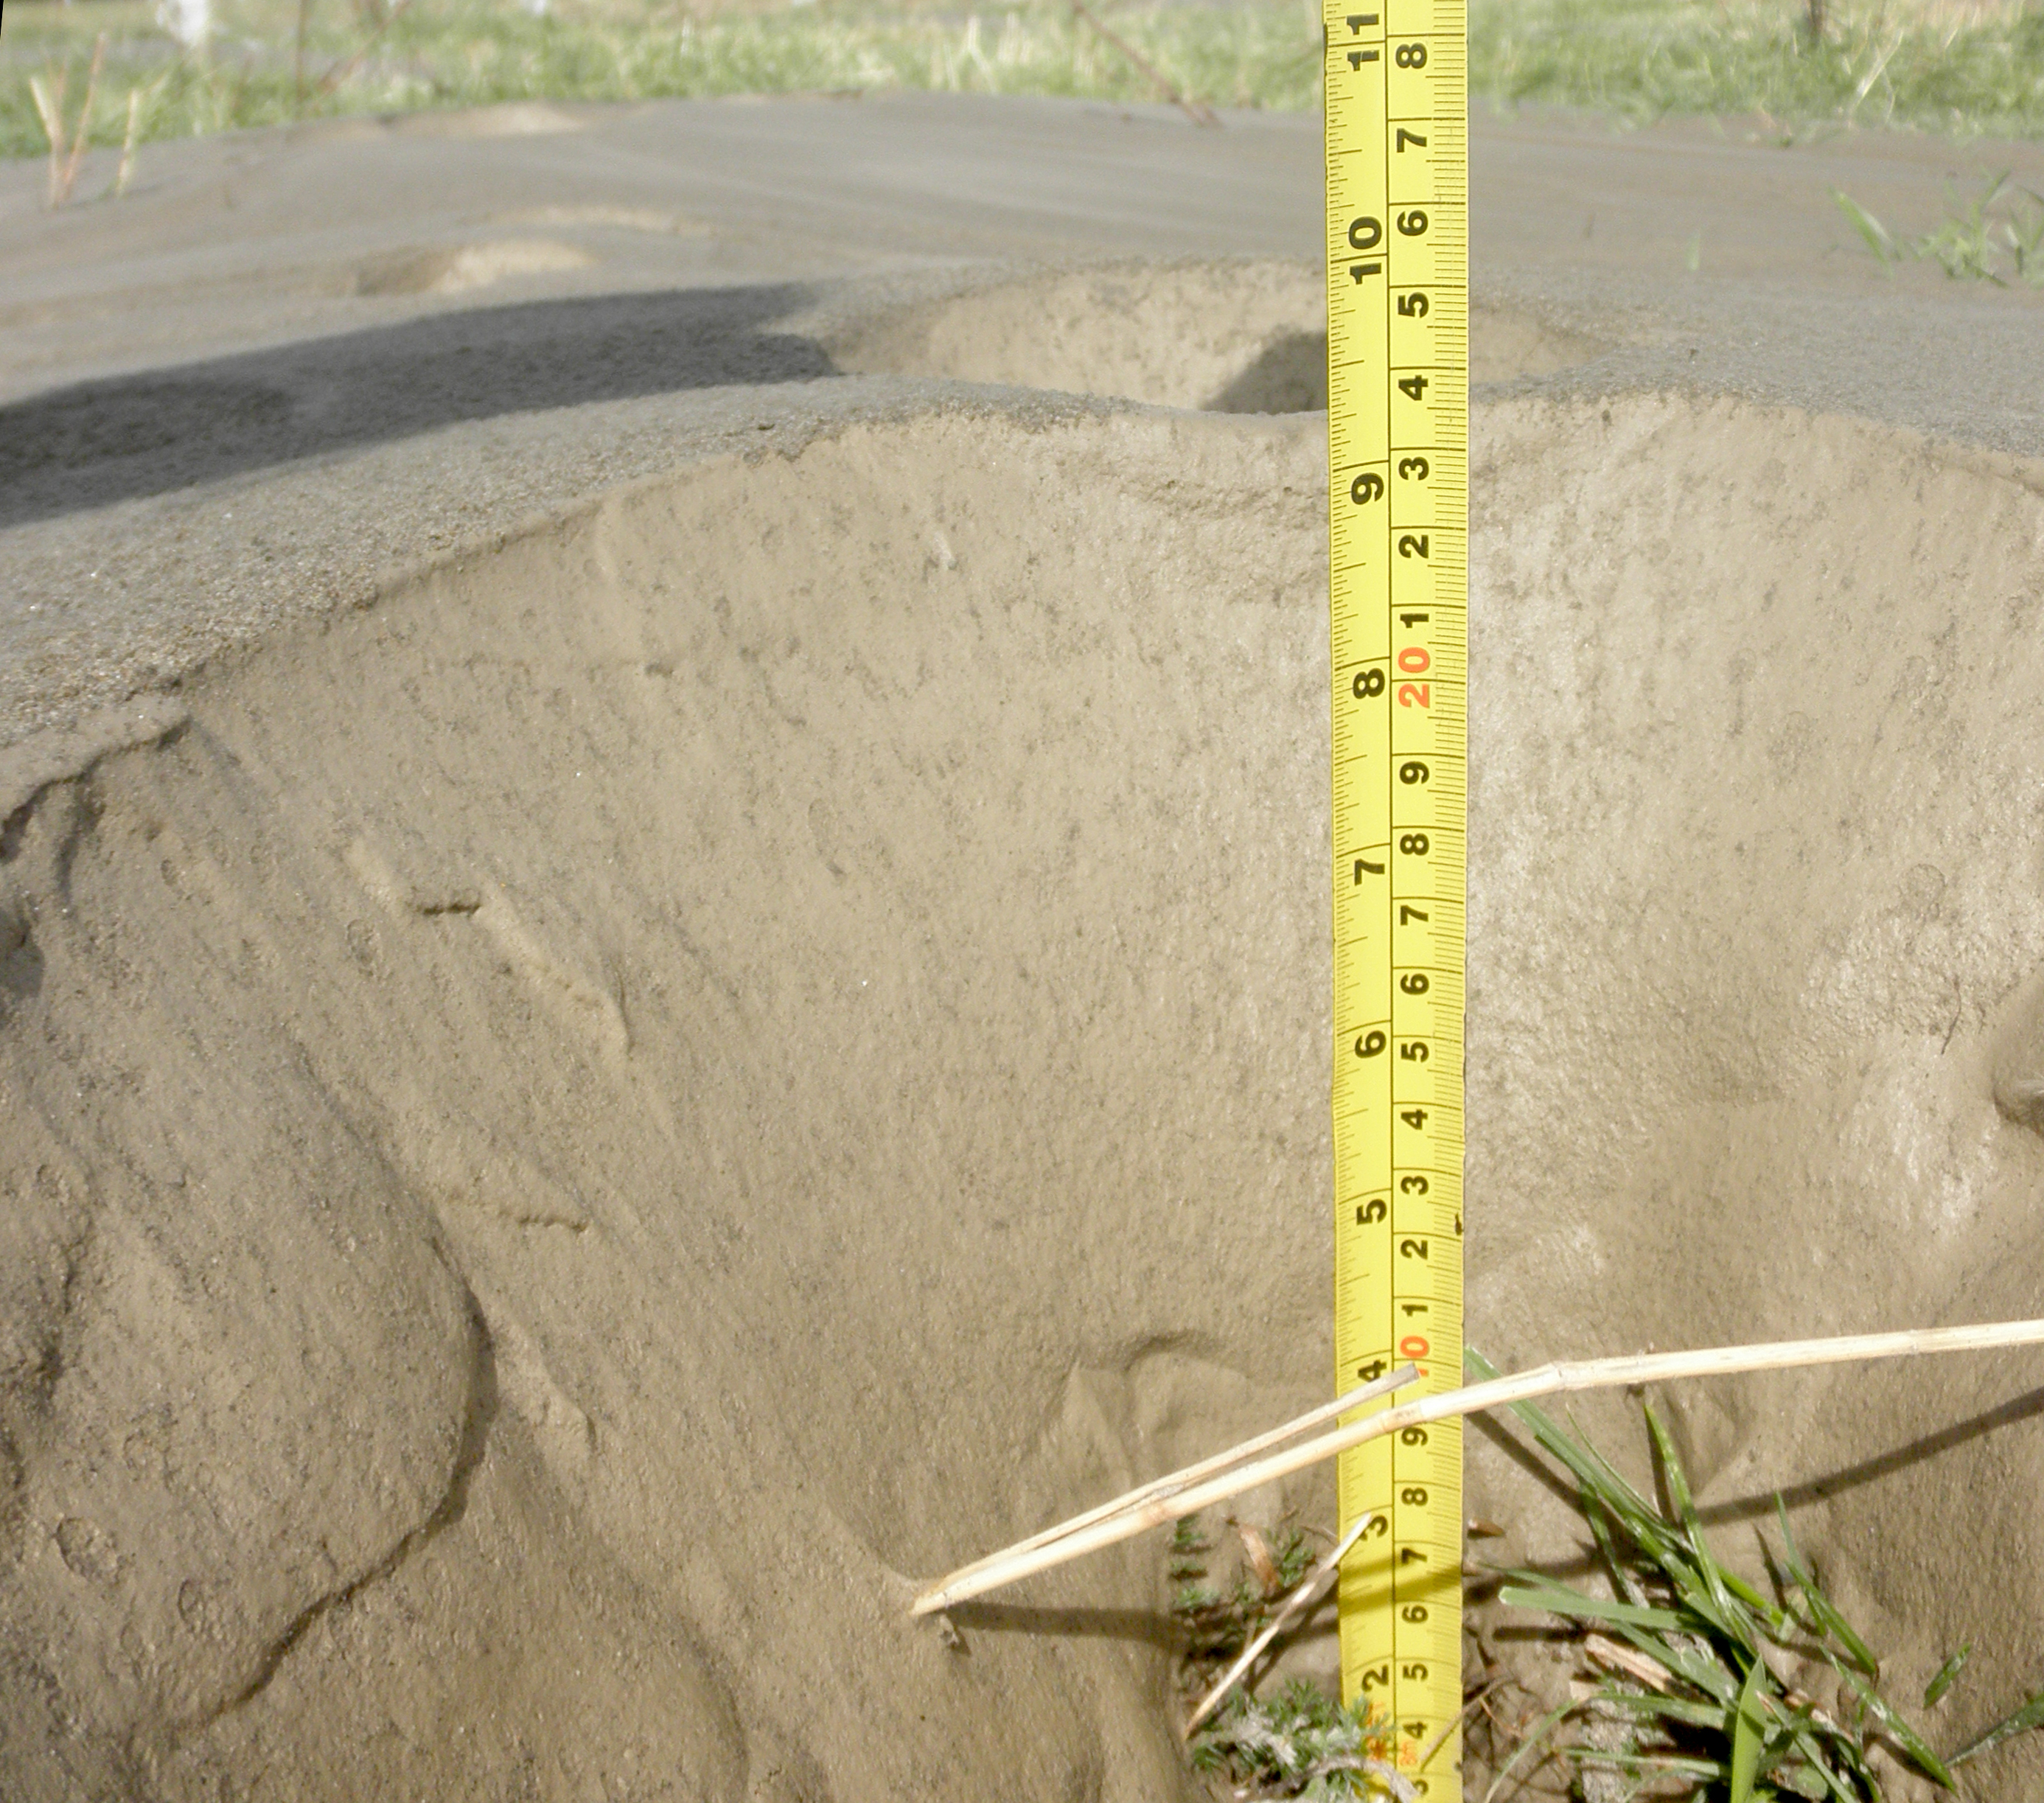
Table S3. Surface effects of liquefaction during the 2010 Darfield earthquake in agricultural paddock at the Marchand site.
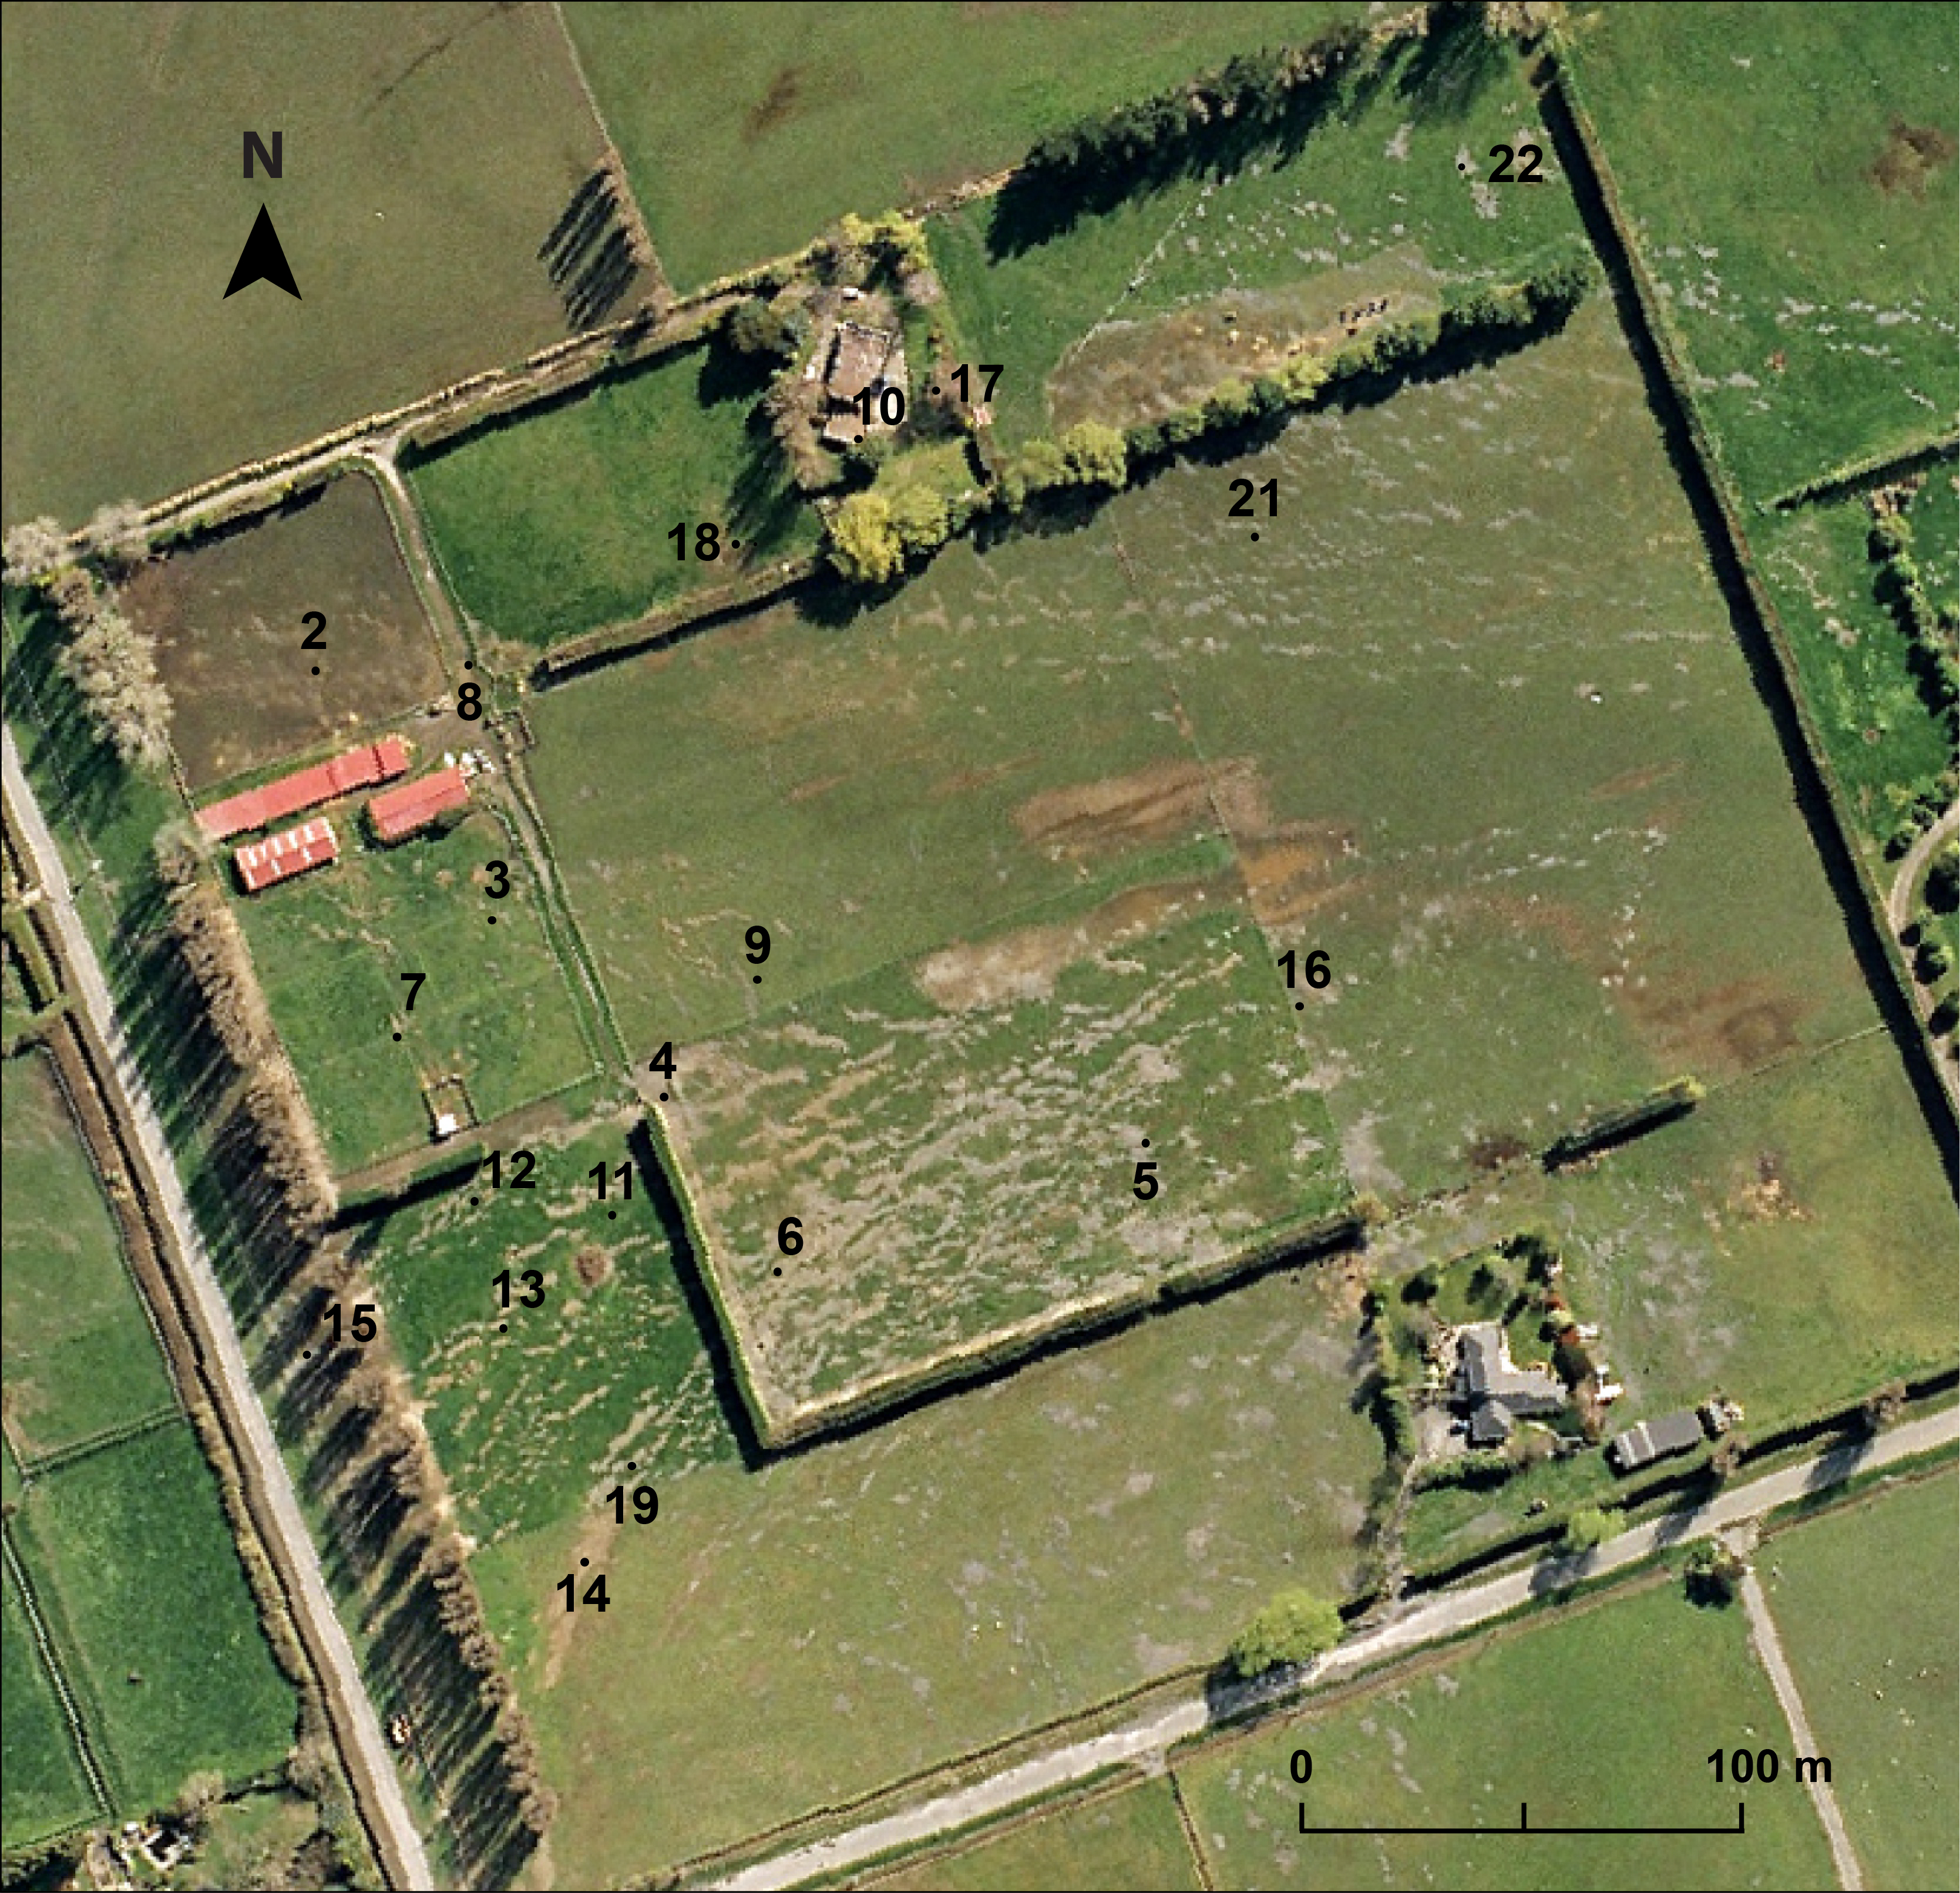
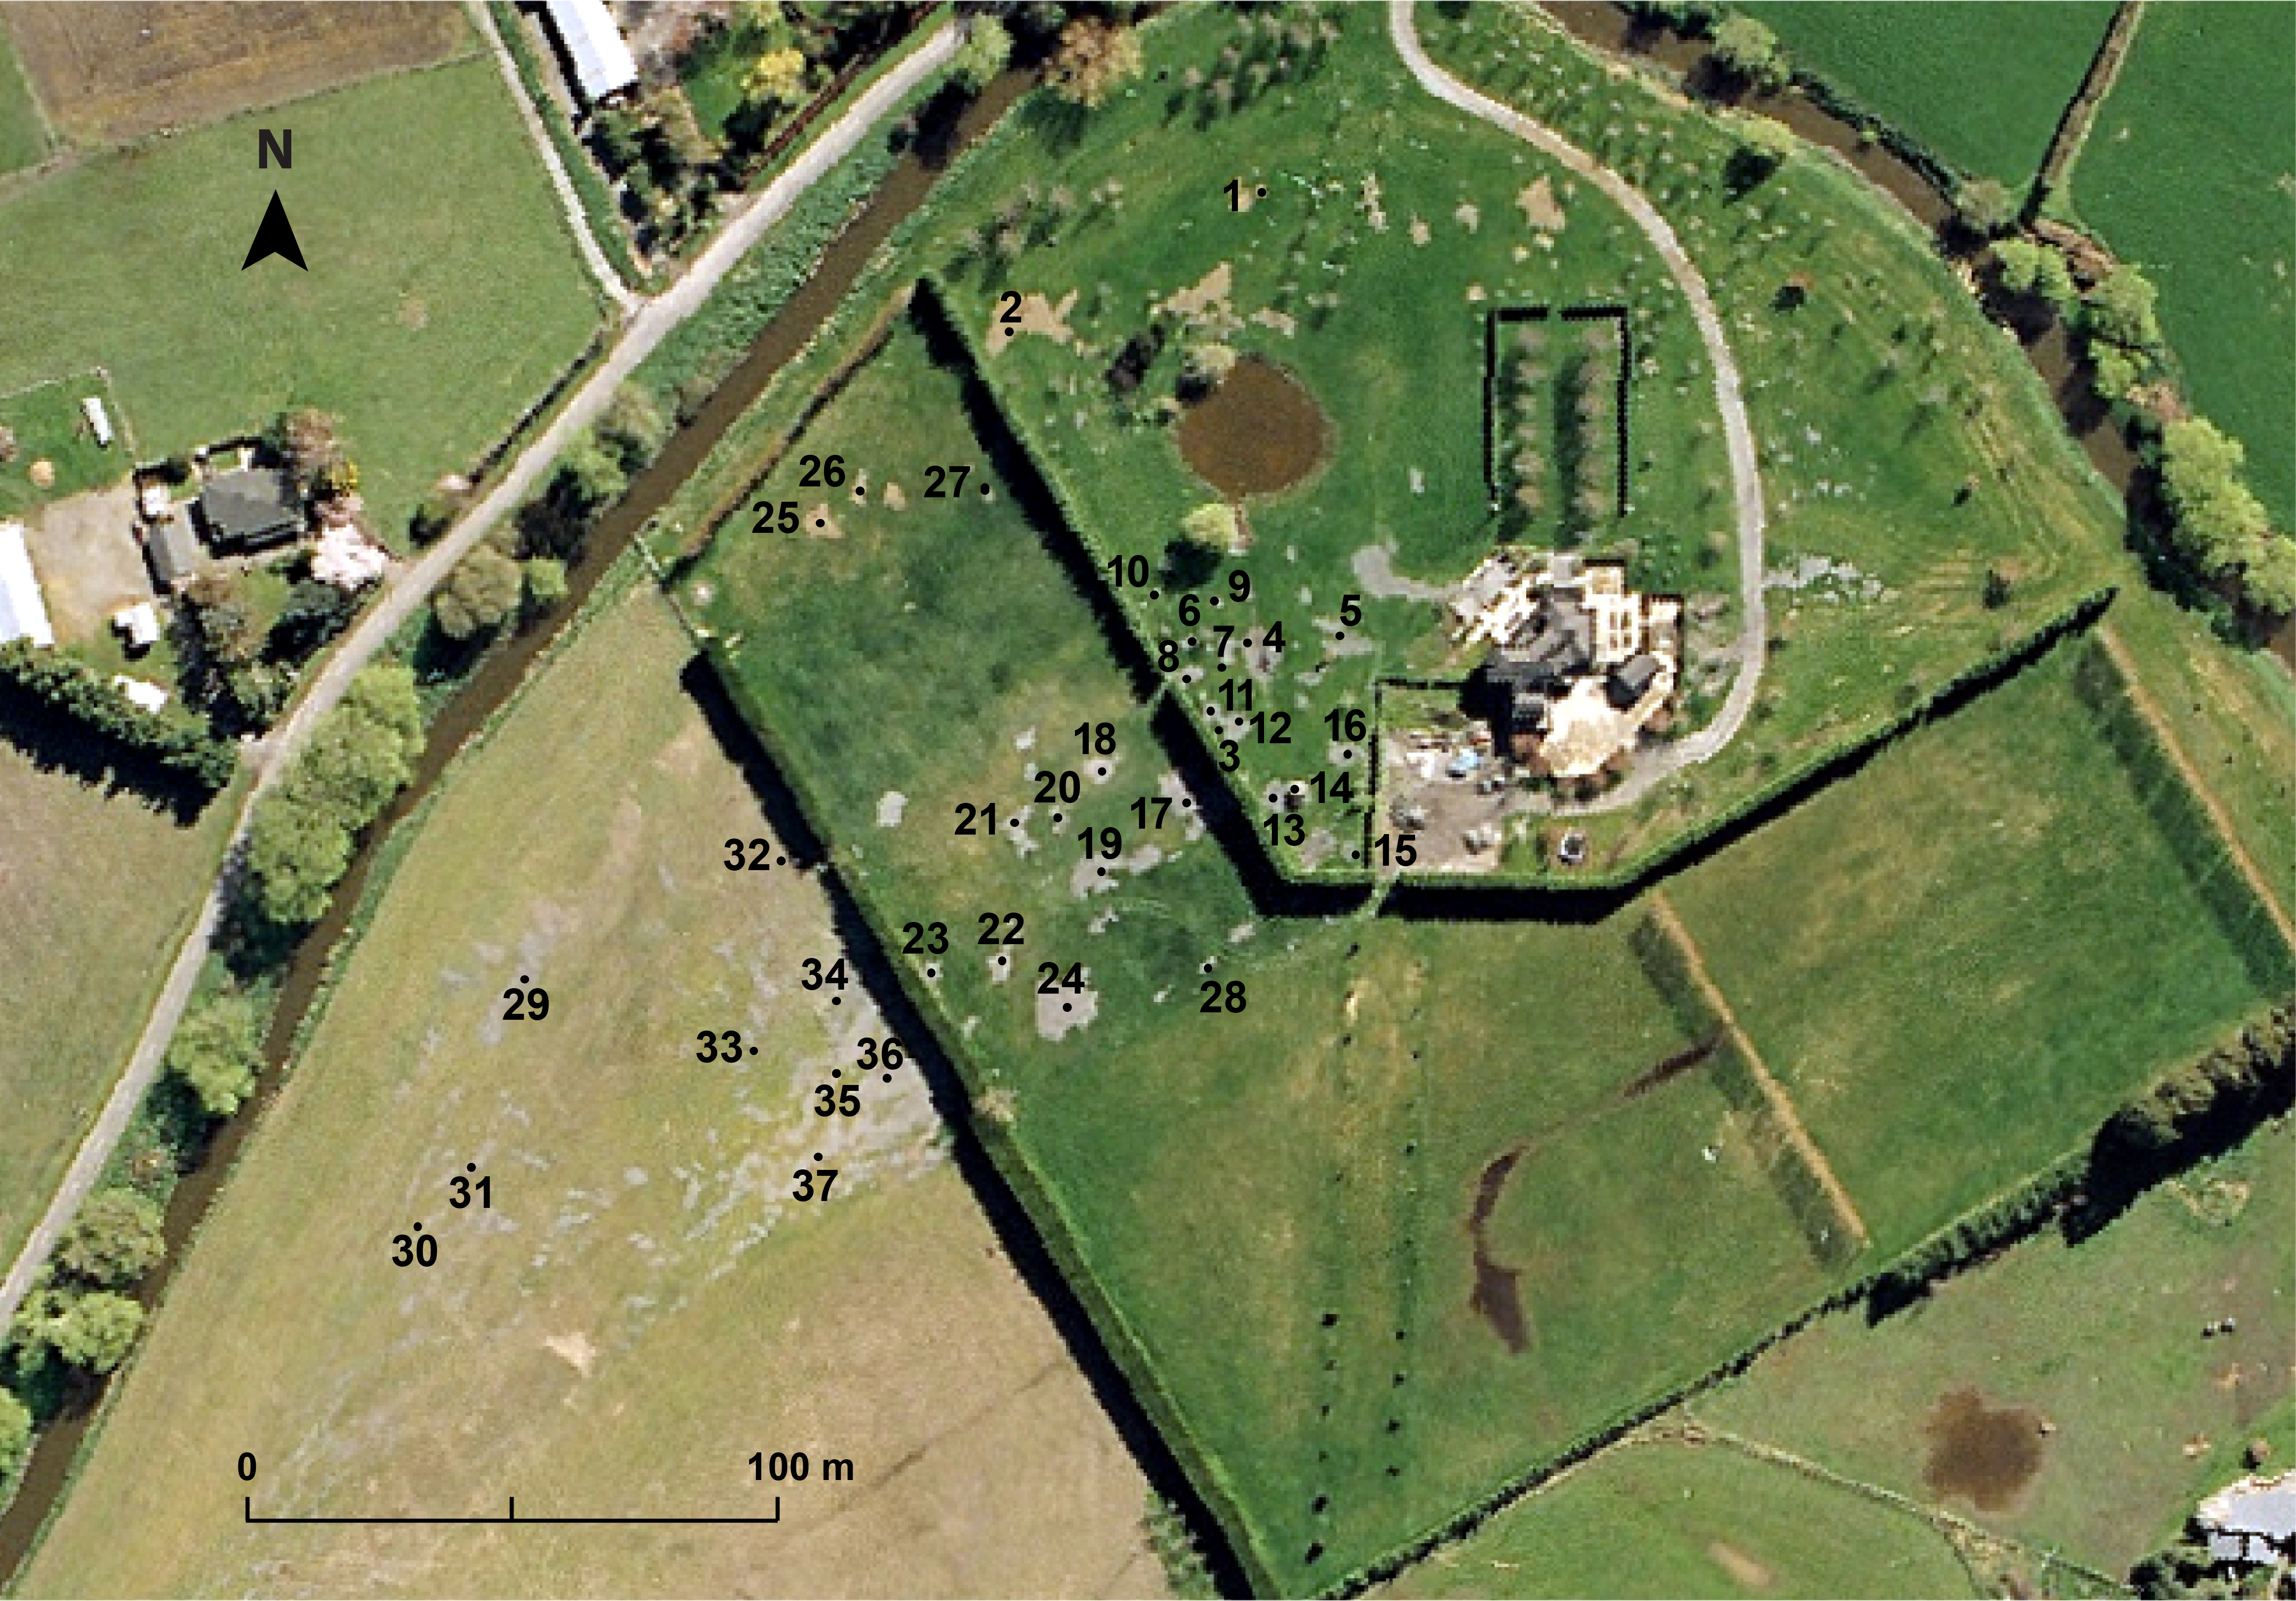
Figure S1. Aerial photograph of the Hardwick site acquired after the 4 September 2010 M 7.1 Darfield earthquake (modified from Almond et al., 2010) showing the locations (e.g., 2 or L2; 3 or L3) of liquefaction features summarized in Table S1 and shown in Figures S2–S38.
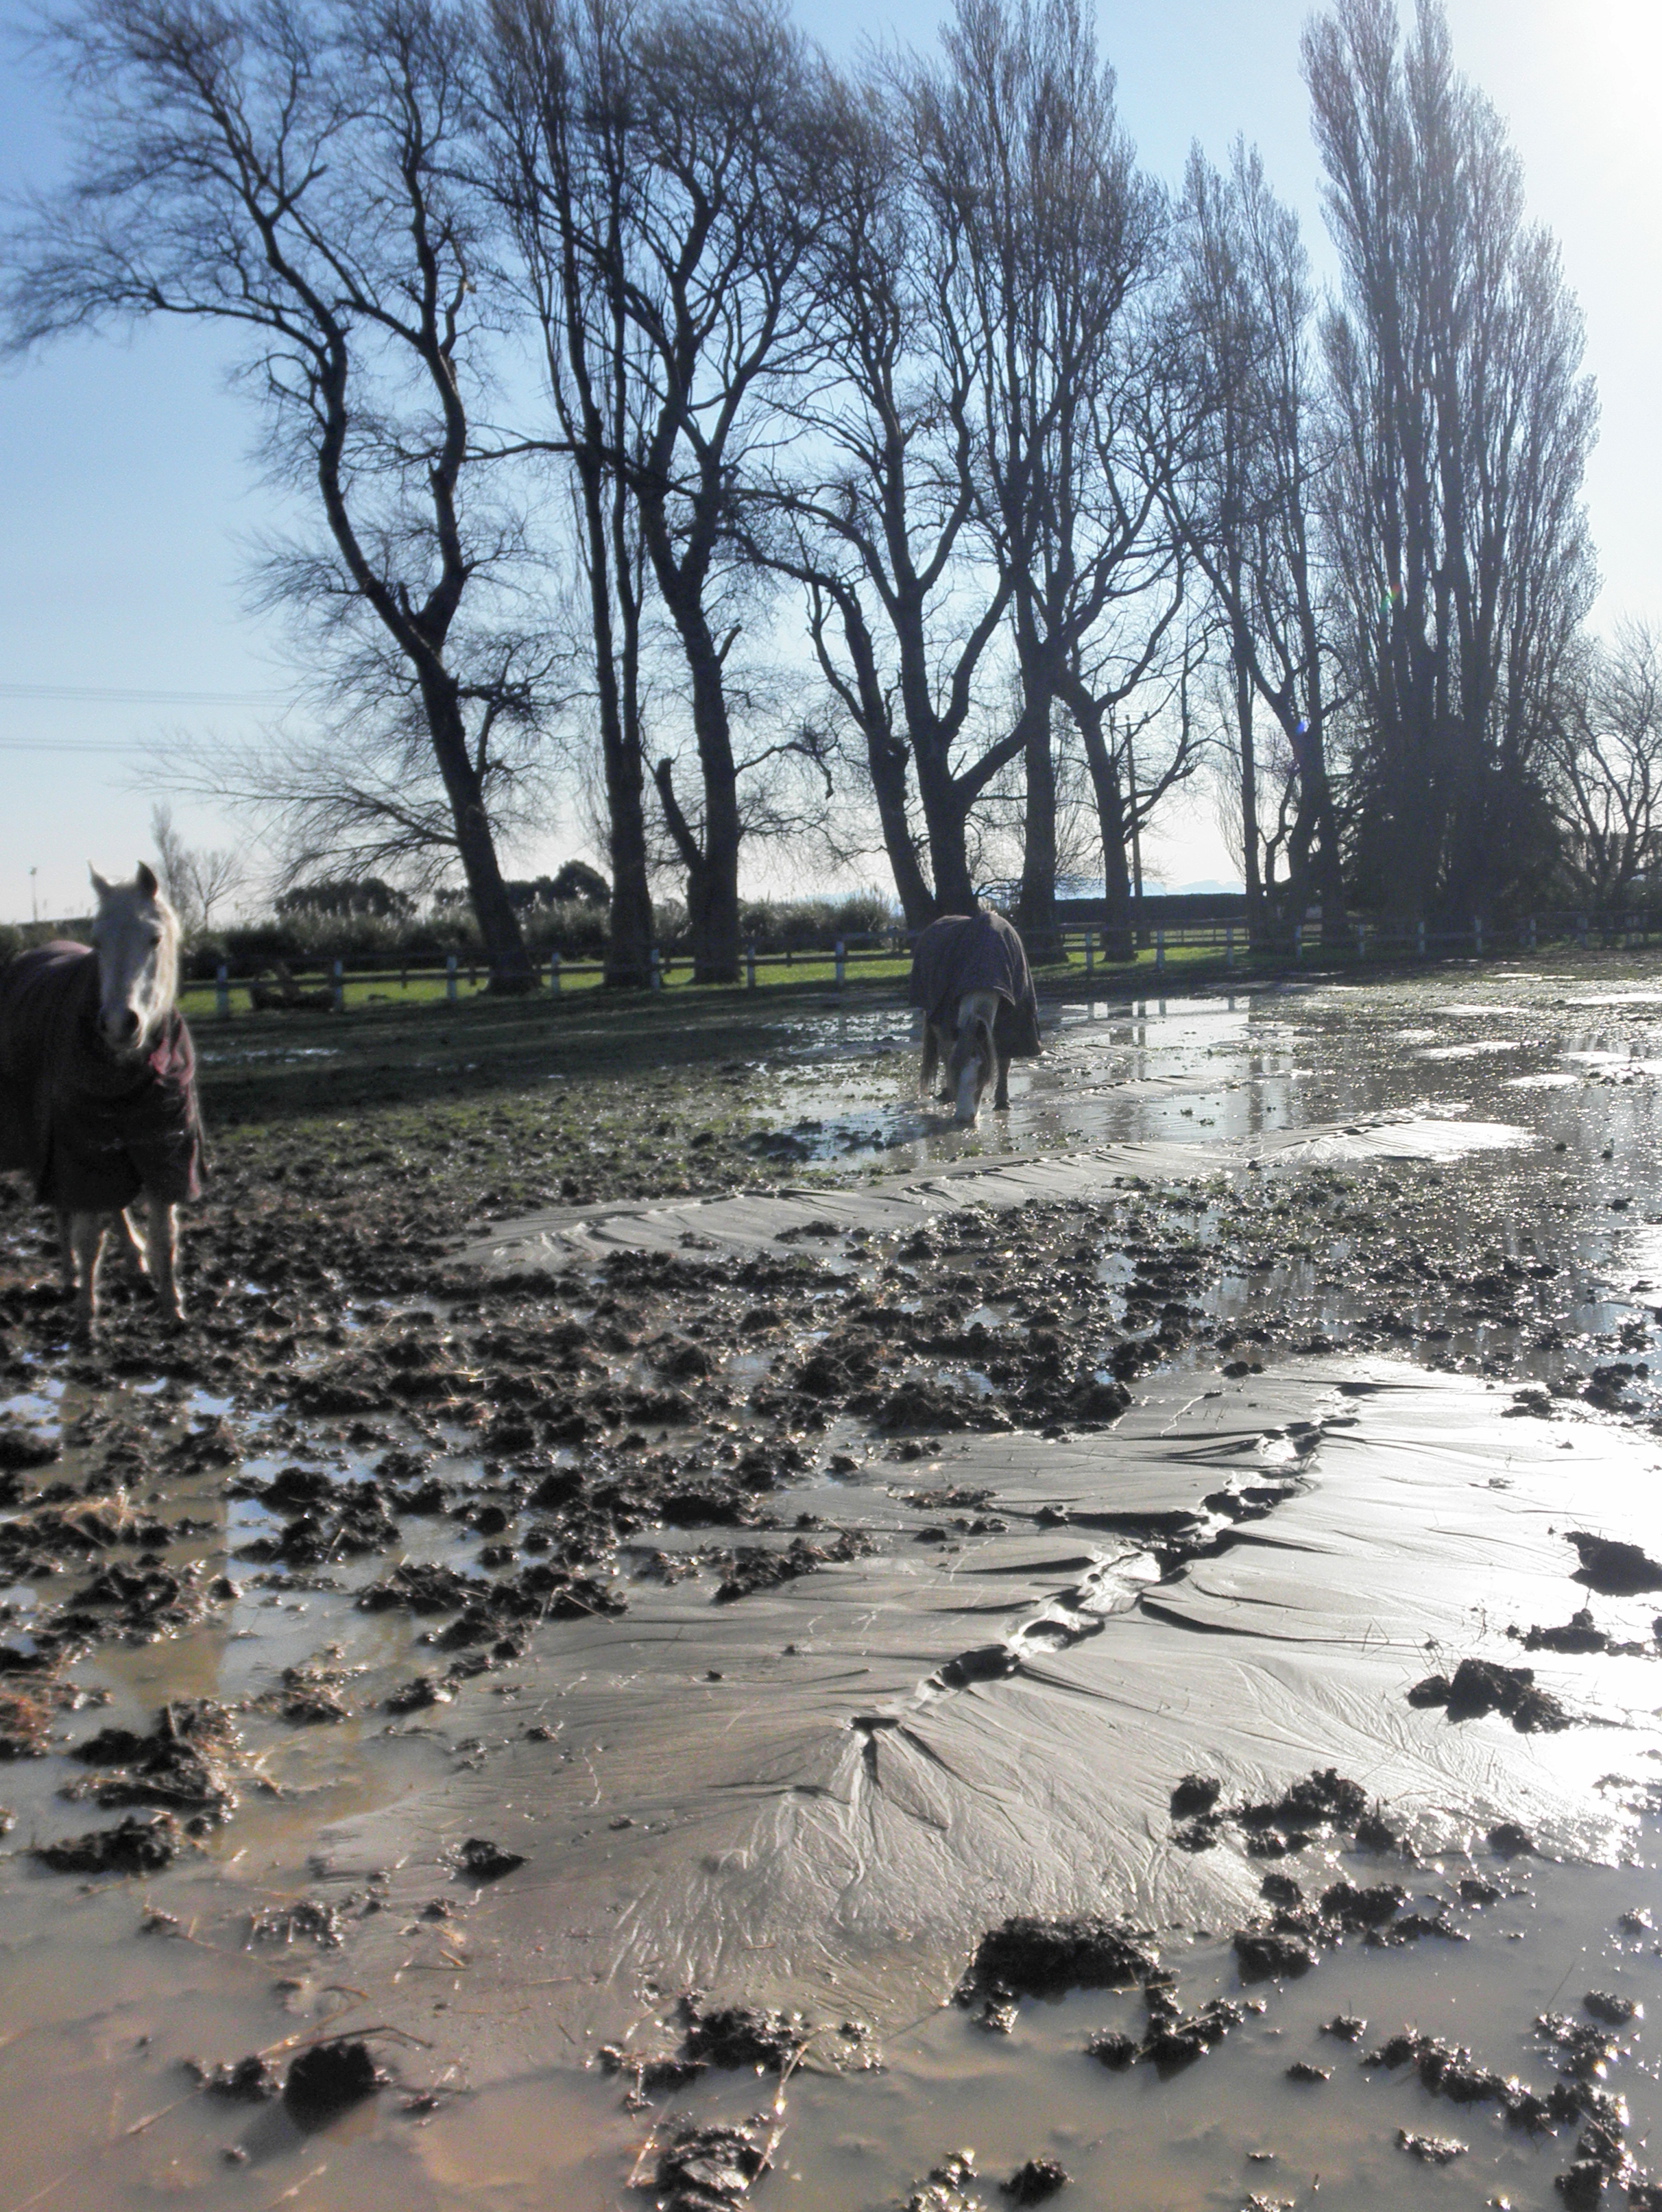
Figure S2. Sand blows and sand fissures that formed at the Hardwick site location L2 during the 4 September 2010 M 7.1 Darfield earthquake. A horse provides a sense of scale. Photograph by C. Hardwick and R. Hardwick.
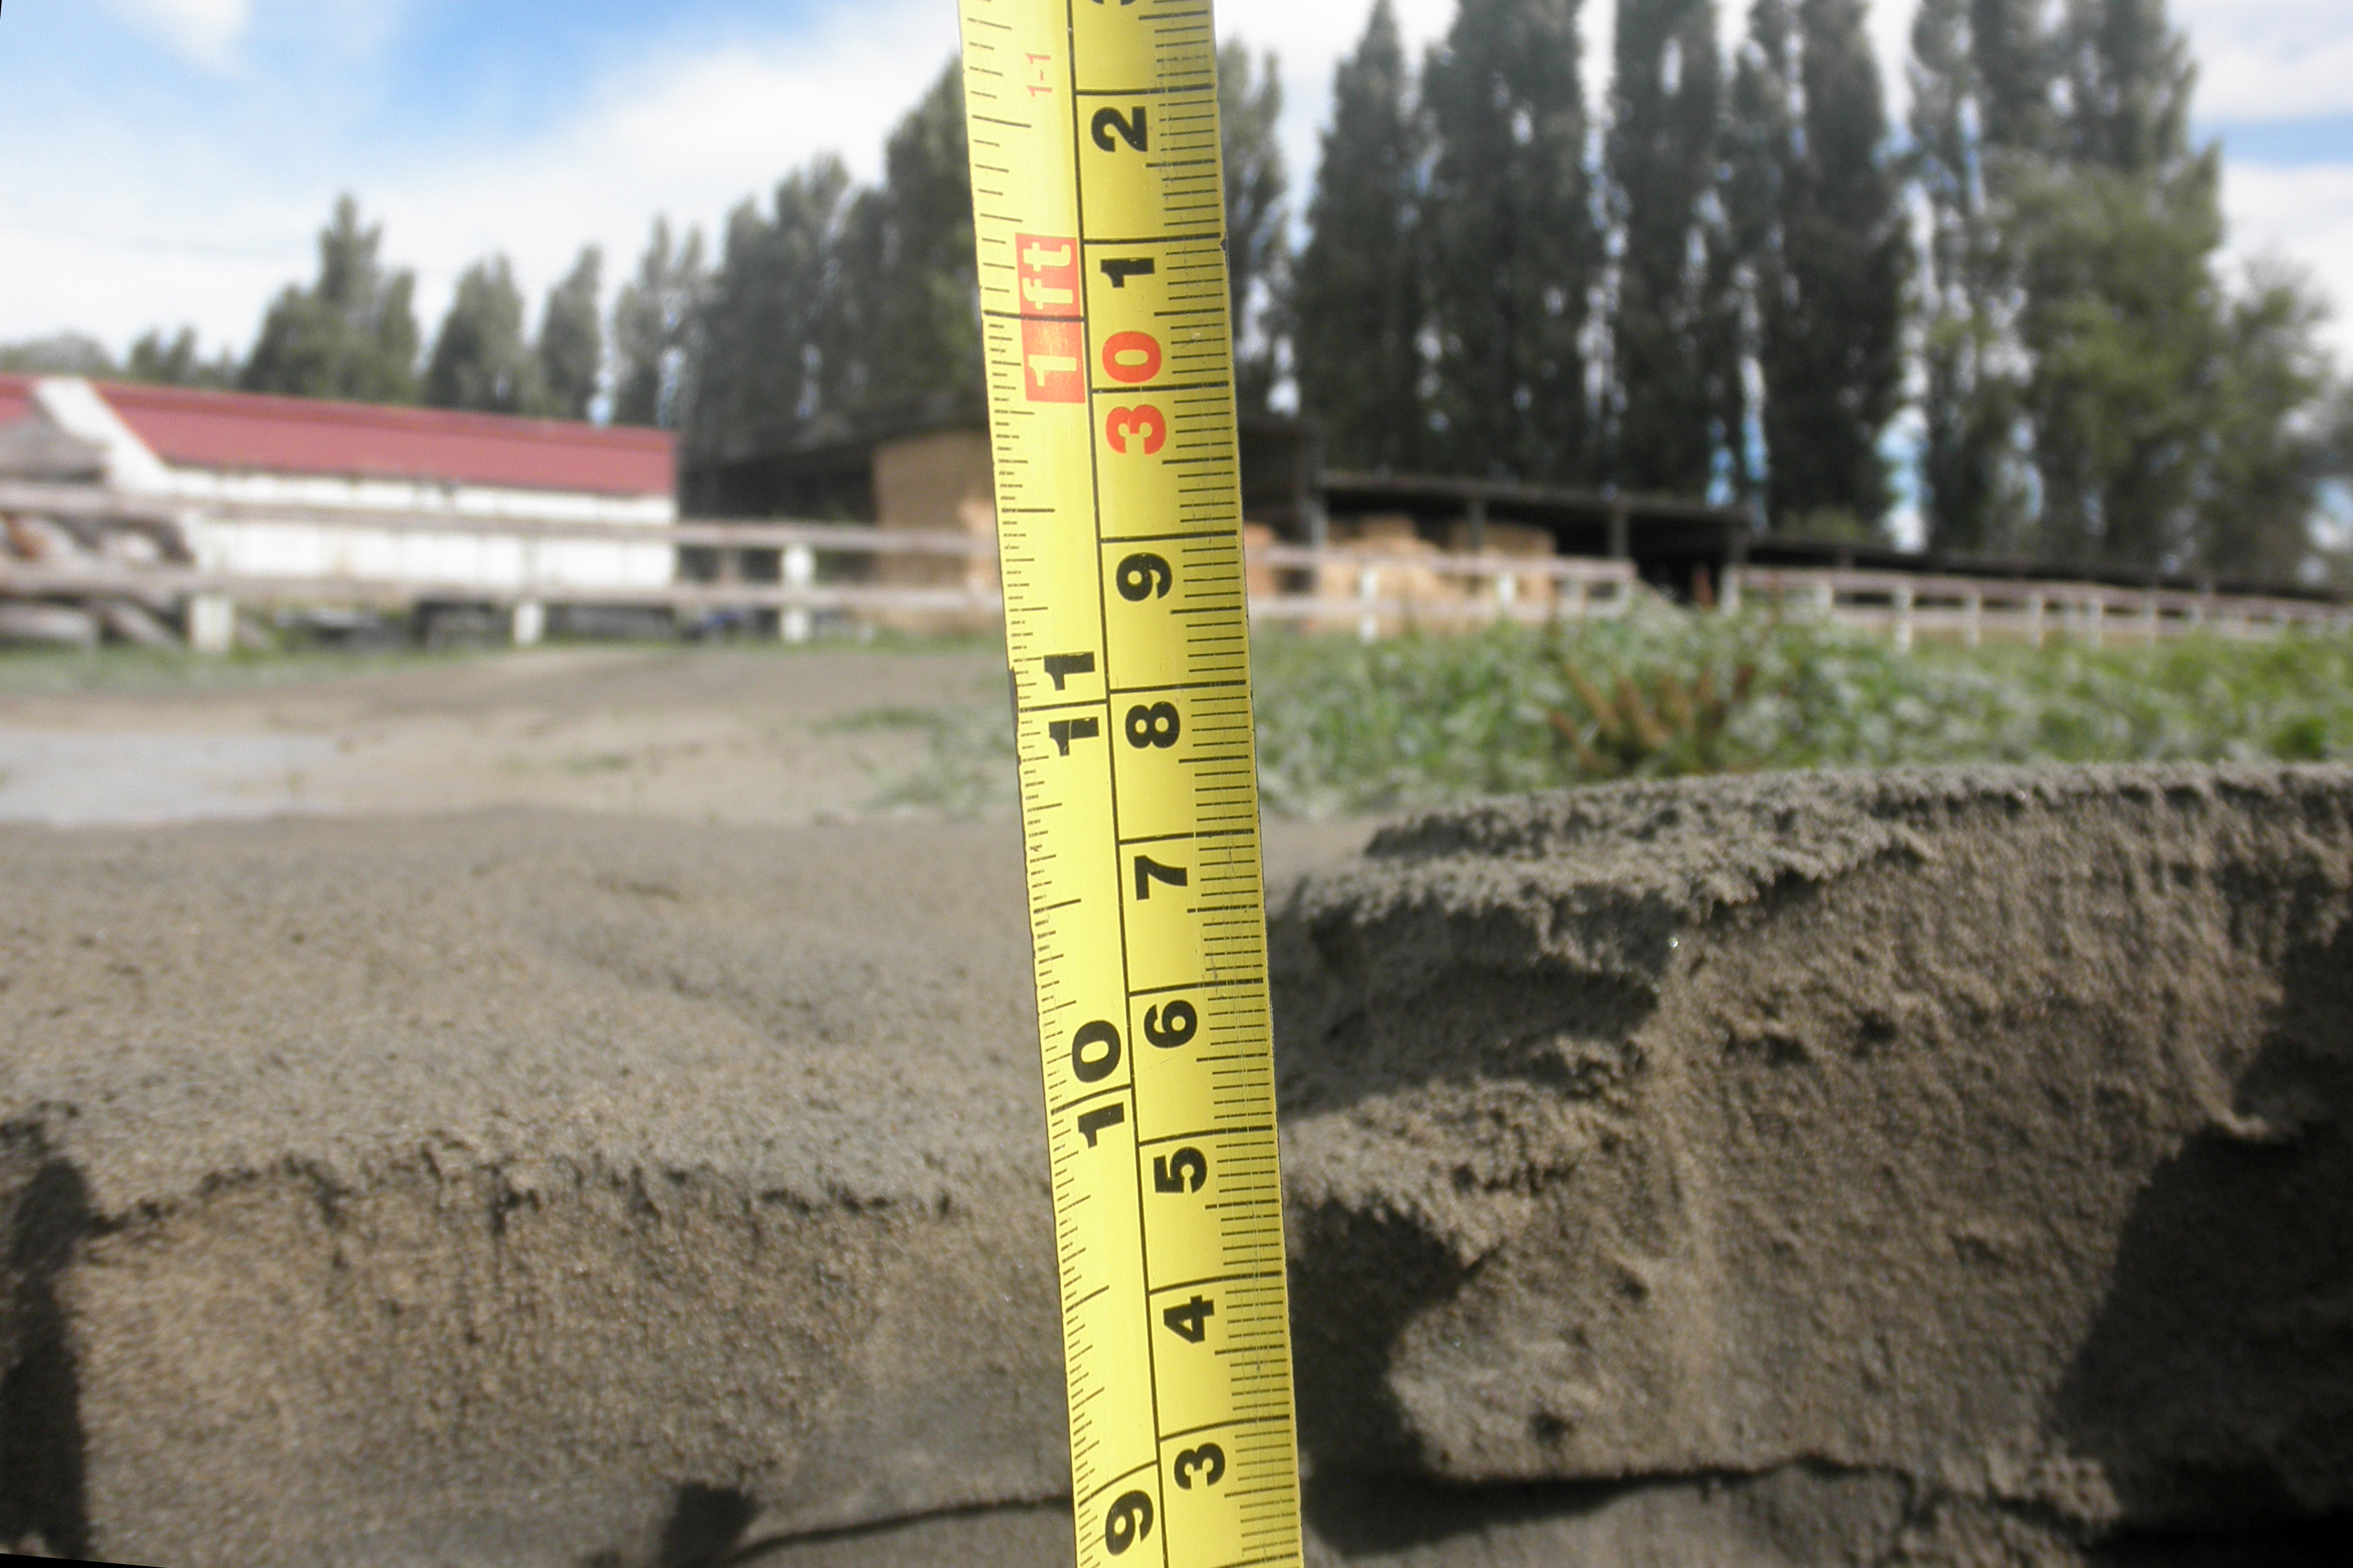
Figure S3. Sand blow that formed at the Hardwick site location L2 during the 22 February 2011 M 6.2 Christchurch earthquakes. Thickness of this particular sand blow was ~25–27 cm, as measured in its vent. A measuring tape provides scale. Photograph by C. Hardwick and R. Hardwick.
Figure S4. Sand fissure that formed at the Hardwick site location L3 during the 4 September 2010 M 7.1 Darfield earthquake. Grass provides a sense of scale. Photograph by C. Hardwick and R. Hardwick.
Figure S5. Sand fissures that formed at the Hardwick site location L3 during the 4 September 2010 M 7.1 Darfield earthquake. Note the vented water that is ponded on the ground surface. A metal fence post provides a sense of scale. Photograph by C. Hardwick and R. Hardwick.
Figure S6. Sand blows and fissures that formed at the Hardwick site location L3 during the 22 February 2011 M 6.2 Christchurch earthquakes. Note that vented water is ponded on the ground surface. Photograph by C. Hardwick and R. Hardwick.
Figure S7. Vent of sand blow that formed at the Hardwick site location L3 during the 22 February 2011 M 6.2 Christchurch earthquakes. Thickness of this particular sand blow was ~23 cm. Note shallowly dipping crater fill behind the measuring tape. Fines coating the surfaces of the vent structure are probably related to the settling of suspended sediment out of vented water following the event. A measuring tape provides the scale. Photograph by C. Hardwick and R. Hardwick.
Figure S8. Vent of sand blow that formed at the Hardwick site location L3 during the 22 February 2011 M 6.2 Christchurch earthquakes. Thickness of this particular sand blow was ~37 cm. Again fines coat the surface of the vent structure. A measuring tape provides the scale. Photograph by C. Hardwick and R. Hardwick.
Figure S9. Vent of sand fissure that formed at the Hardwick site location L3 during the 22 February 2011 M 6.2 Christchurch earthquakes. Thickness of this particular sand fissure was ~22–24 cm. Note that fines coat the surface of the vent structure. A measuring tape provides the scale. Photograph by C. Hardwick and R. Hardwick.
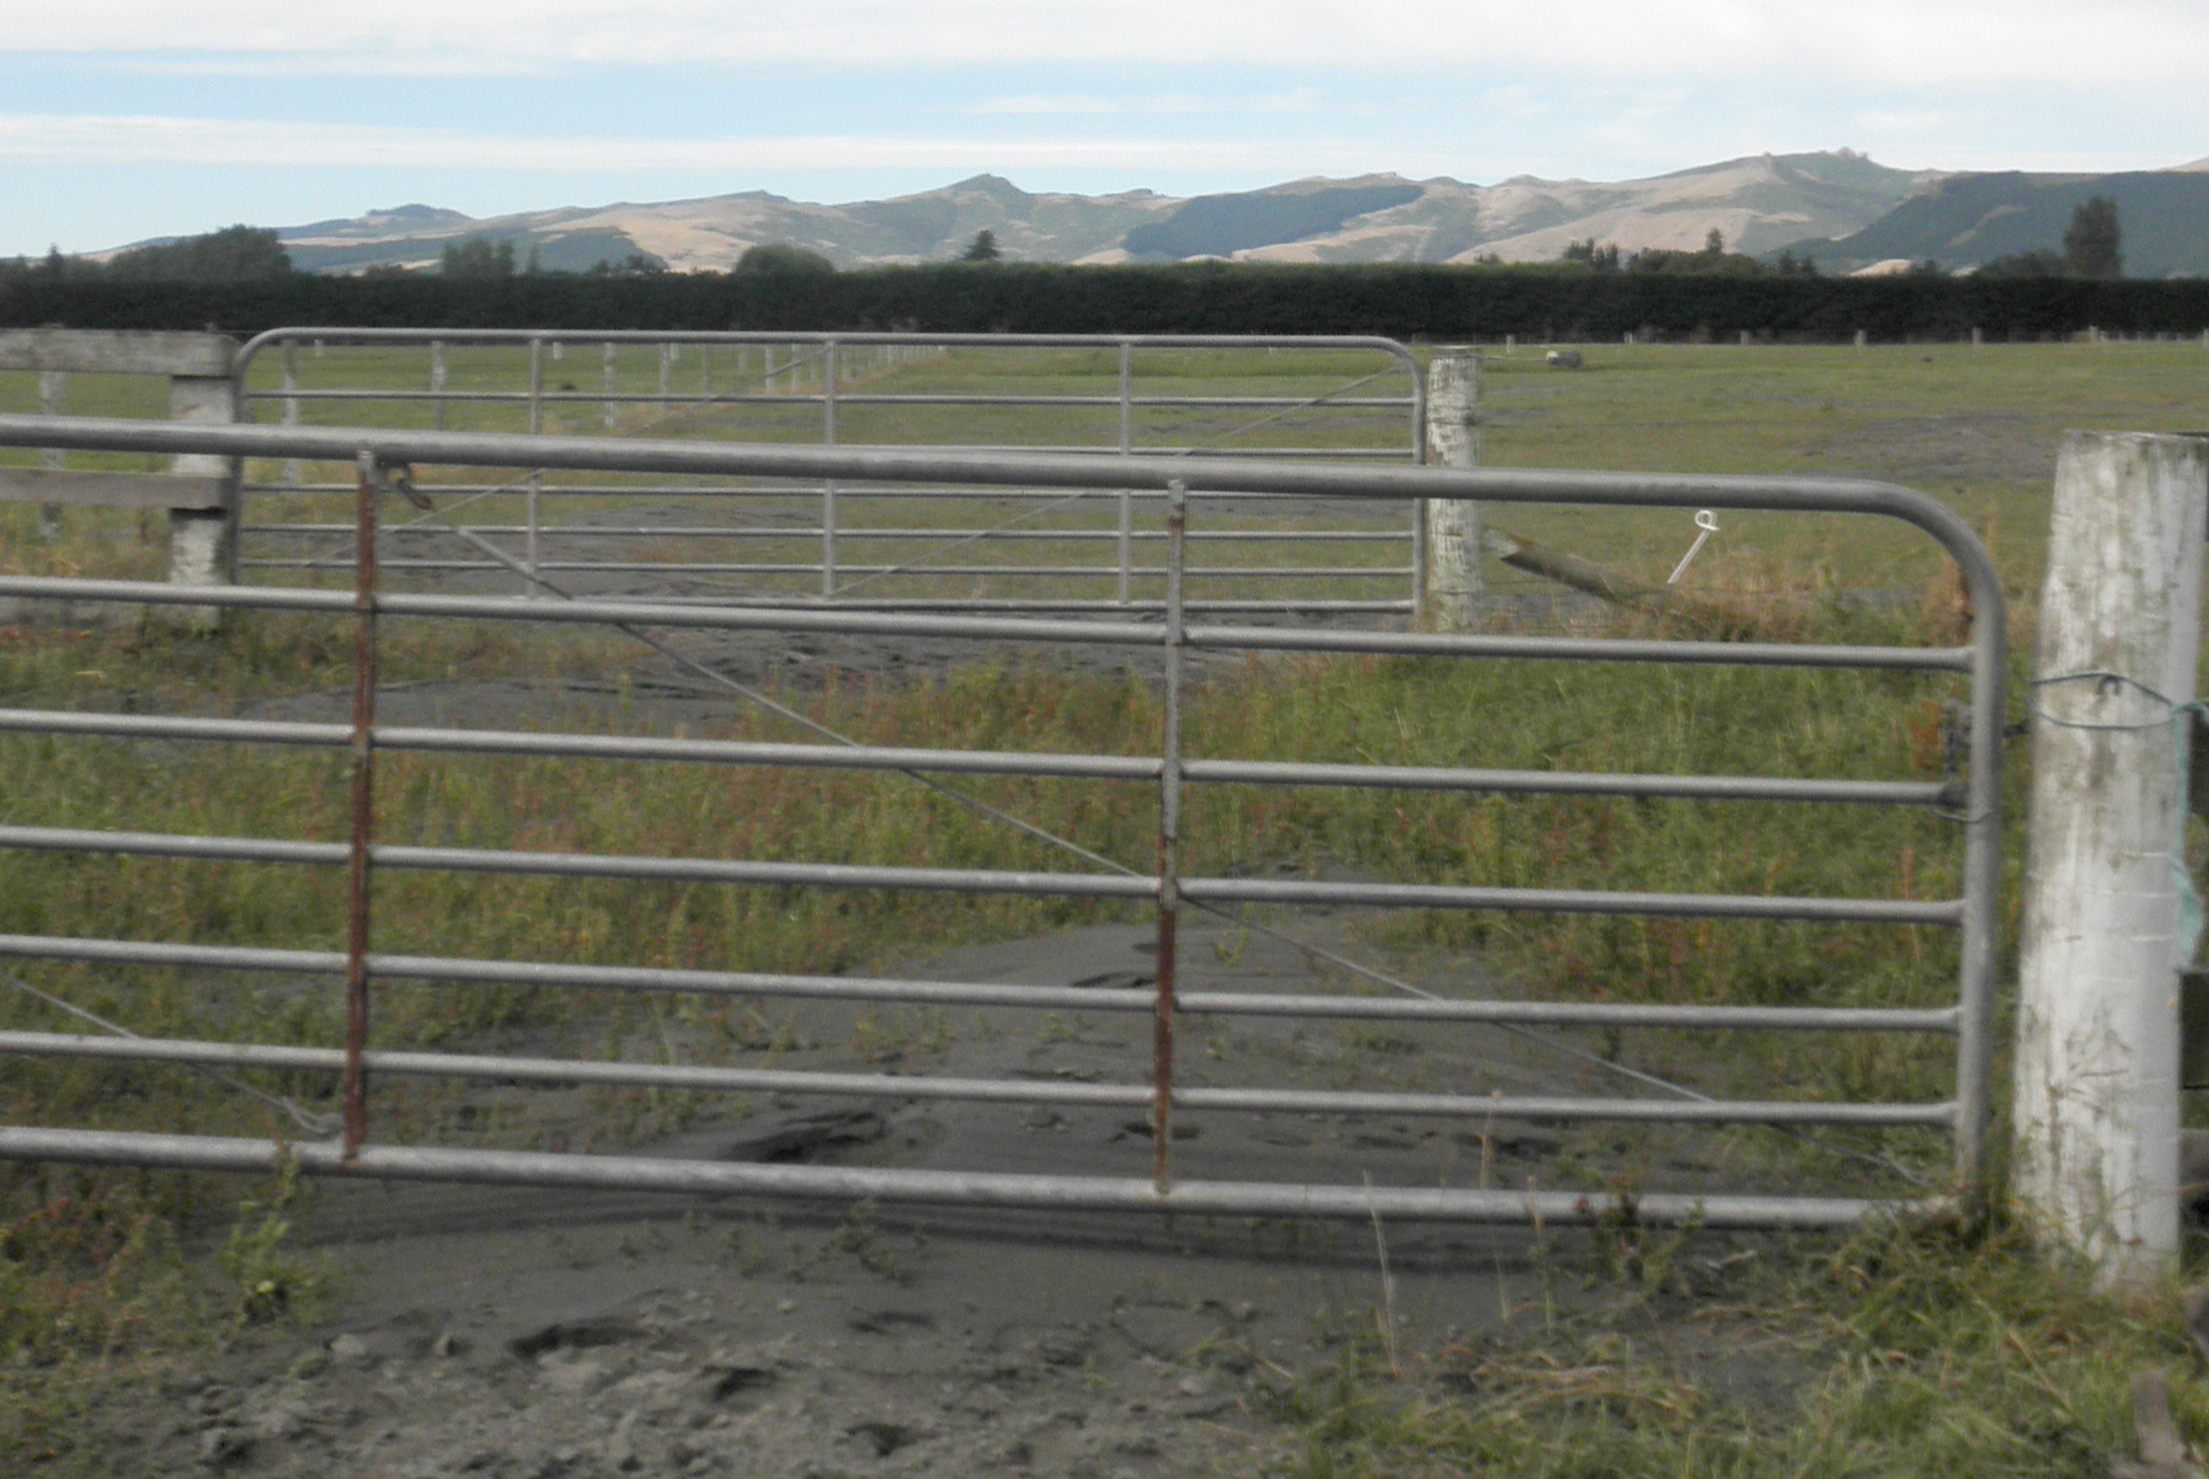
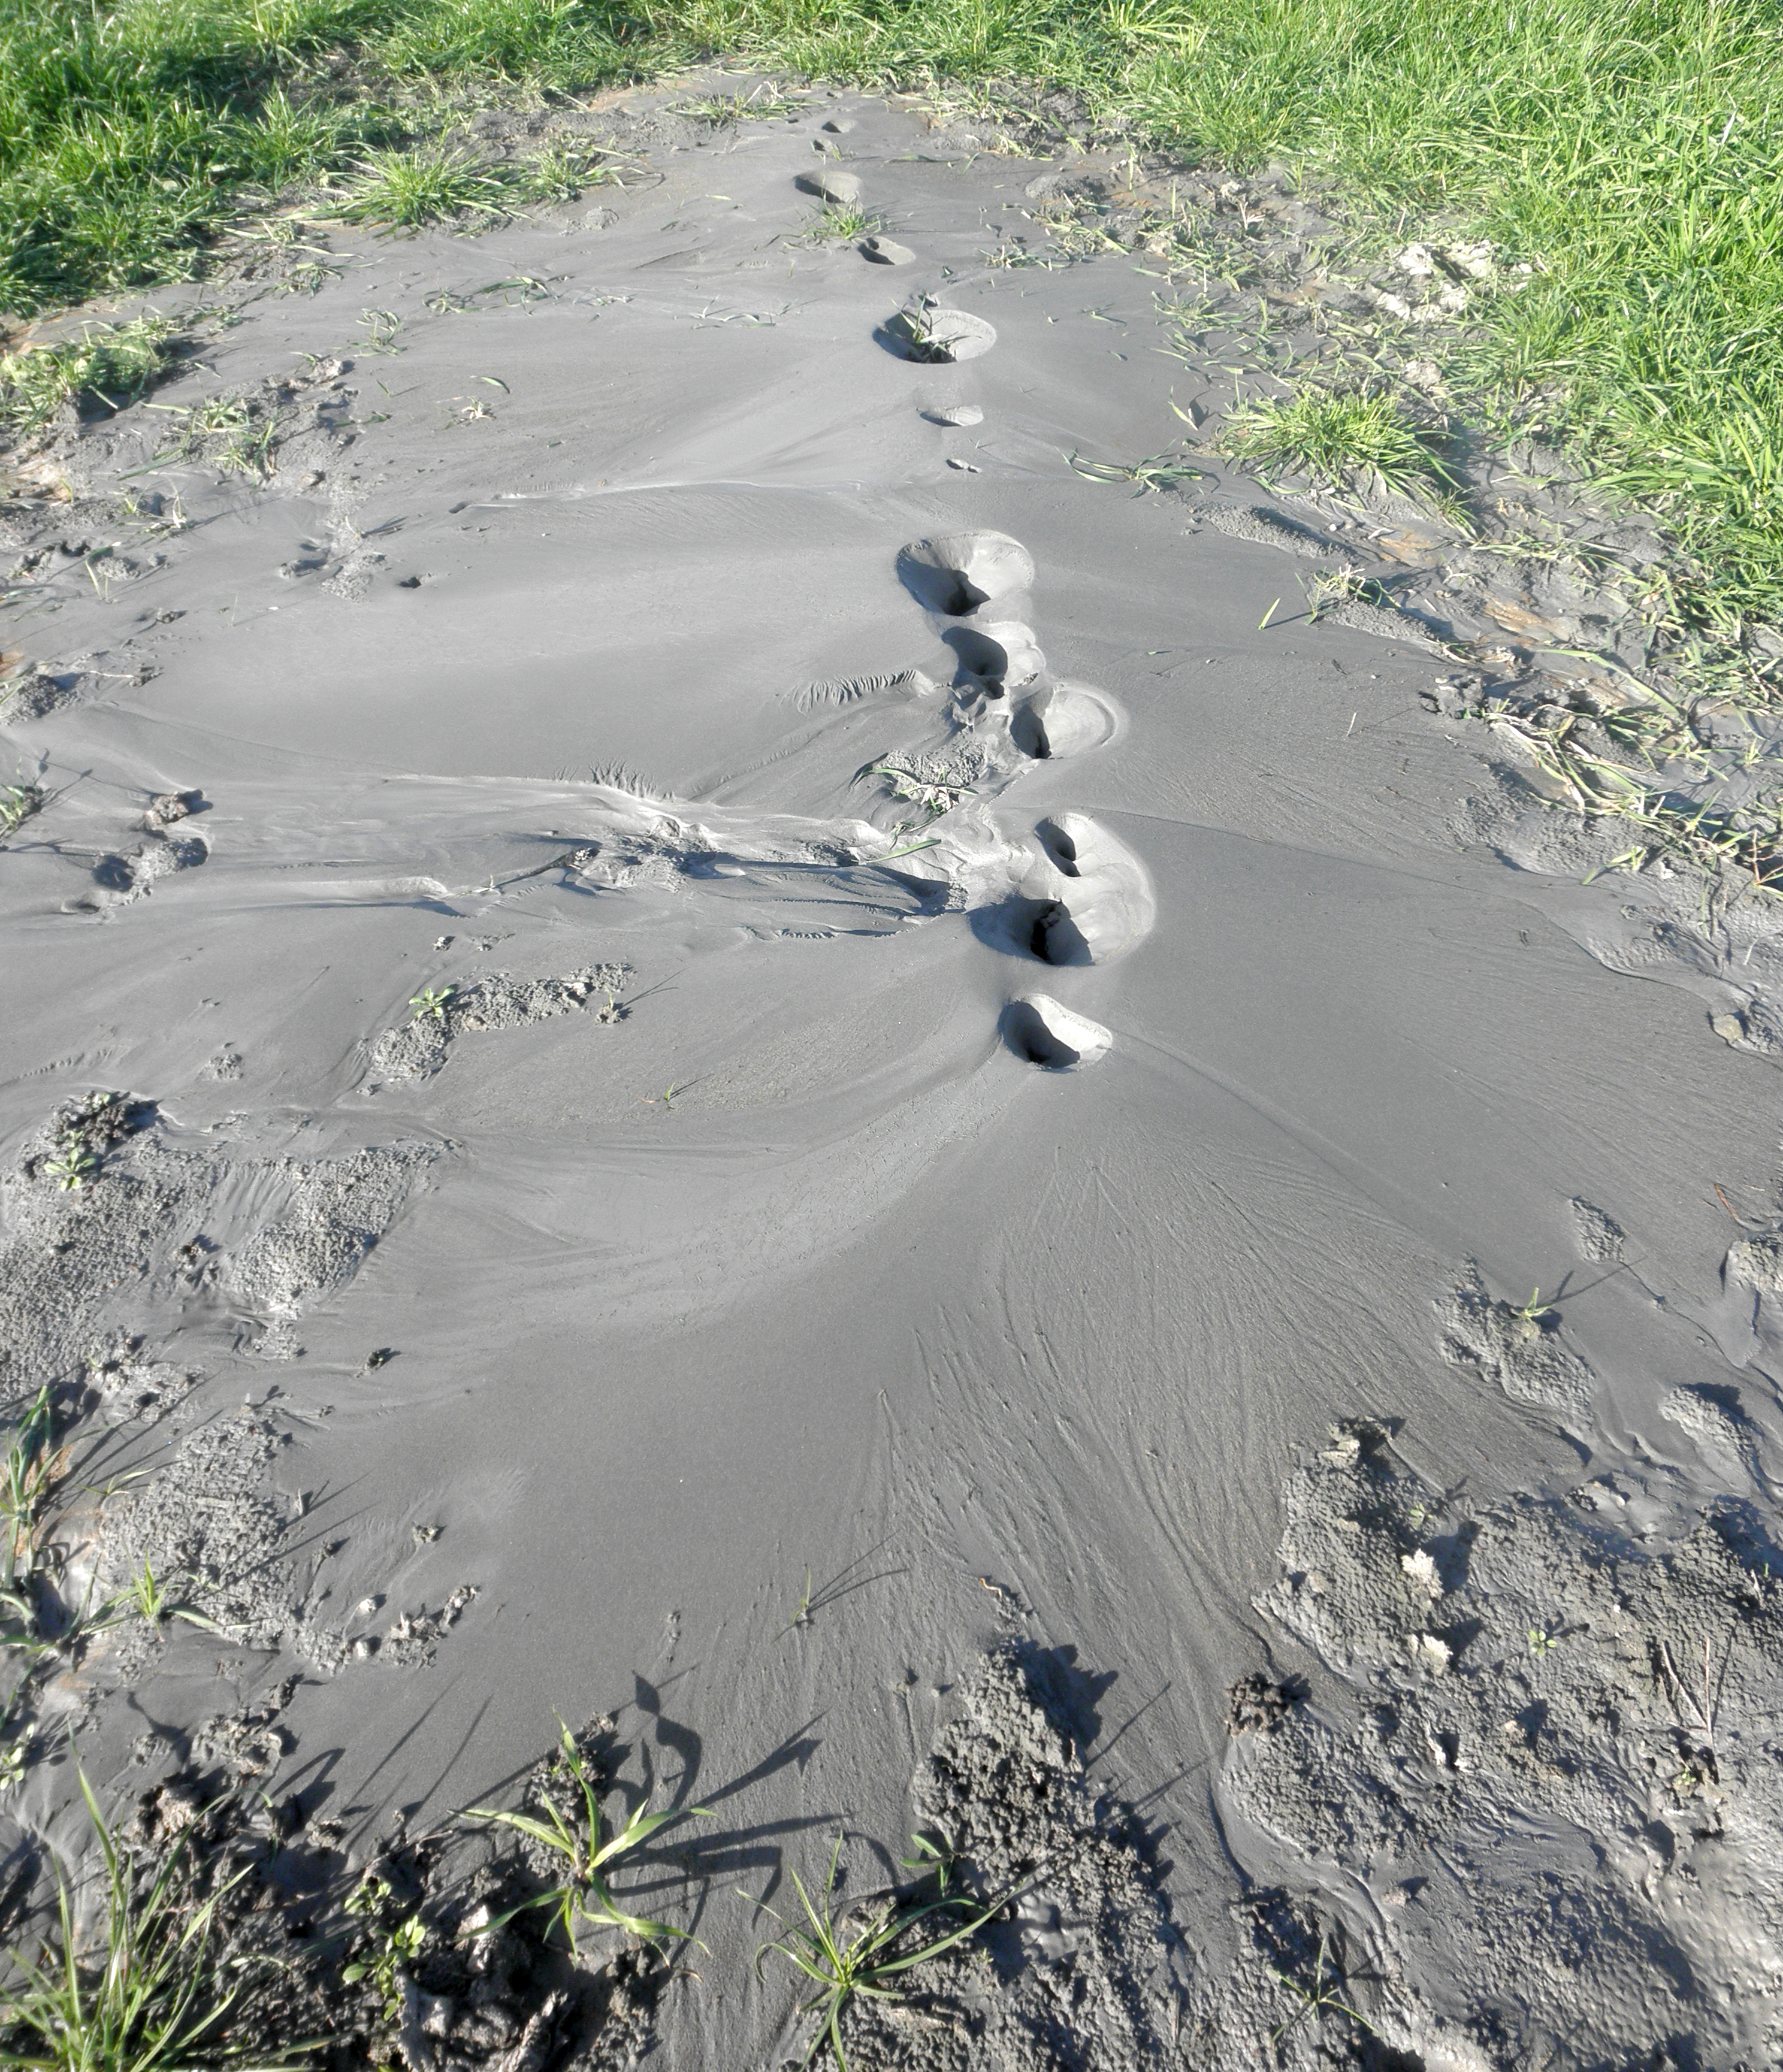
Figure S10. Sand–silt fissure with multiple vents that formed at the Hardwick site location L4 during the 4 September 2010 M 7.1 Darfield earthquake. The sand fissure is composed of sand and silt. A gate and boots provide a sense of scale. Photograph by C. Hardwick and R. Hardwick.
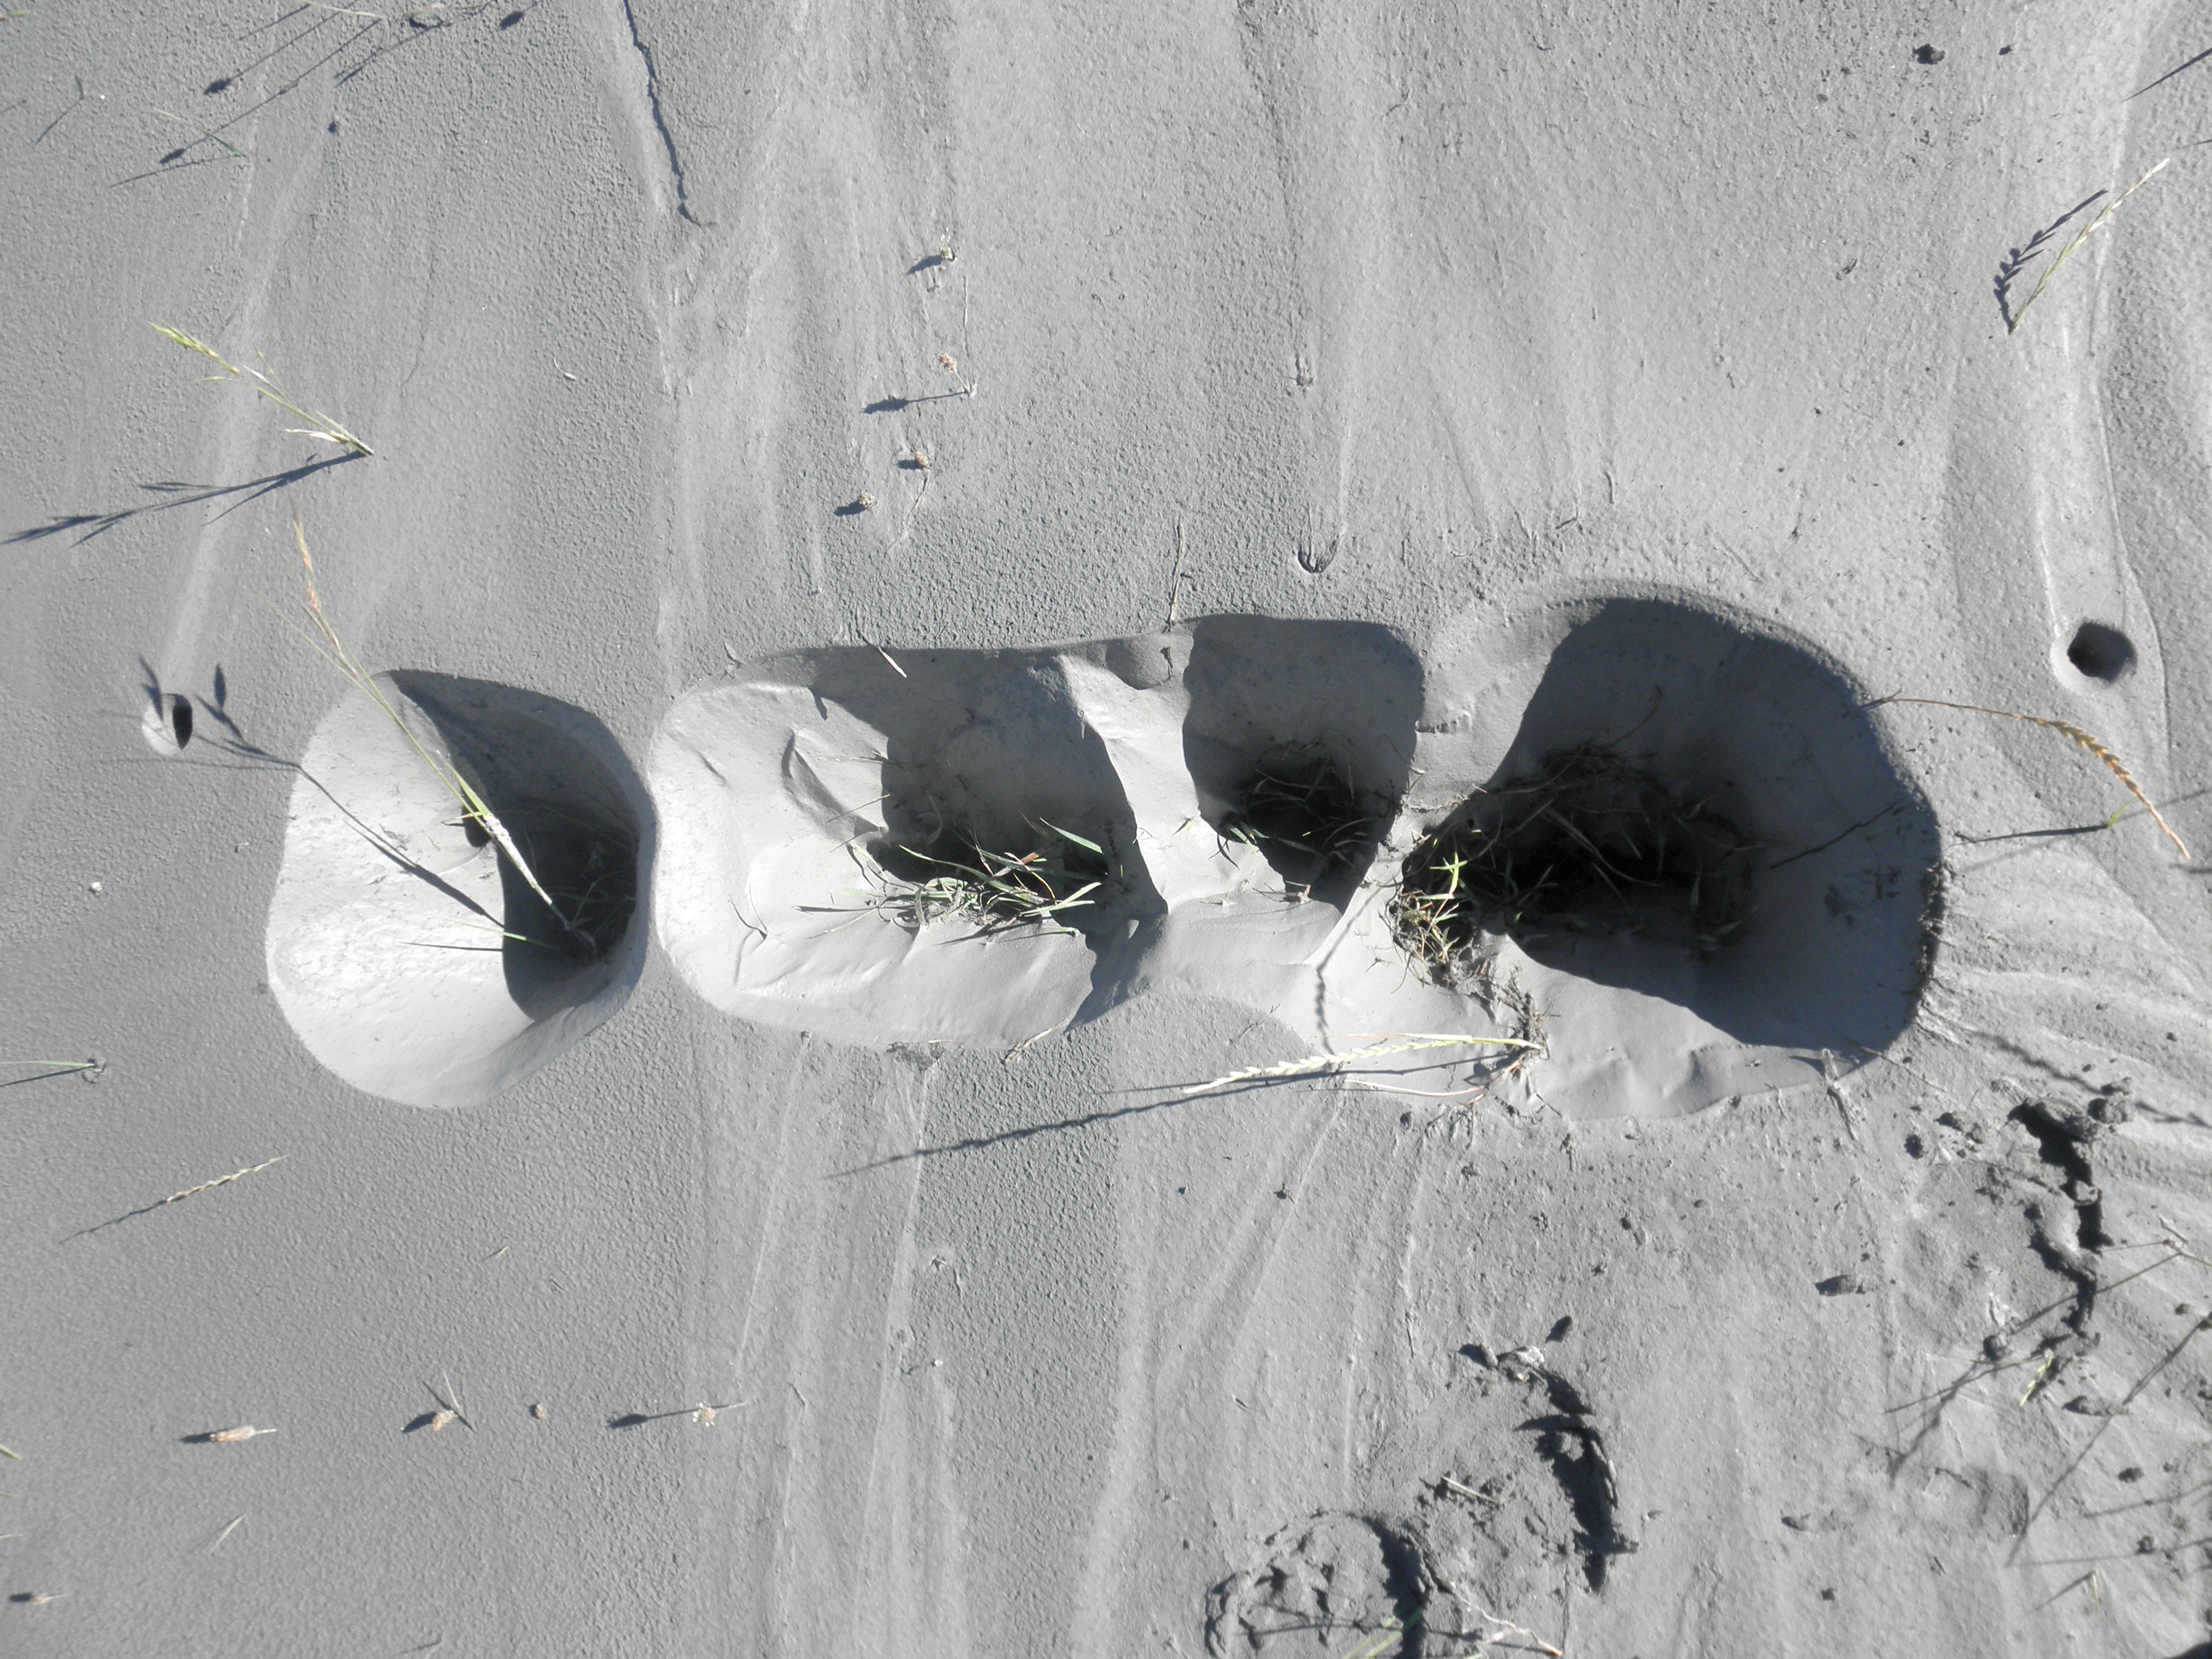
Figure S11. A closeup of a portion of sand fissure shown in Figure S10. Note that channels are cut into the sand–silt fissure and that water and suspended fines are ponded in the bottom of the vents. Photograph by C. Hardwick and R. Hardwick.
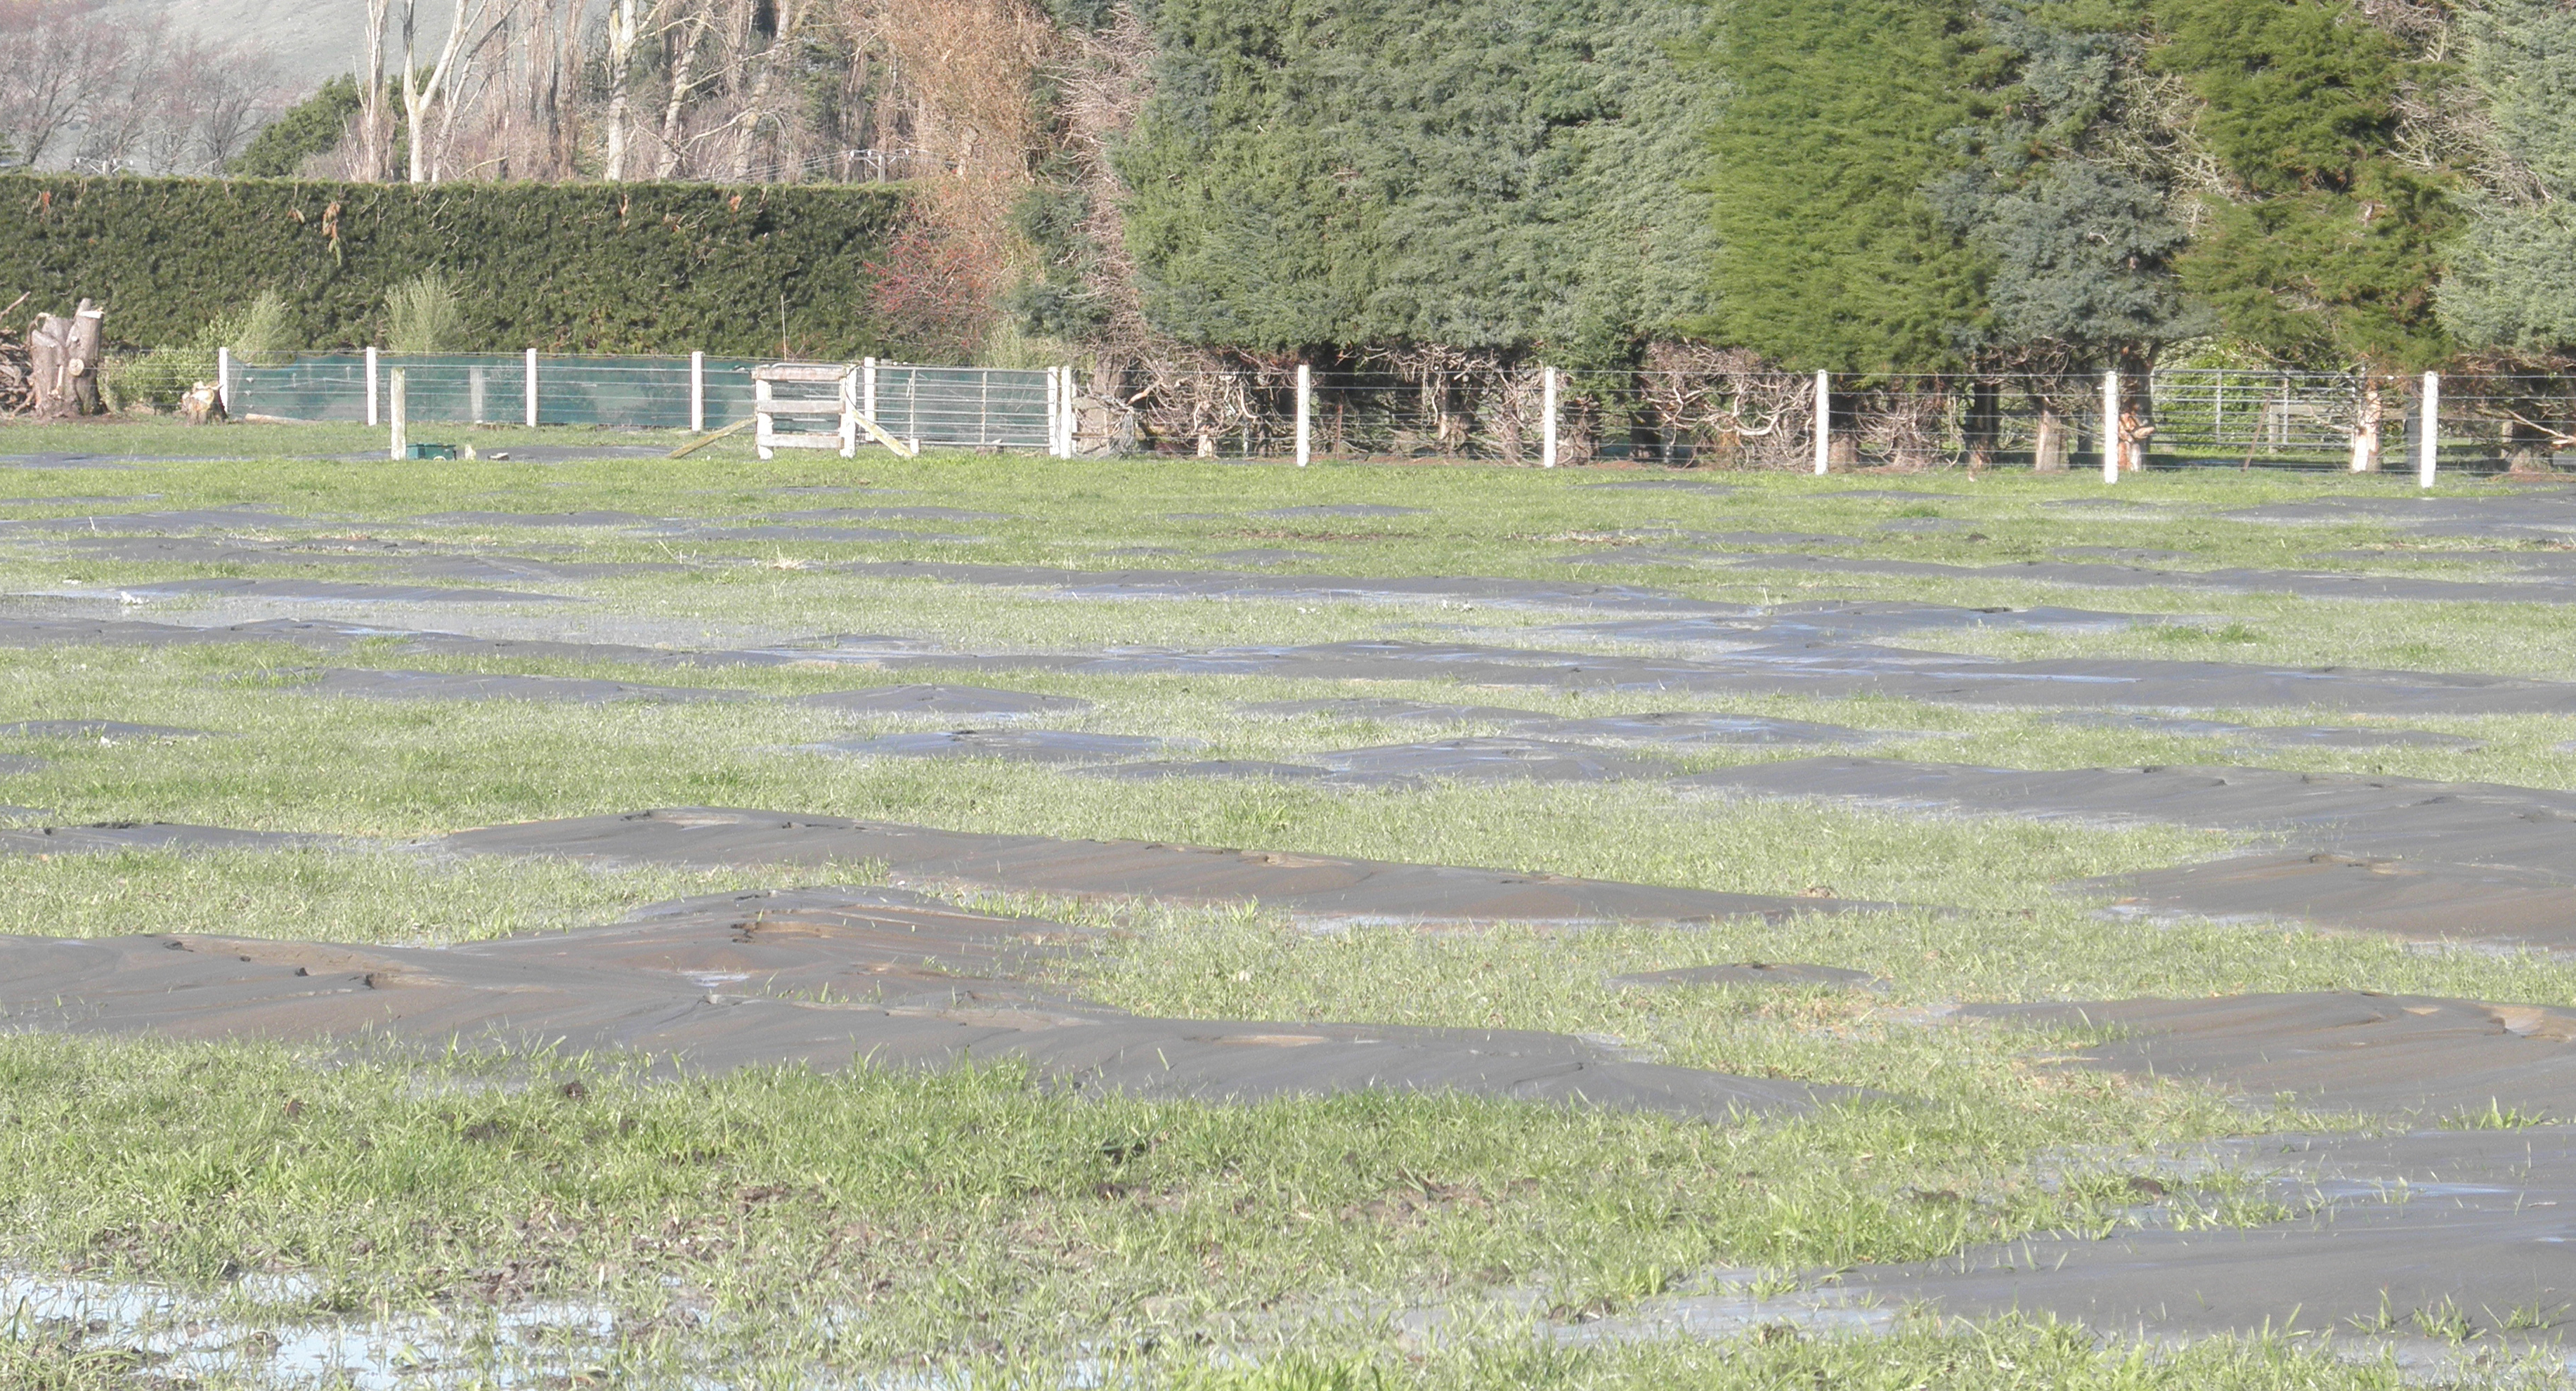
Figure S12. Multiple subparallel sand fissures that formed at the Hardwick site location L4 during the 4 September 2010 M 7.1 Darfield earthquake. Photo was taken in a direction perpendicular to the fissures’ trend. Note water ponded in low-lying portions of the sand fissures and between fissures. View is toward the south. Fence posts provide a sense of scale. Photograph by C. Hardwick and R. Hardwick.
Figure S13. Sand fissures with multiple vents that formed at the Hardwick site location L4 during the 22 February 2011 M 6.2 Christchurch earthquakes. Sand fissures were similar or slightly smaller in size to those that formed in September 2010. Gates and posts provide a sense of scale. Photograph by C. Hardwick and R. Hardwick.
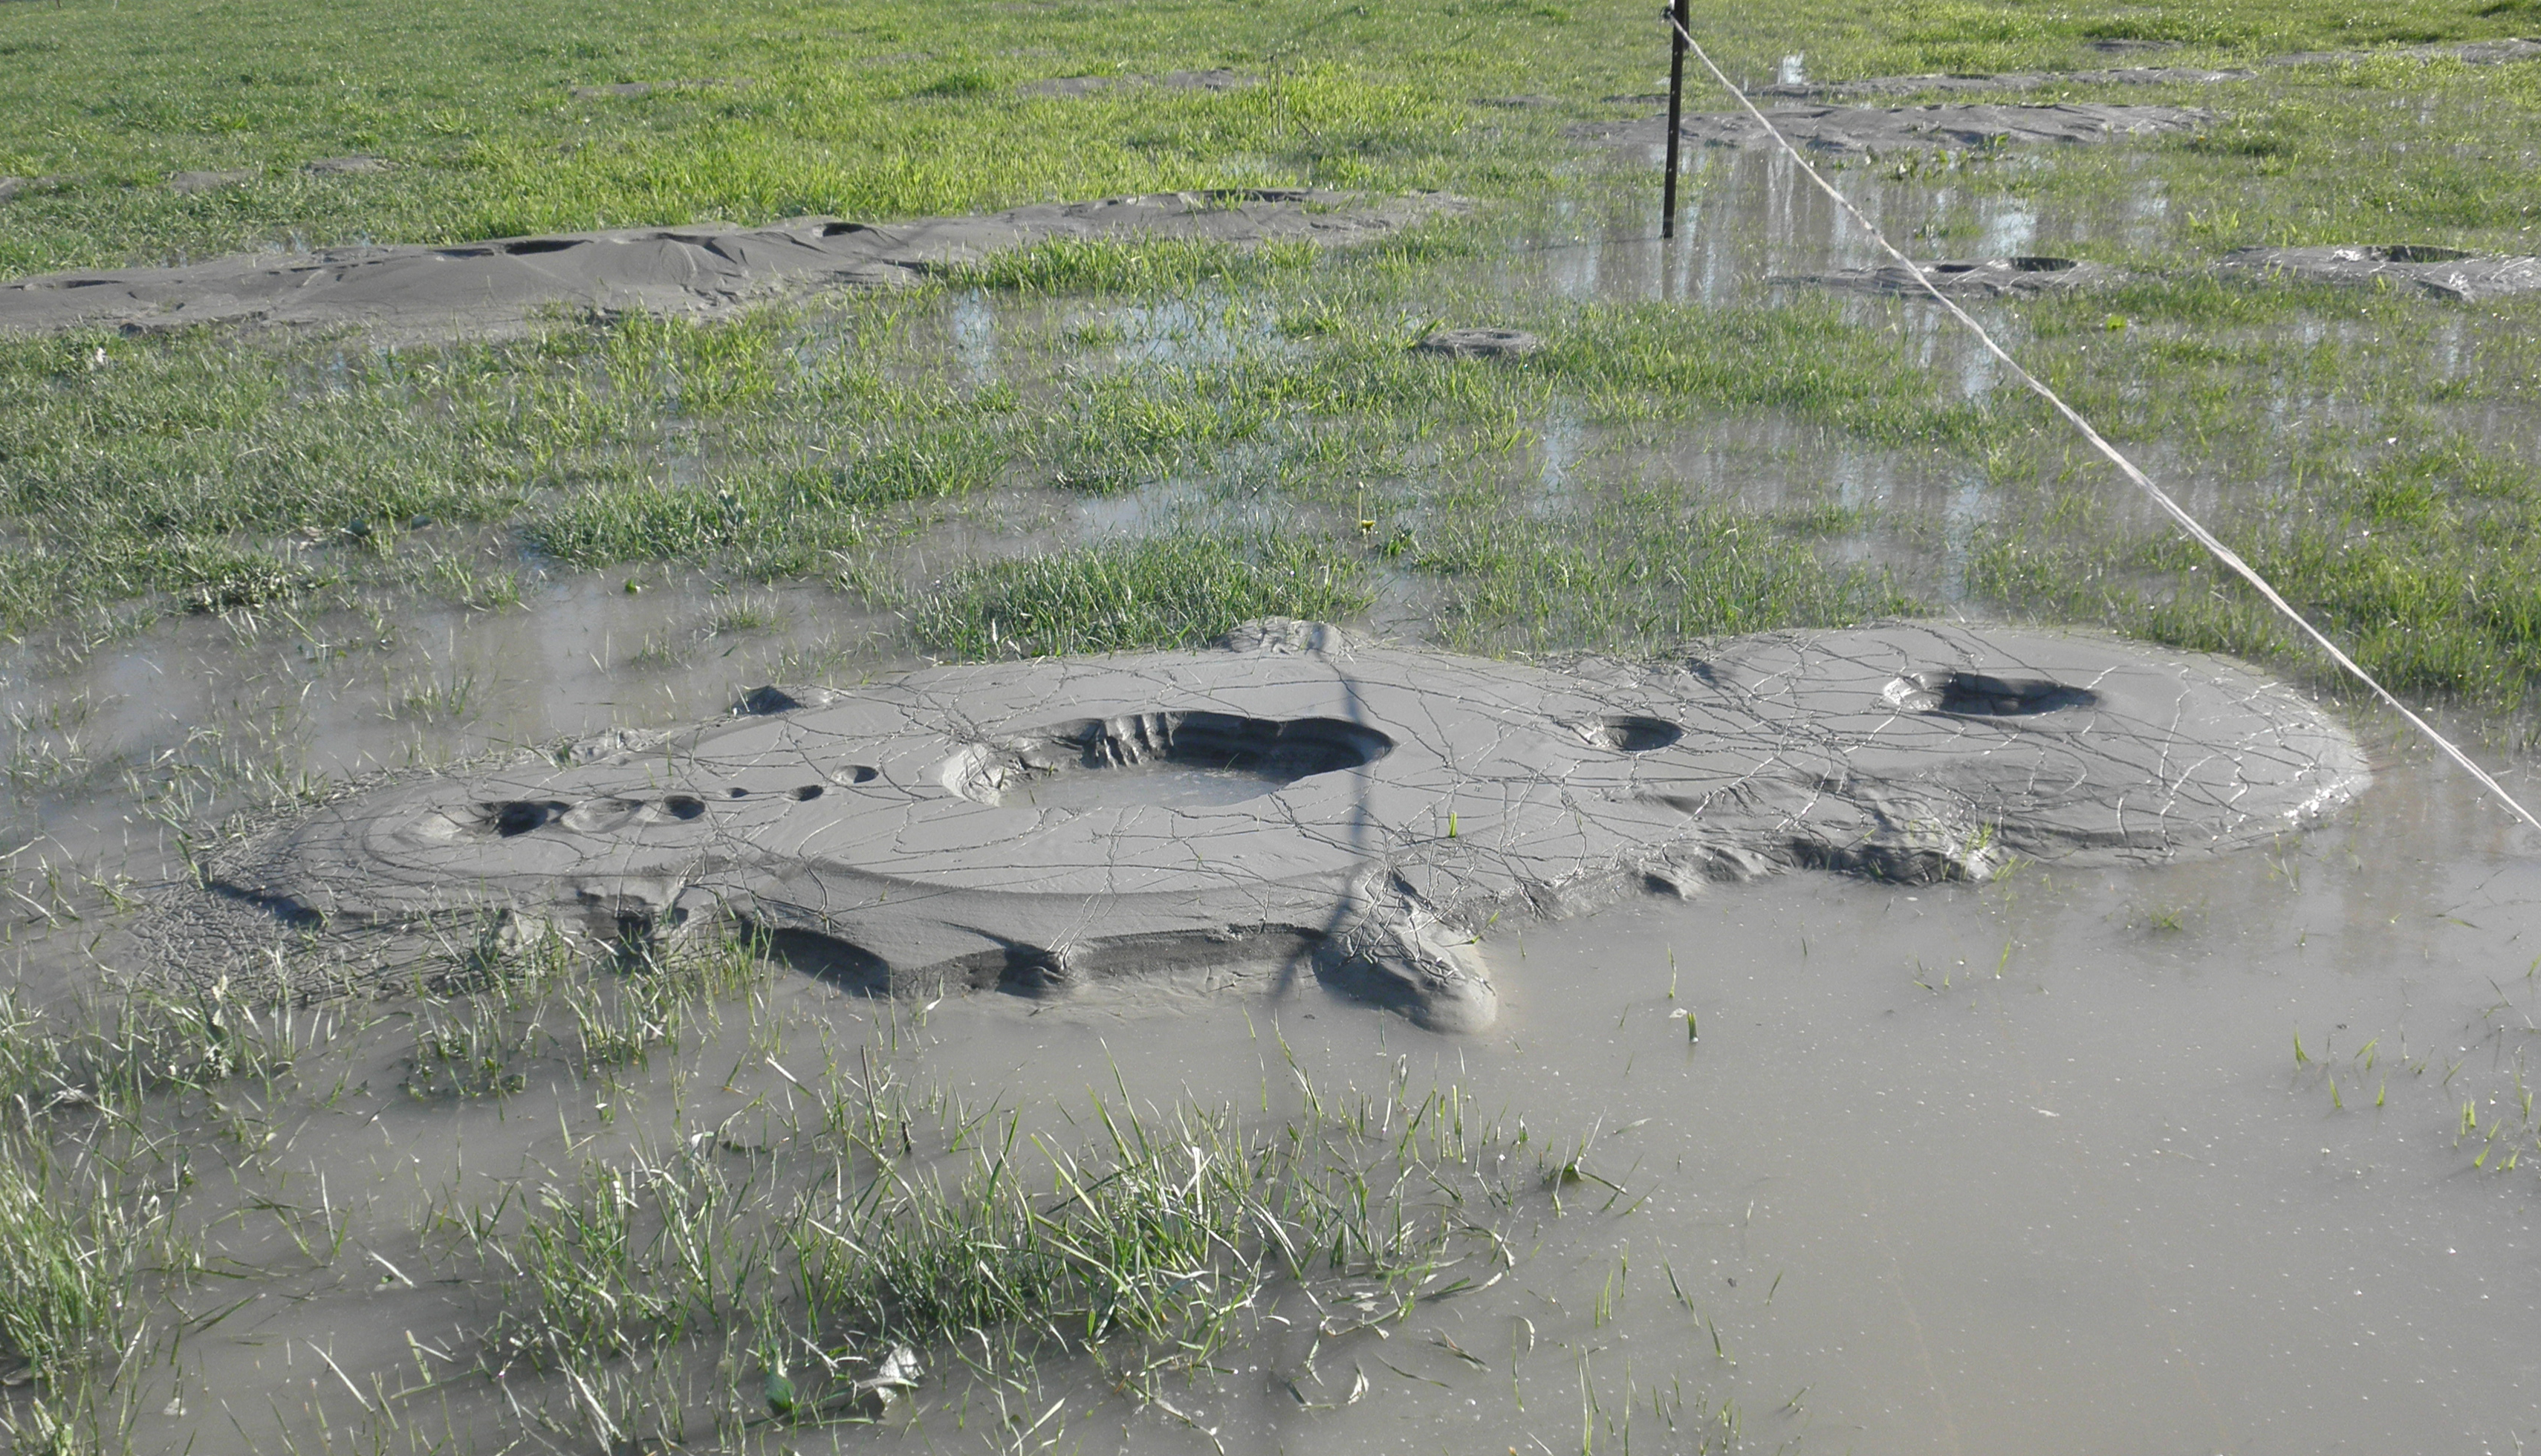
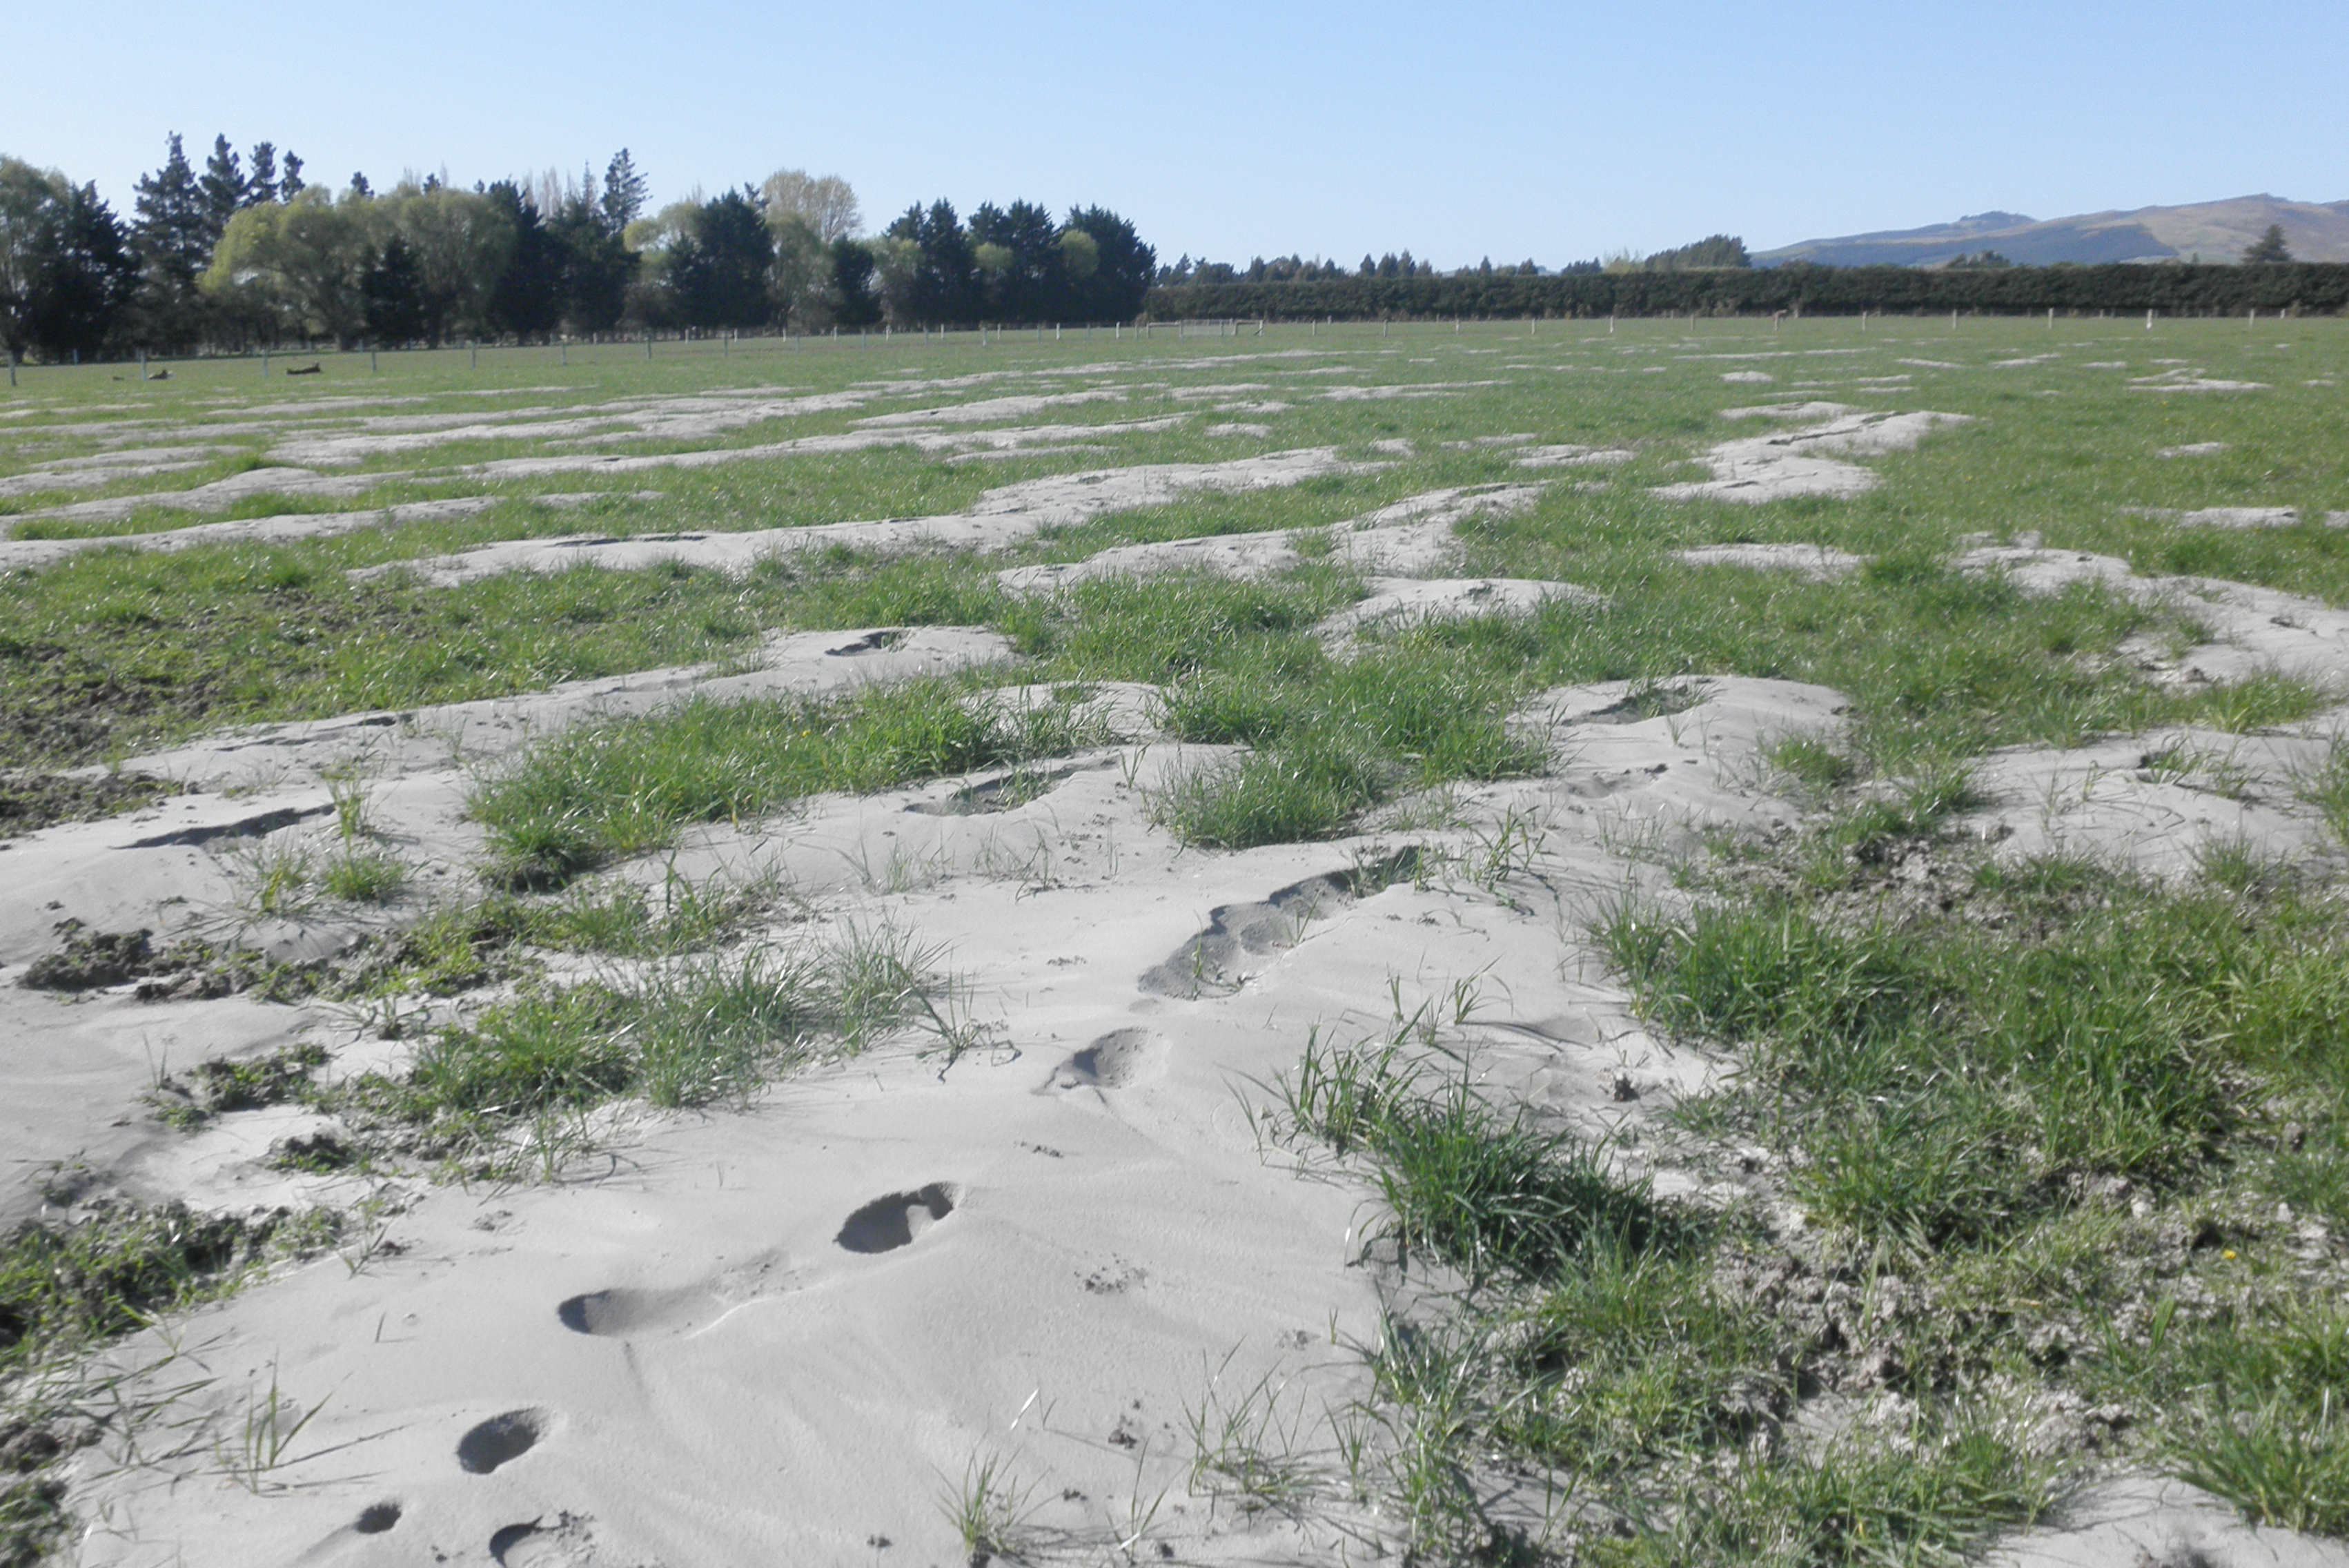
Figure S14. Sand–silt blows and fissures that formed at the Hardwick site location L5 during the 4 September 2010 M 7.1 Darfield earthquake. Note that the liquefaction features are composed of gray sand and silt and tan sand. Fence posts and grass blades provide a sense of scale. Photograph by C. Hardwick and R. Hardwick.
Figure S15. Sand–silt fissure that formed at the Hardwick site location L5 during the 22 February 2011 M 6.2 Christchurch earthquakes. Note that the deposit is composed of gray sand and silt and that fines coat the surface of the vents. Blades of grass provide a sense of scale. Photograph by C. Hardwick and R. Hardwick.
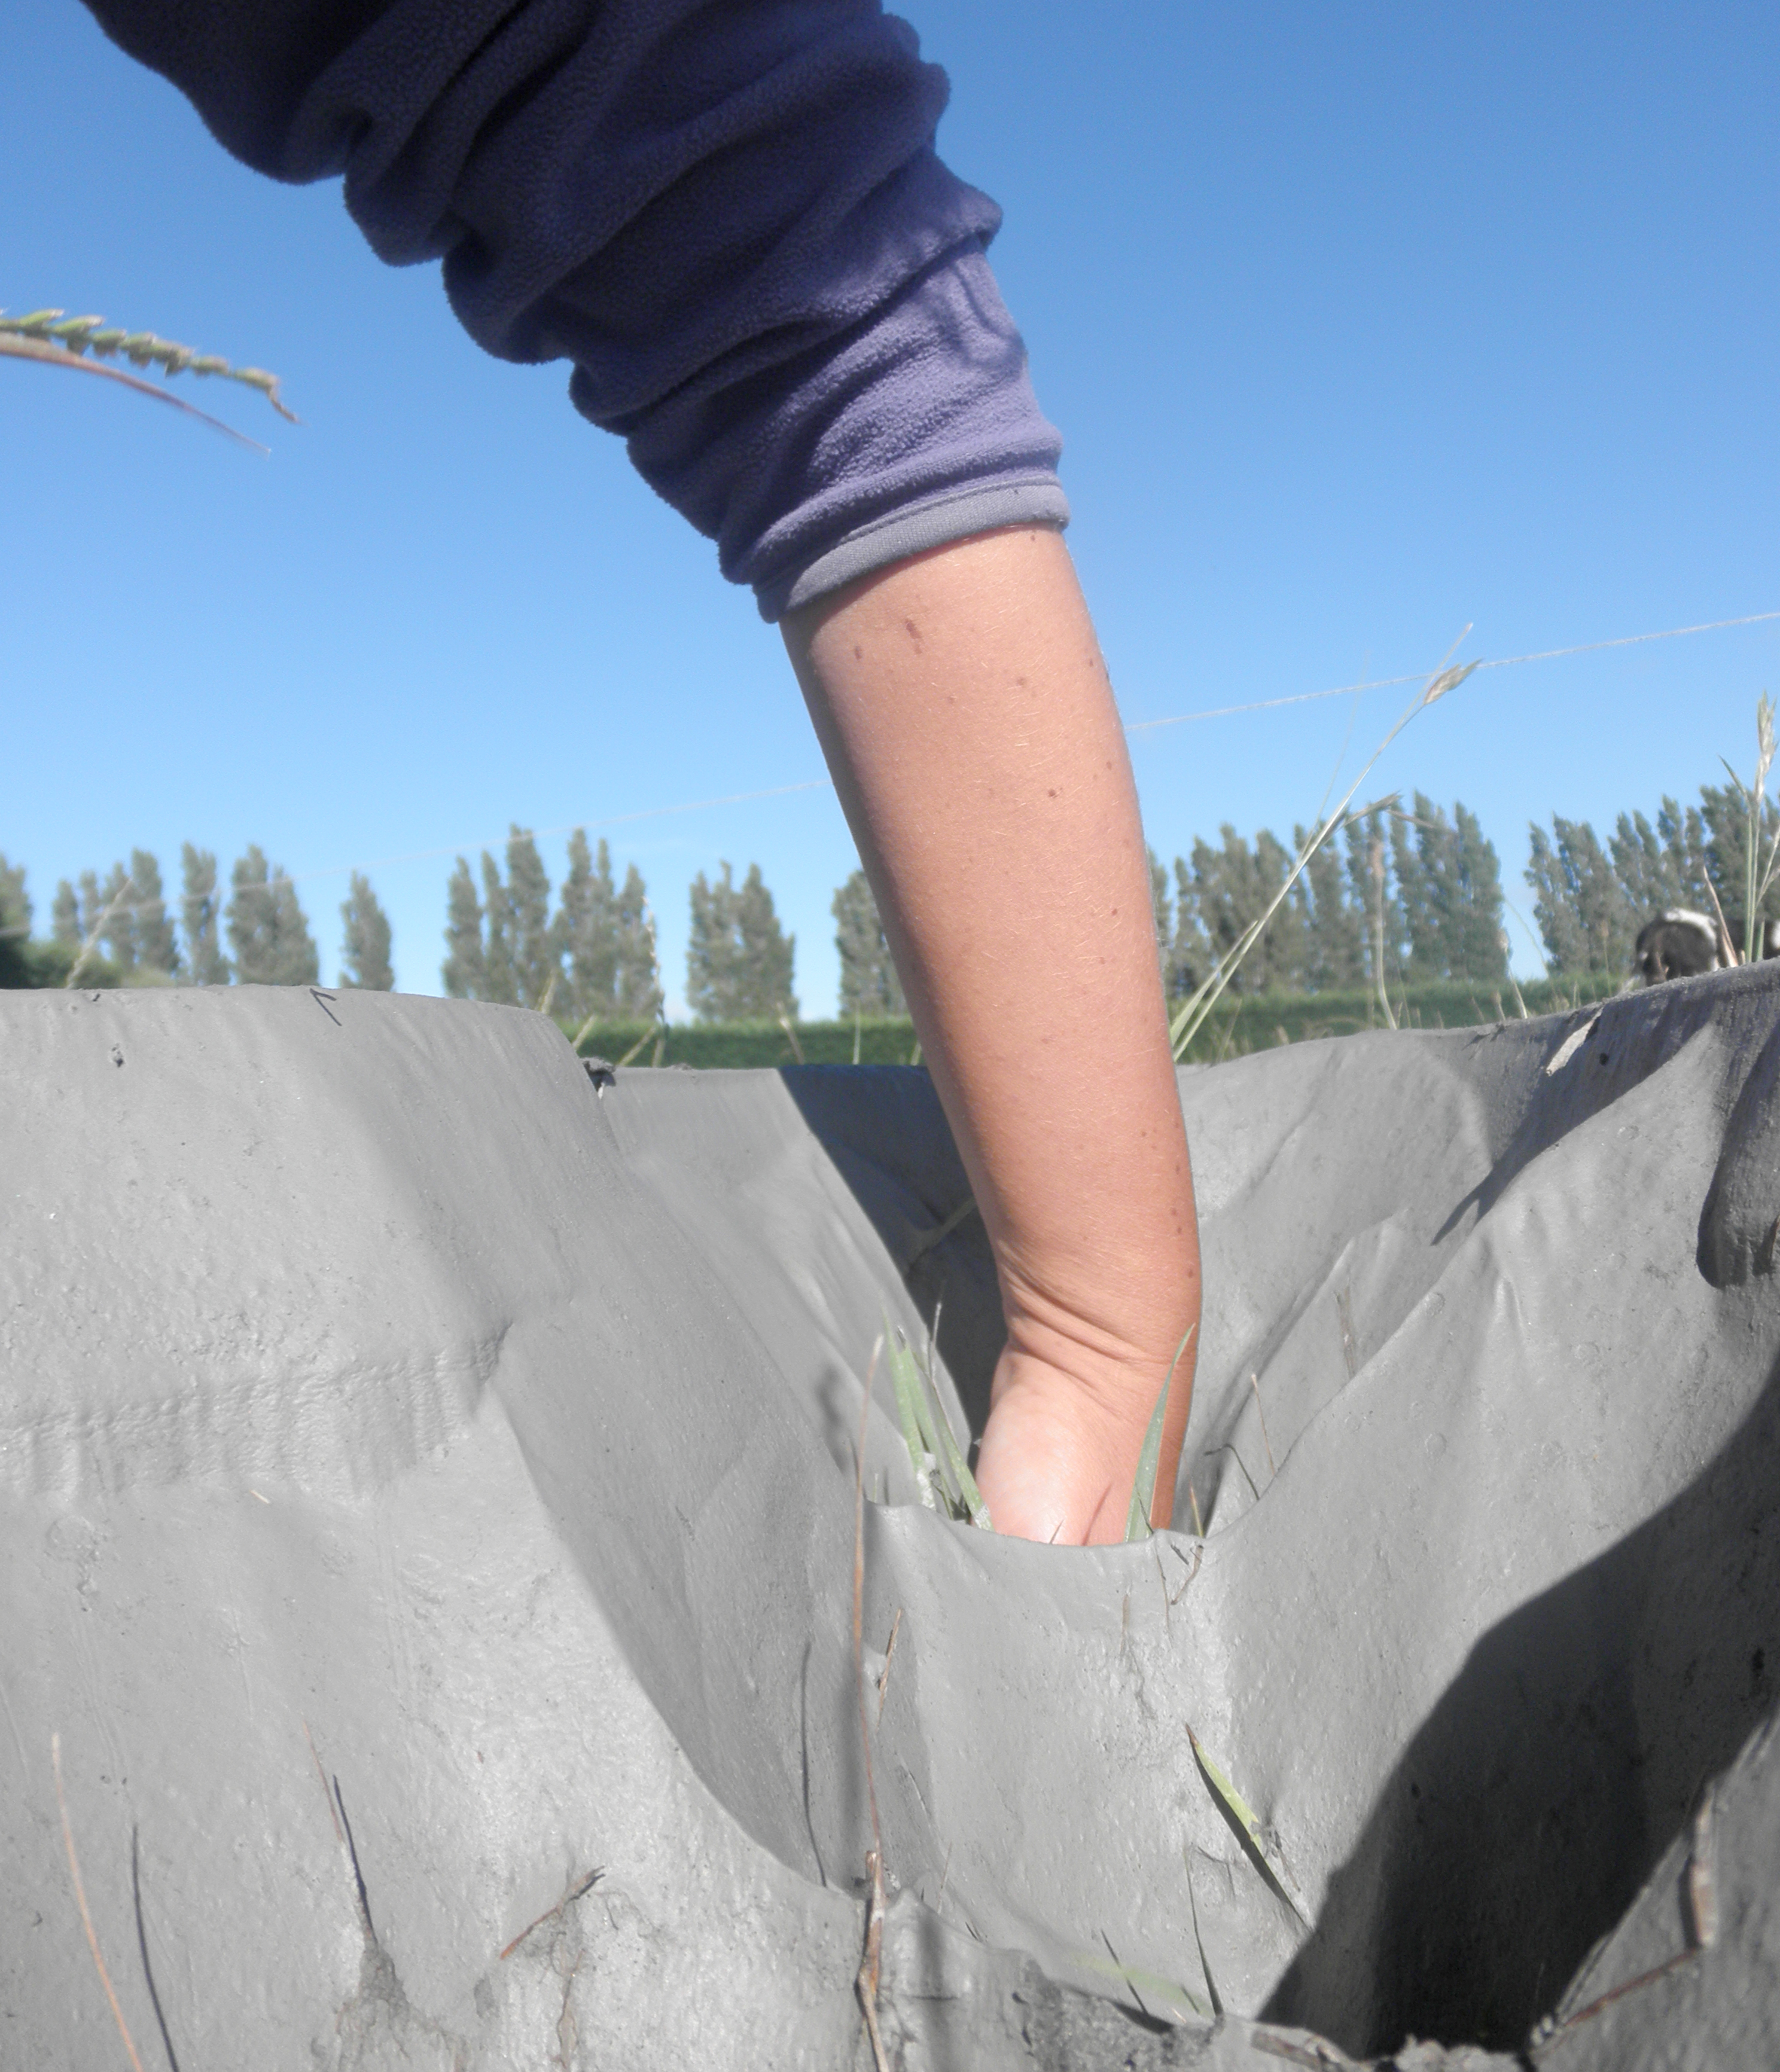
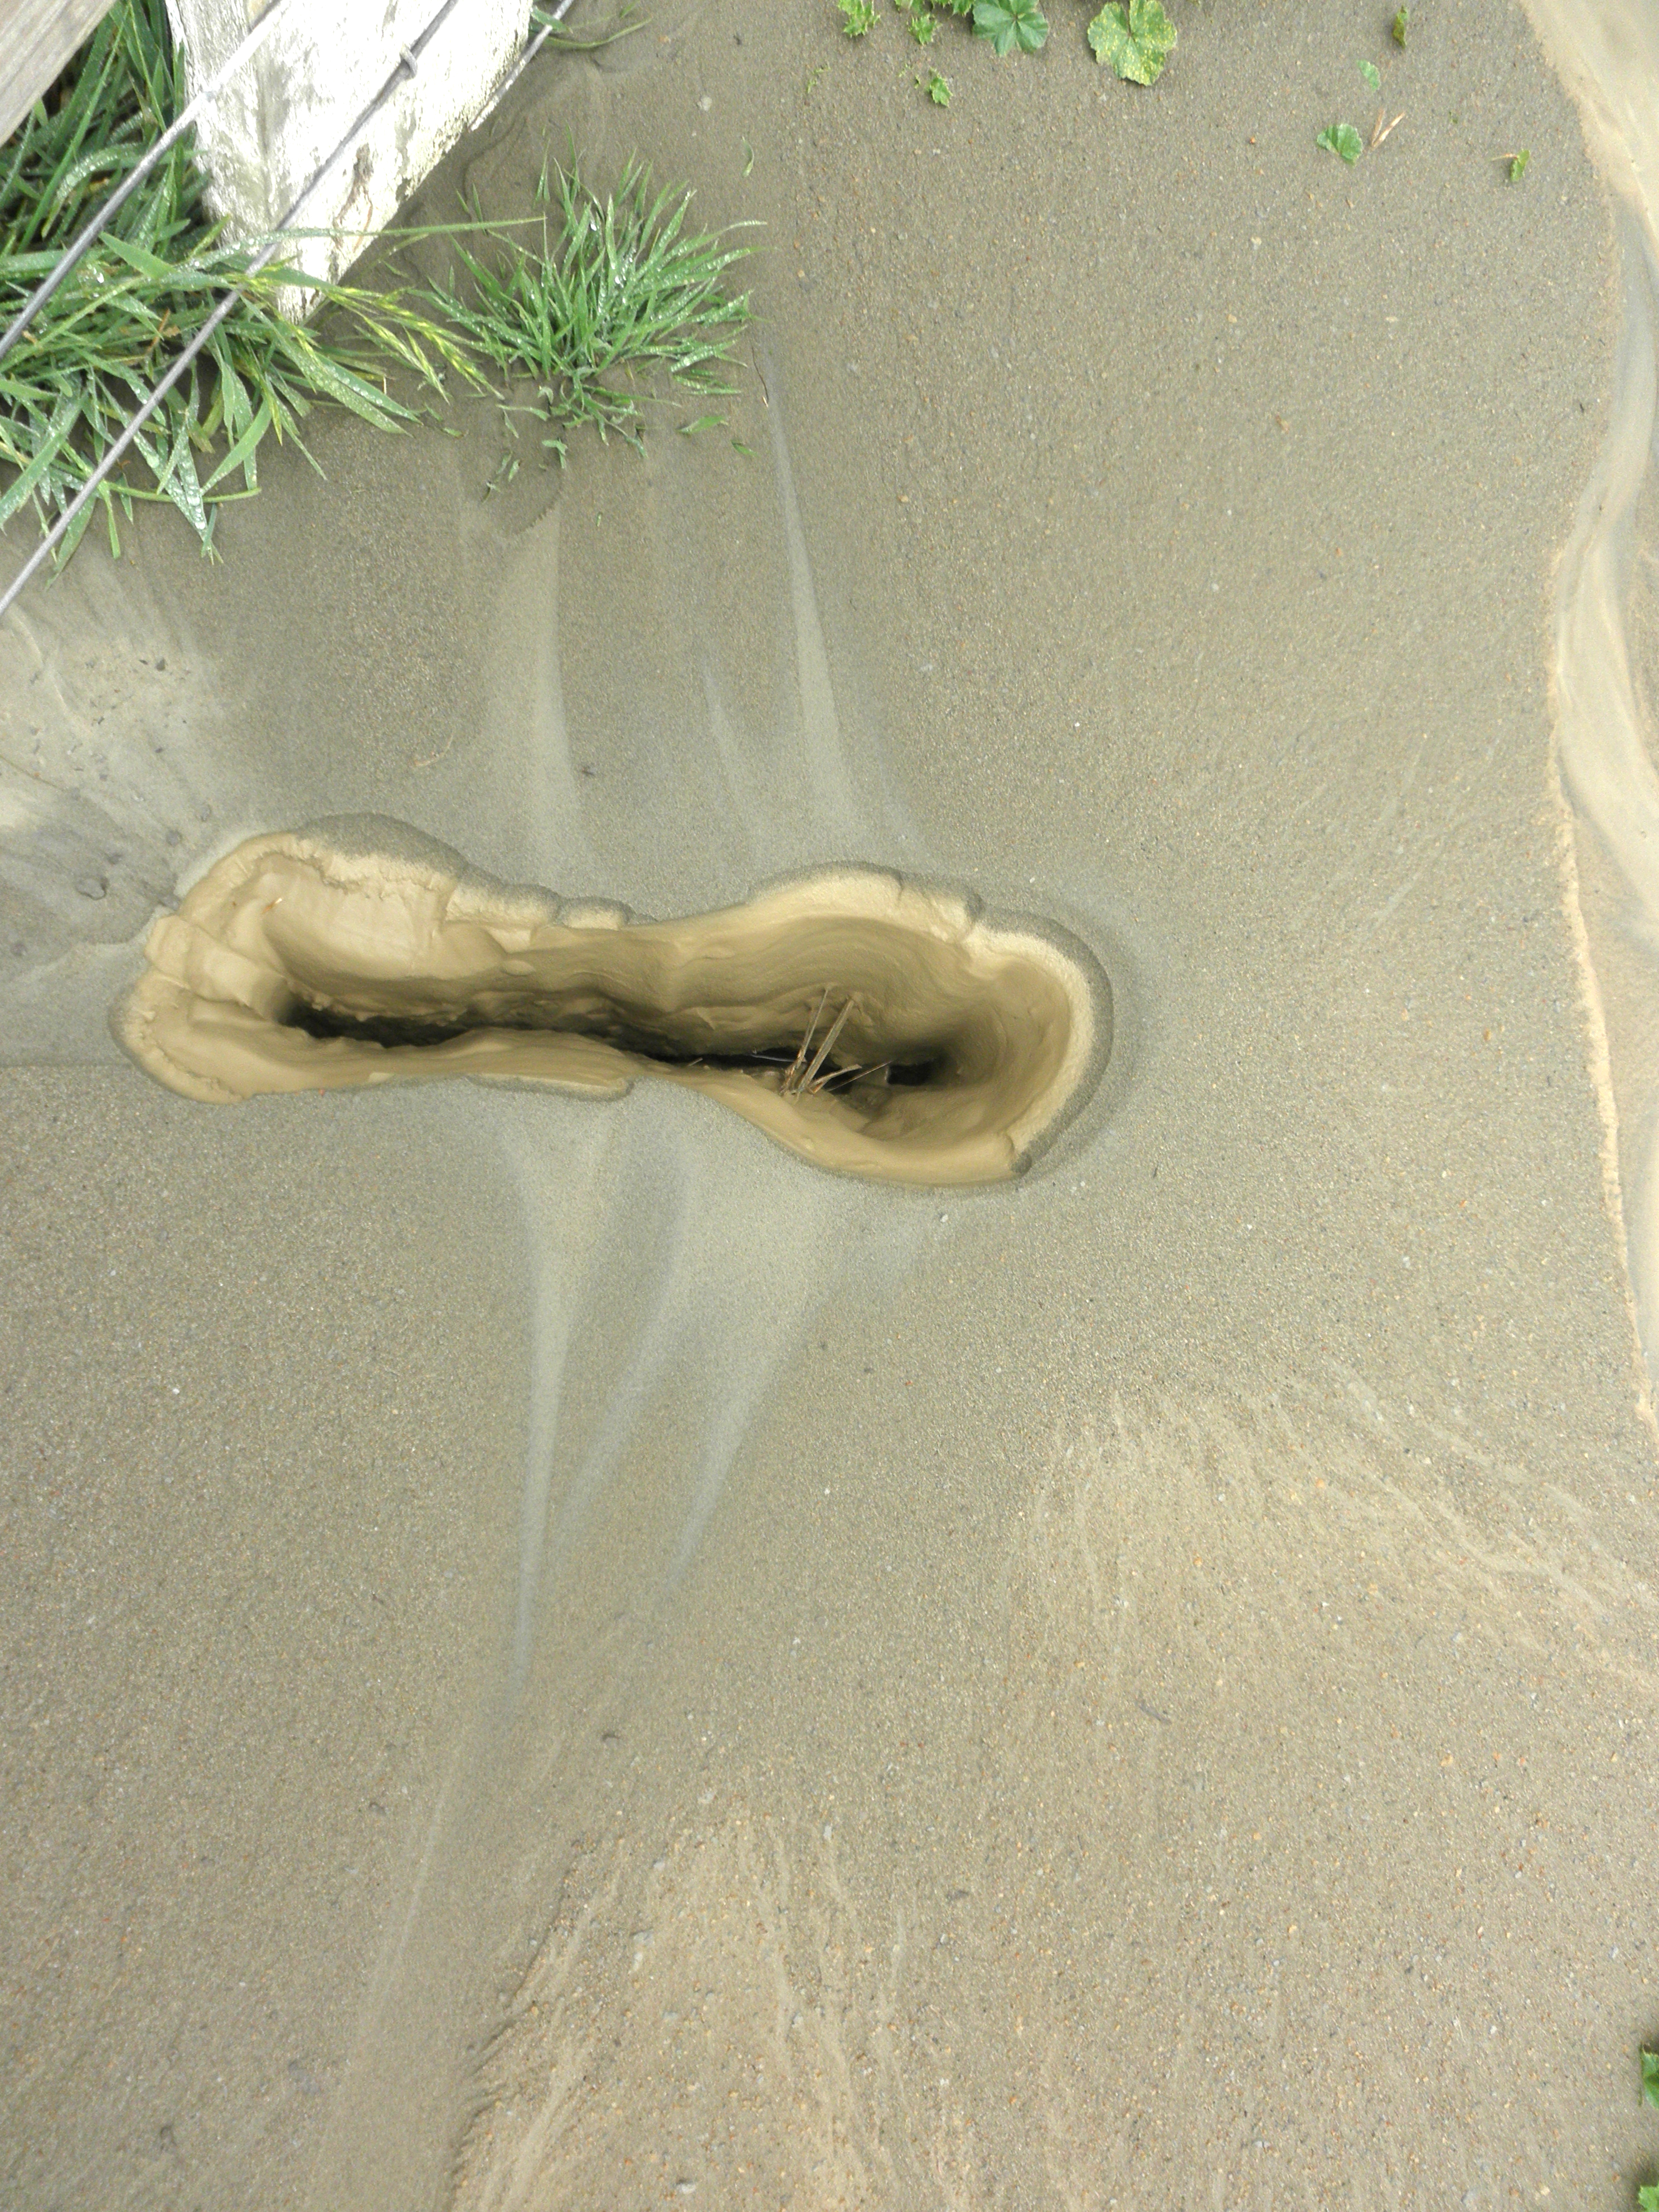
Figure S16. Vent of sand fissure shown in Figure S15. Gray fines coat the surface of the vent structure. An arm and hand provide a sense of scale. Photograph by C. Hardwick and R. Hardwick.
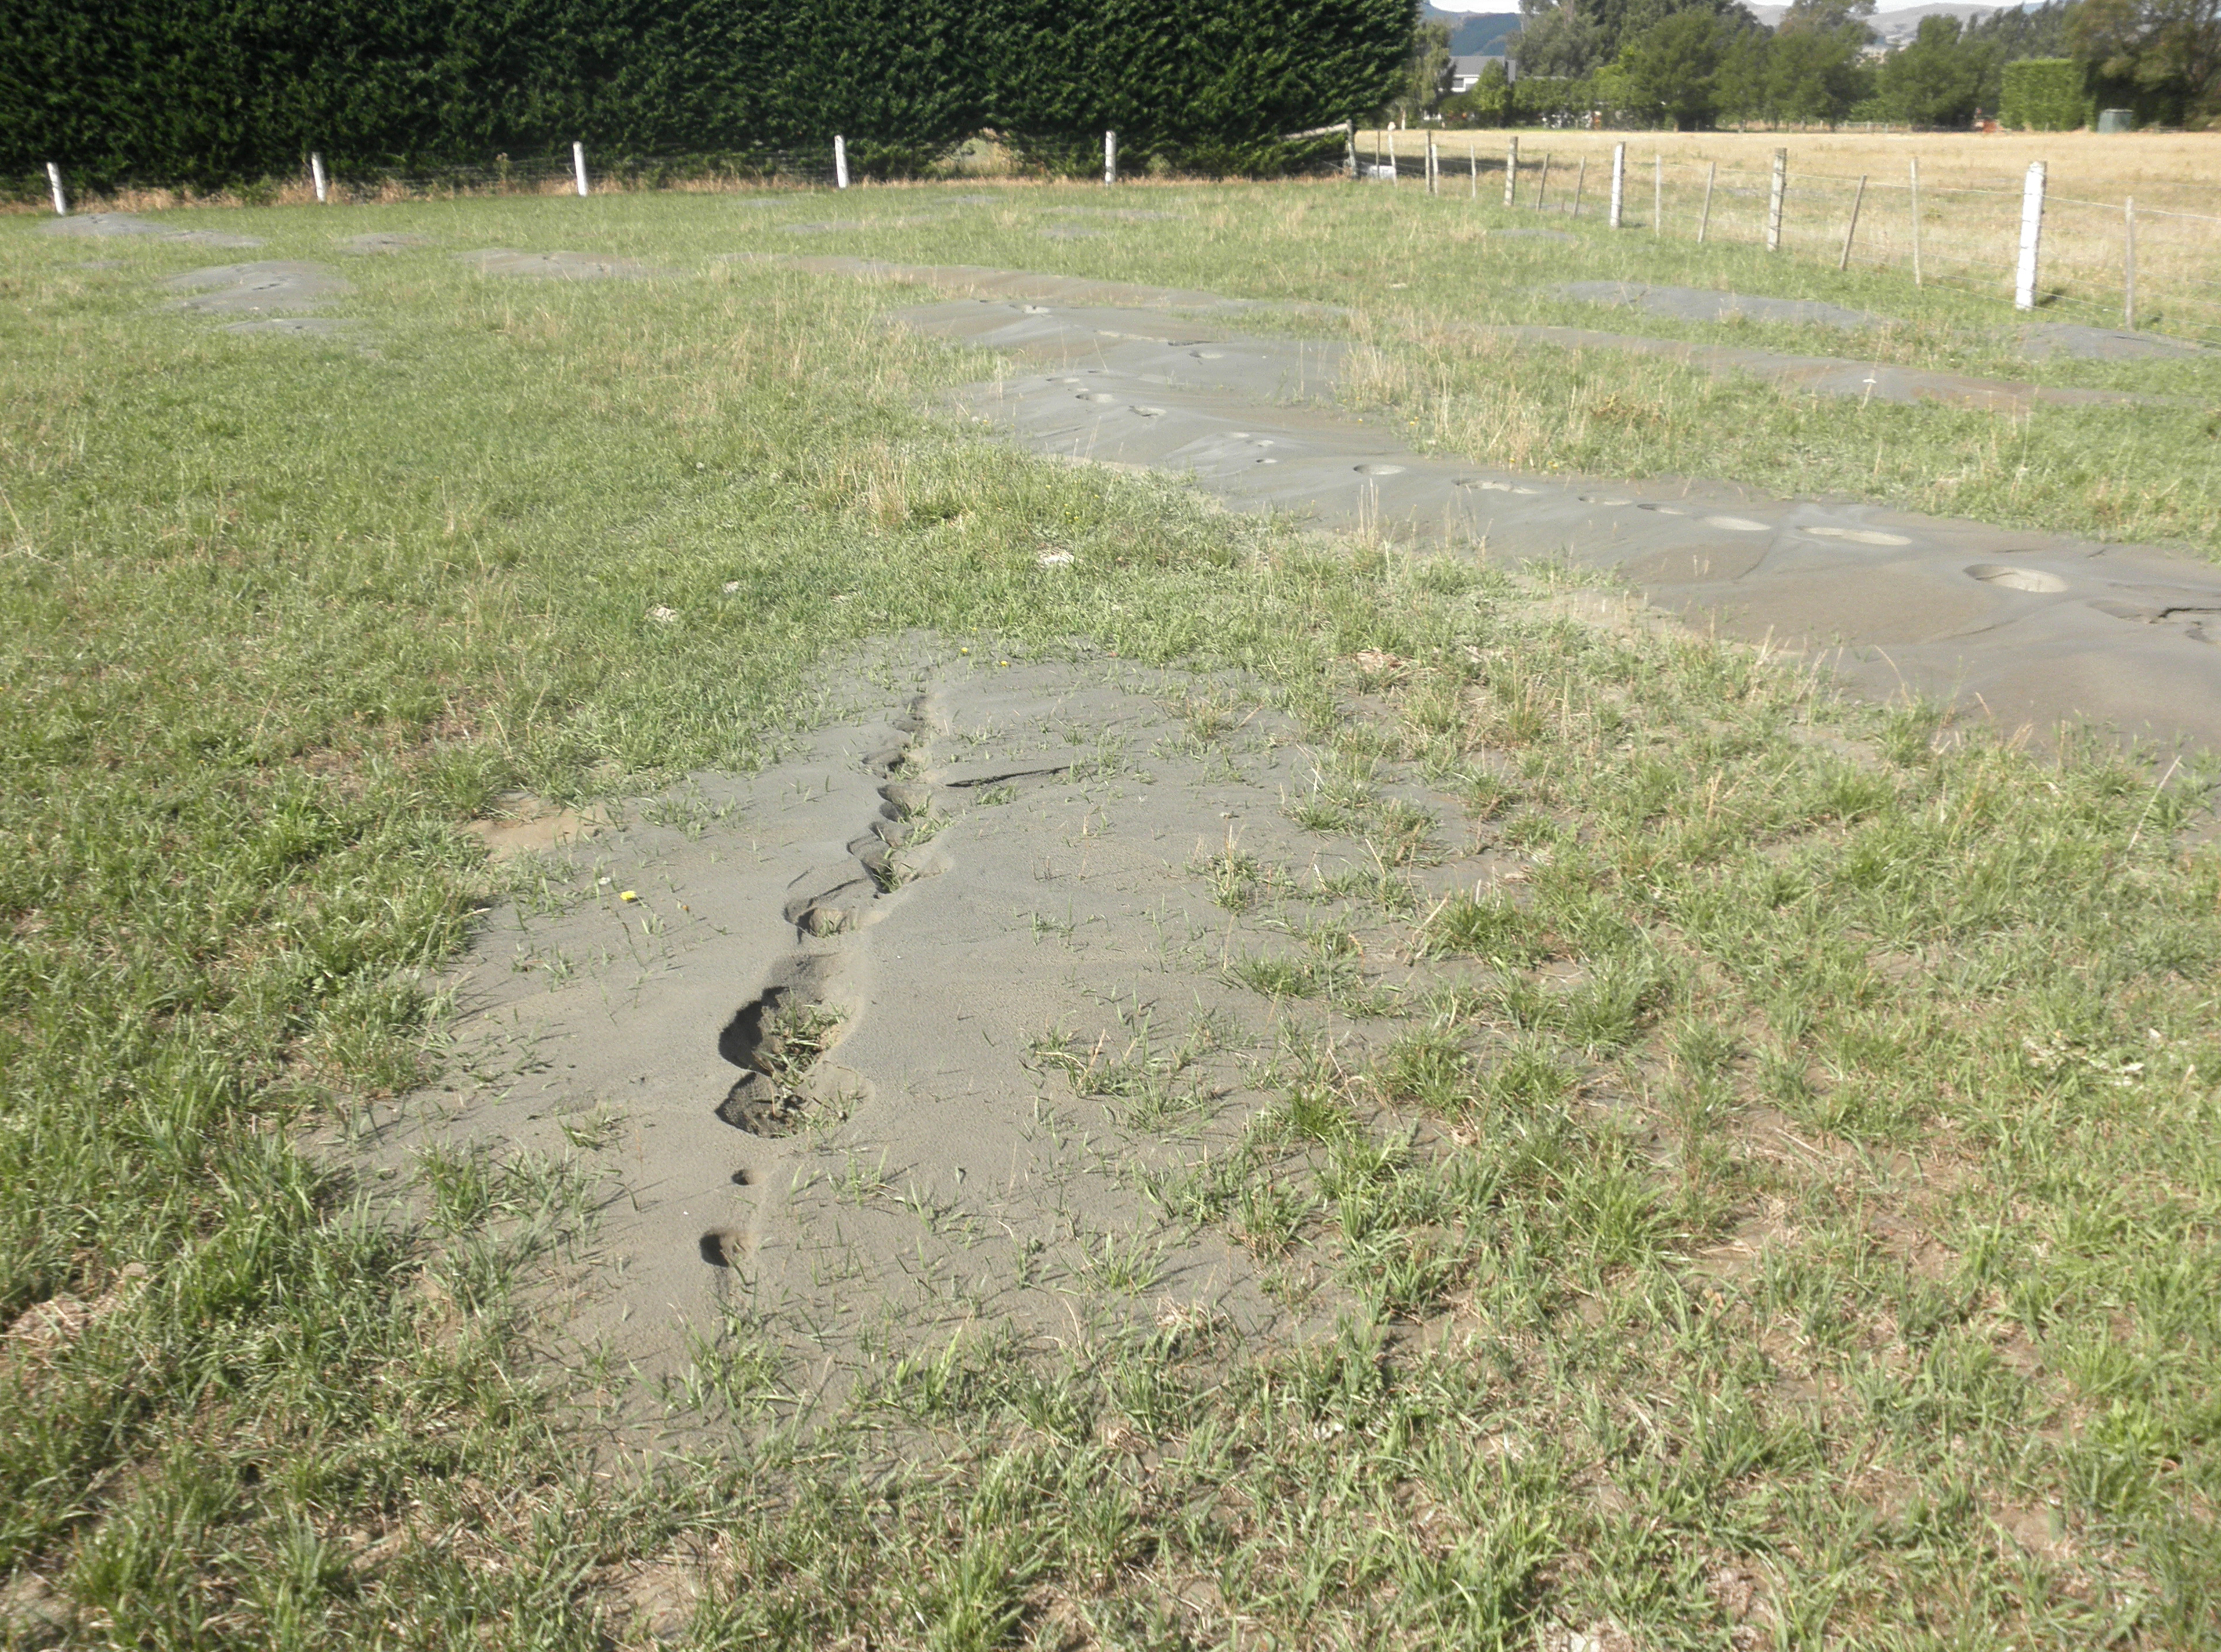
Figure S17. Sand–silt fissures that formed at the Hardwick site location L6 during the 4 September 2010 M 7.1 Darfield earthquake. Photograph was taken three weeks after the earthquake. The vent craters have partially filled with reworked sand and silt of the vented deposit, and raindrop-impact structures can be seen on the surface of the deposit. Photograph by C. Hardwick and R. Hardwick.
Figure S18. Compound sand–silt fissure that formed at the Hardwick site location L6 during the 22 February 2011 M 6.2 and the 13 June 2011 M 6.0 Christchurch earthquakes. The upper deposit, composed here of gray silt, formed during the June 2011 event and partially buries the sand deposit that formed during the February 2011 event. Note the smooth (noneroded) surface of the younger deposit. The older deposit can be seen beyond the edge of and in channels cut through the younger deposit. Small plants and grass are growing on the surface of the older sand fissure, which is more eroded than the younger silt fissure. A sand fissure formed at this location during the 4 September 2010 M 7.1 Darfield earthquake but had been worked into the topsoil before the February 2011 event. Grass provides a sense of scale. Photograph by C. Hardwick and R. Hardwick.
Figure S19. Sand–silt blow that formed at the Hardwick site location L8 during the 22 February 2011 M 6.2 Christchurch earthquakes. Grain size of gray and tan vented material ranges from granules and coarse sand to silt. Note that fines coat the surface of the vent. Blades of grass and the base of a fence post provide a sense of scale. Photograph by C. Hardwick and R. Hardwick.
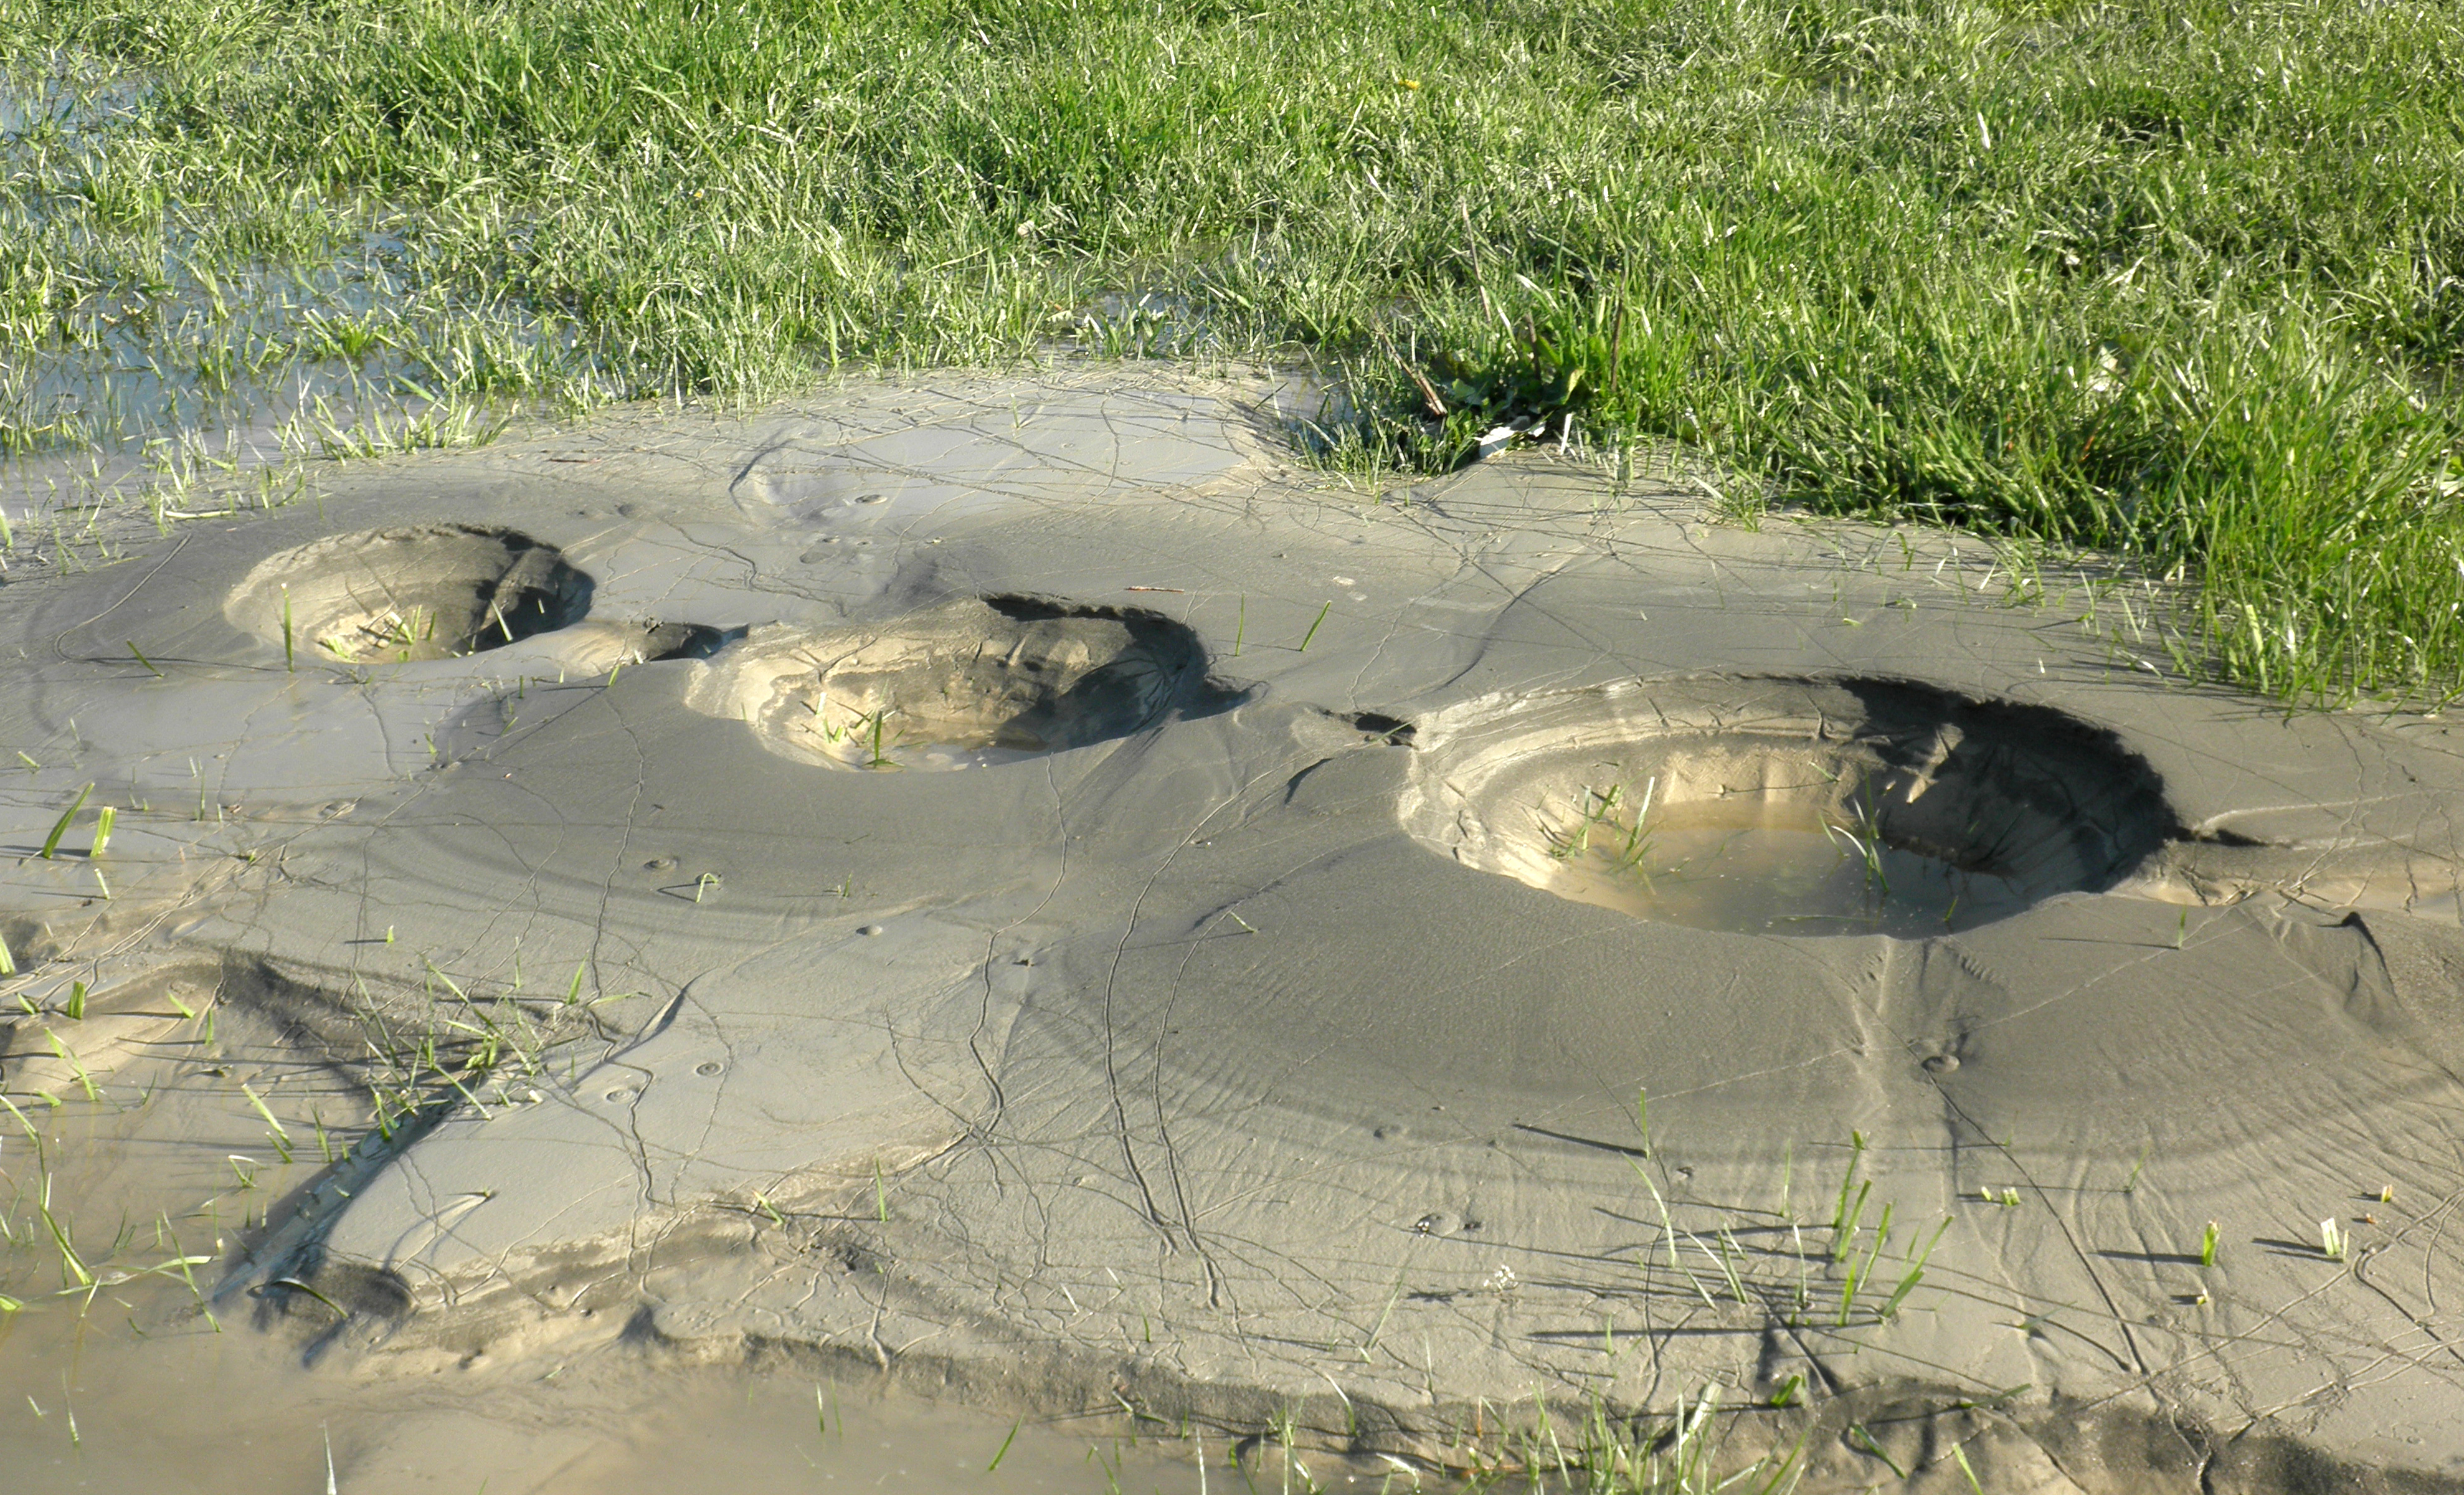
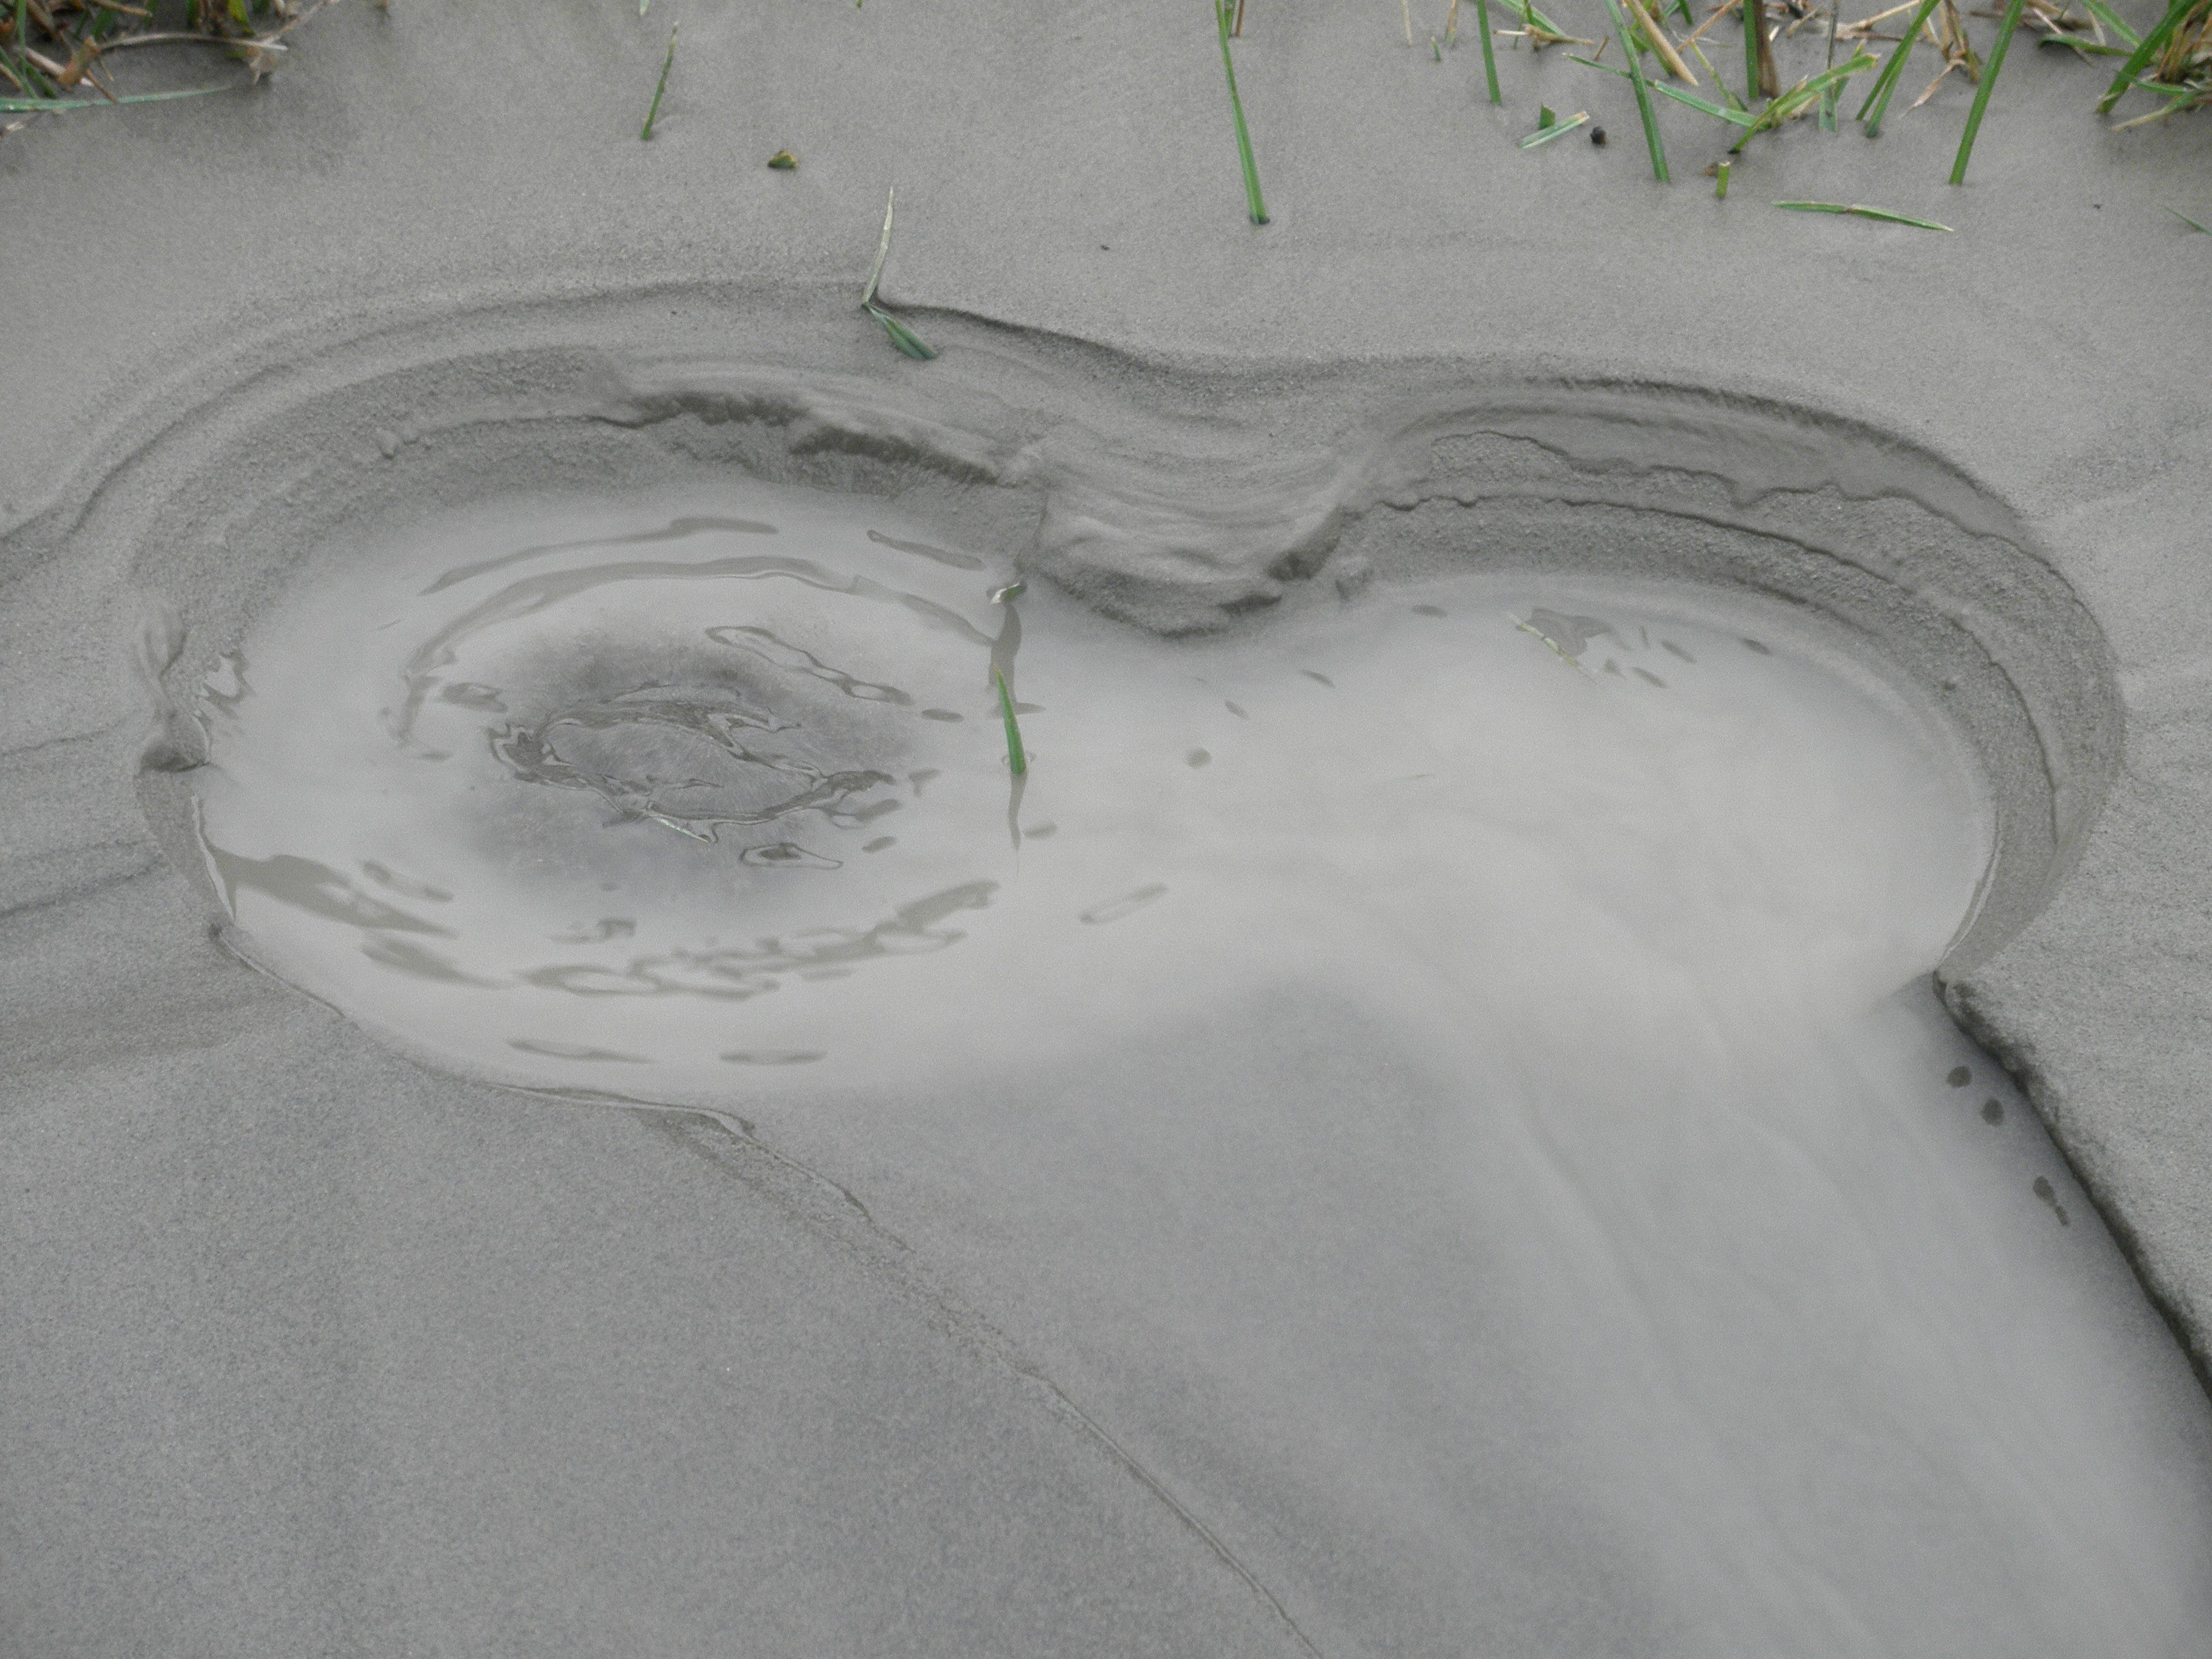
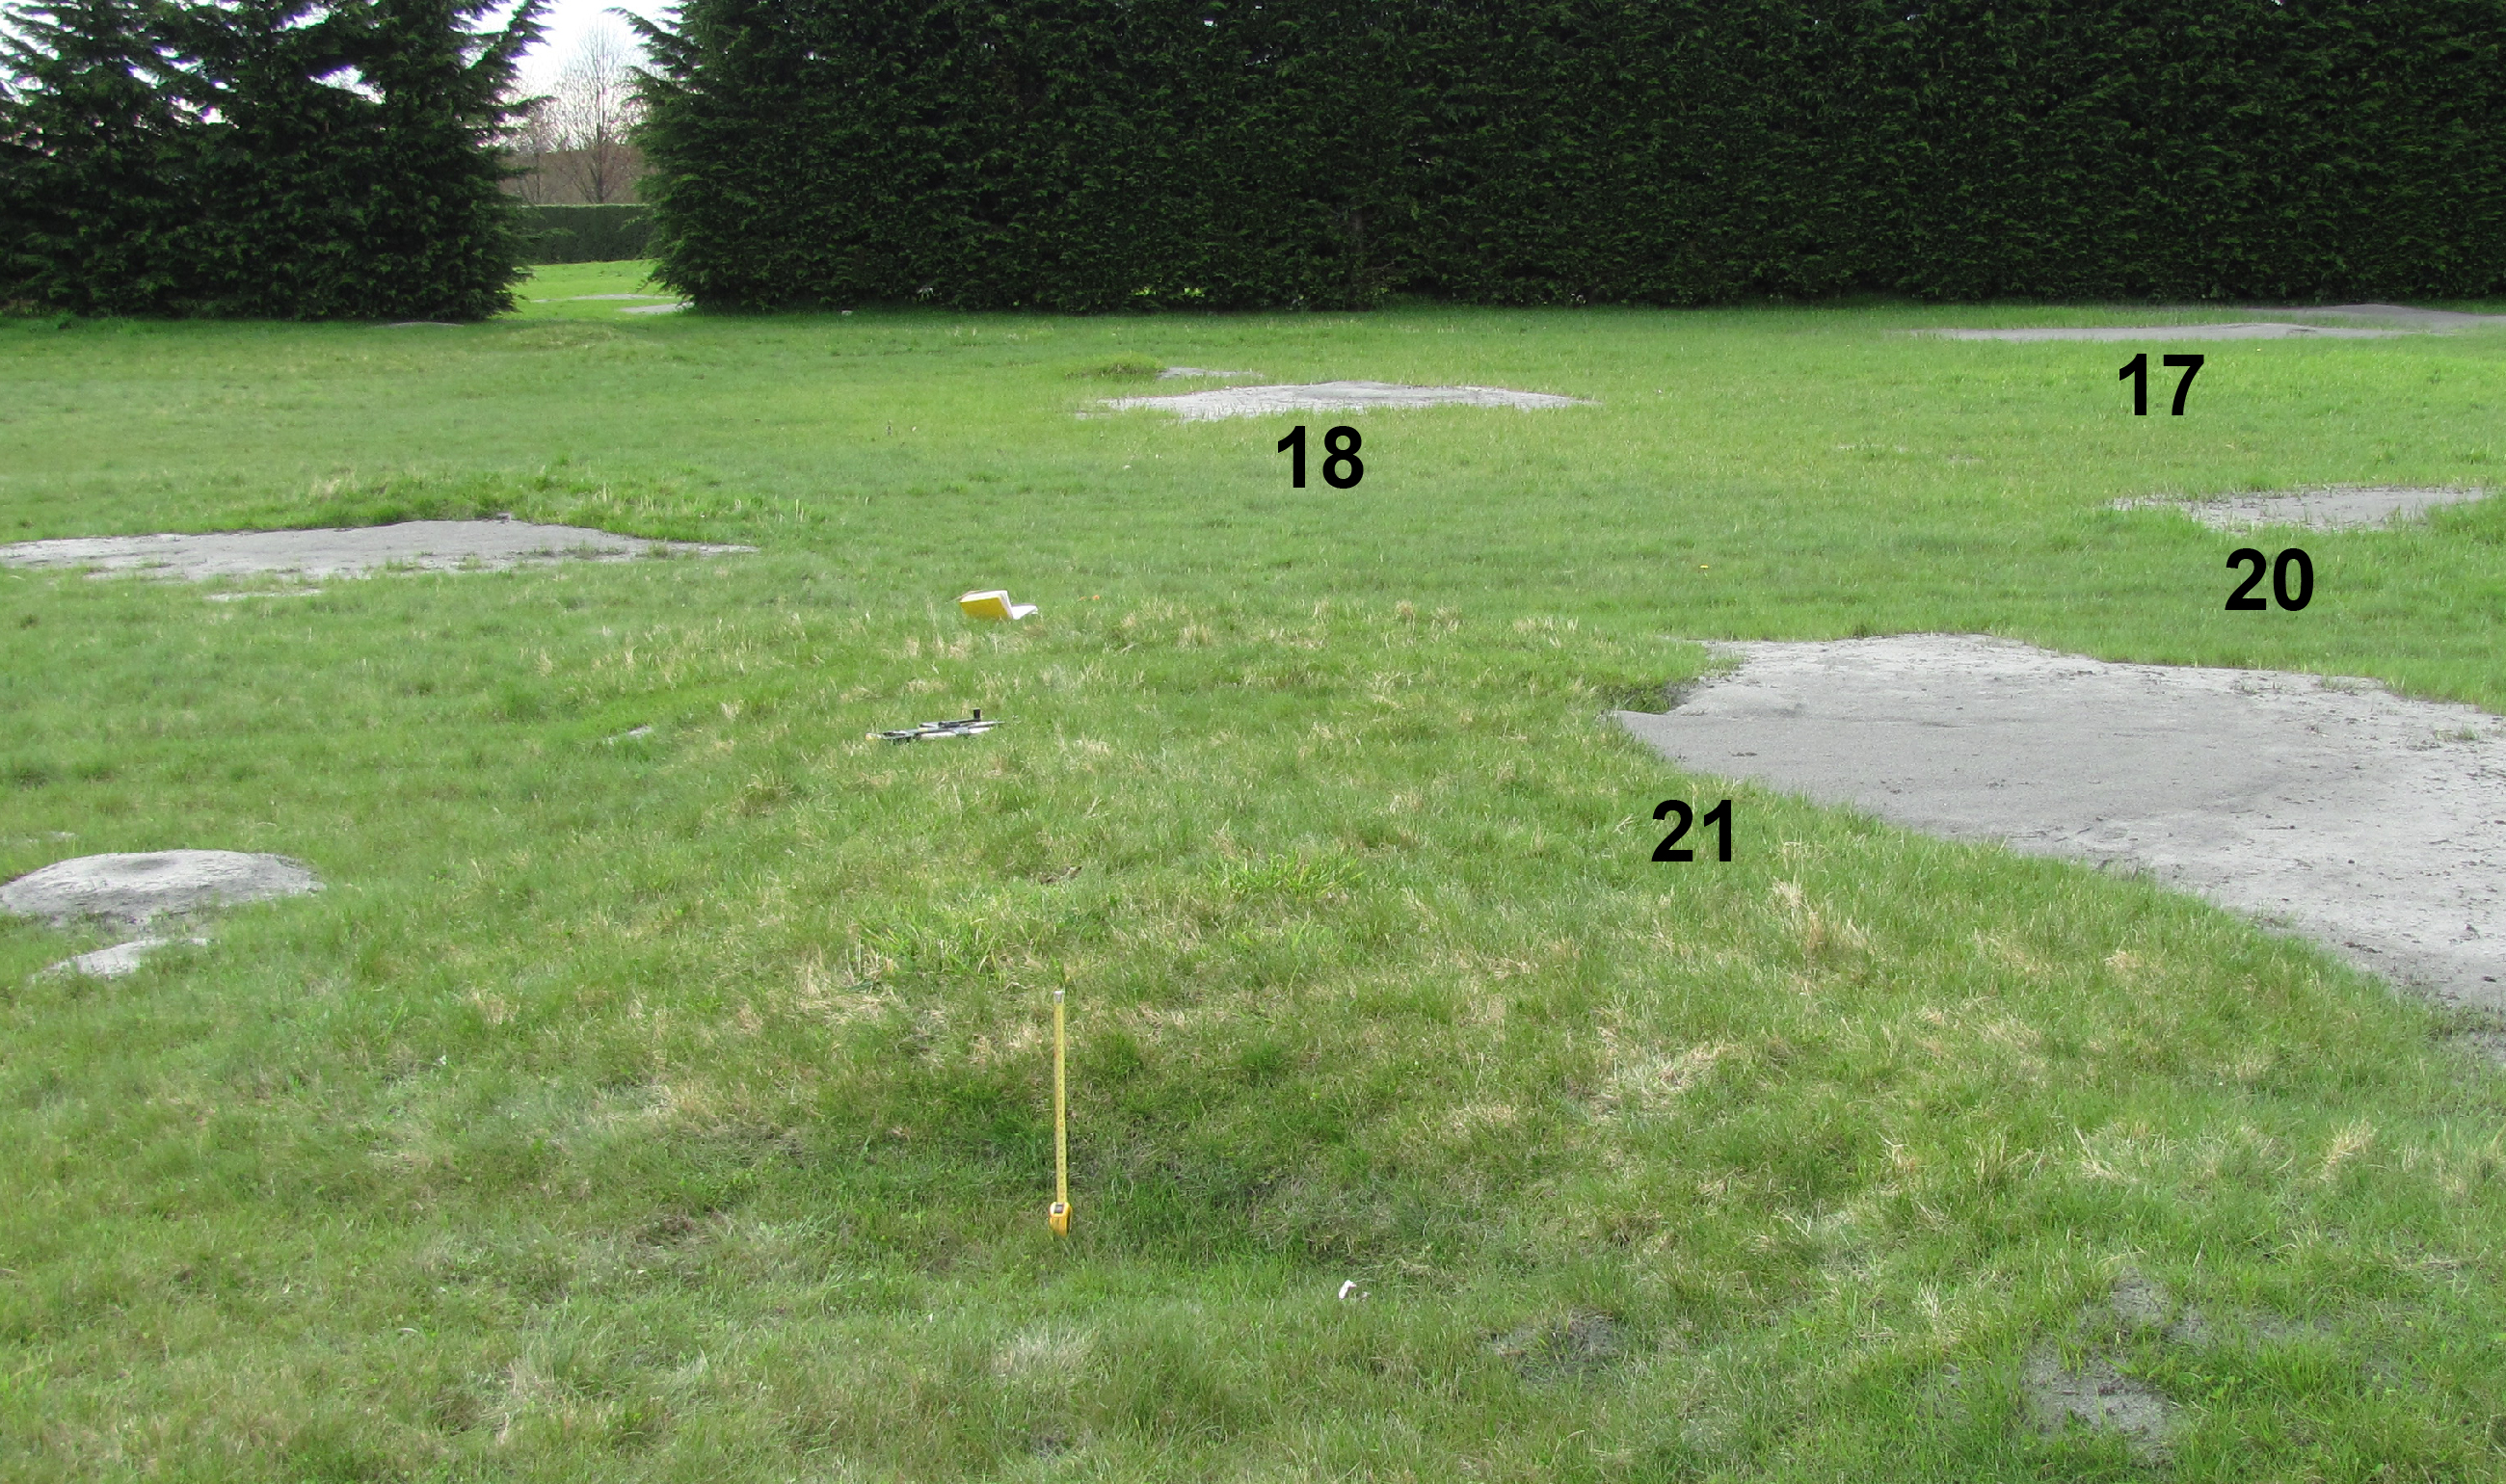
Figure S20. Sand blow that formed at the Hardwick site location L8 during the 22 February 2011 M 6.2 Christchurch earthquakes. Water is still issuing through one of the vents following an aftershock. Sand grains are suspended in faster-flowing water above the active vent, and fines are suspended in slower-flowing water above the inactive vent and in the channel cut into the sand fissure. Vented material is still wet and gray. Blades of grass provide a sense of scale. Photograph by C. Hardwick and R. Hardwick.
Figure S21. Sand–silt blows and fissures that formed at the Hardwick site location L9 during the 22 February 2011 M 6.2 Christchurch earthquakes. The liquefaction features are composed of gray sand and silt. Fence posts and grass blades provide a sense of scale. Photograph by C. Hardwick and R. Hardwick.
Figure S22. Compound sand–silt fissure that formed at the Hardwick site location L9 during the 22 February 2011 M 6.2 and the 13 June 2011 M 6.0 Christchurch earthquakes. The upper deposit, composed here of gray silt, that formed during the June 2011 event partially buries the sand deposit that formed during the February 2011 events. The older deposit can be seen beyond the edge of the younger deposit. Dandelions and grass are growing on the surface of the older sand fissure, which is more eroded than the young silt fissure. Plants provide a sense of scale. Photograph by C. Hardwick and R. Hardwick.
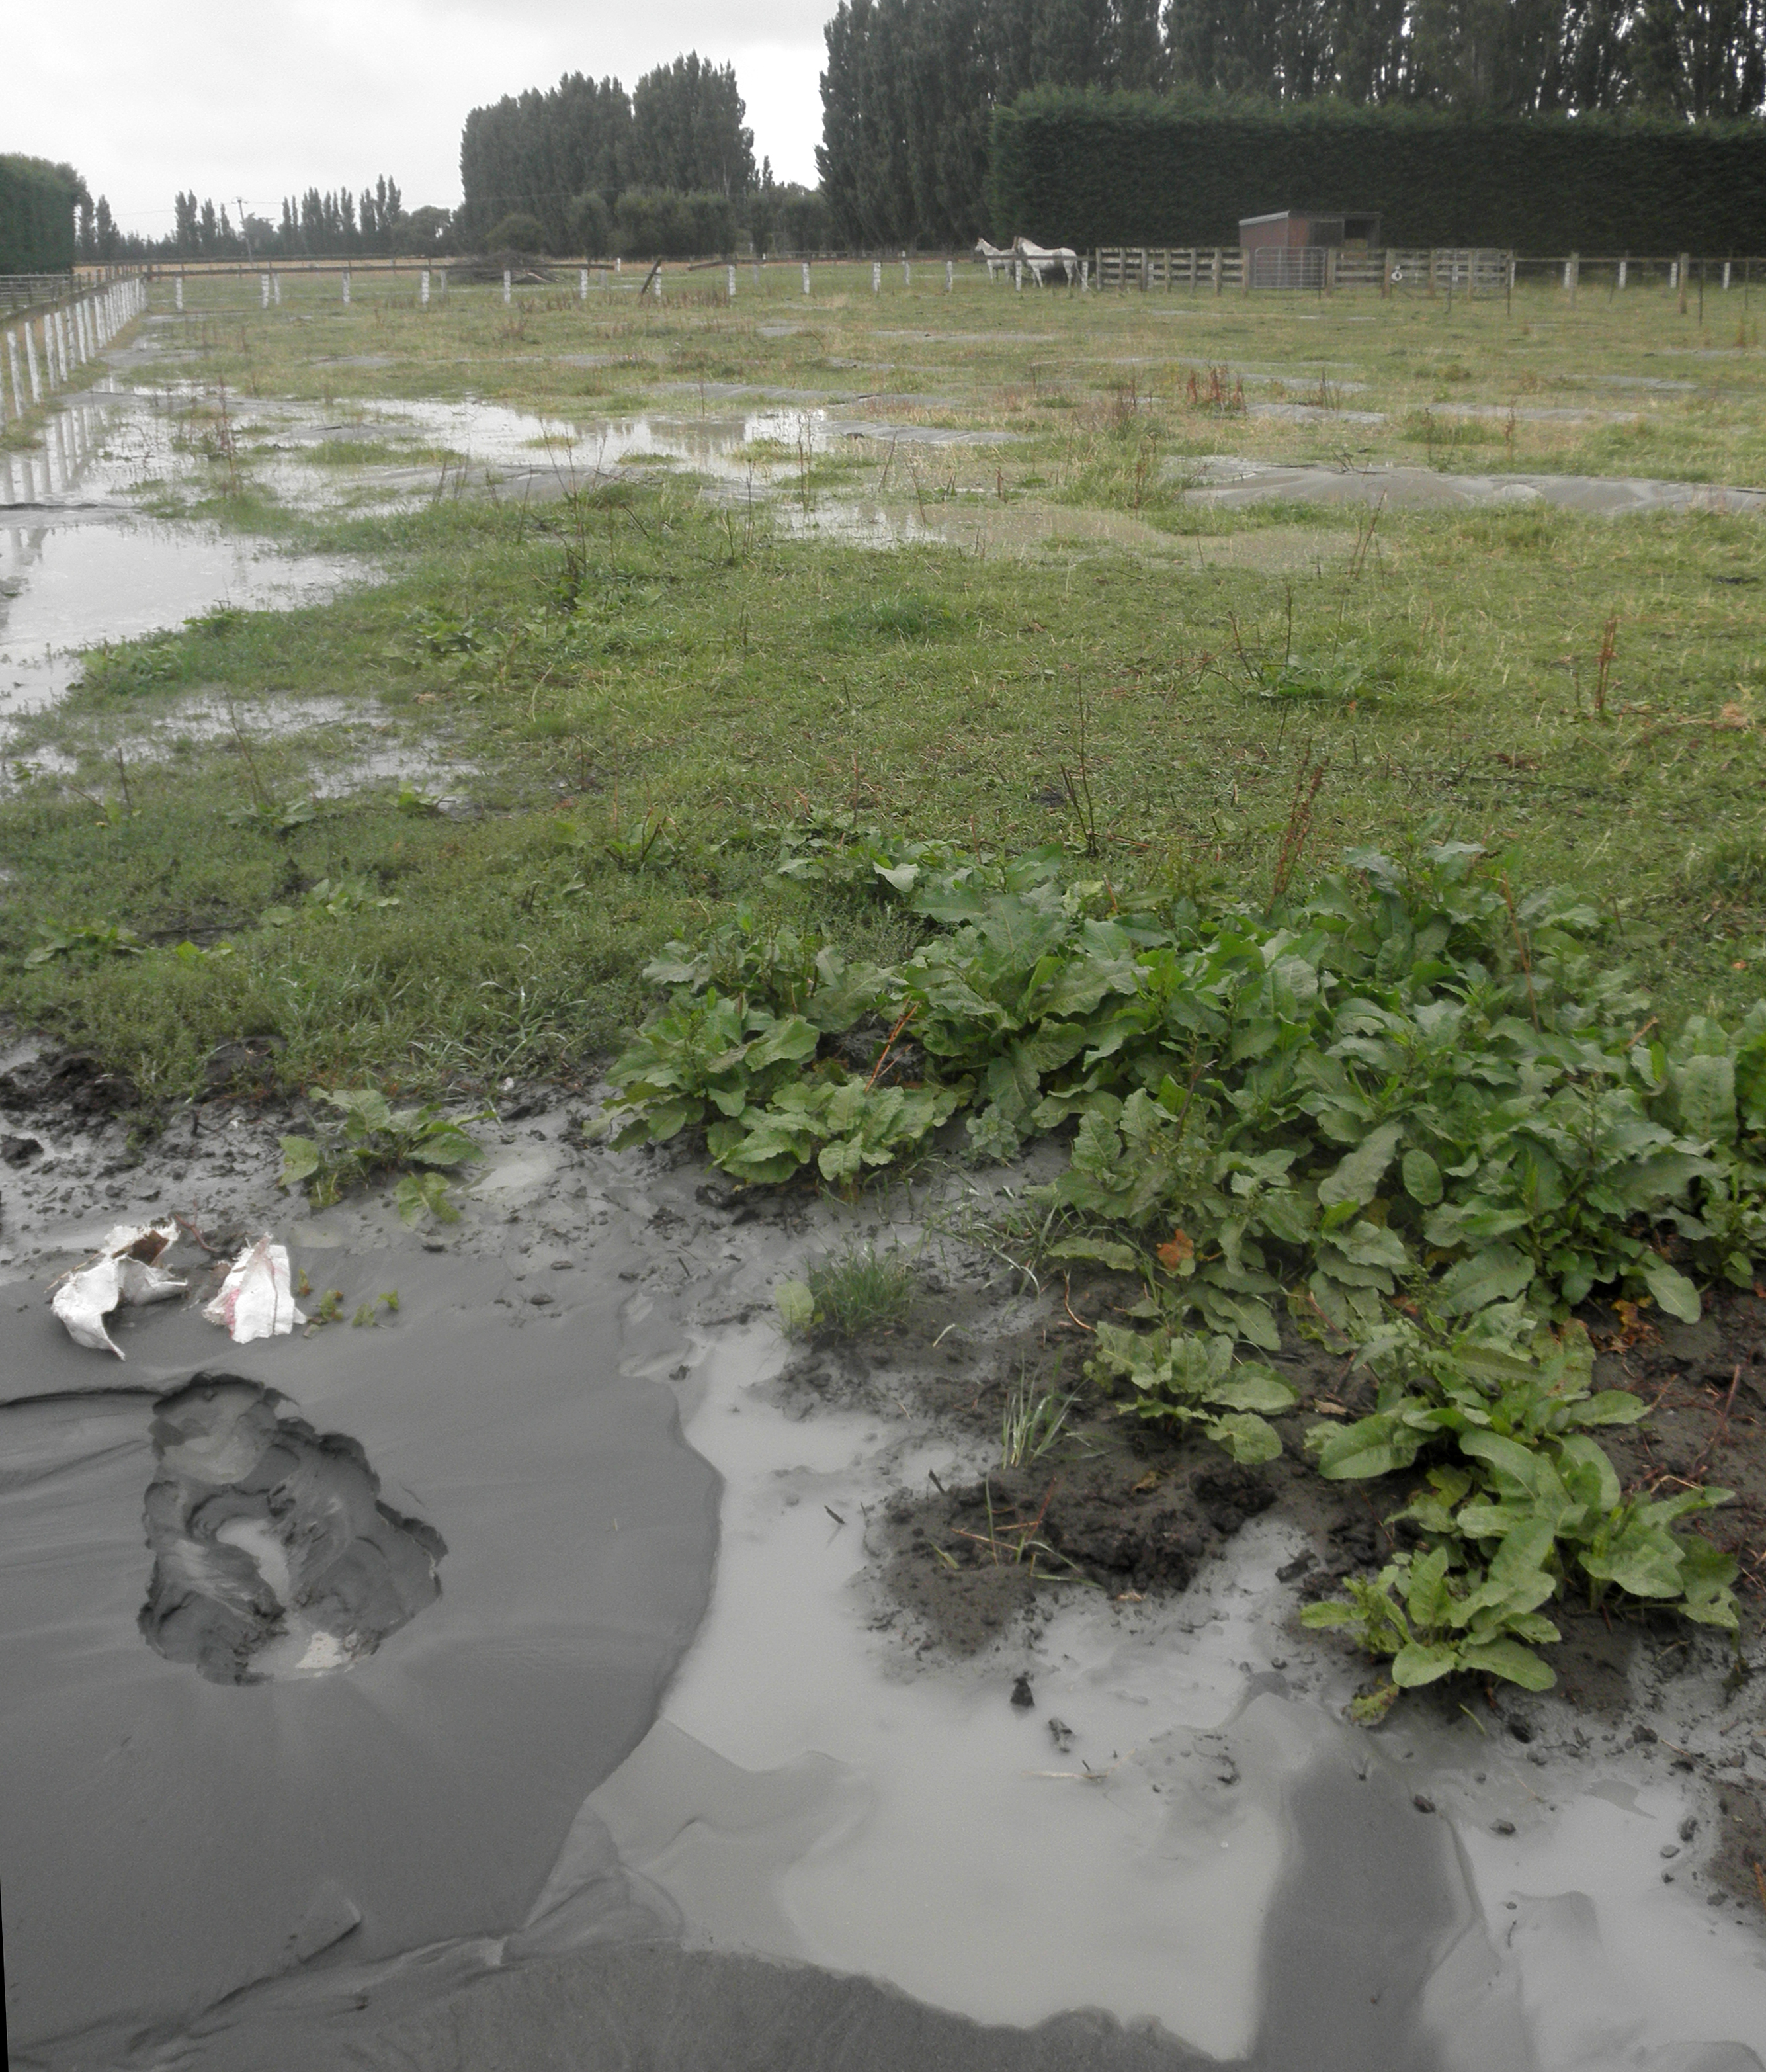
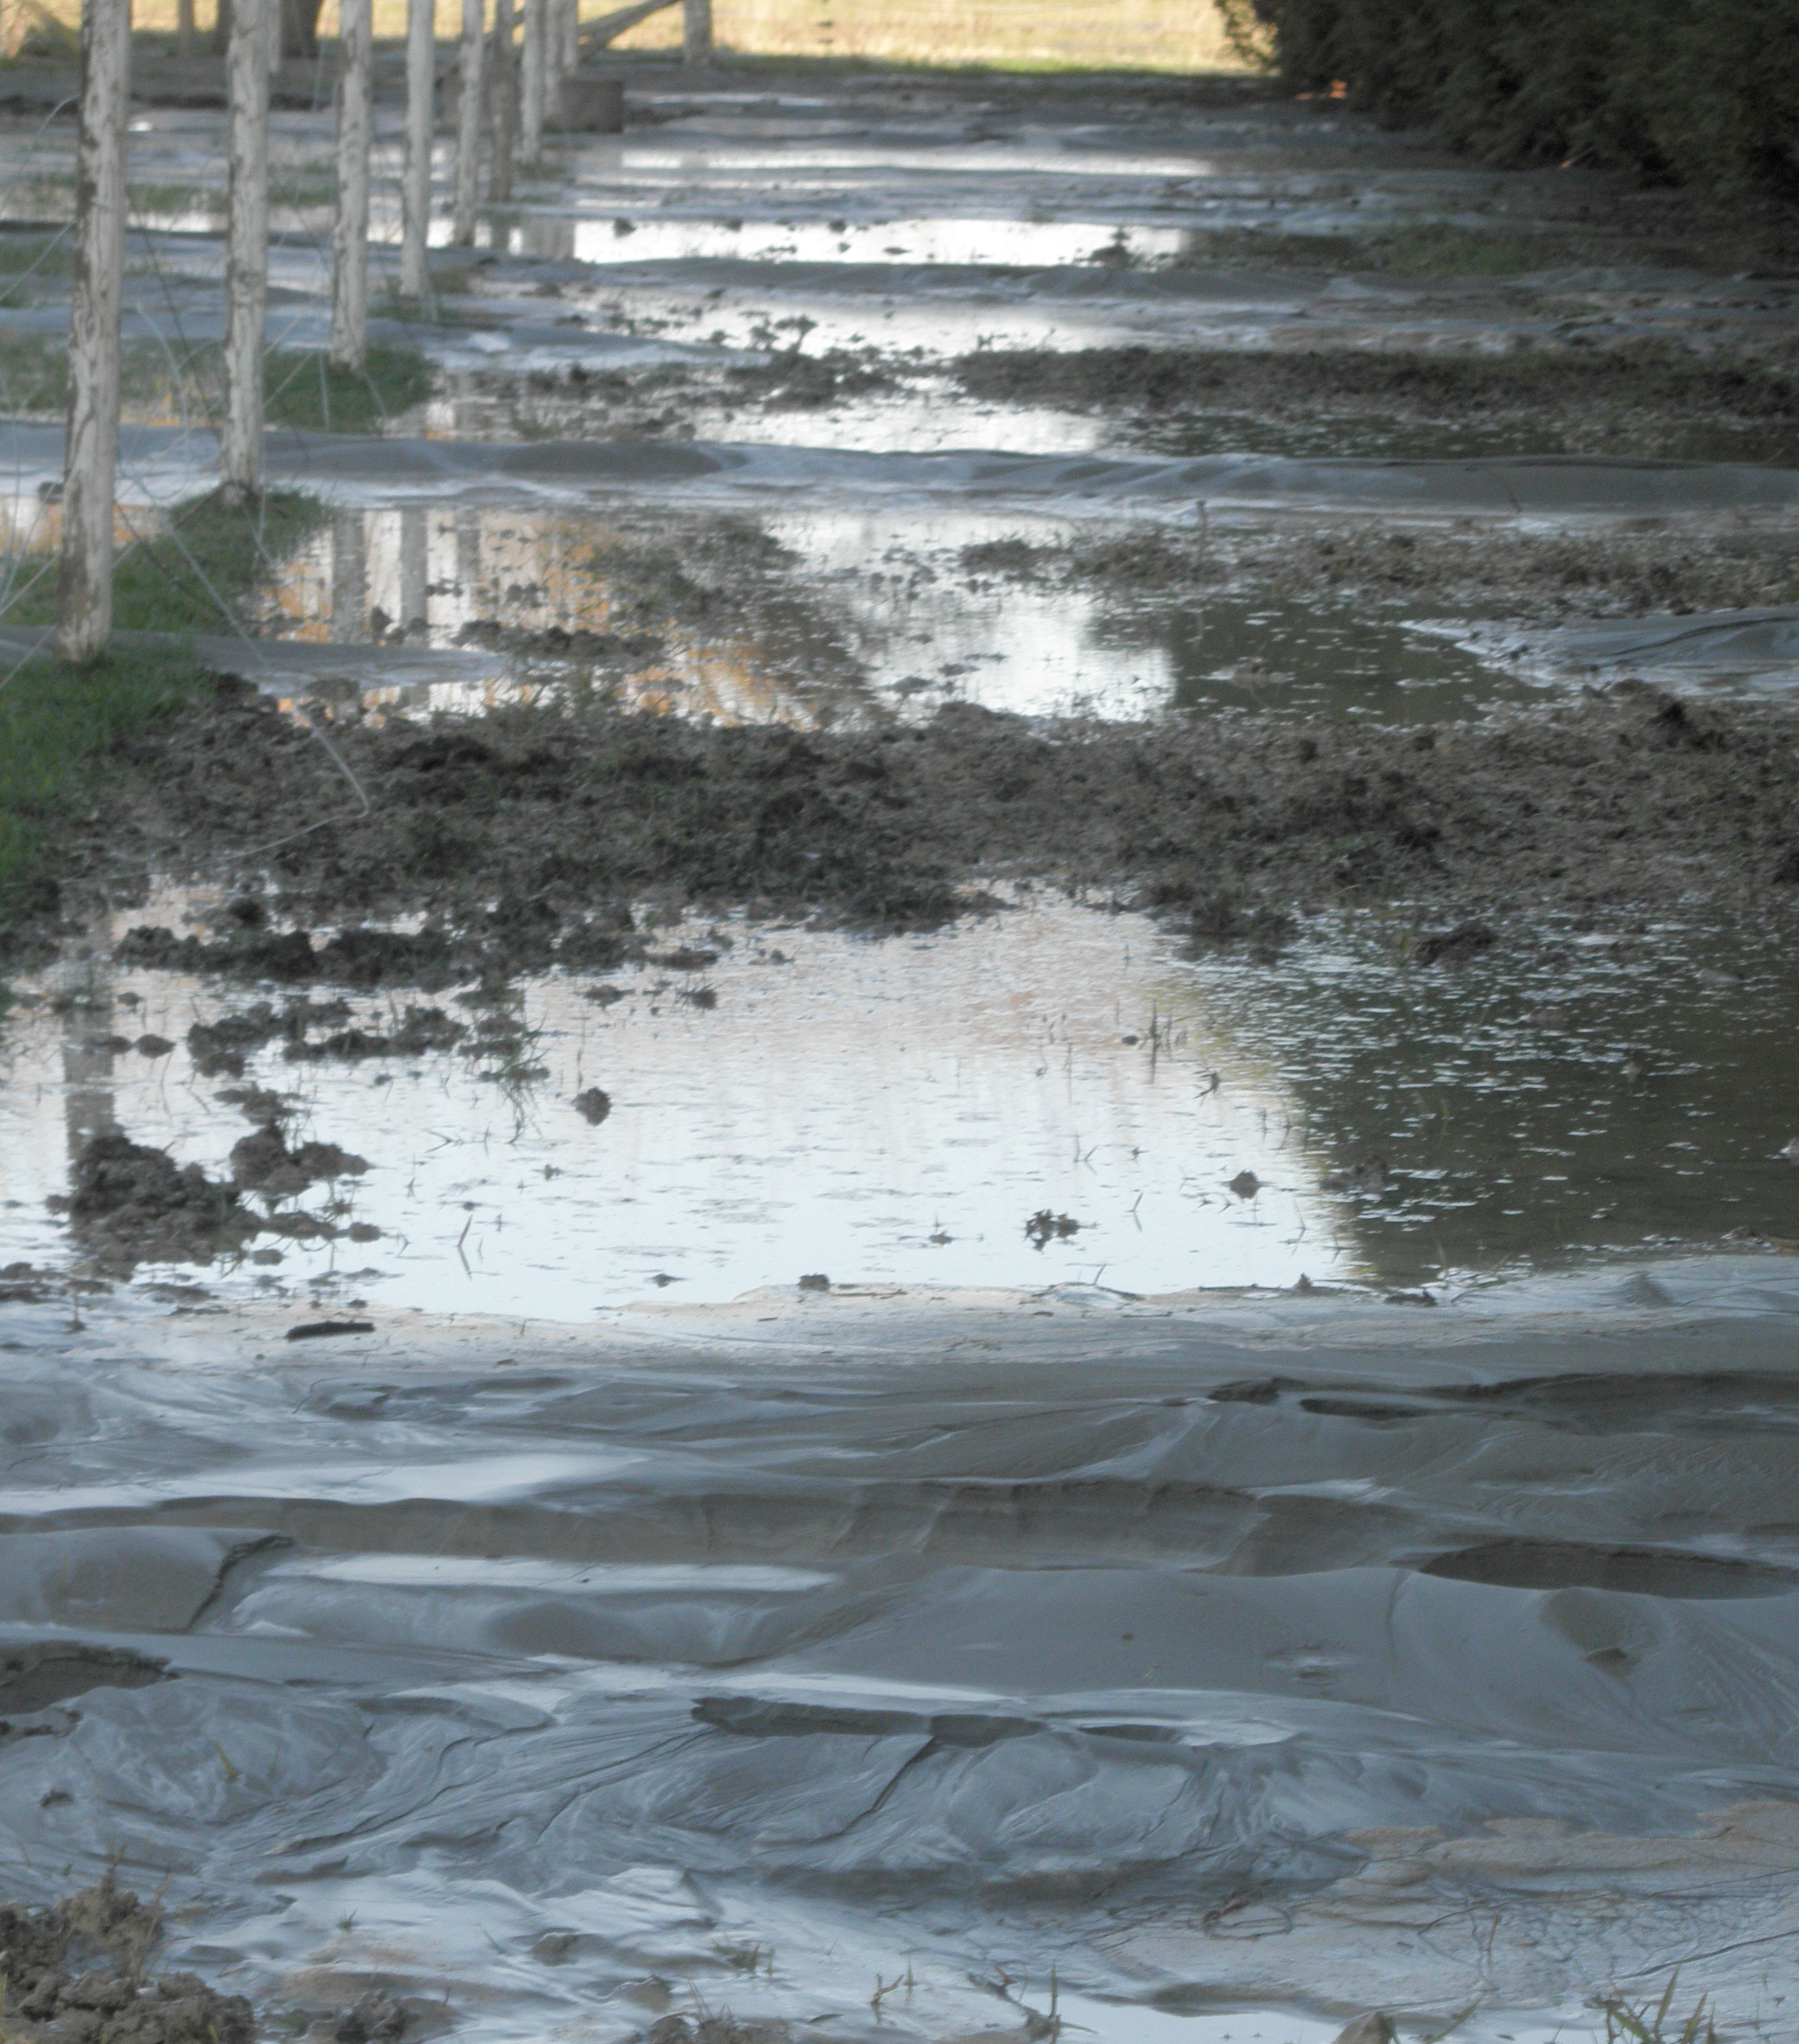
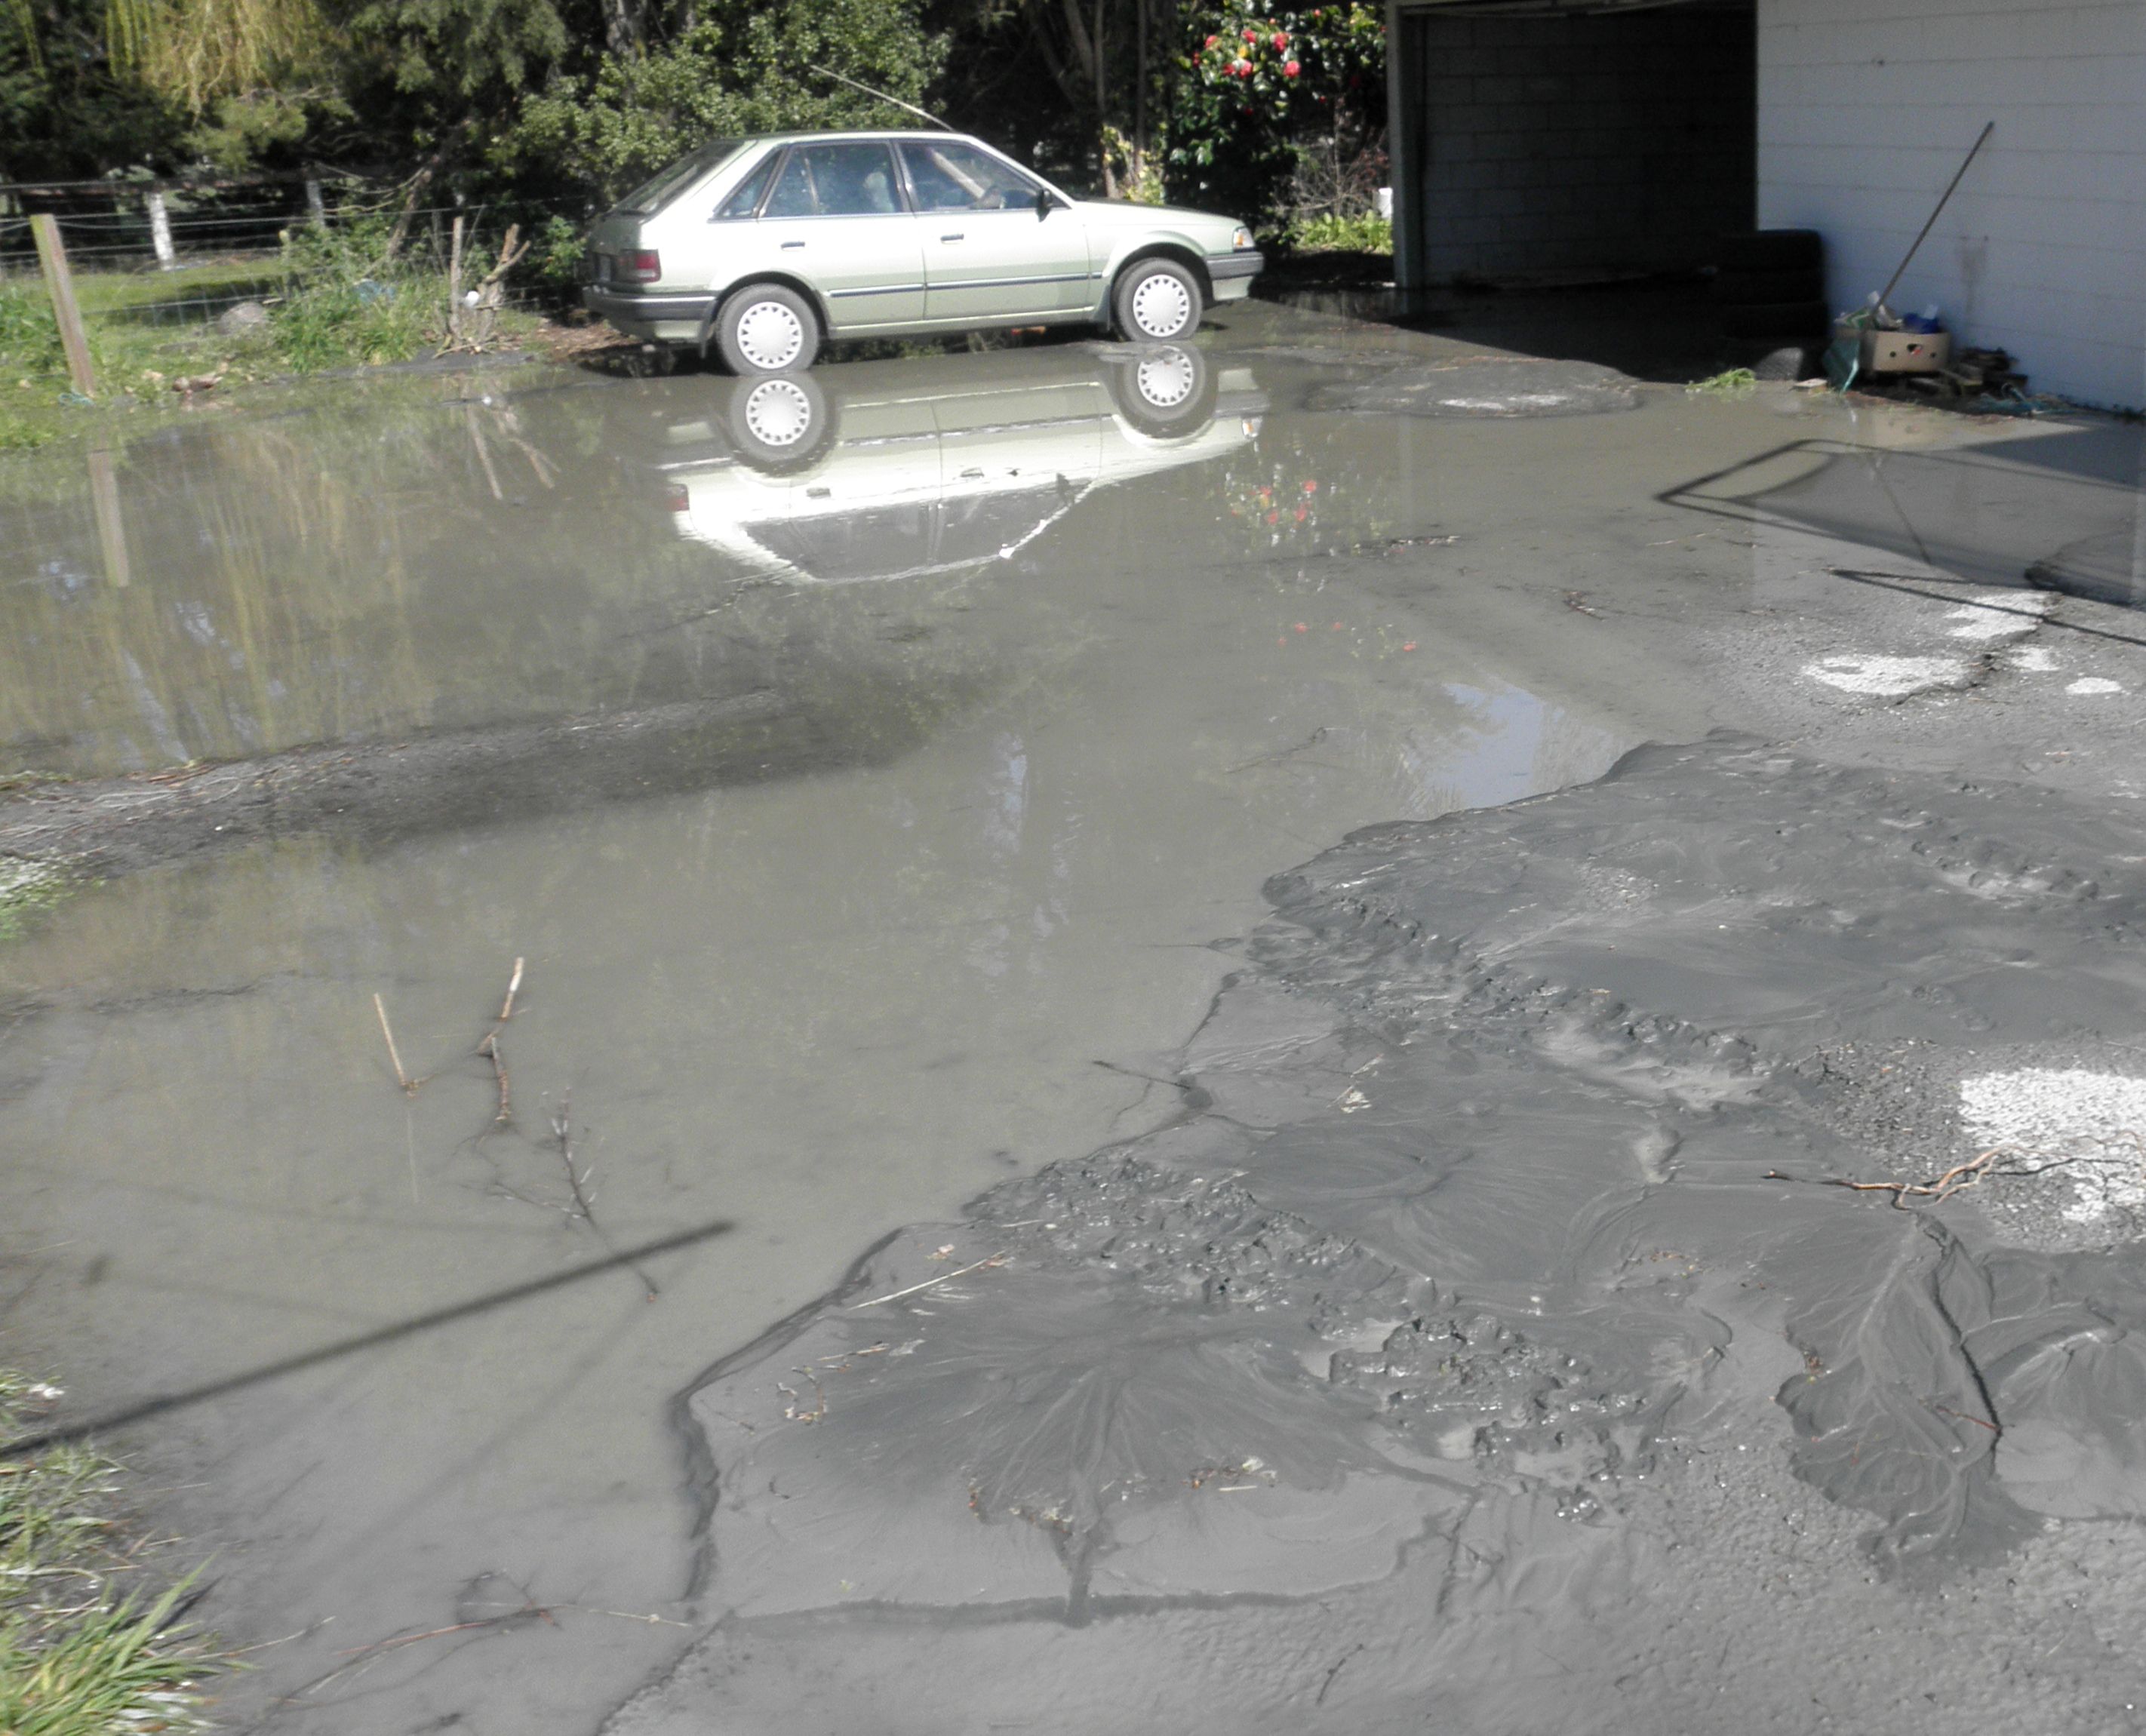
Figure S23. Silt blows and fissures that formed at the Hardwick site location L10 during the 4 September 2010 M 7.1 Darfield earthquake. Water and gray silt flowed out of cracks in the asphalt driveway. Note the large quantity of vented water. Car provides a sense of scale. Photograph by C. Hardwick and R. Hardwick.
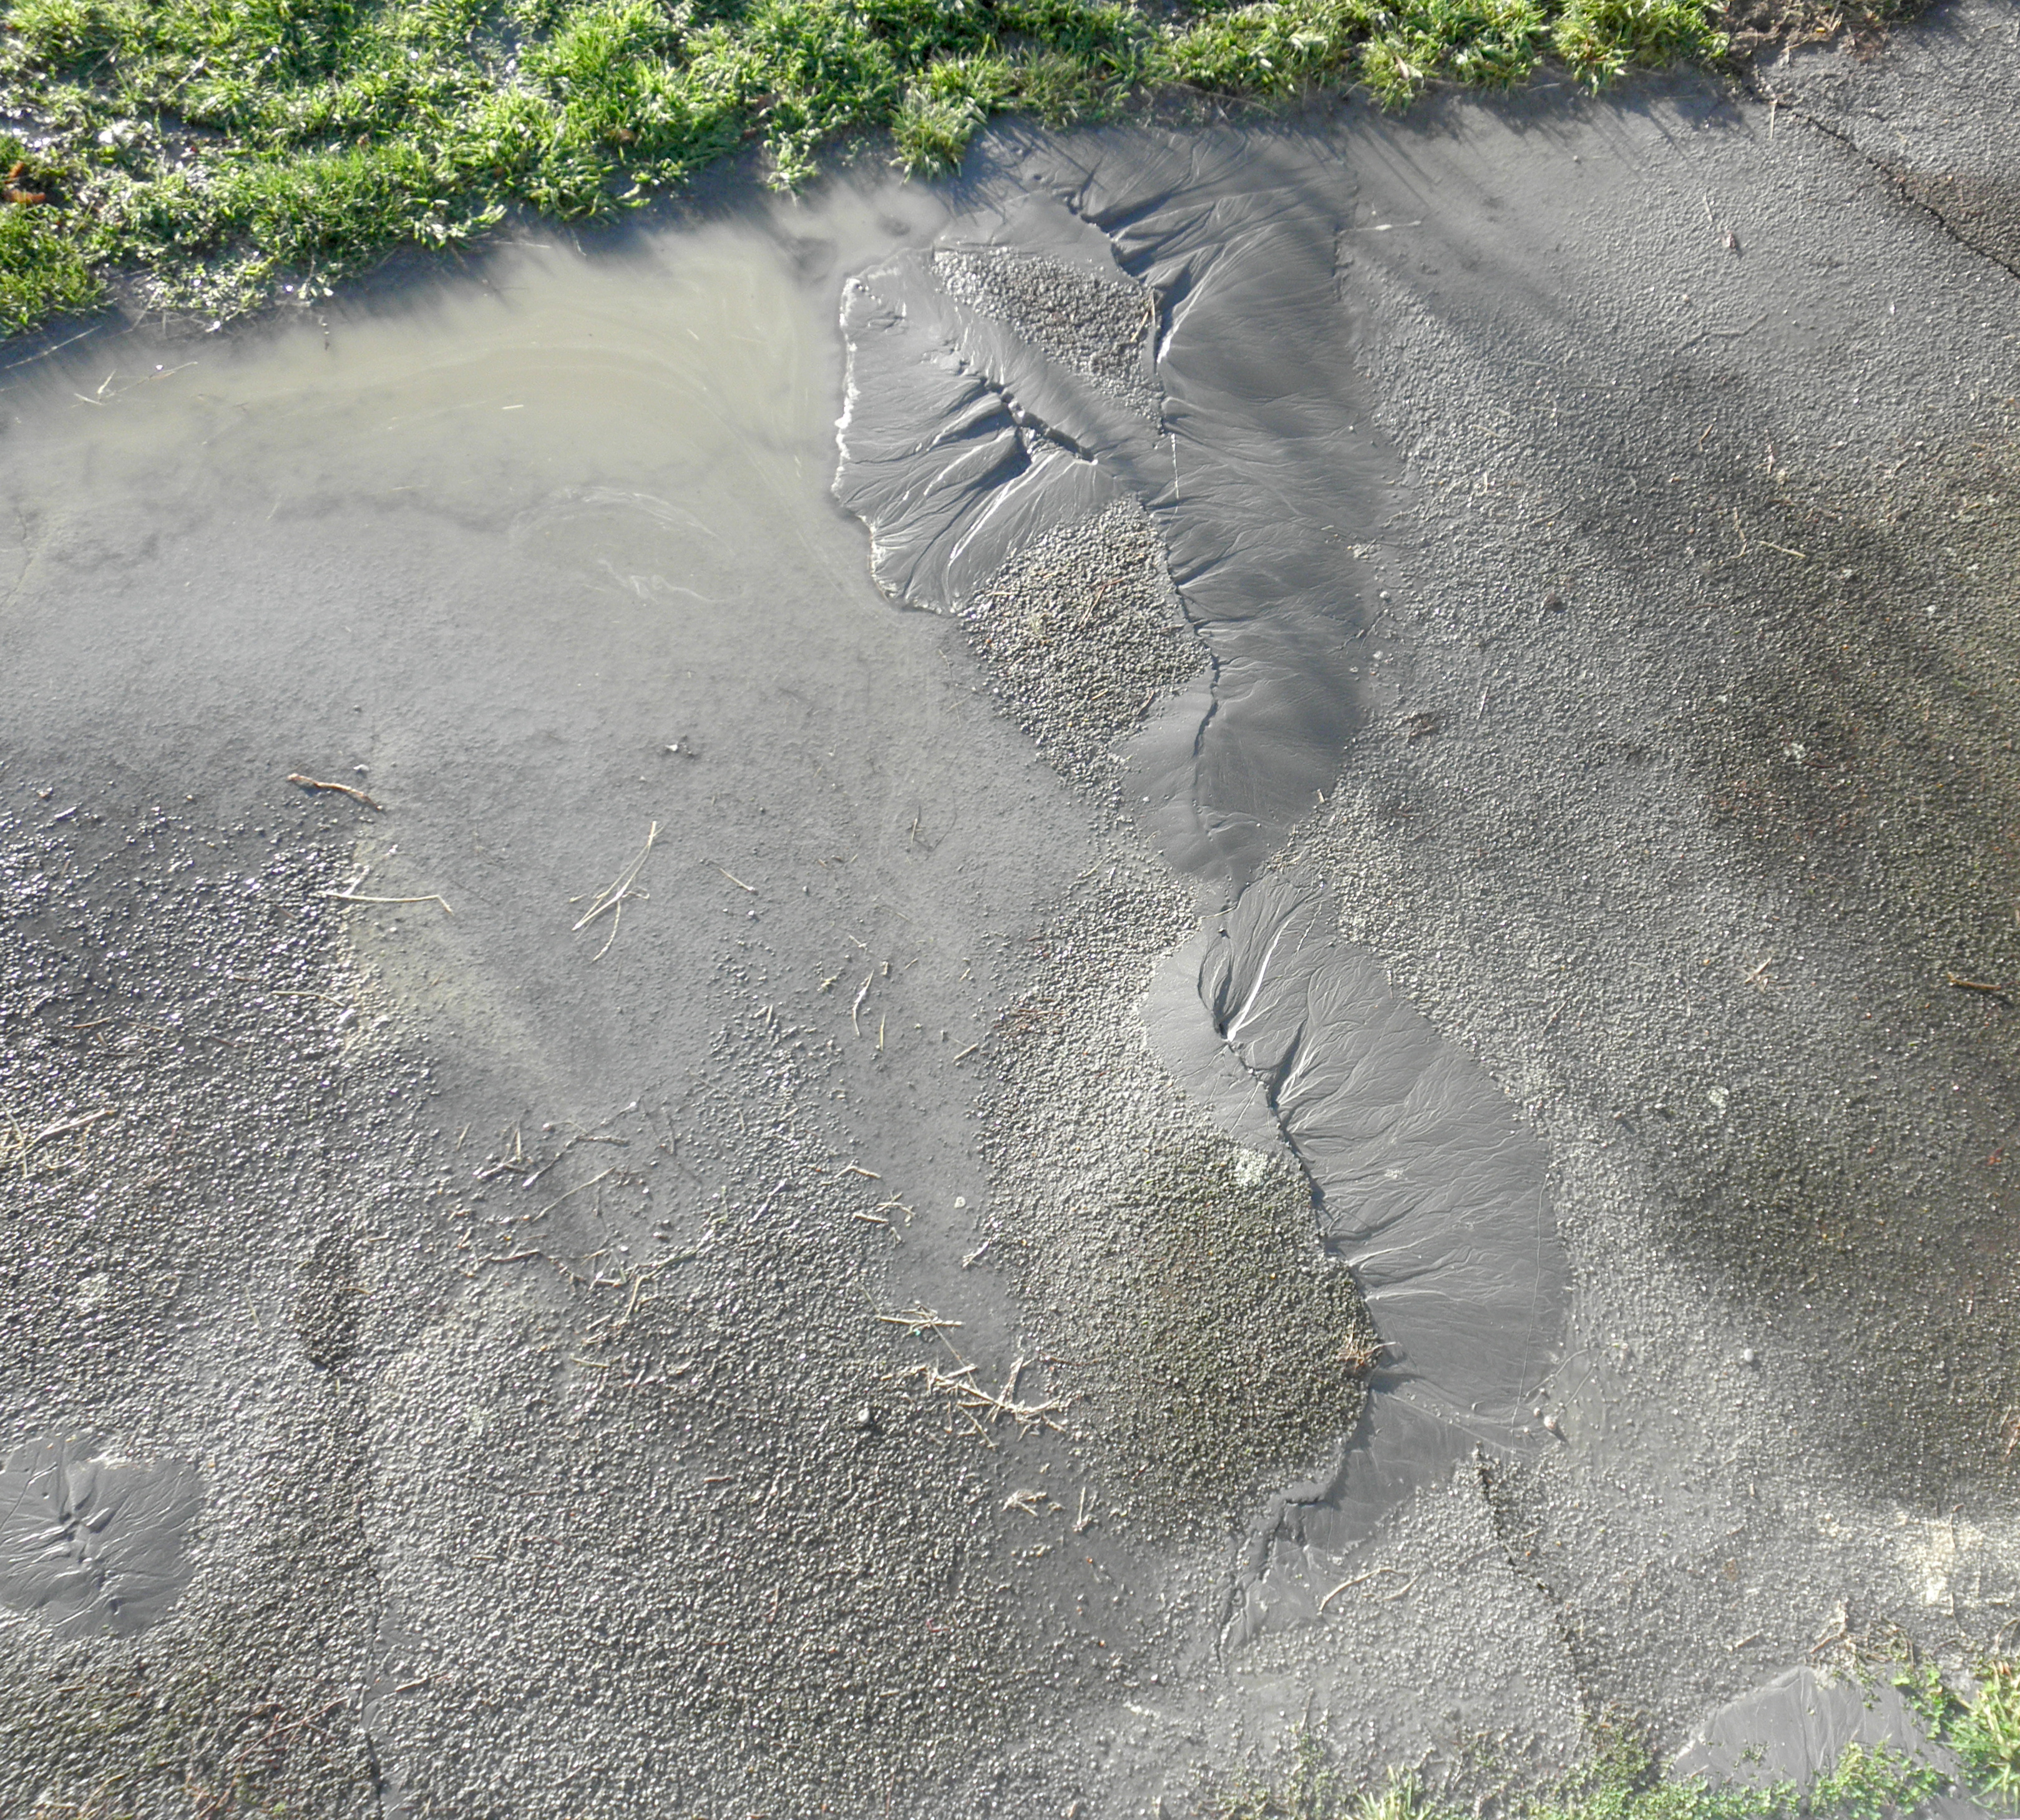
Figure S24. Small silt fissures that formed at the Hardwick site location L10 during the 4 September 2010 M 7.1 Darfield earthquake. Gray silt was deposited along cracks in the asphalt driveway through which water vented. Grass provides a sense of scale. Photograph by C. Hardwick and R. Hardwick.
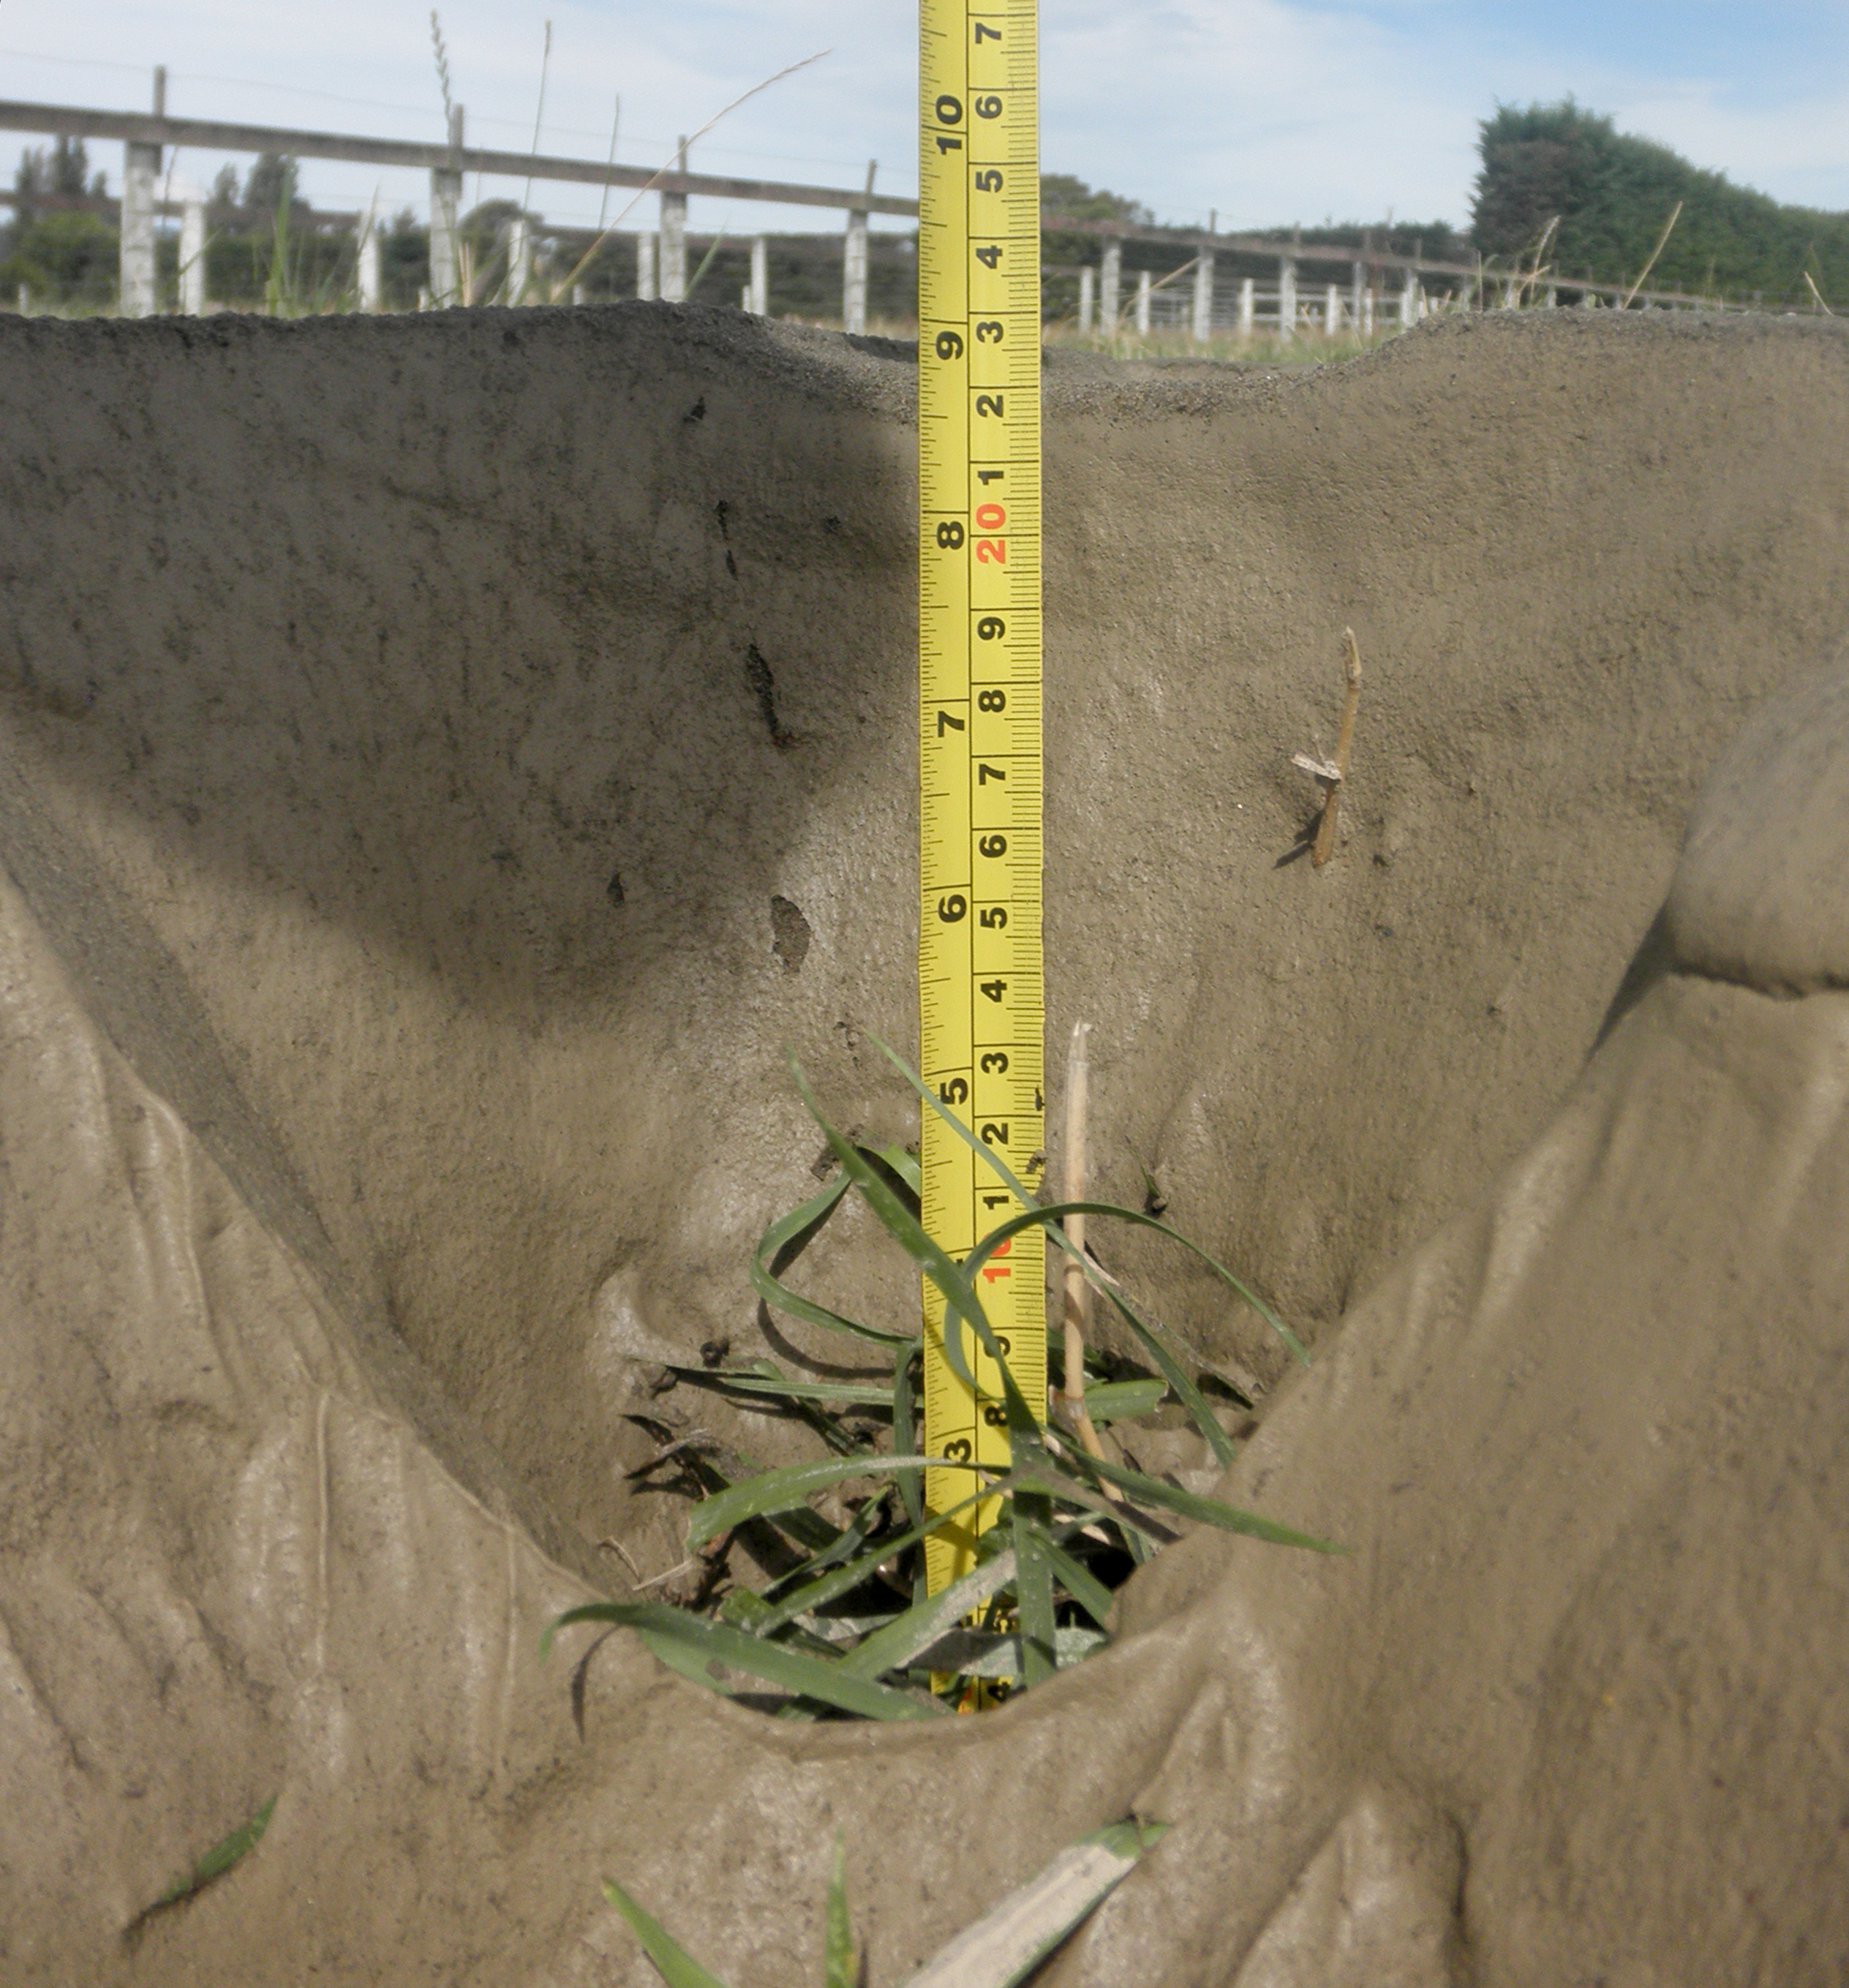
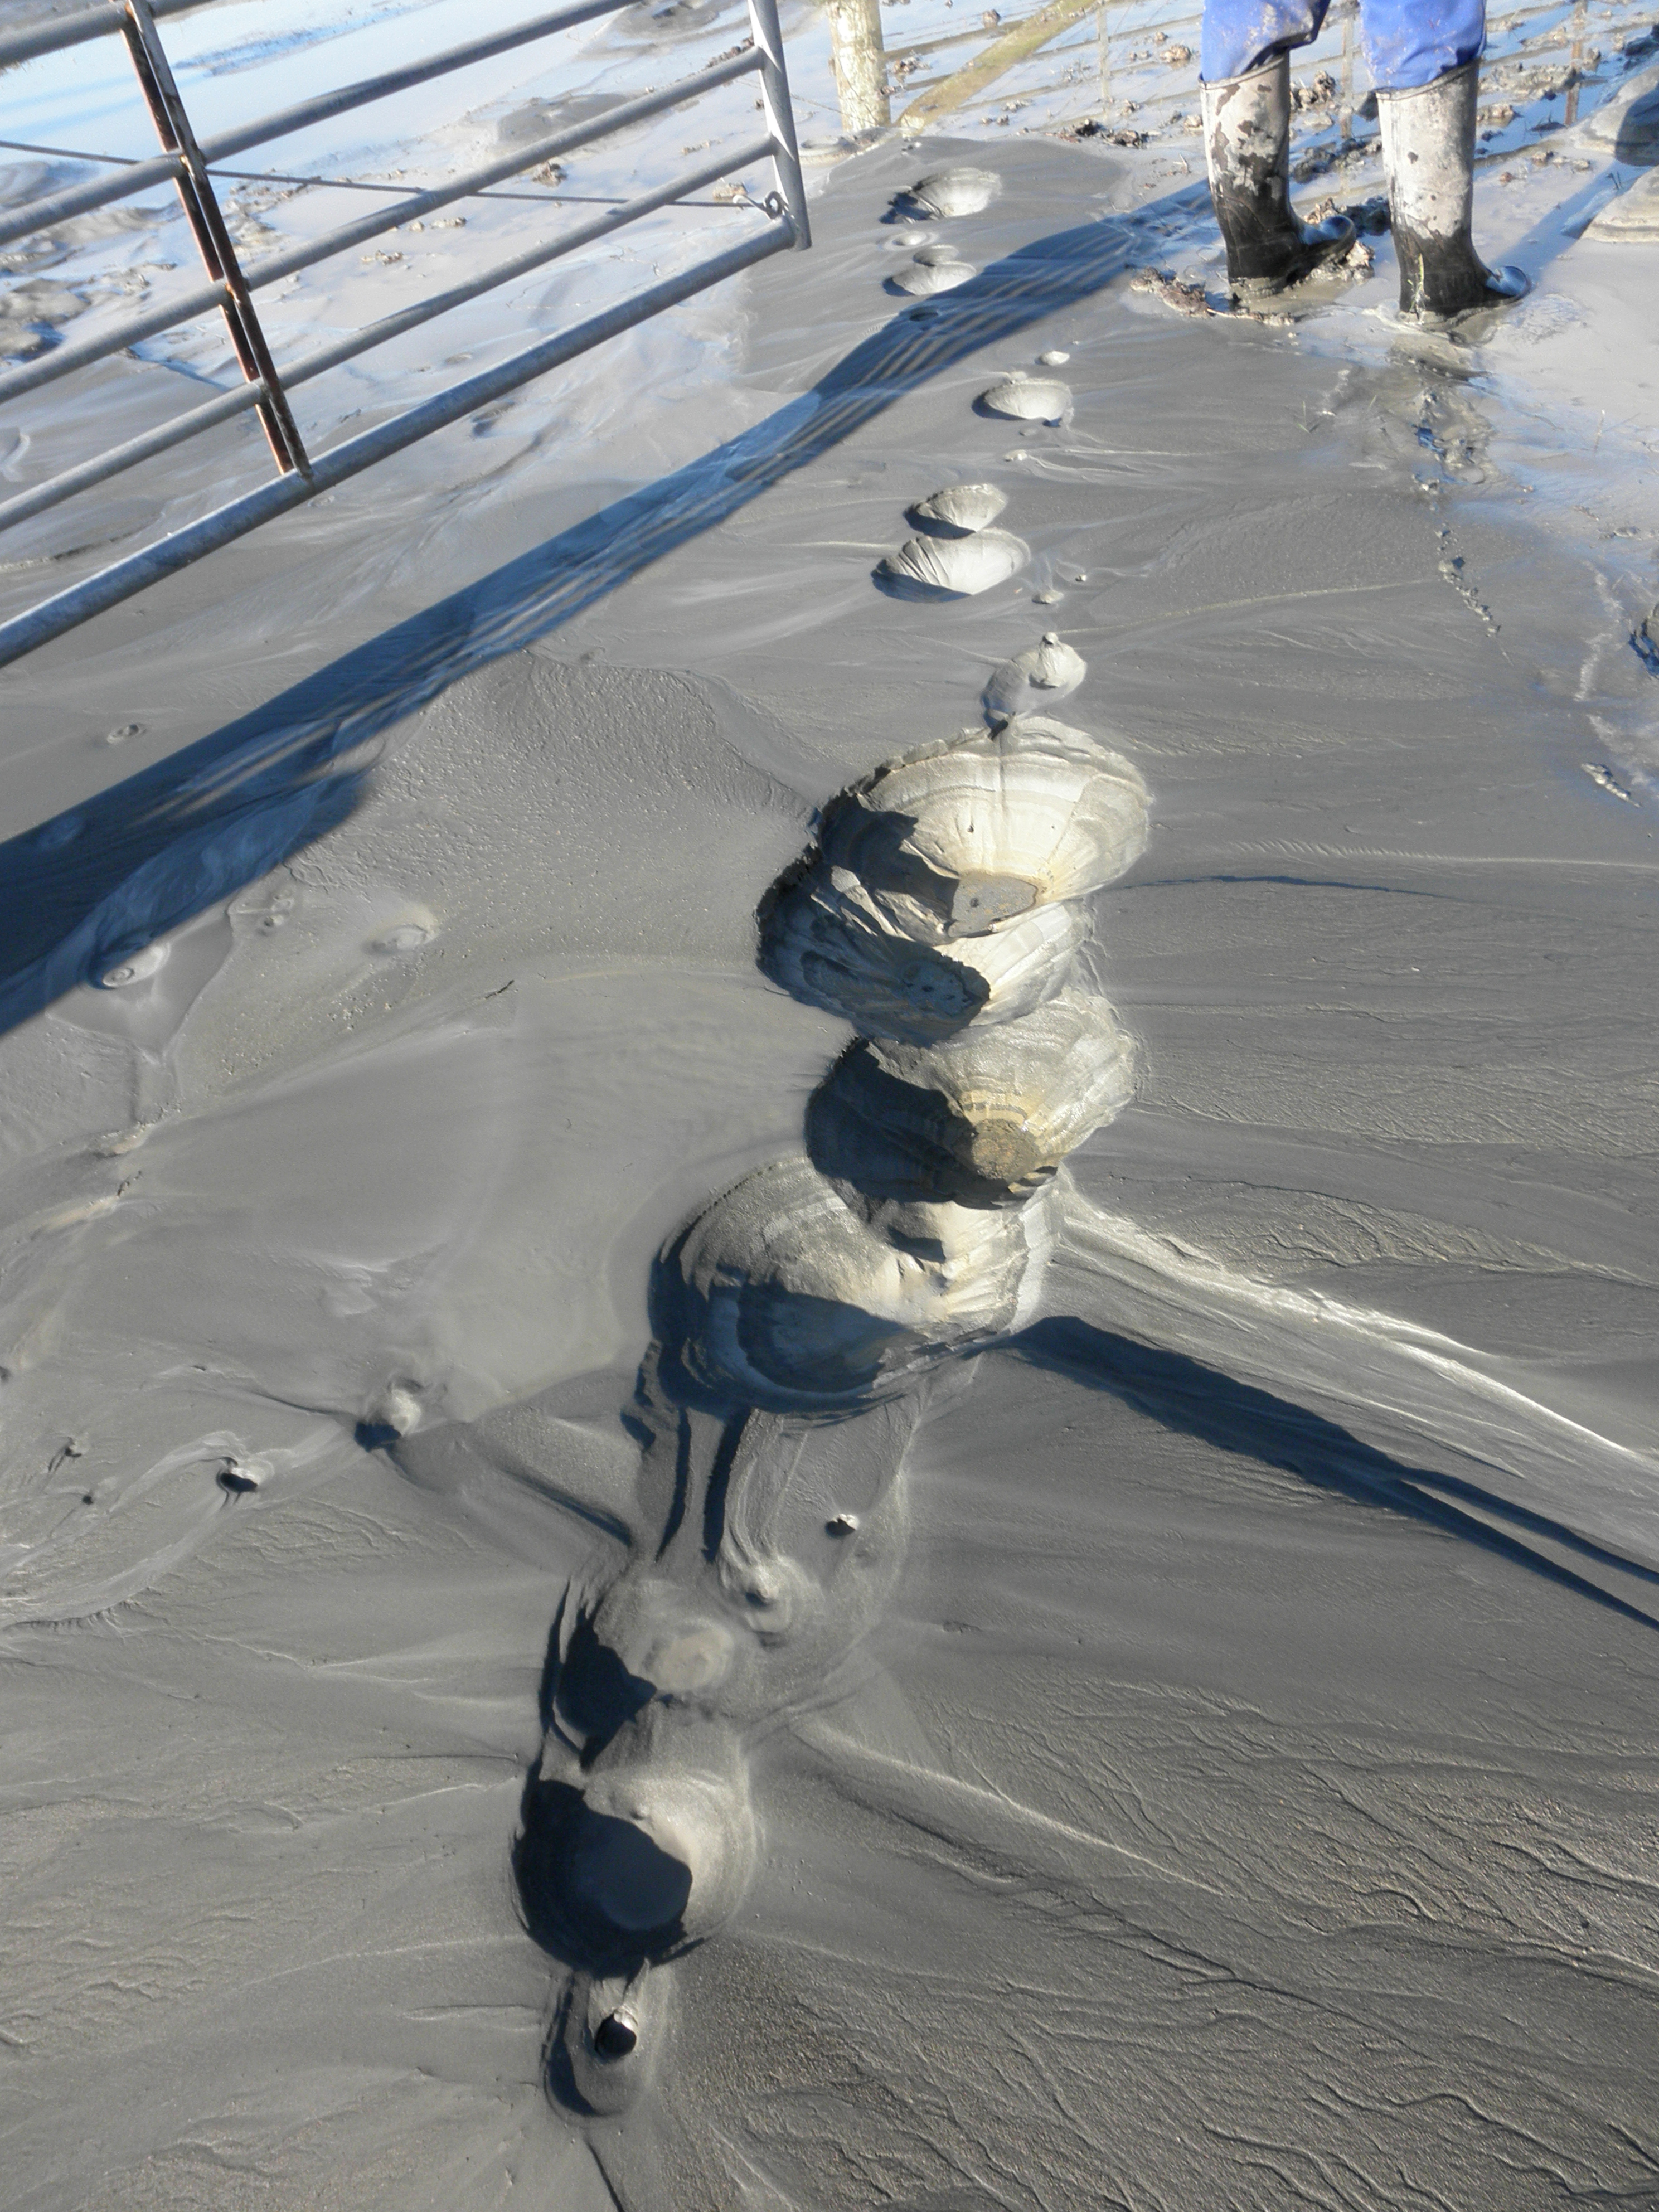
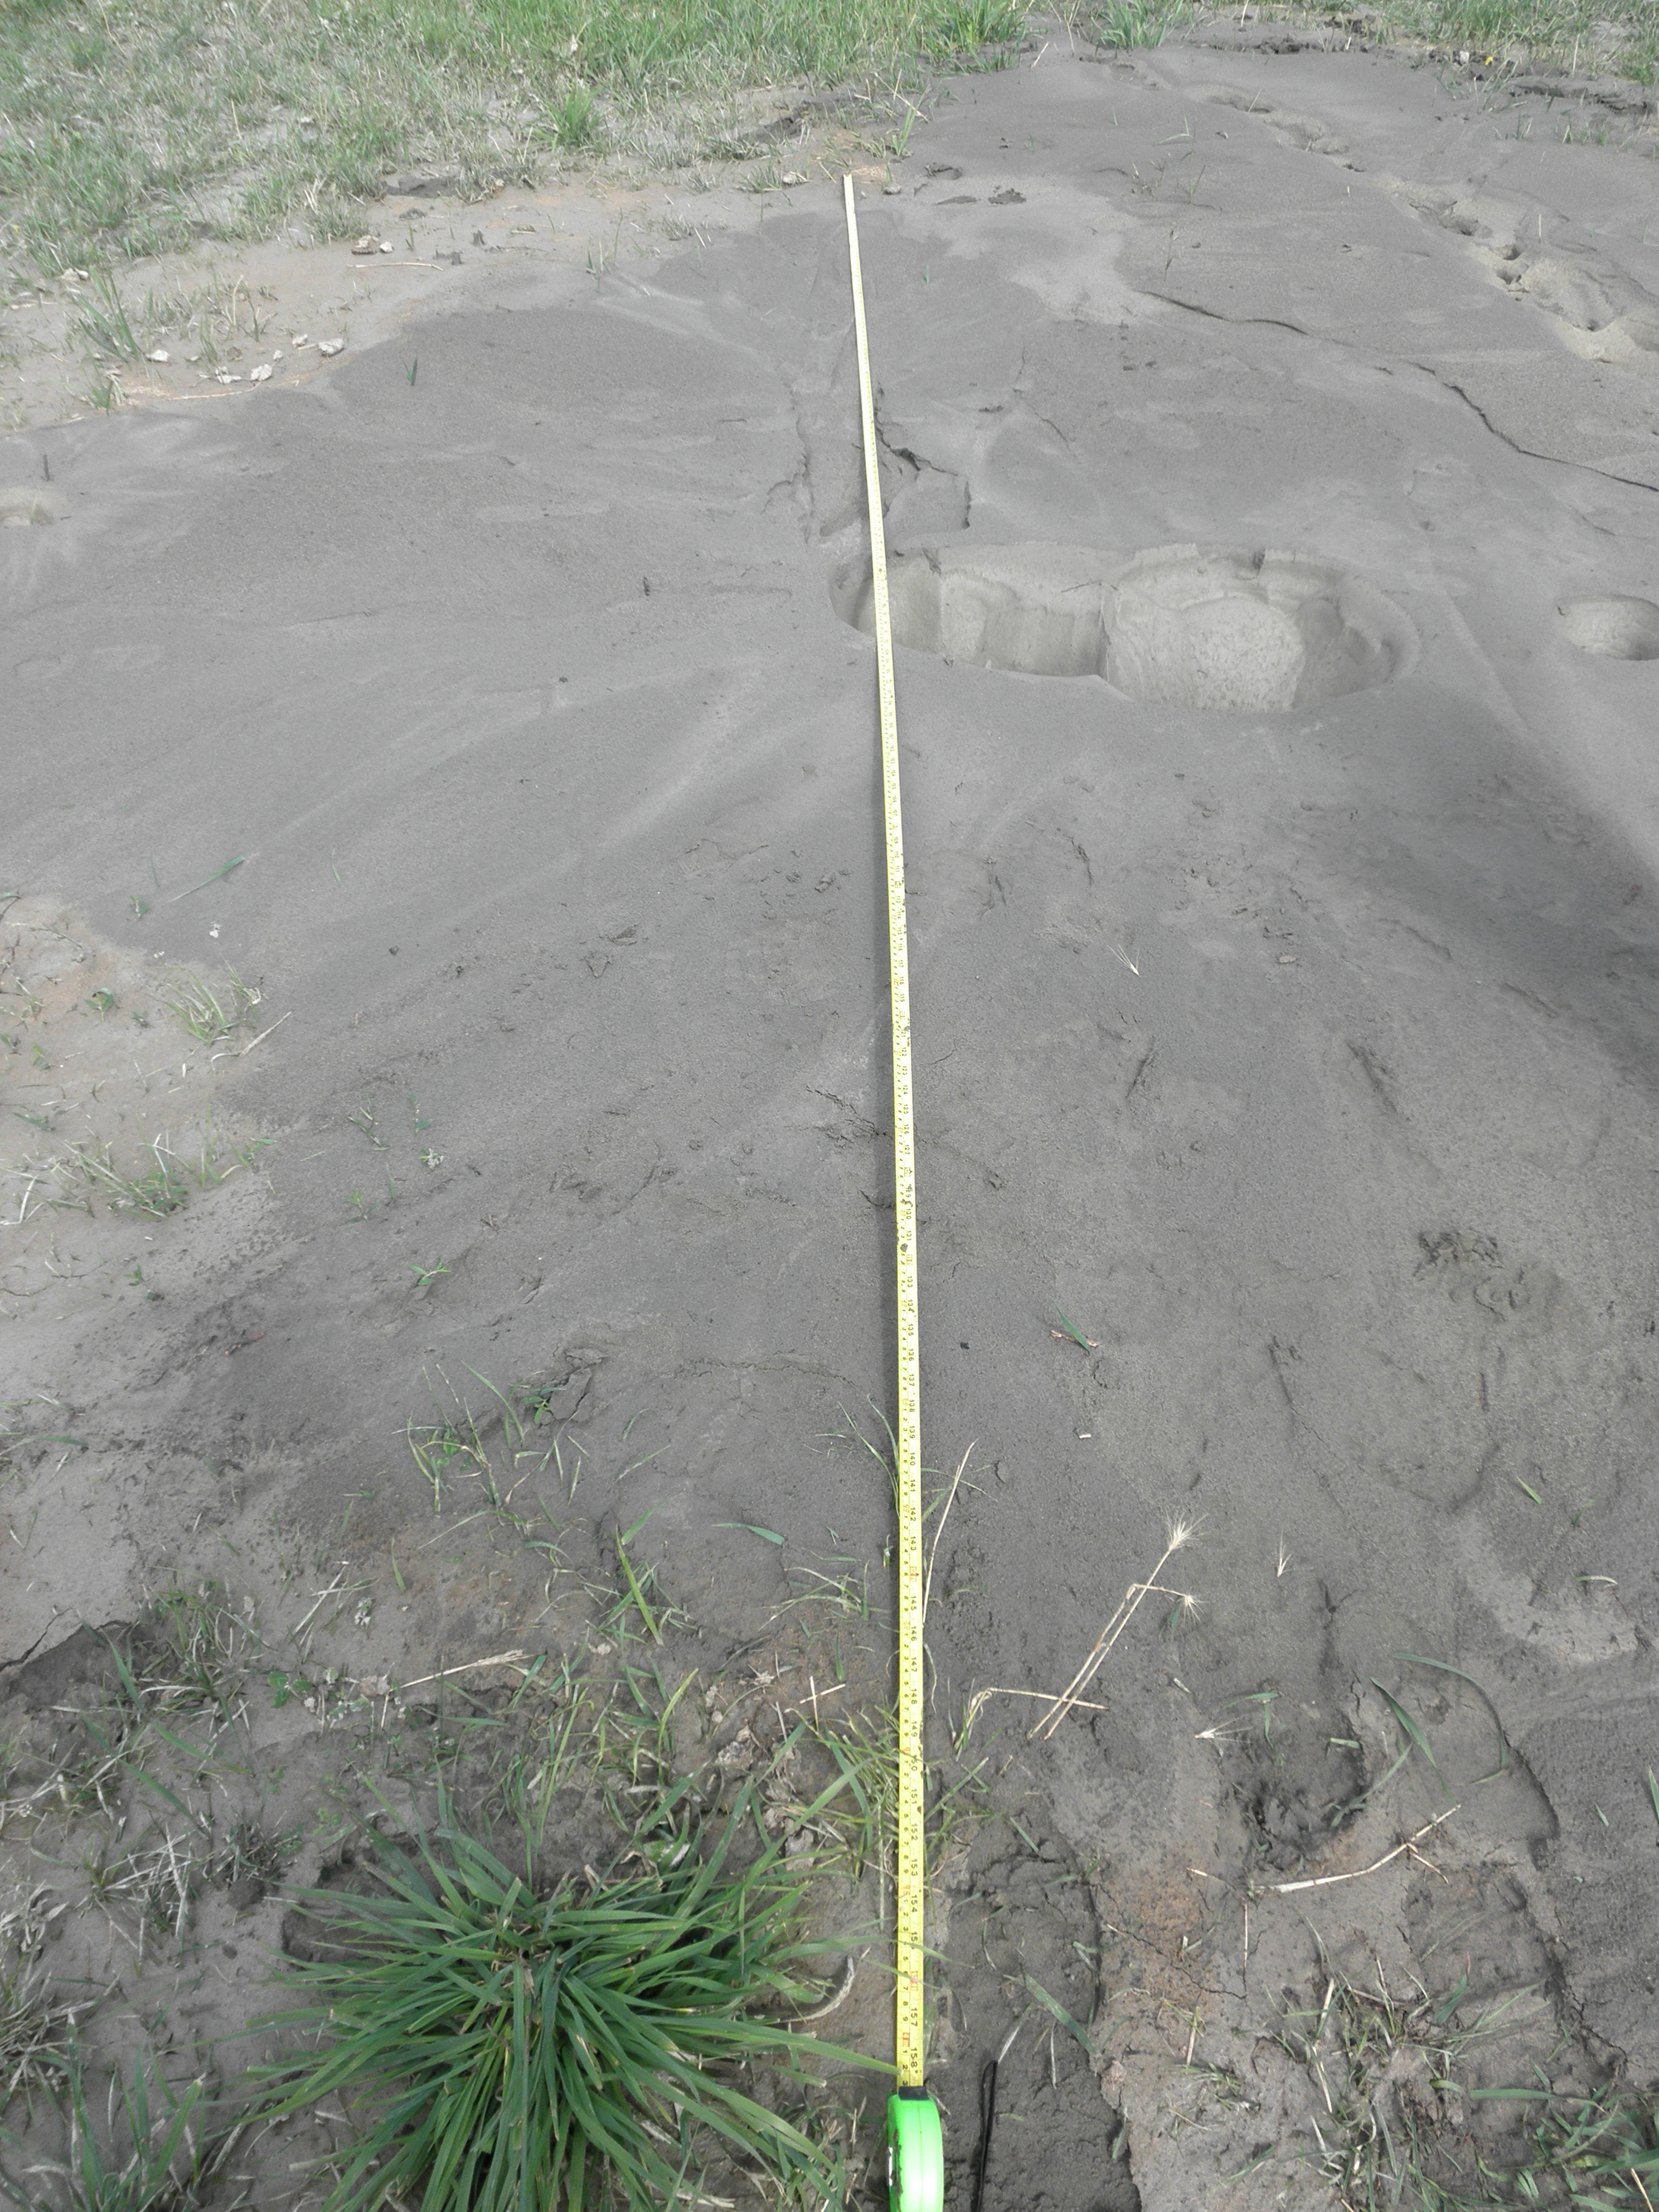
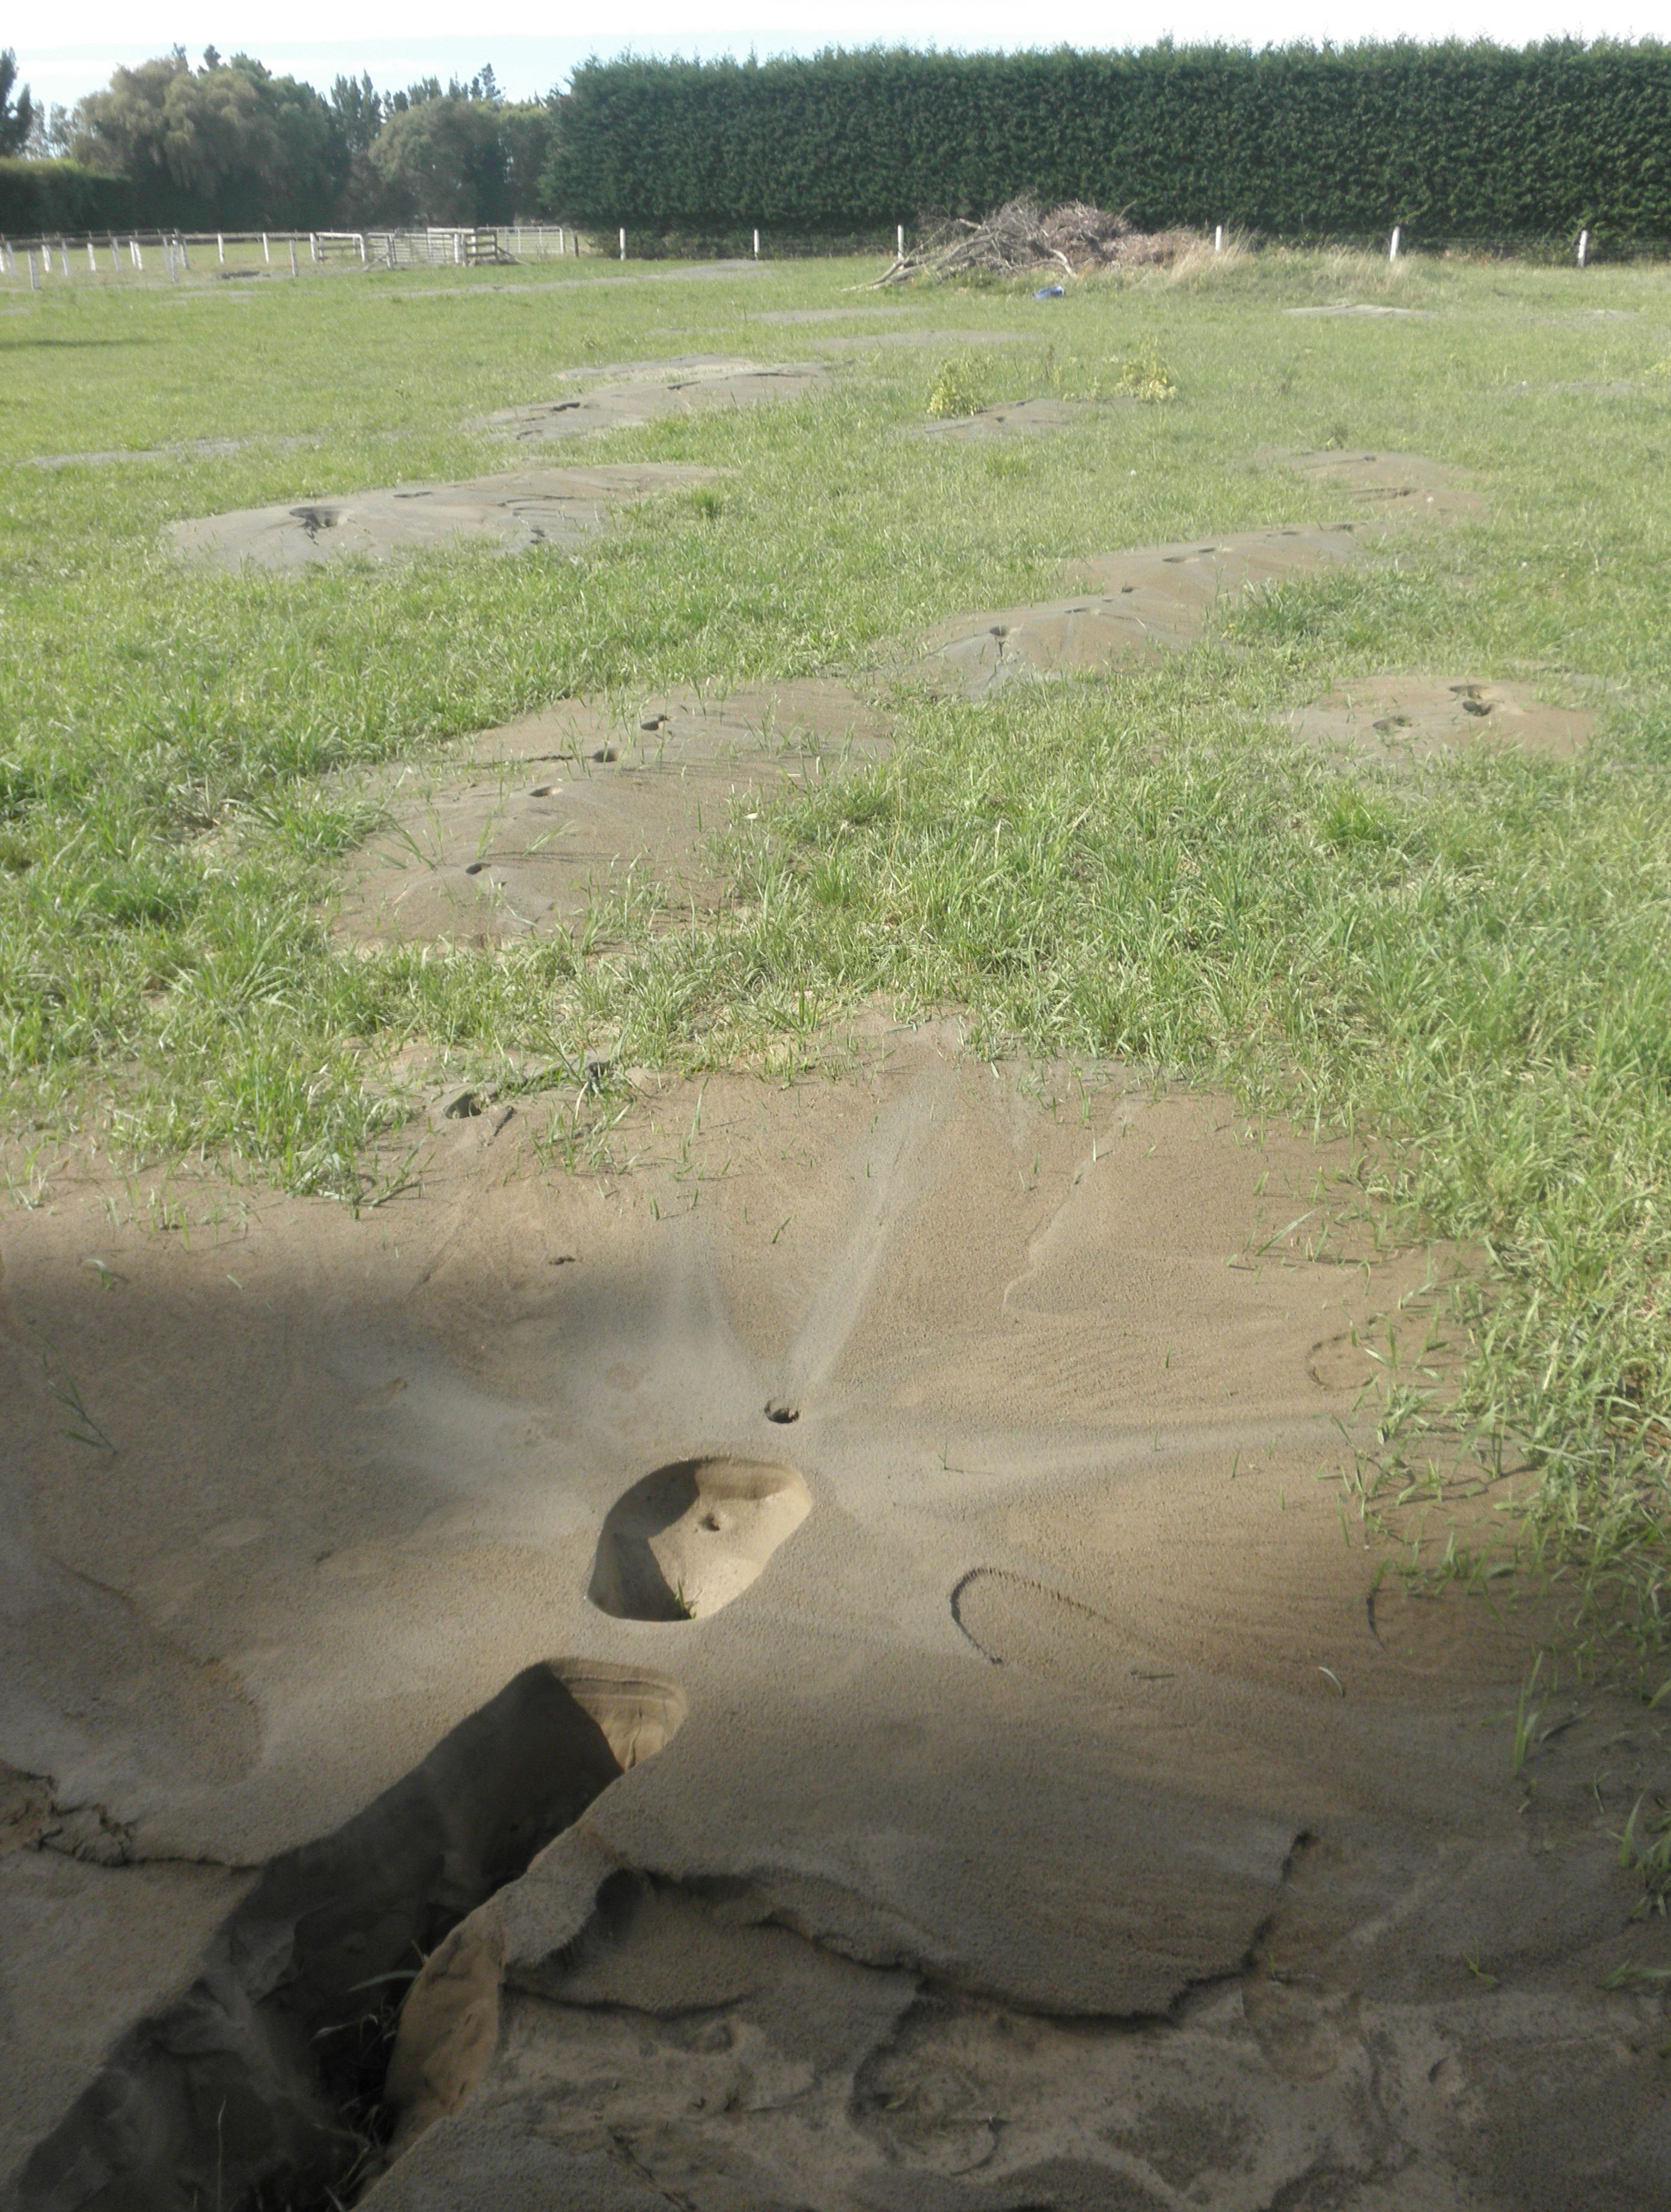
Figure S25. Sand–silt blow and an adjacent fissure that formed at the Hardwick site location L11 during the 22 February 2011 M 6.2 Christchurch earthquakes. The liquefaction features are composed of gray sand and silt. Note the channels cut from vents across the deposit and fines coating the surfaces of the vents. Sand–silt blow in the foreground is about 4 m across, and its fissure is about 4.6 m deep. The measuring tape provides scale. Photograph by C. Hardwick and R. Hardwick.
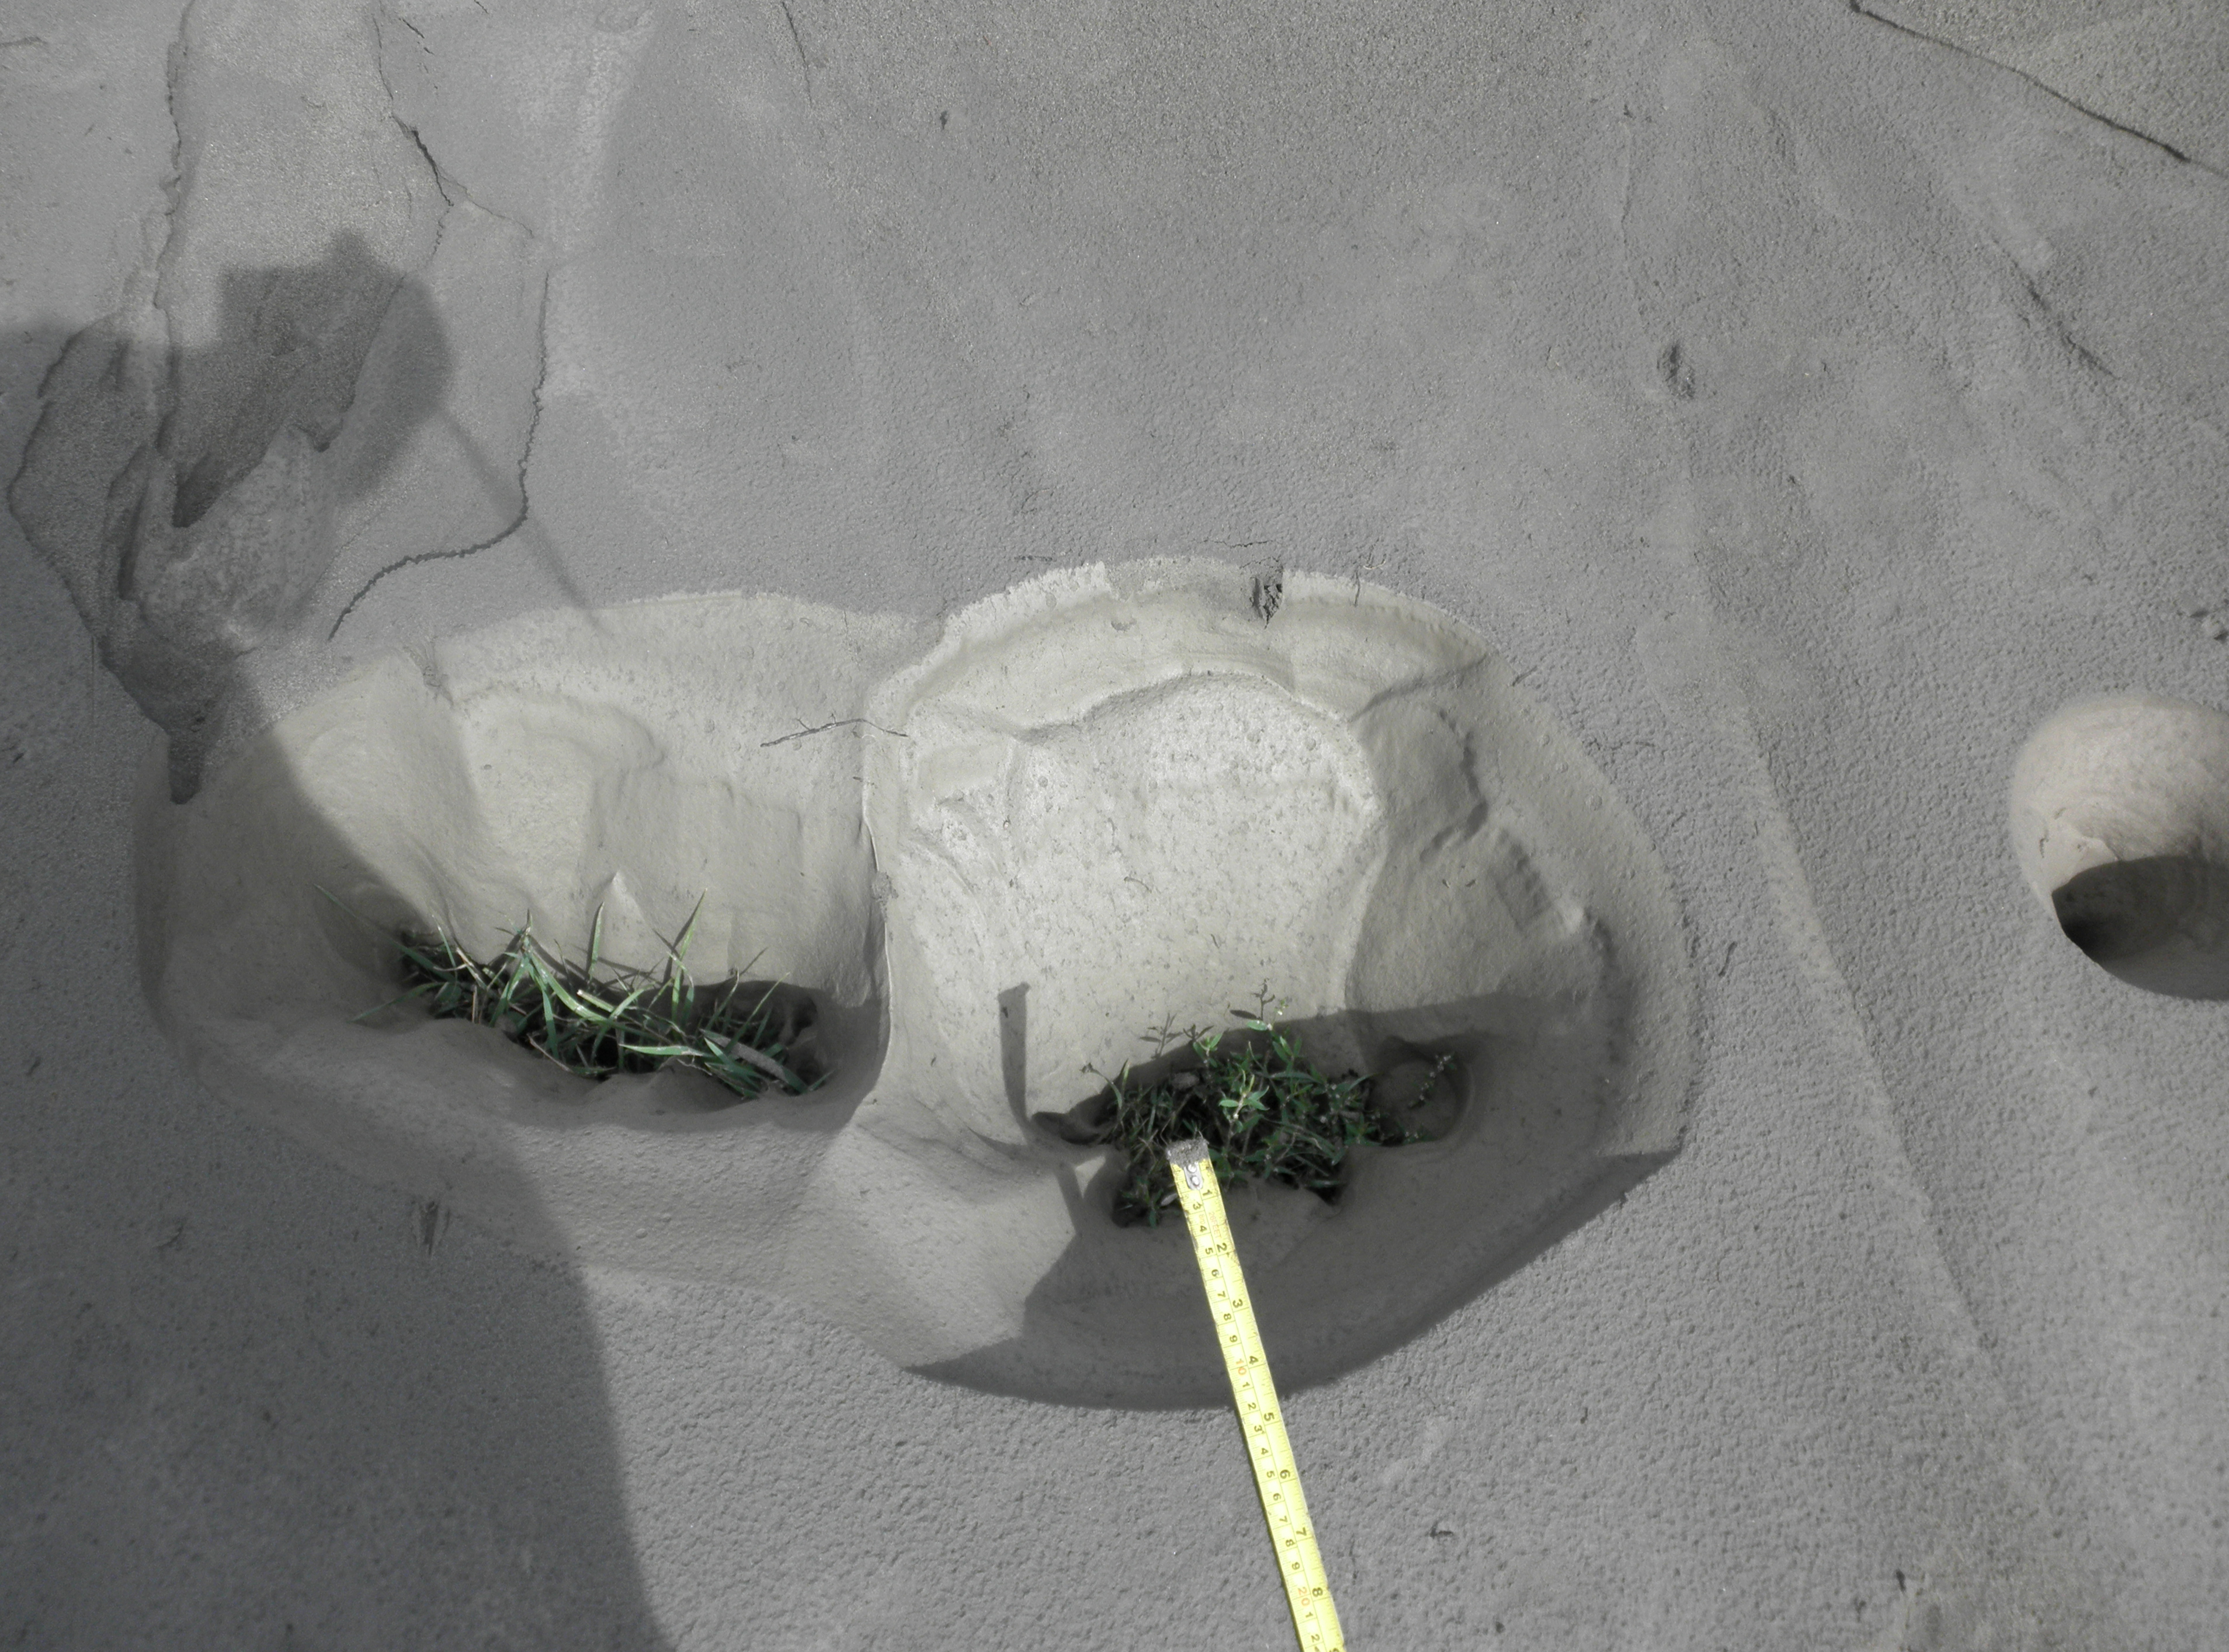
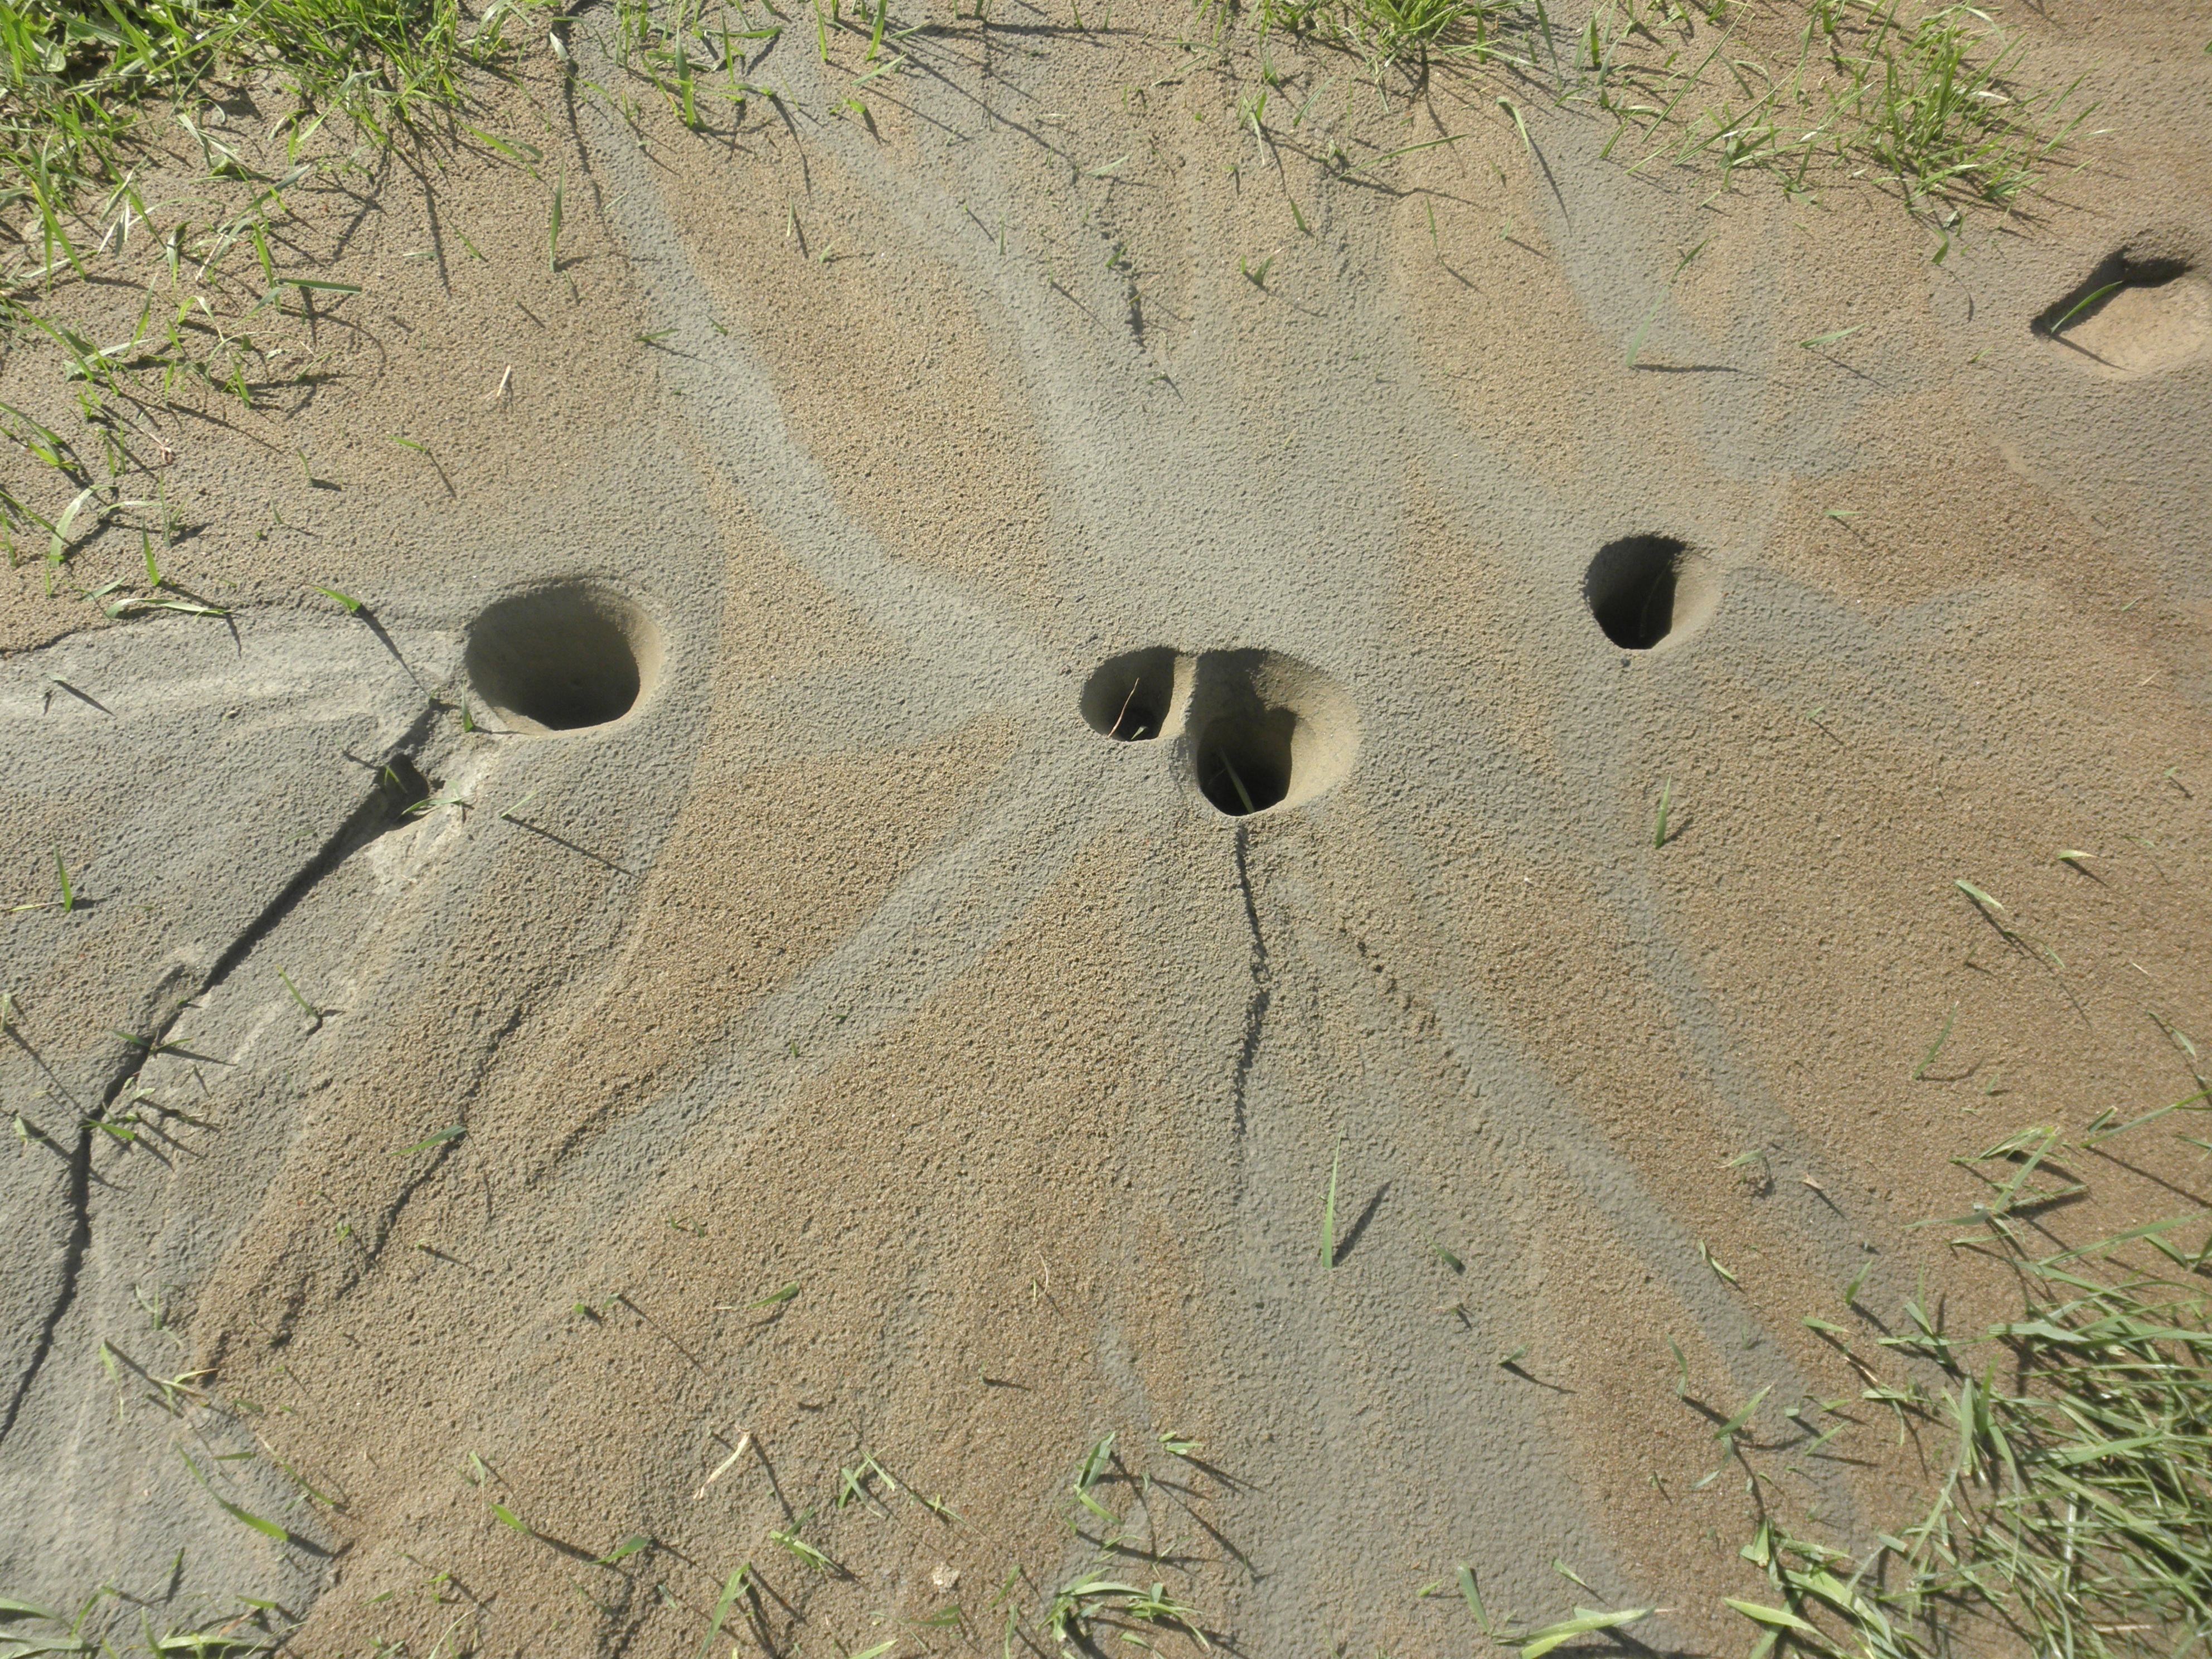
Figure S26. Closeup of vents of a sand–silt blow shown in Figure S25. Note the channels cut from vents across the deposit and fines coating the surfaces of the vents. A measuring tape provides scale. Photograph by C. Hardwick and R. Hardwick.
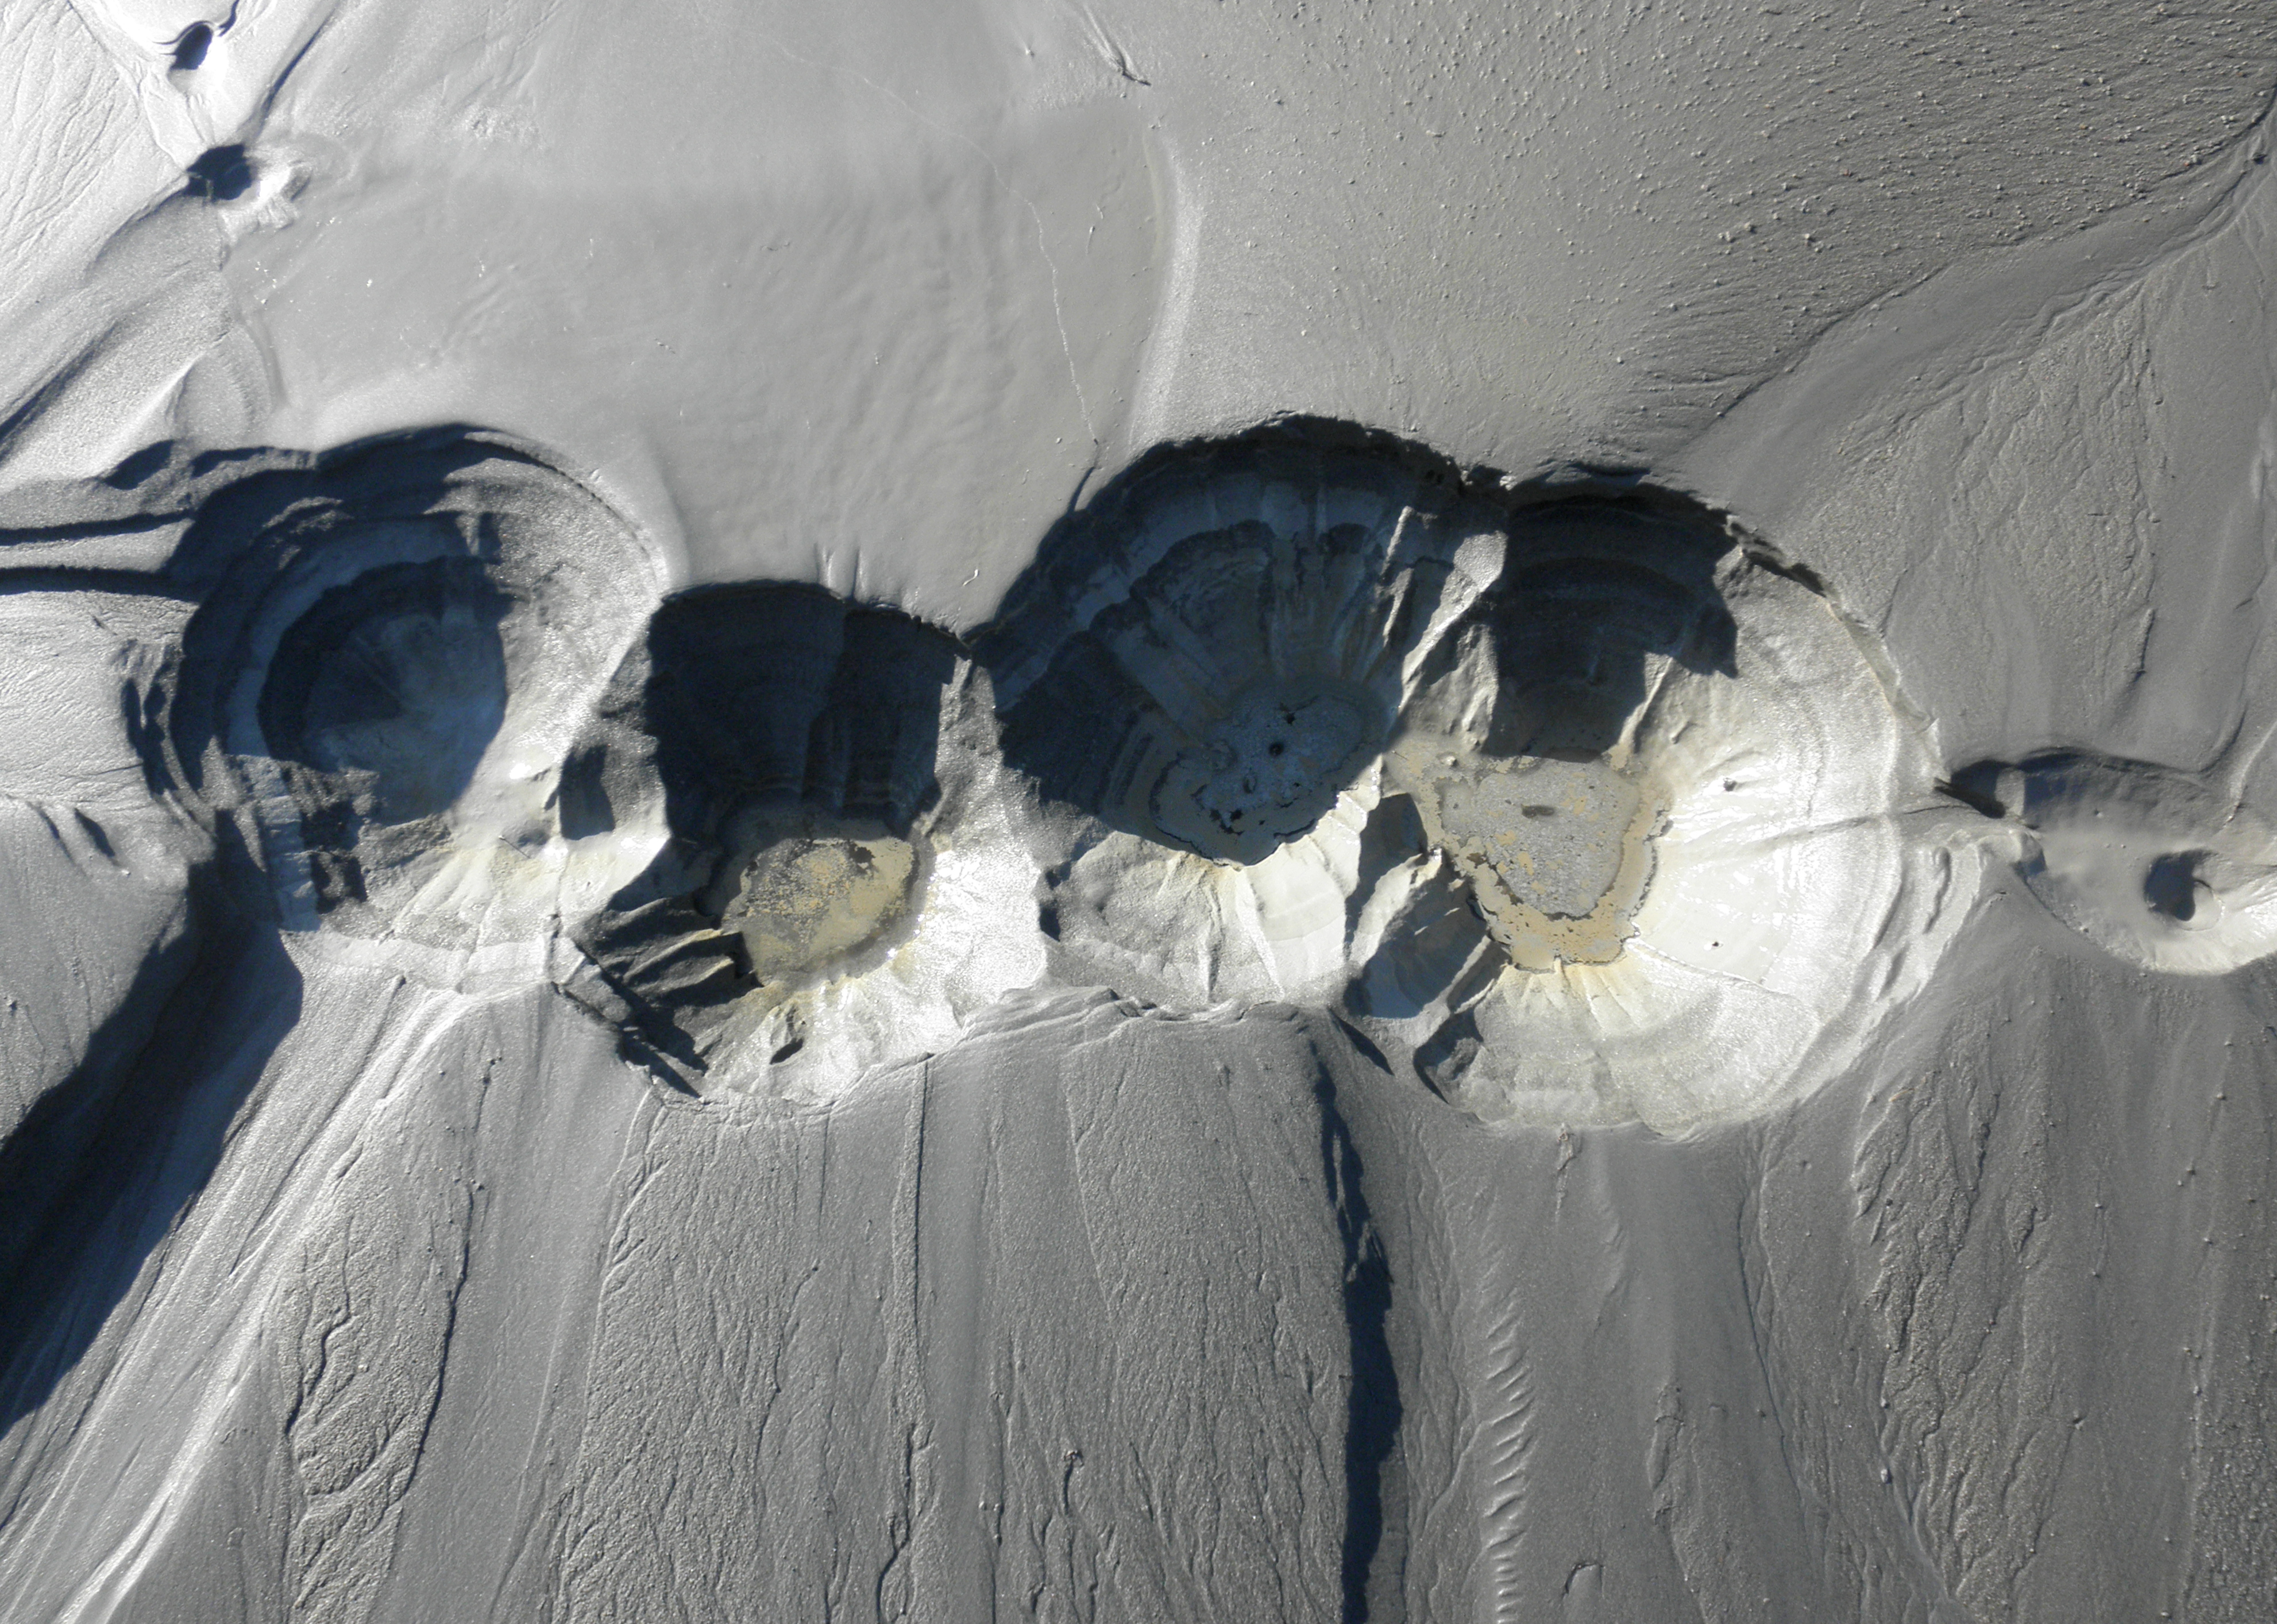
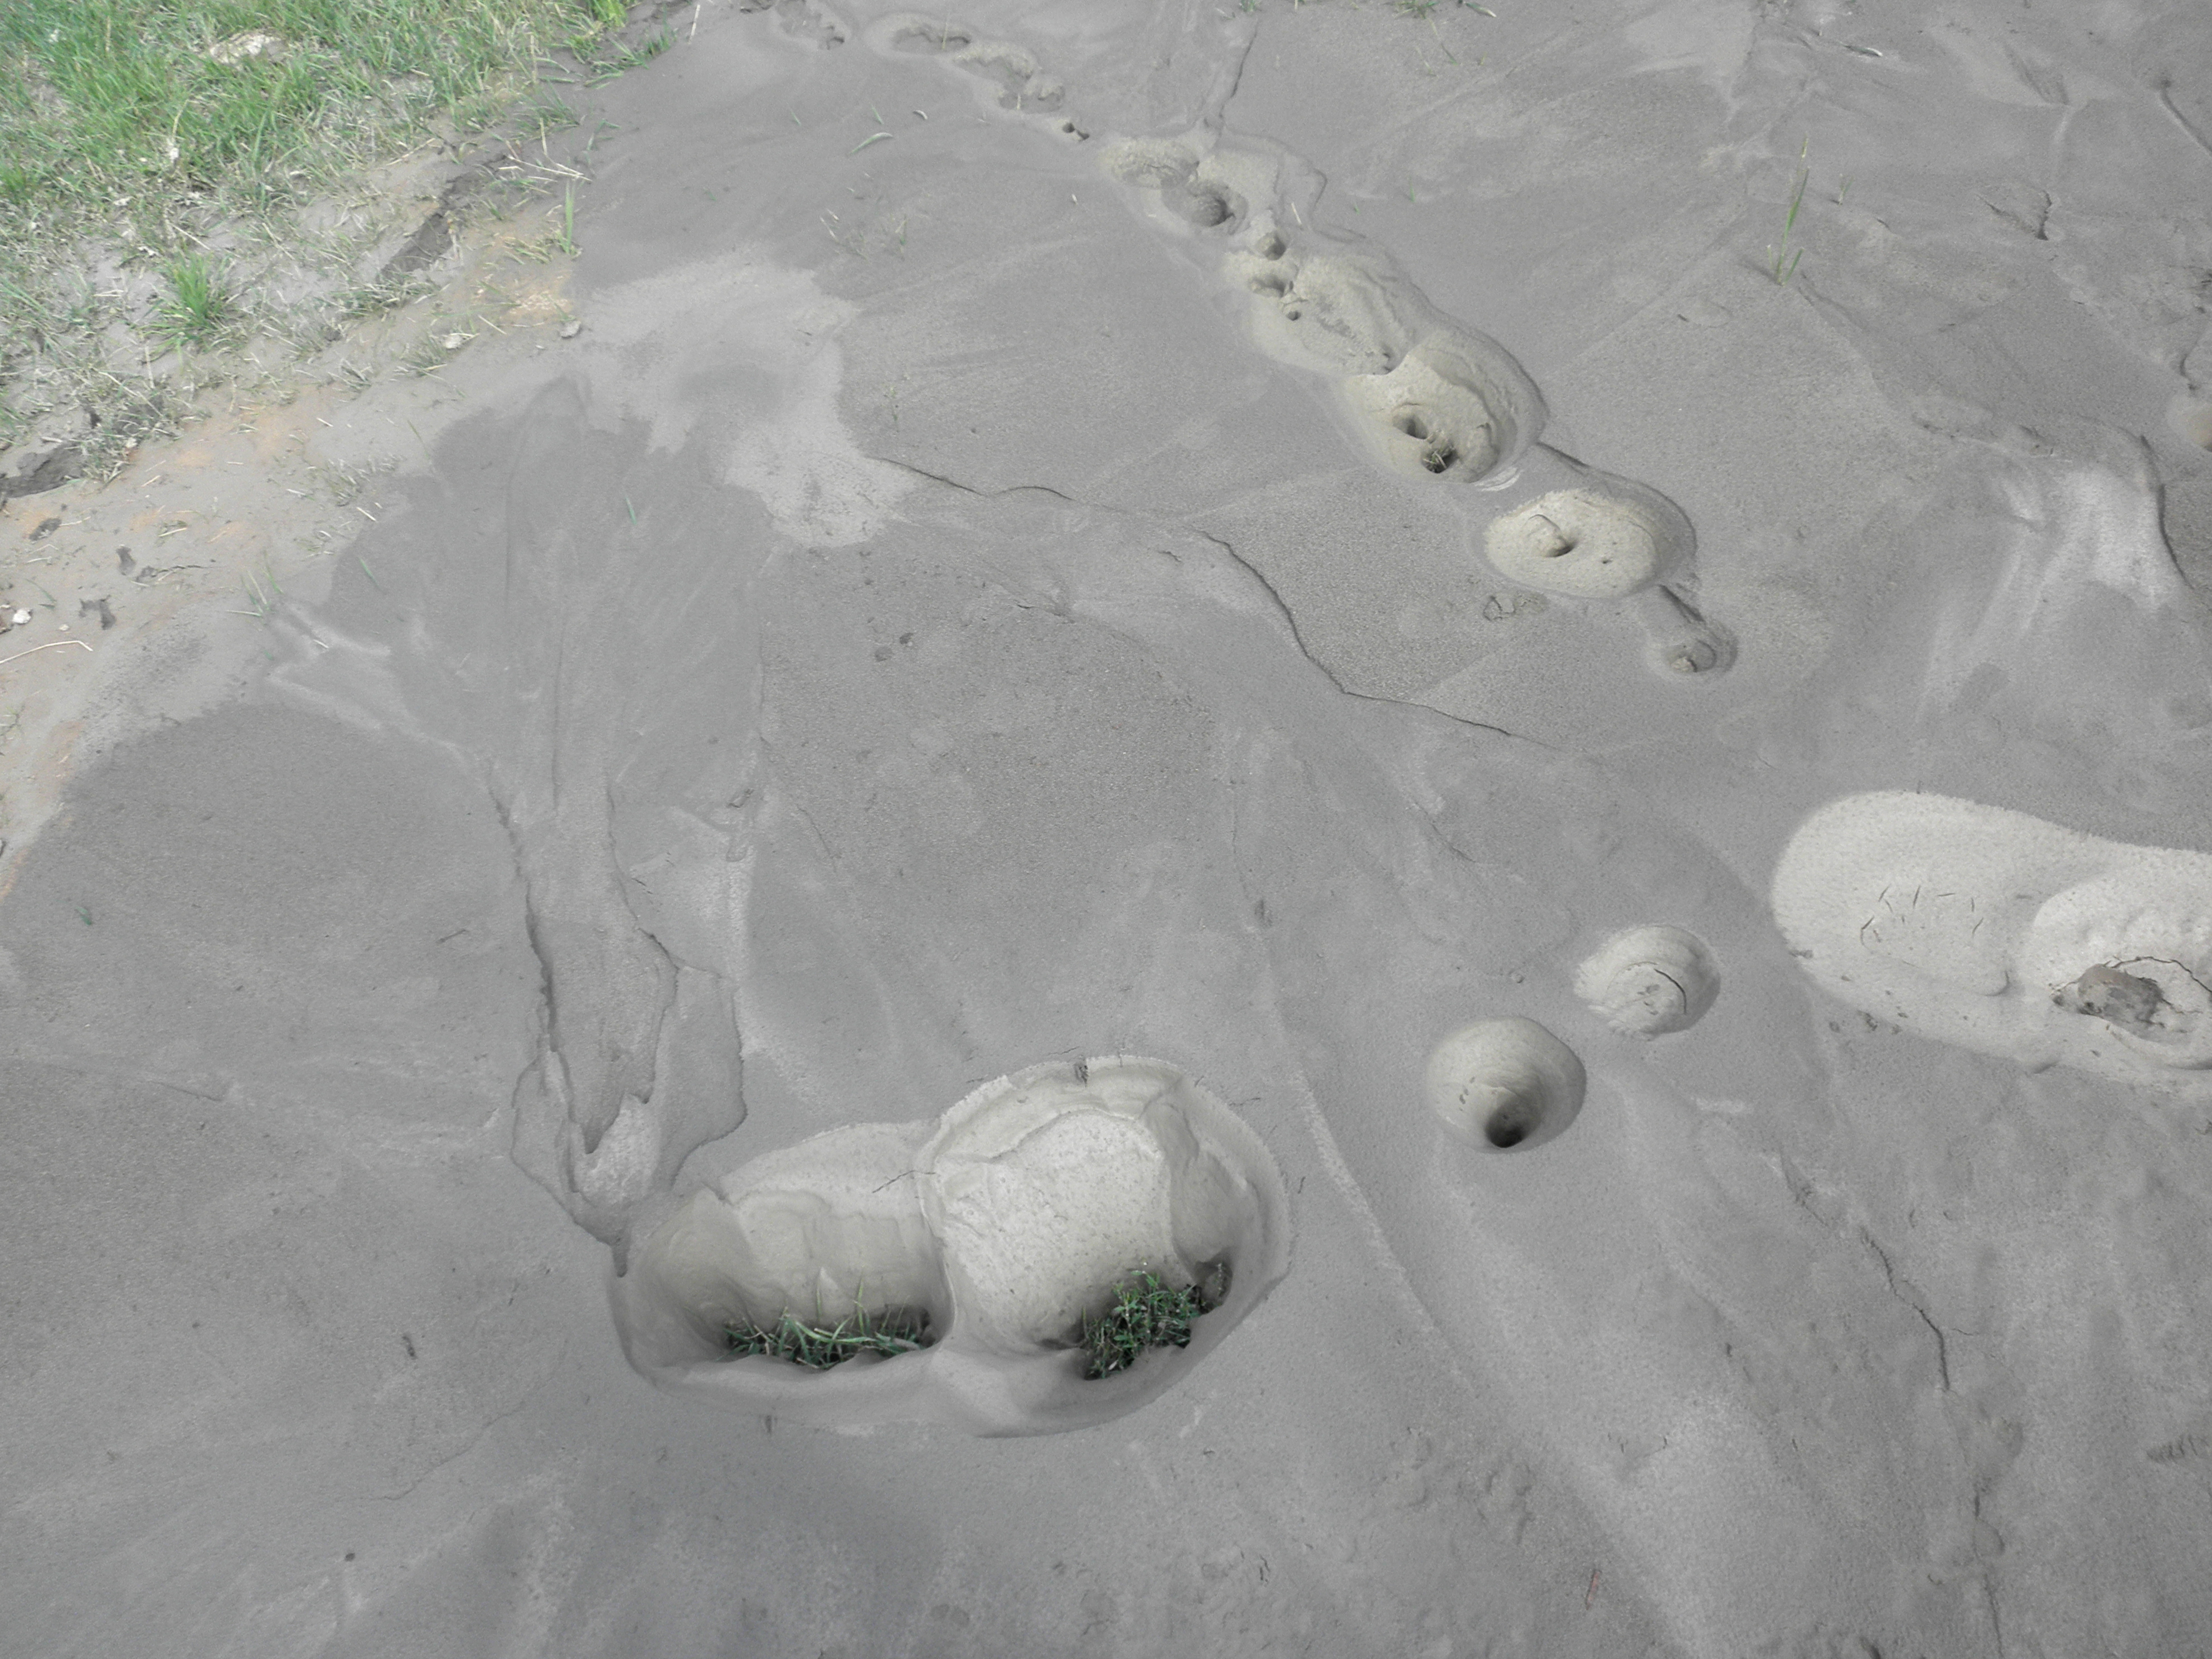
Figure S27. Another view of the sand–silt blow and adjacent fissure shown in Figure S25 that formed at the Hardwick site location L11 during the 22 February 2011 M 6.2 Christchurch mainshock and aftershocks. The vented deposits have coalesced, making this an example of a composite feature. Grass provides a sense of scale. Photograph by C. Hardwick and R. Hardwick.
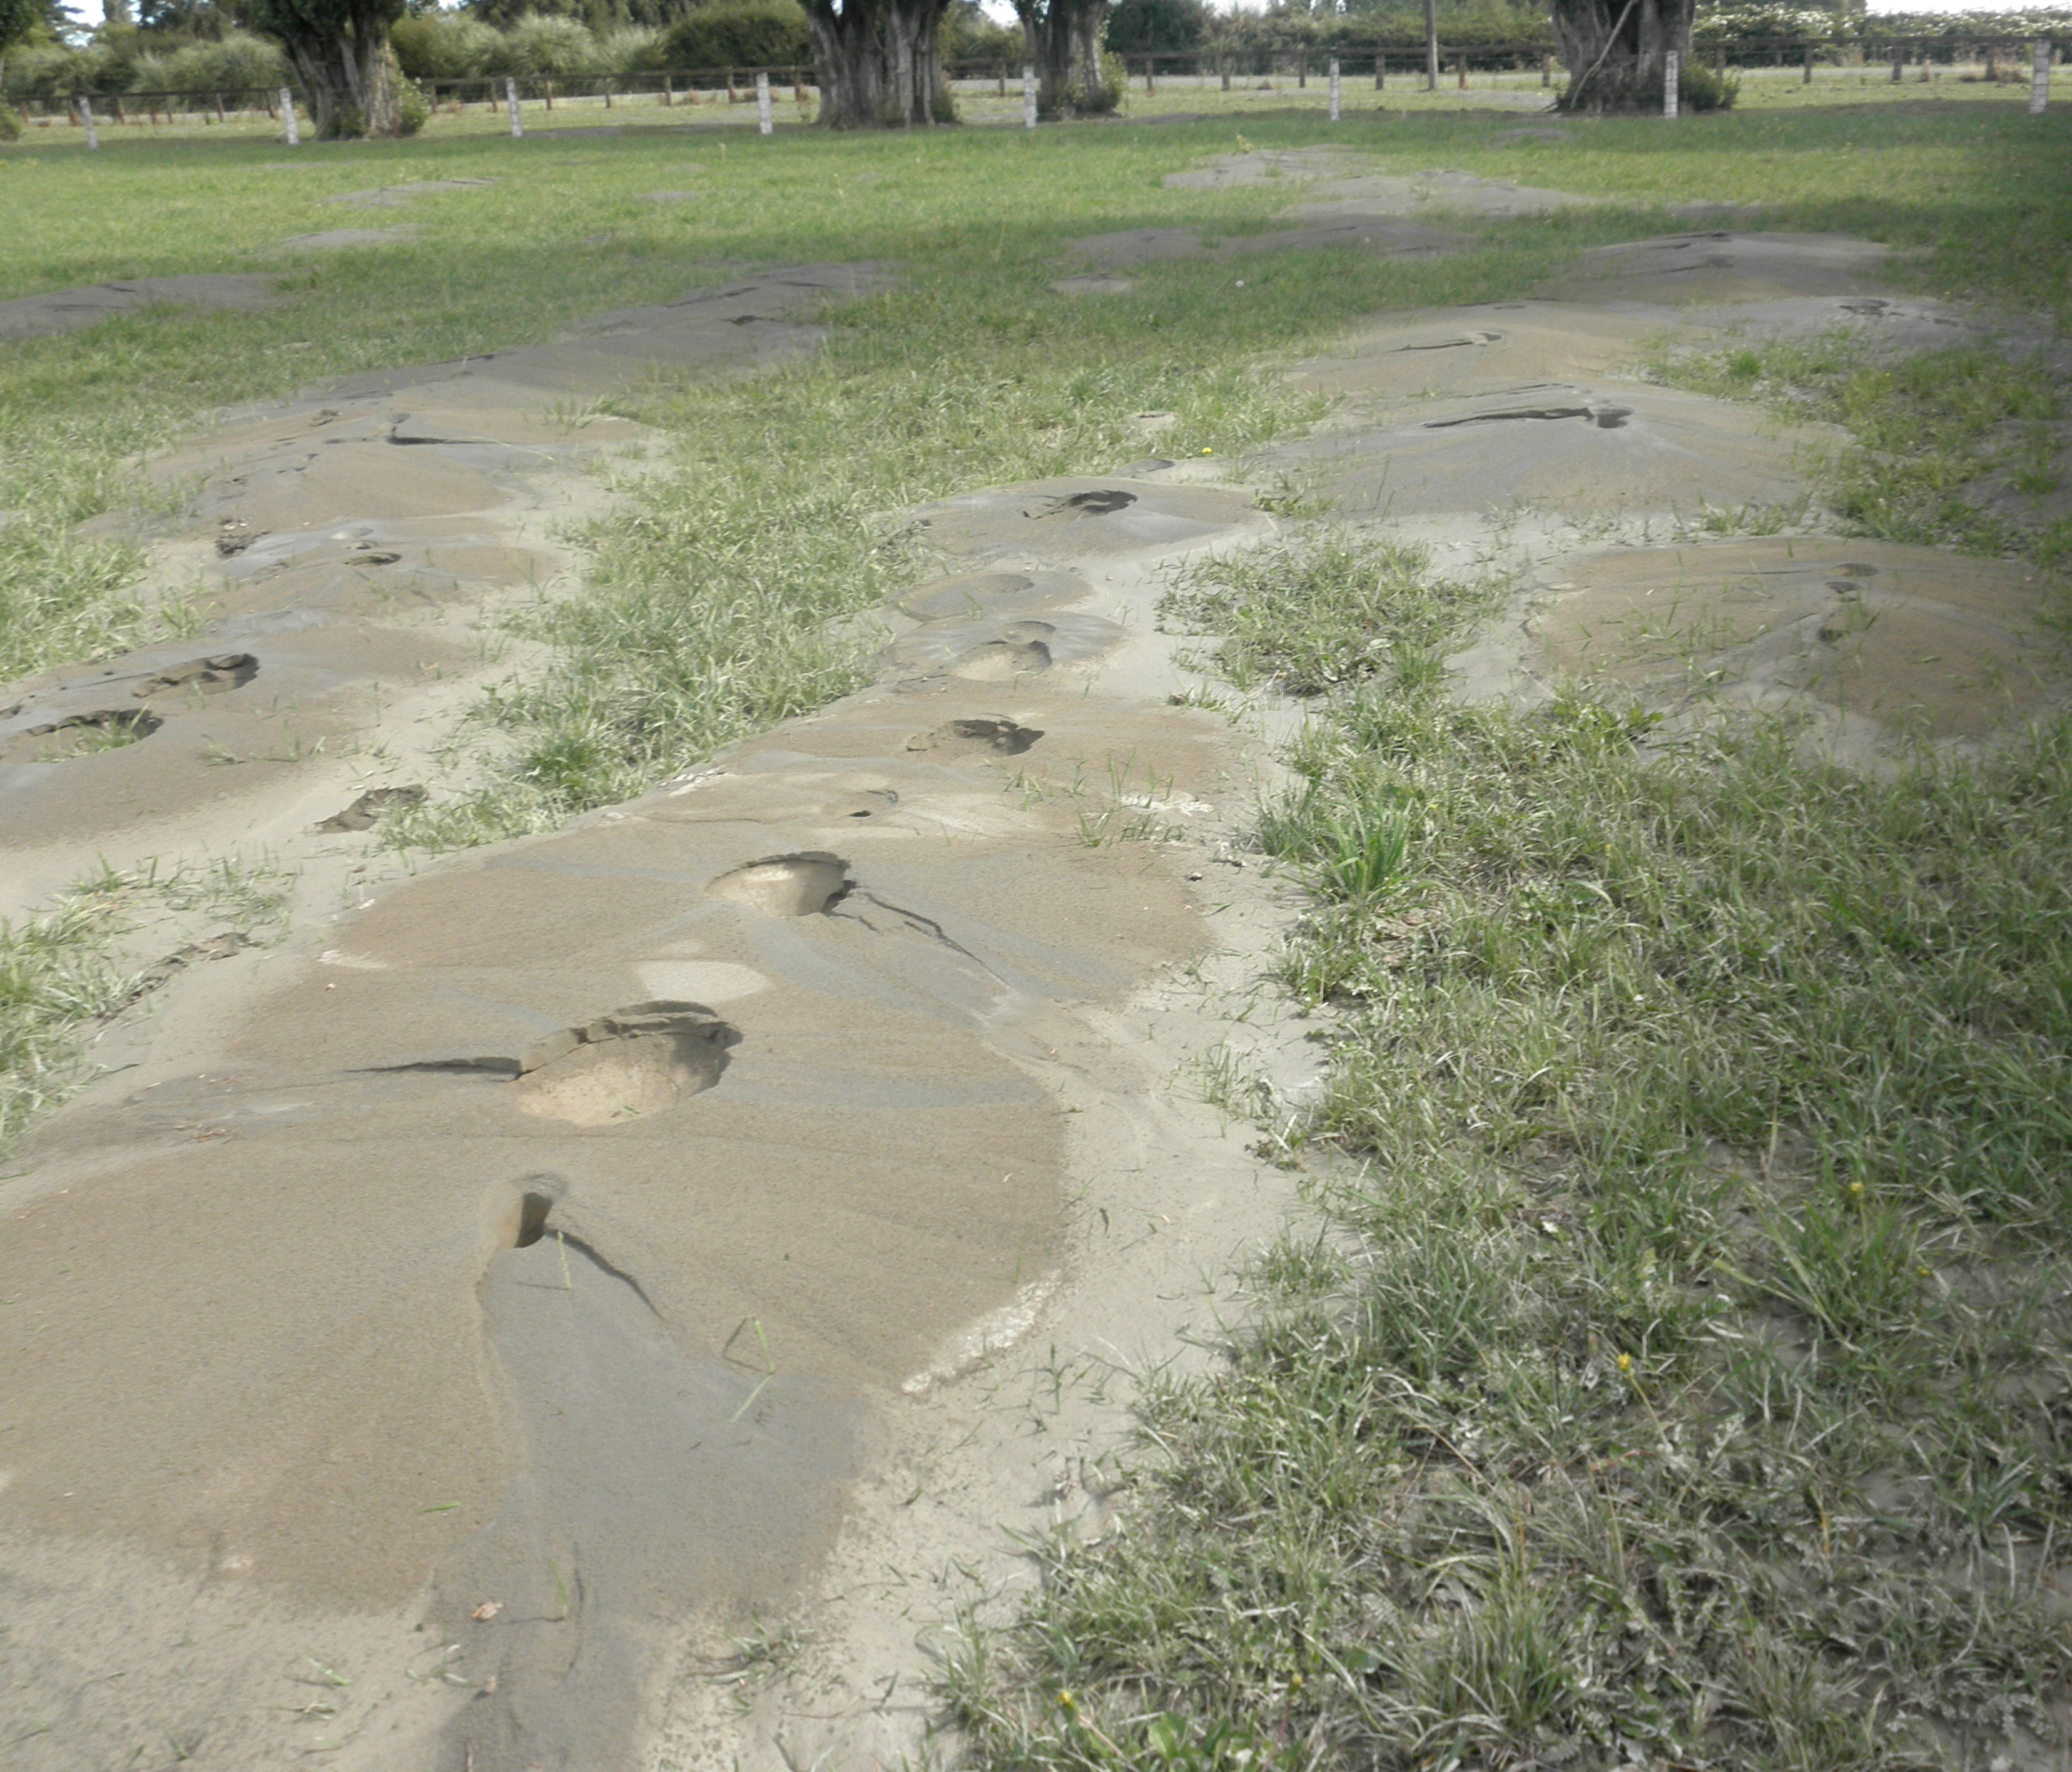
Figure S28. Sand–silt blows and fissures that formed at the Hardwick site location L12 during the 22 February 2011 M 6.2 Christchurch mainshock and aftershocks. The vented deposits are composed mostly of tan and gray sand with gray silt around the edges. Layering can be seen in some of the vents. Grass and fence posts at a distance provide a sense of scale. Photograph by C. Hardwick and R. Hardwick.
Figure S29. Sand–silt blows and fissures that formed at the Hardwick site location L13 during the 22 February 2011 M 6.2 Christchurch mainshock and aftershocks. The vented deposits are composed of tan and gray sand and some gray silt. Layering can be seen in some of the vents. Grass and fence posts at a distance provide a sense of scale. Photograph by C. Hardwick and R. Hardwick.
Figure S30. Sand–silt fissure that formed at the Hardwick site location L13 during the 22 February 2011 M 6.2 Christchurch mainshock and aftershocks. The vented deposits are composed of tan and gray sand and some gray silt. Grass provides a sense of scale. Photograph by C. Hardwick and R. Hardwick.
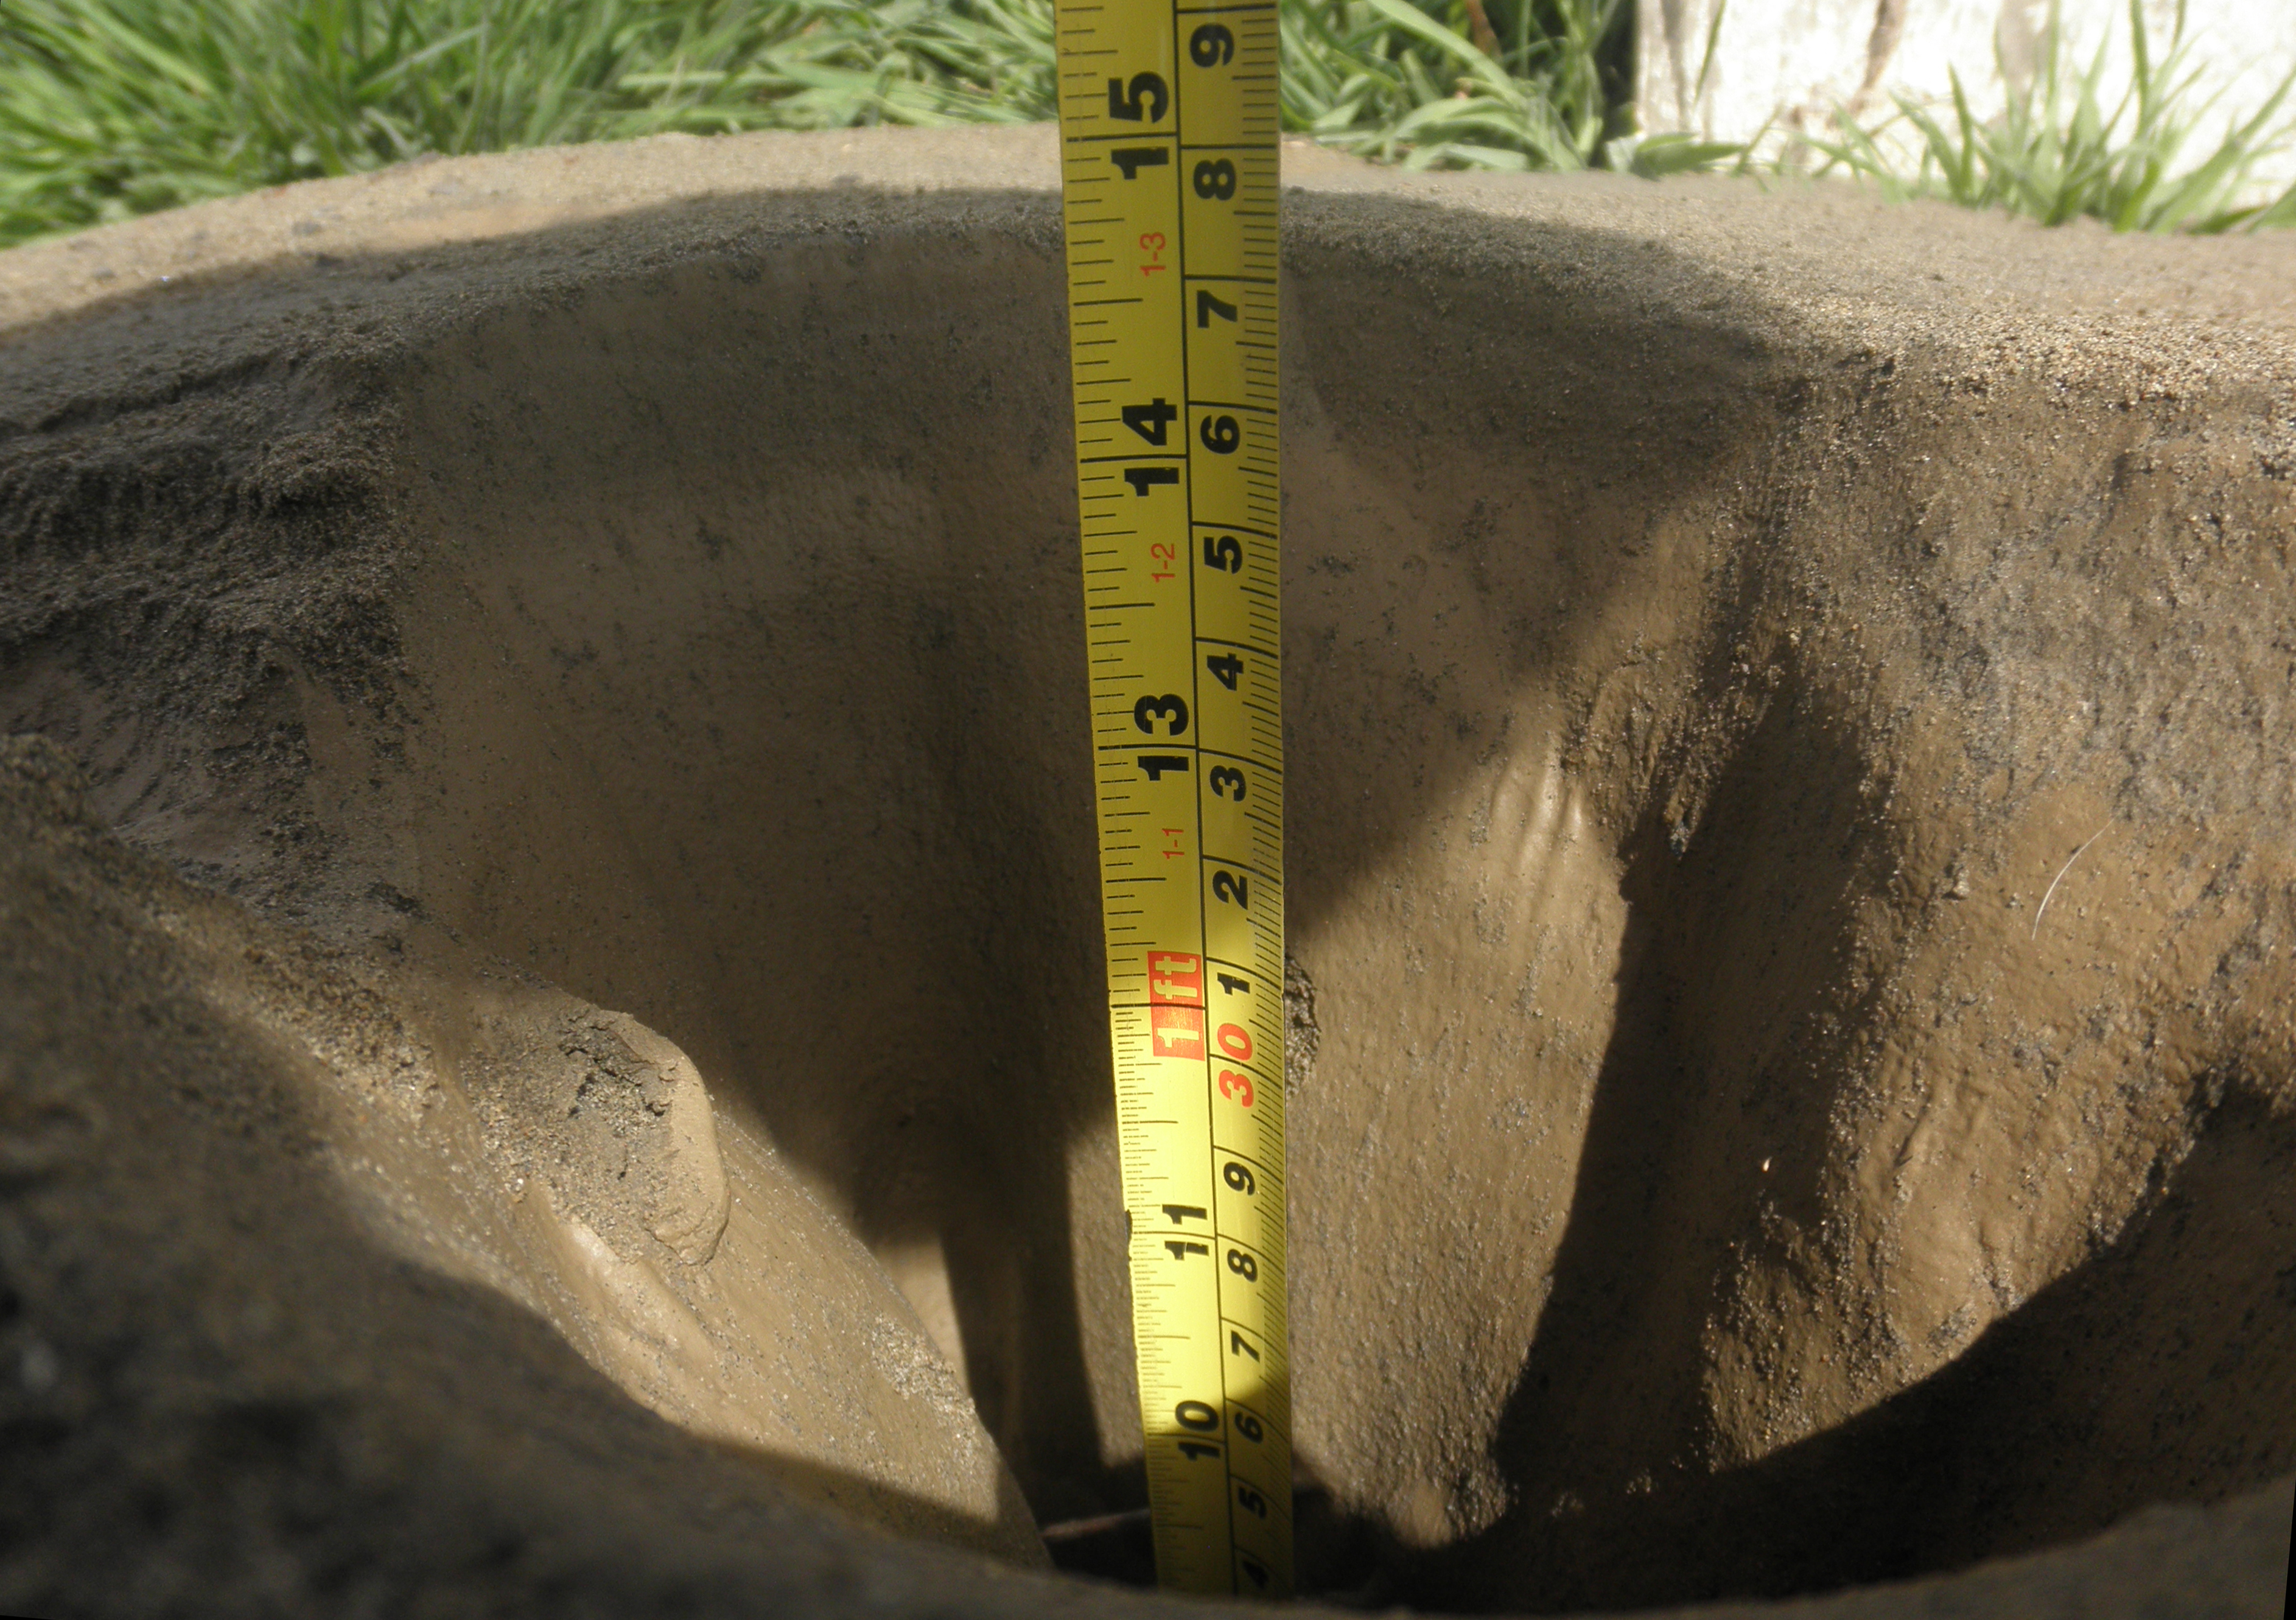
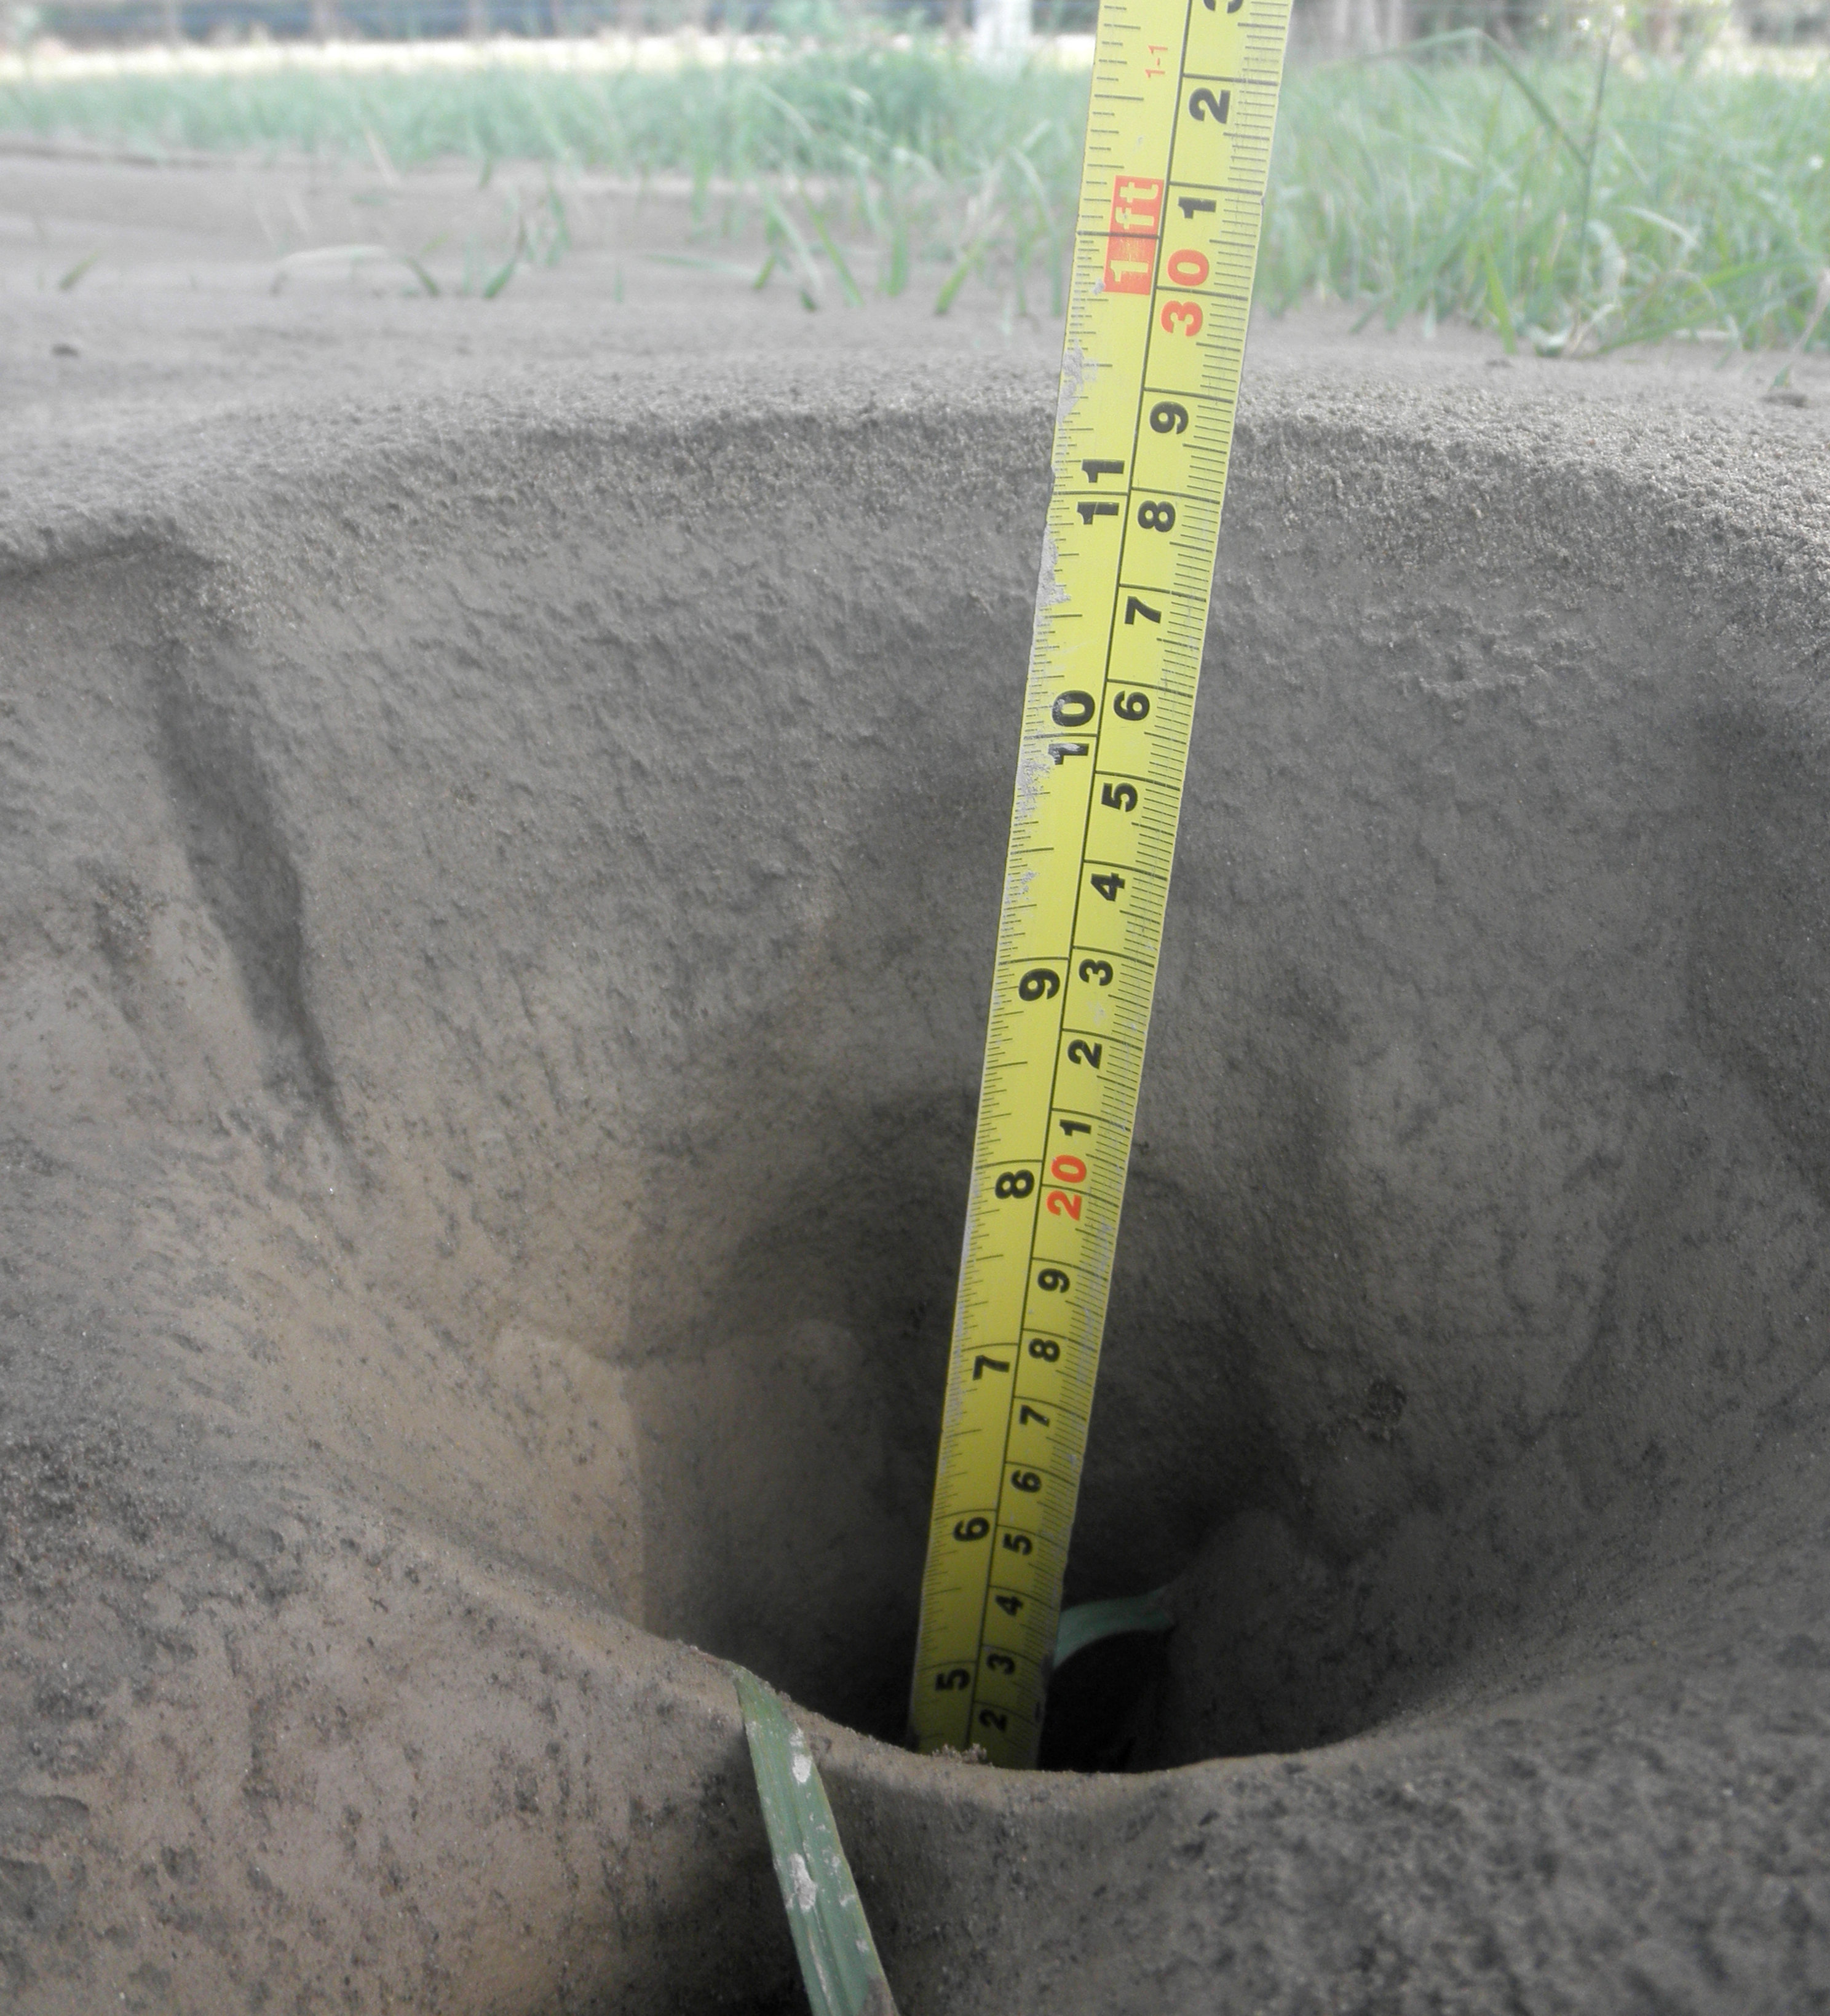
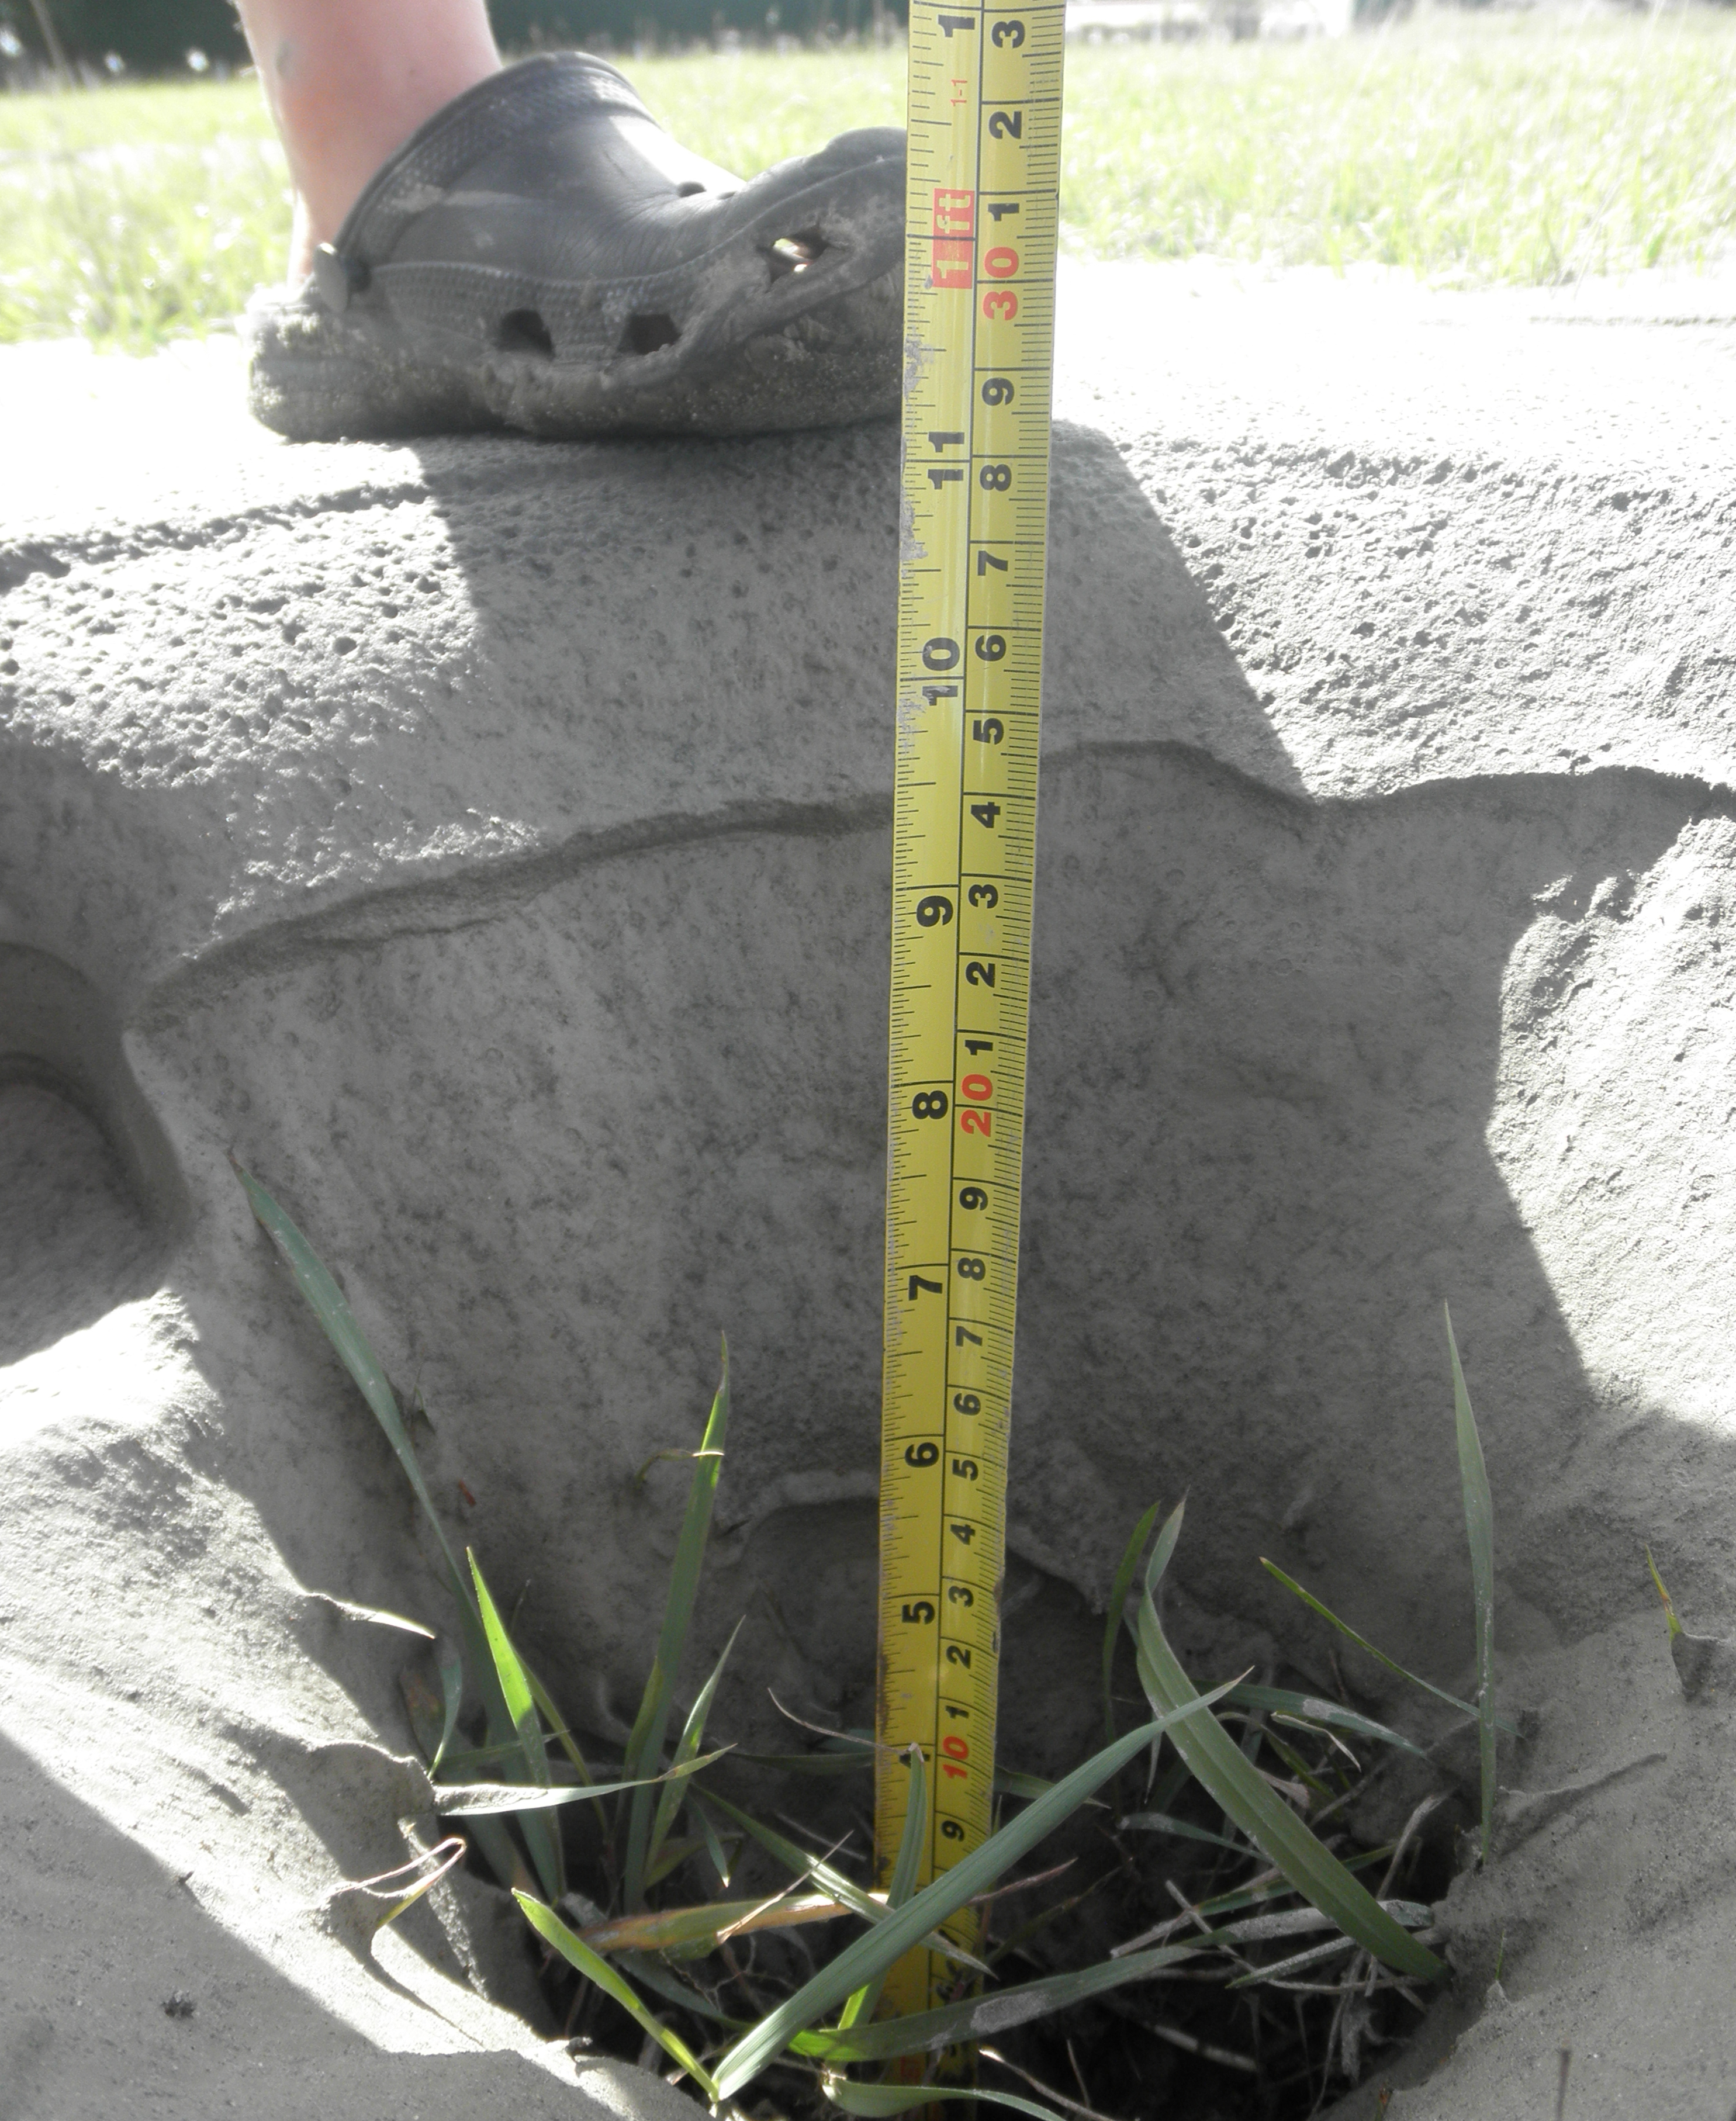
Figure S31. Vent of sand–silt blow that formed at the Hardwick site location L13 during the 22 February 2011 M 6.2 Christchurch mainshock and aftershocks. Thickness of this particular sand fissure is ~28–29 cm. A measuring tape provides scale. Photograph by C. Hardwick and R. Hardwick.
Figure S32. Compound sand–silt fissure that formed at the Hardwick site location L14 during the 4 September 2010 M 7.1 Darfield and the 22 February 2011 M 6.2 Christchurch earthquakes. The older deposit can be seen beyond the silty edge of the younger deposit. Grass can be seen growing on the surface of the older sand fissure. Plants provide a sense of scale. Photograph by C. Hardwick and R. Hardwick.
Figure S33. Sand–silt blows and fissure that formed at the Hardwick site location L15 during the 22 February 2011 M 6.2 Christchurch mainshock and aftershocks. Plants and fences posts provide a sense of scale. Photograph by C. Hardwick and R. Hardwick.
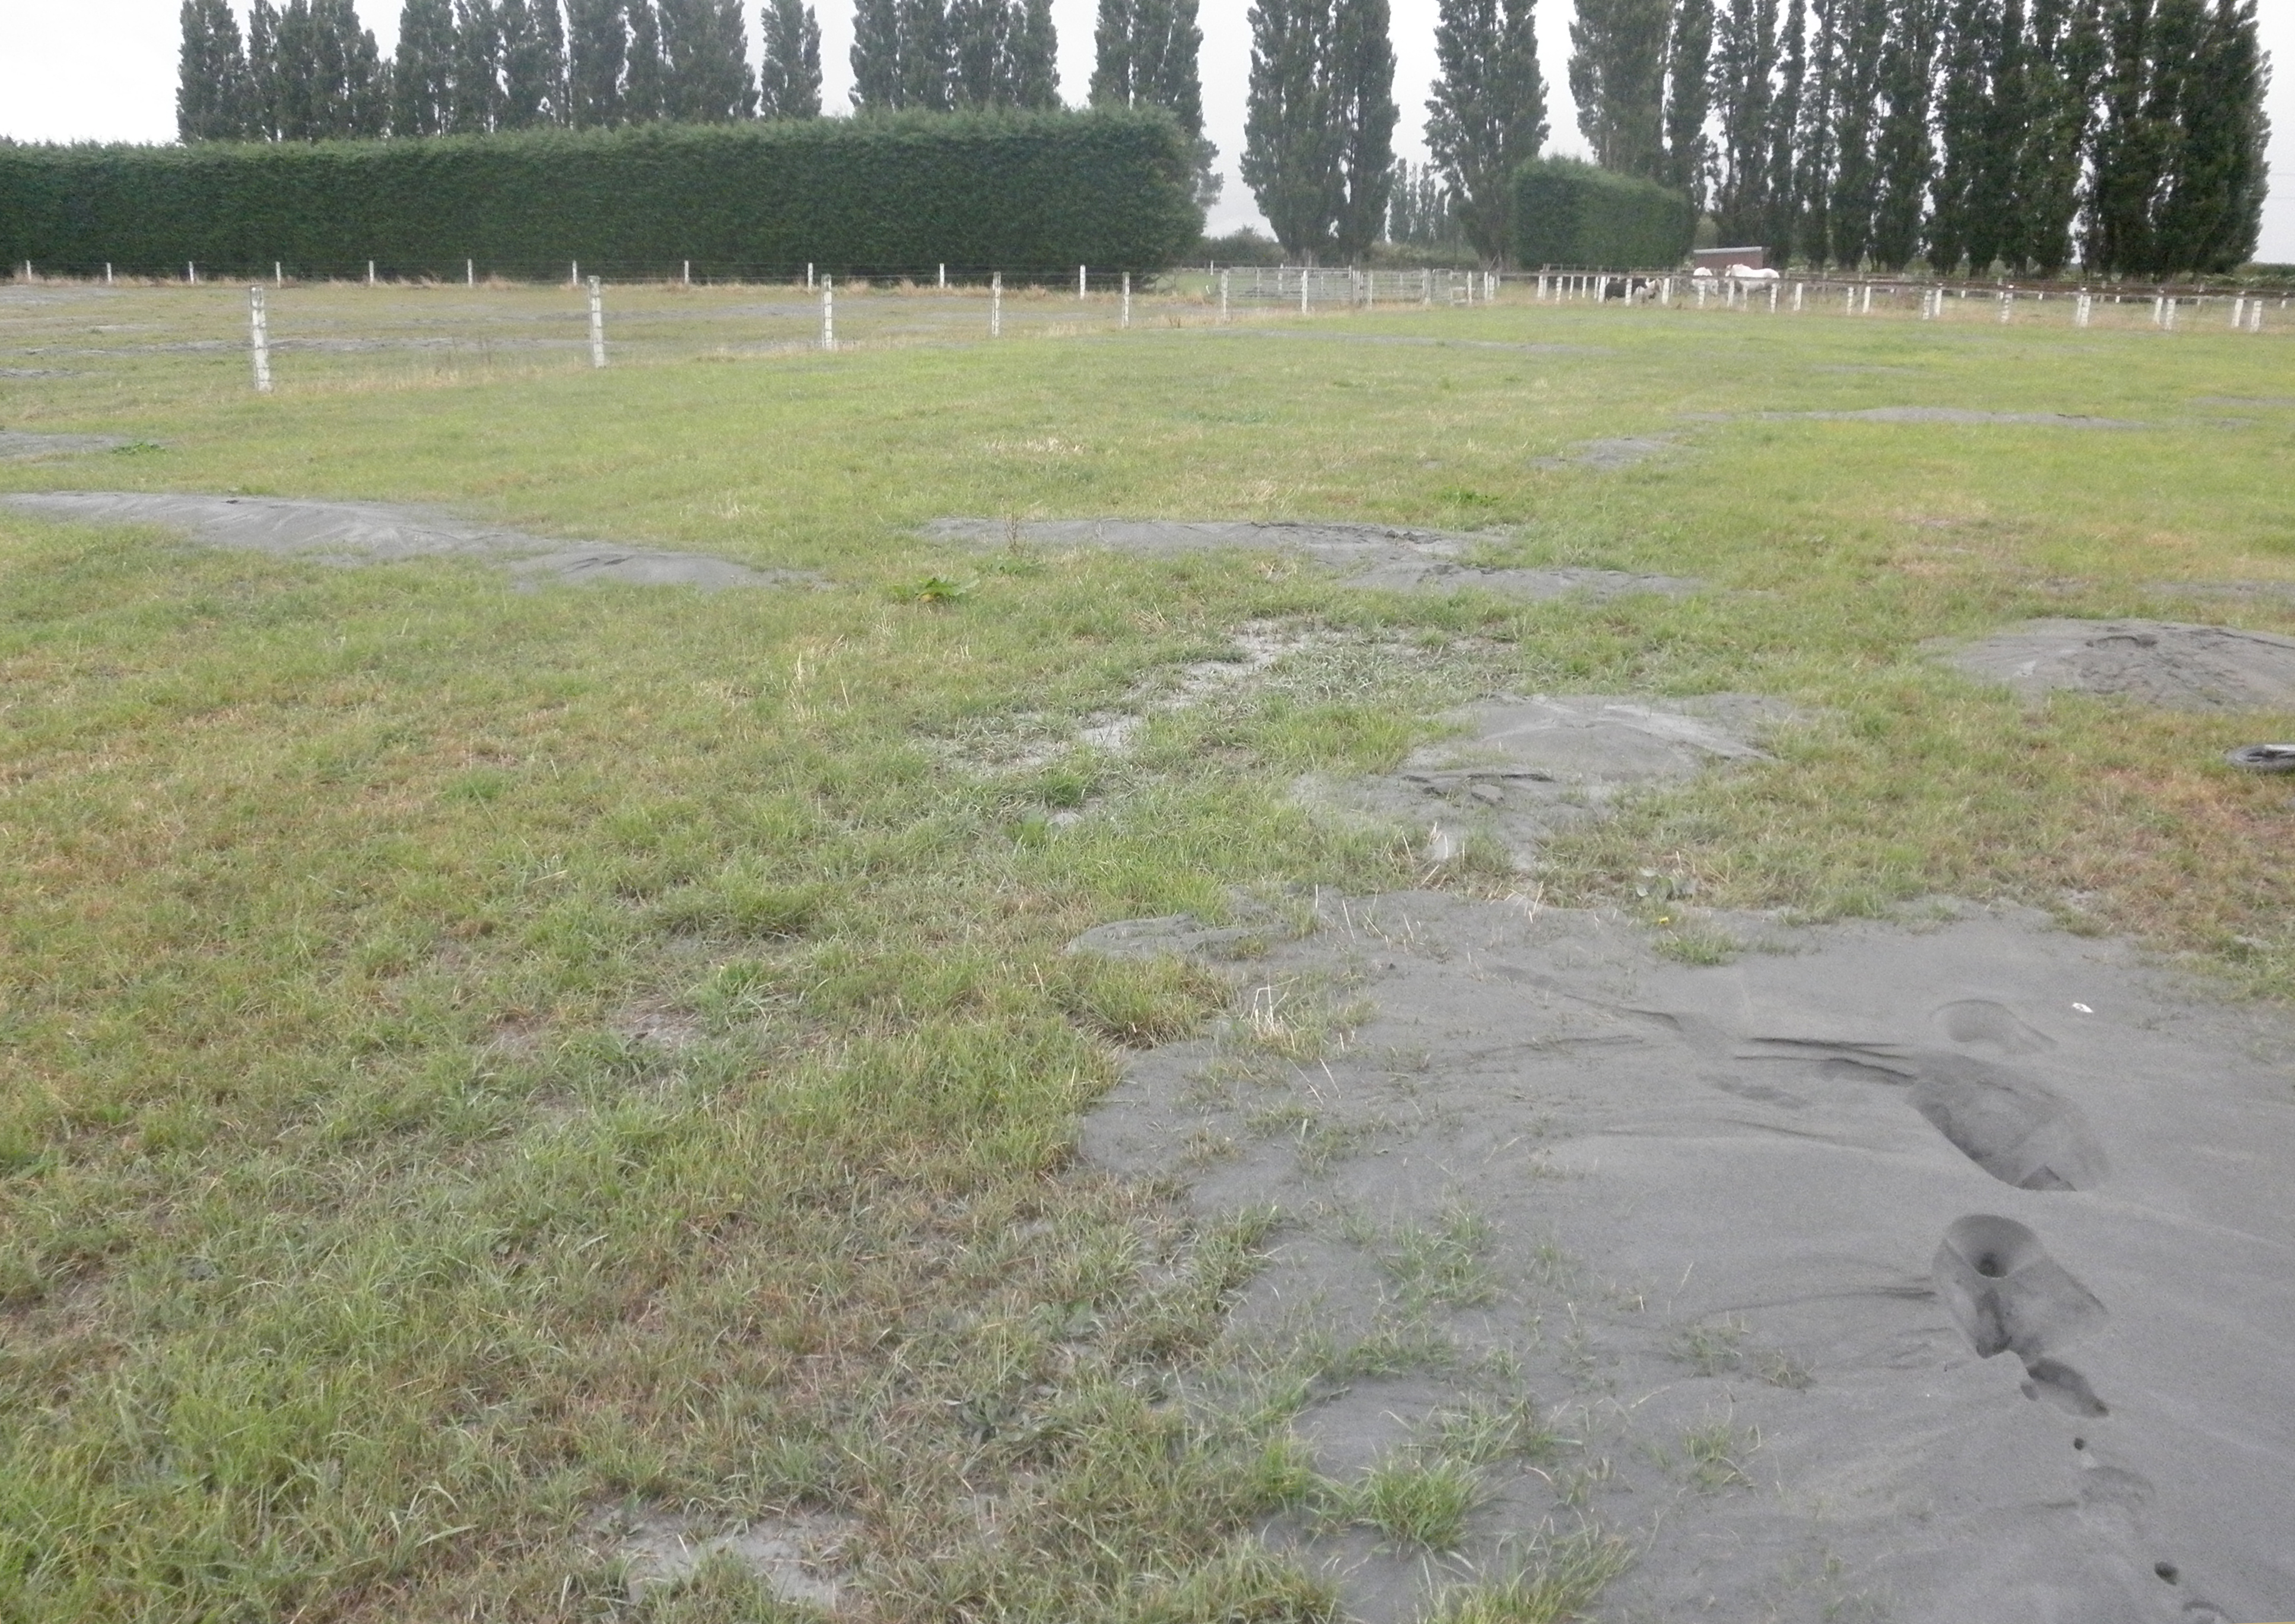
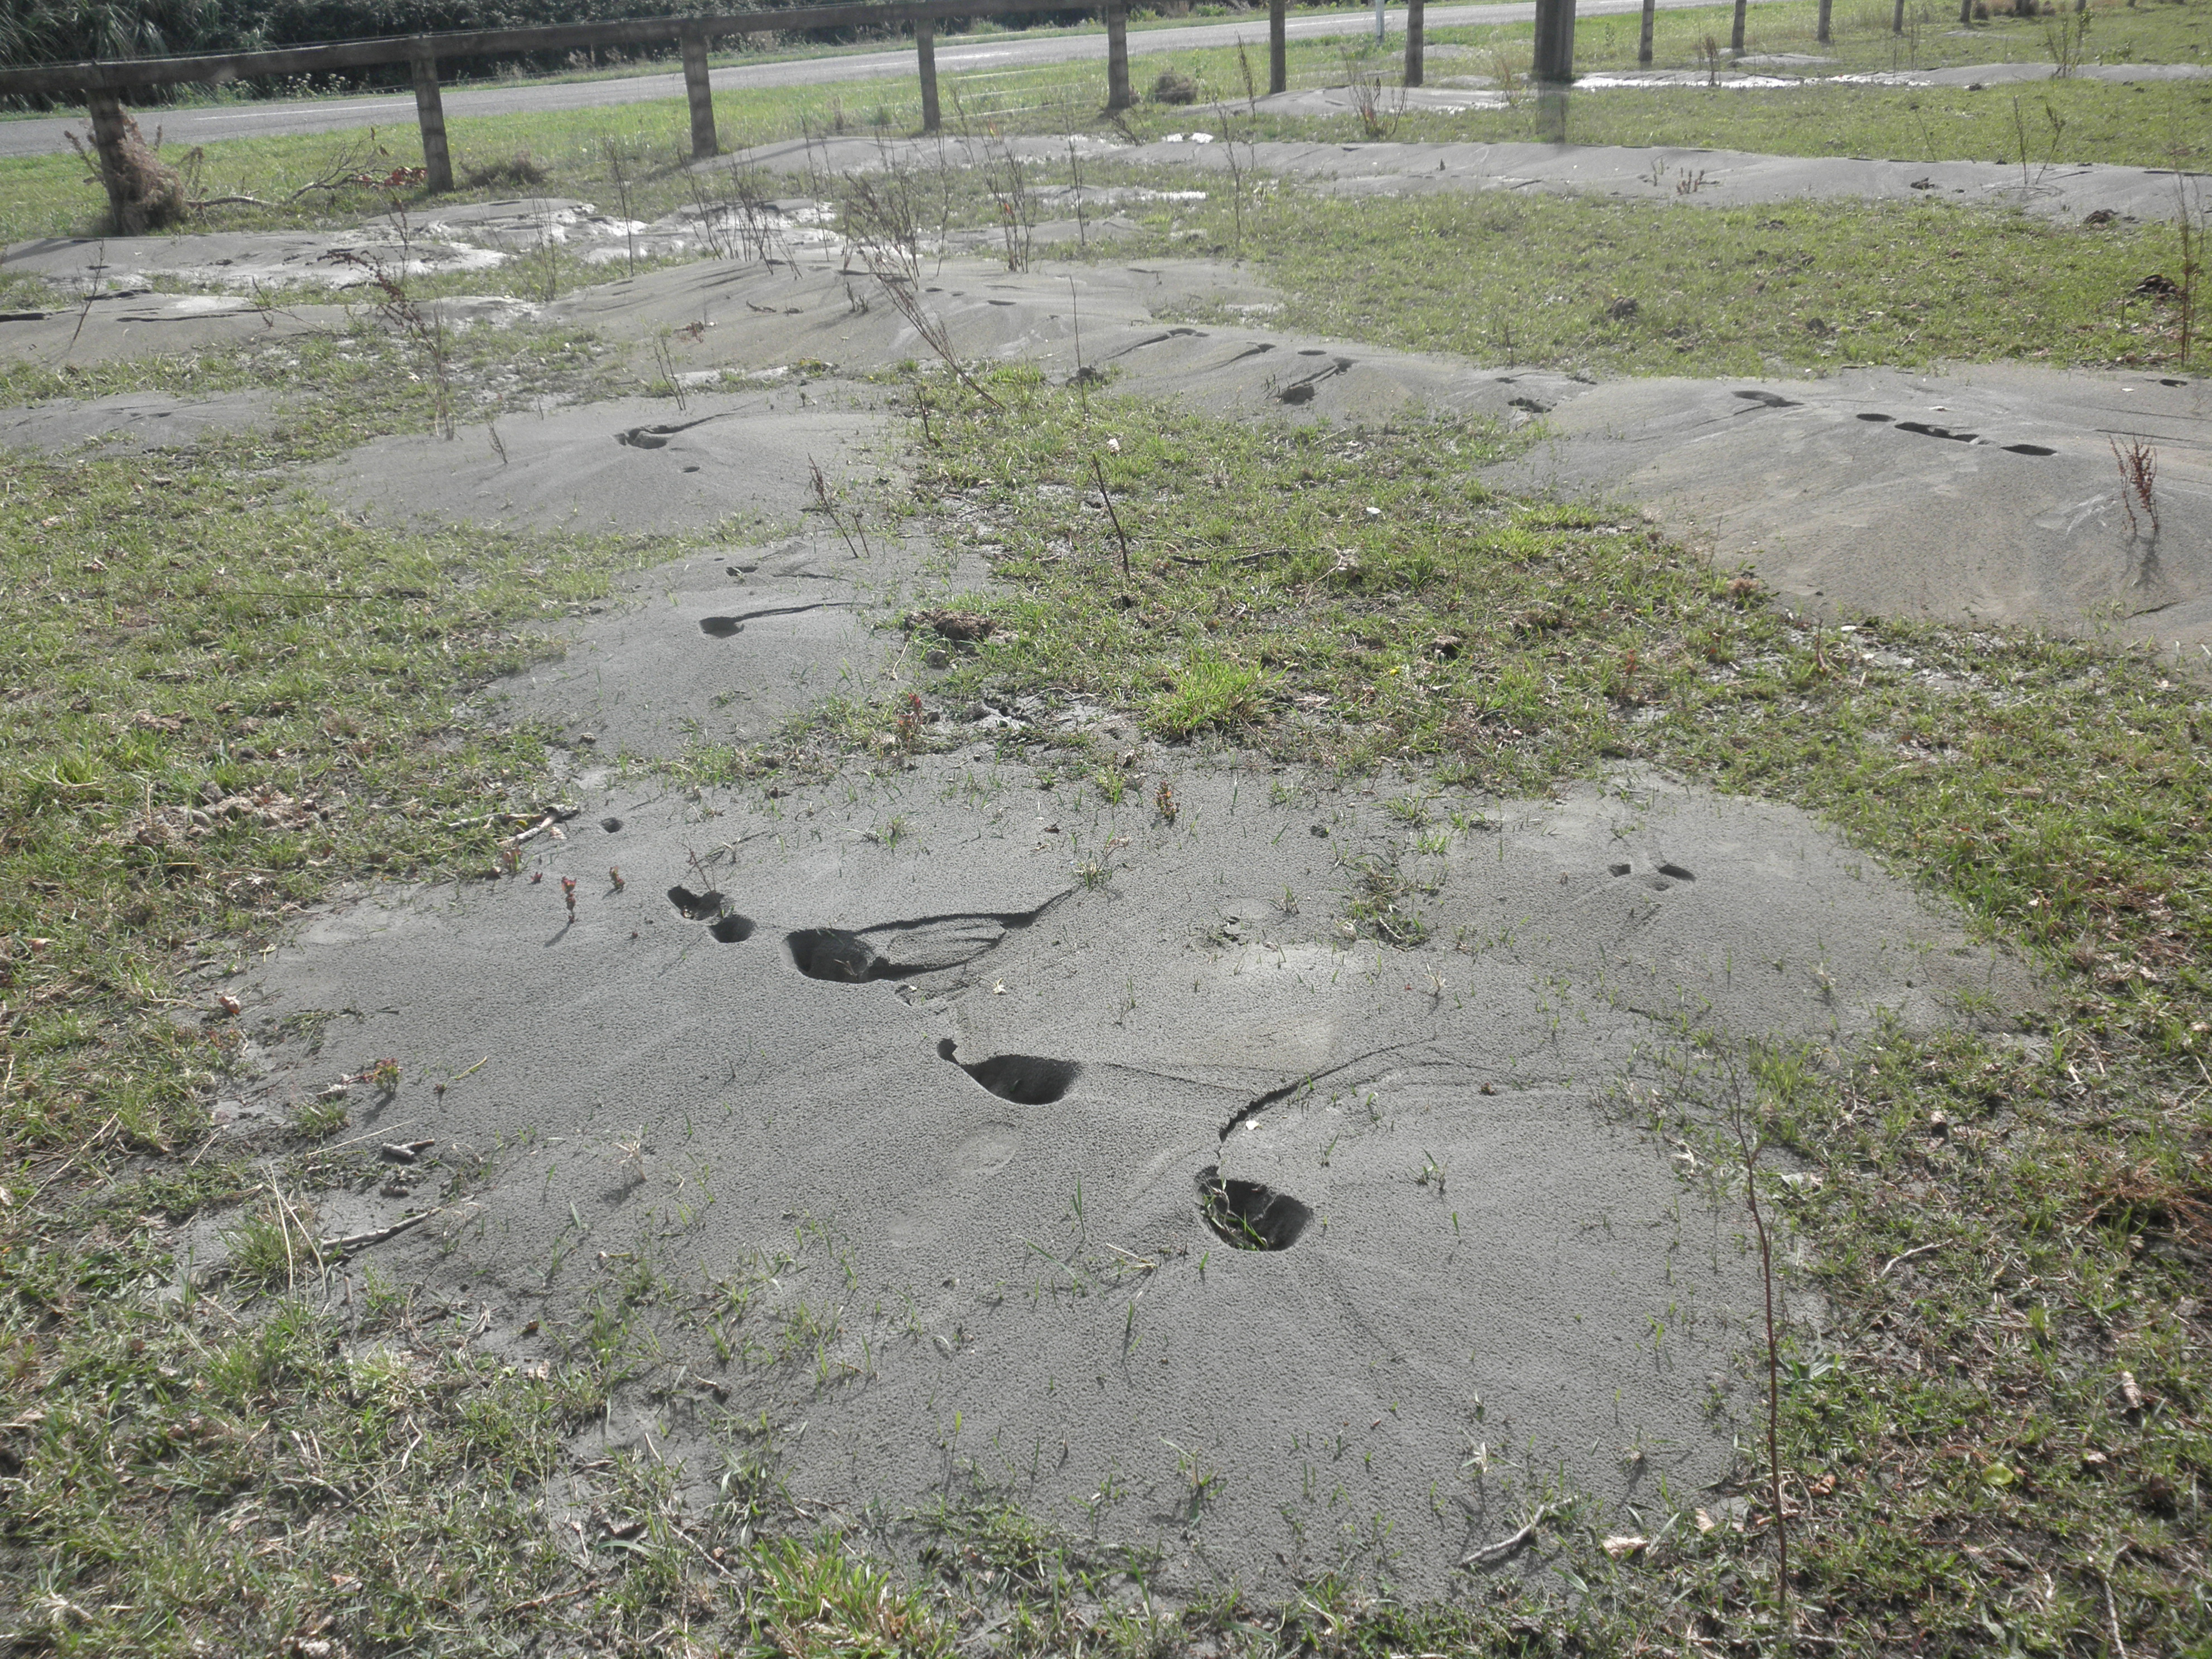
Figure S34. Sand–silt blows, fissures, and blisters formed at the Hardwick site location L17 during the 4 September 2010 M 7.1 Darfield earthquake. Plants, trees, cows, and fence posts provide a sense of scale. Photograph by C. Hardwick and R. Hardwick.
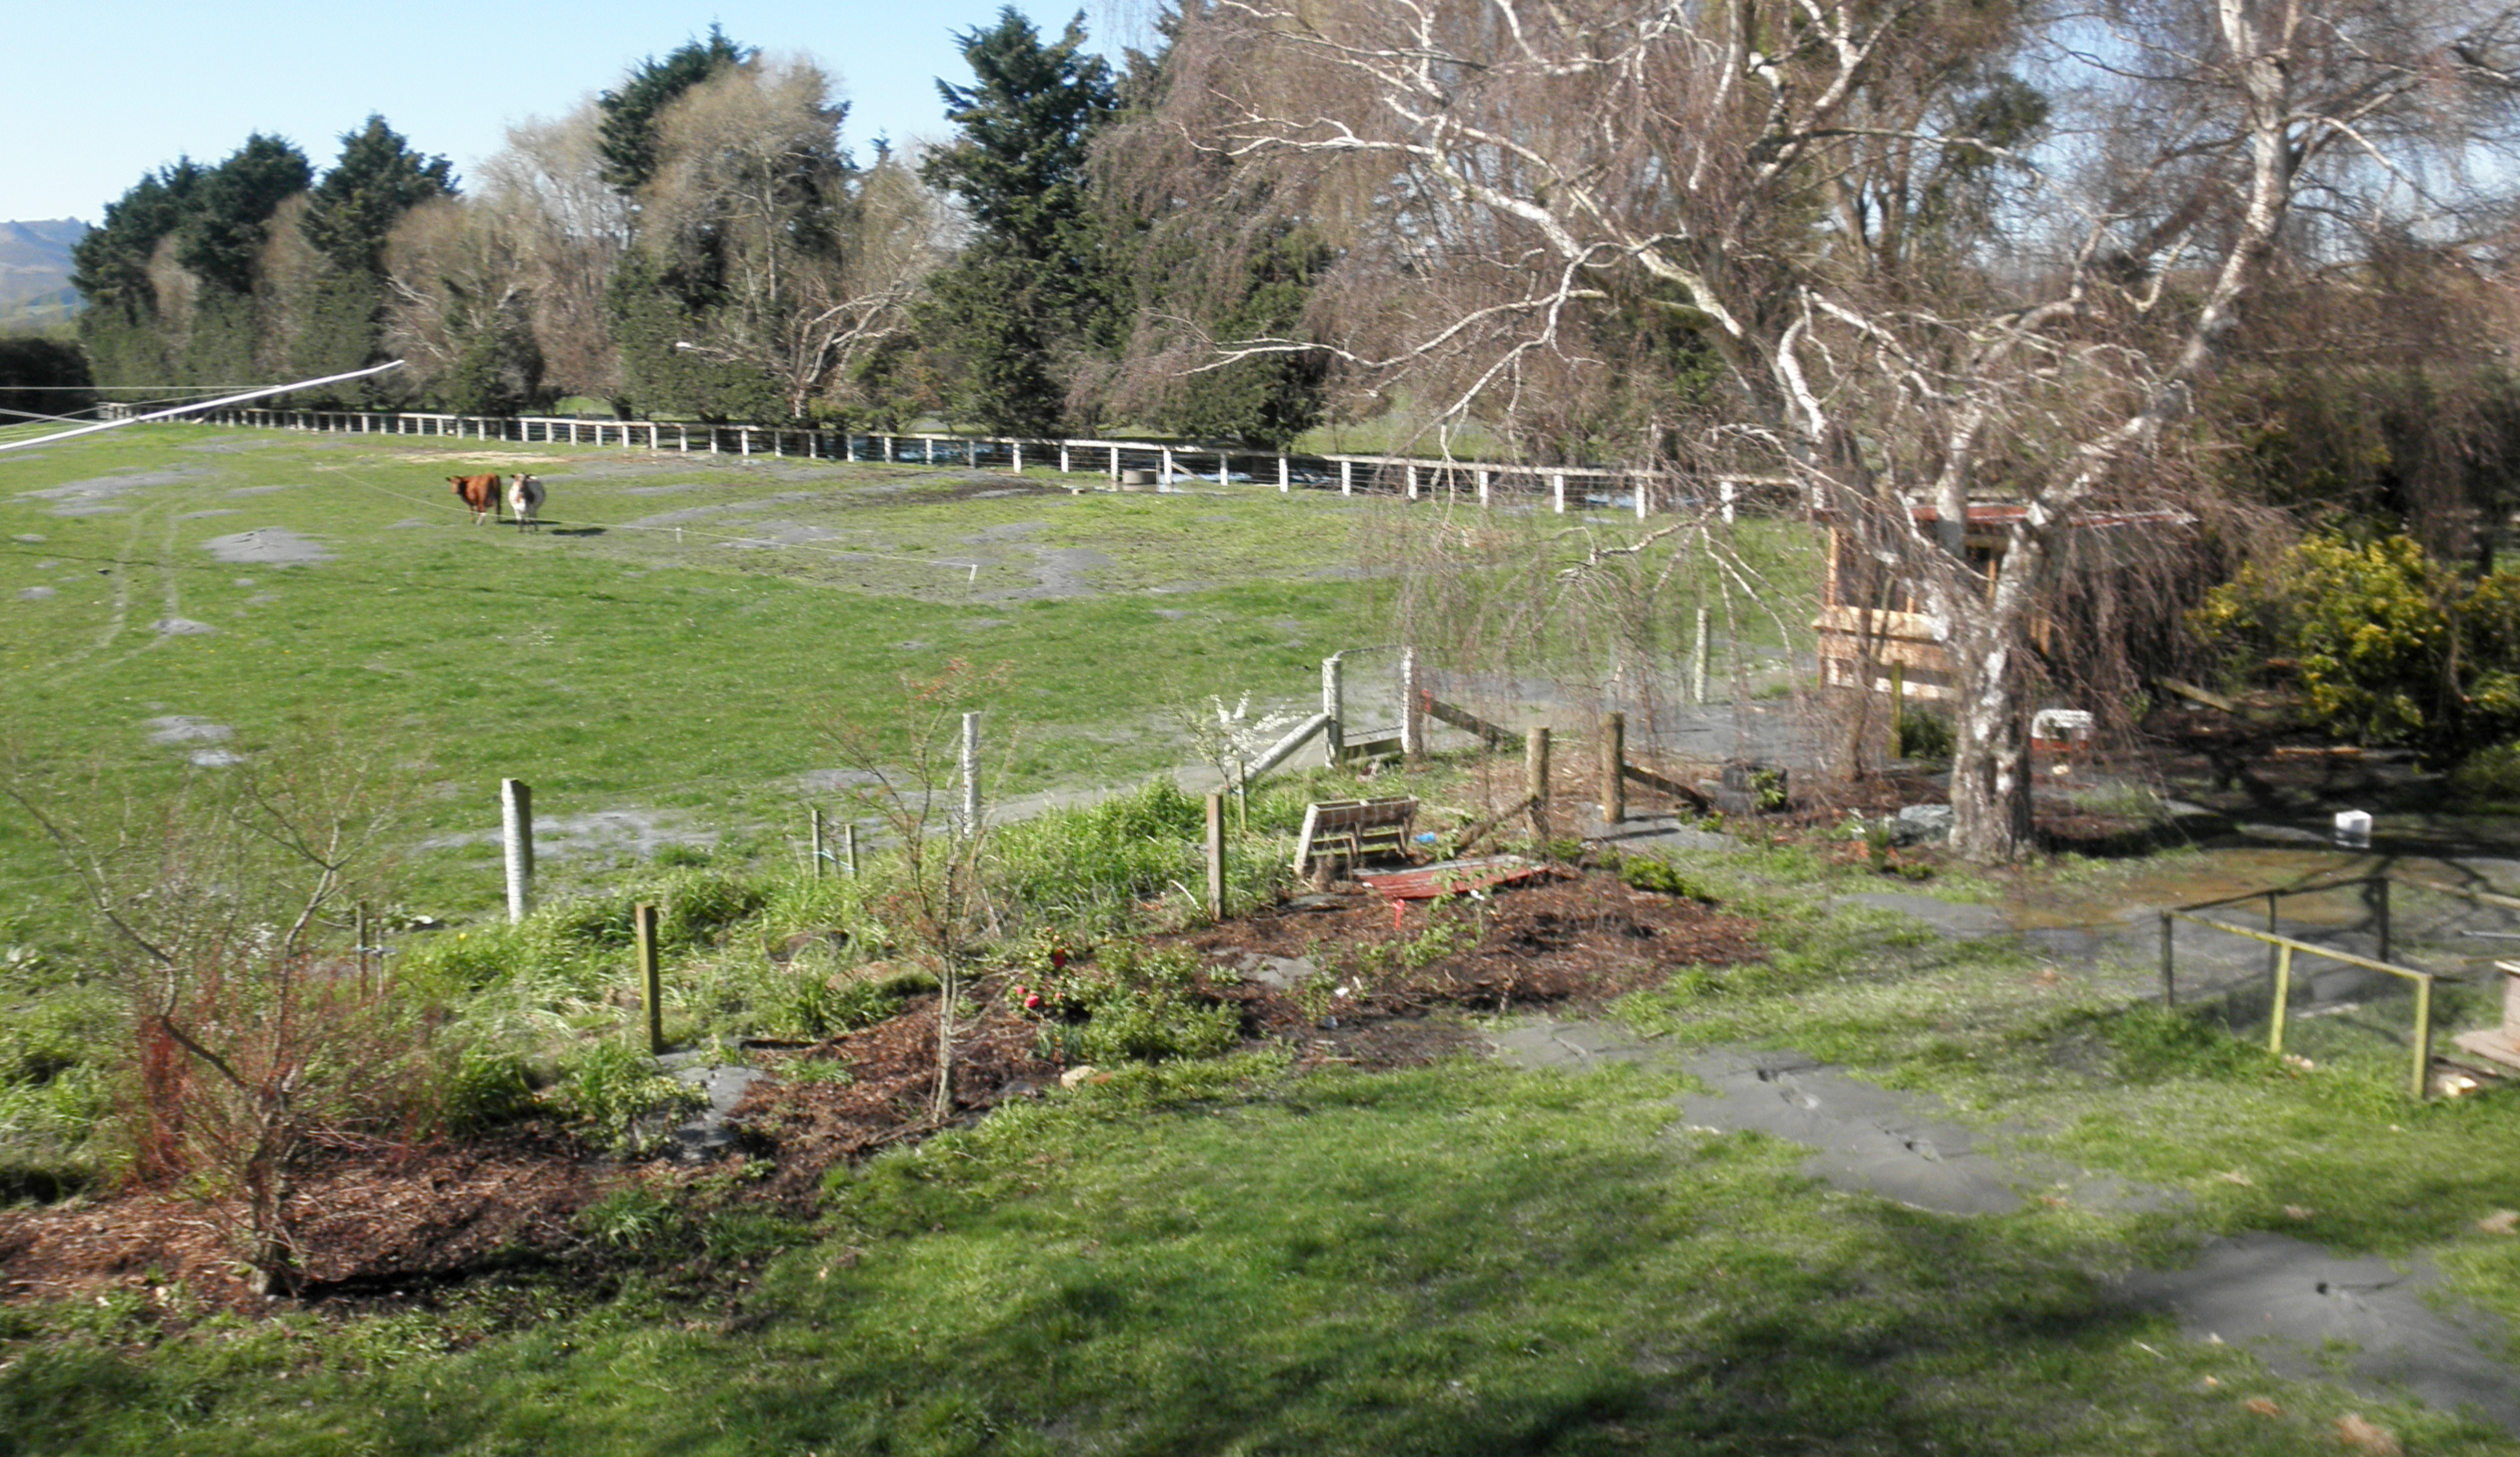
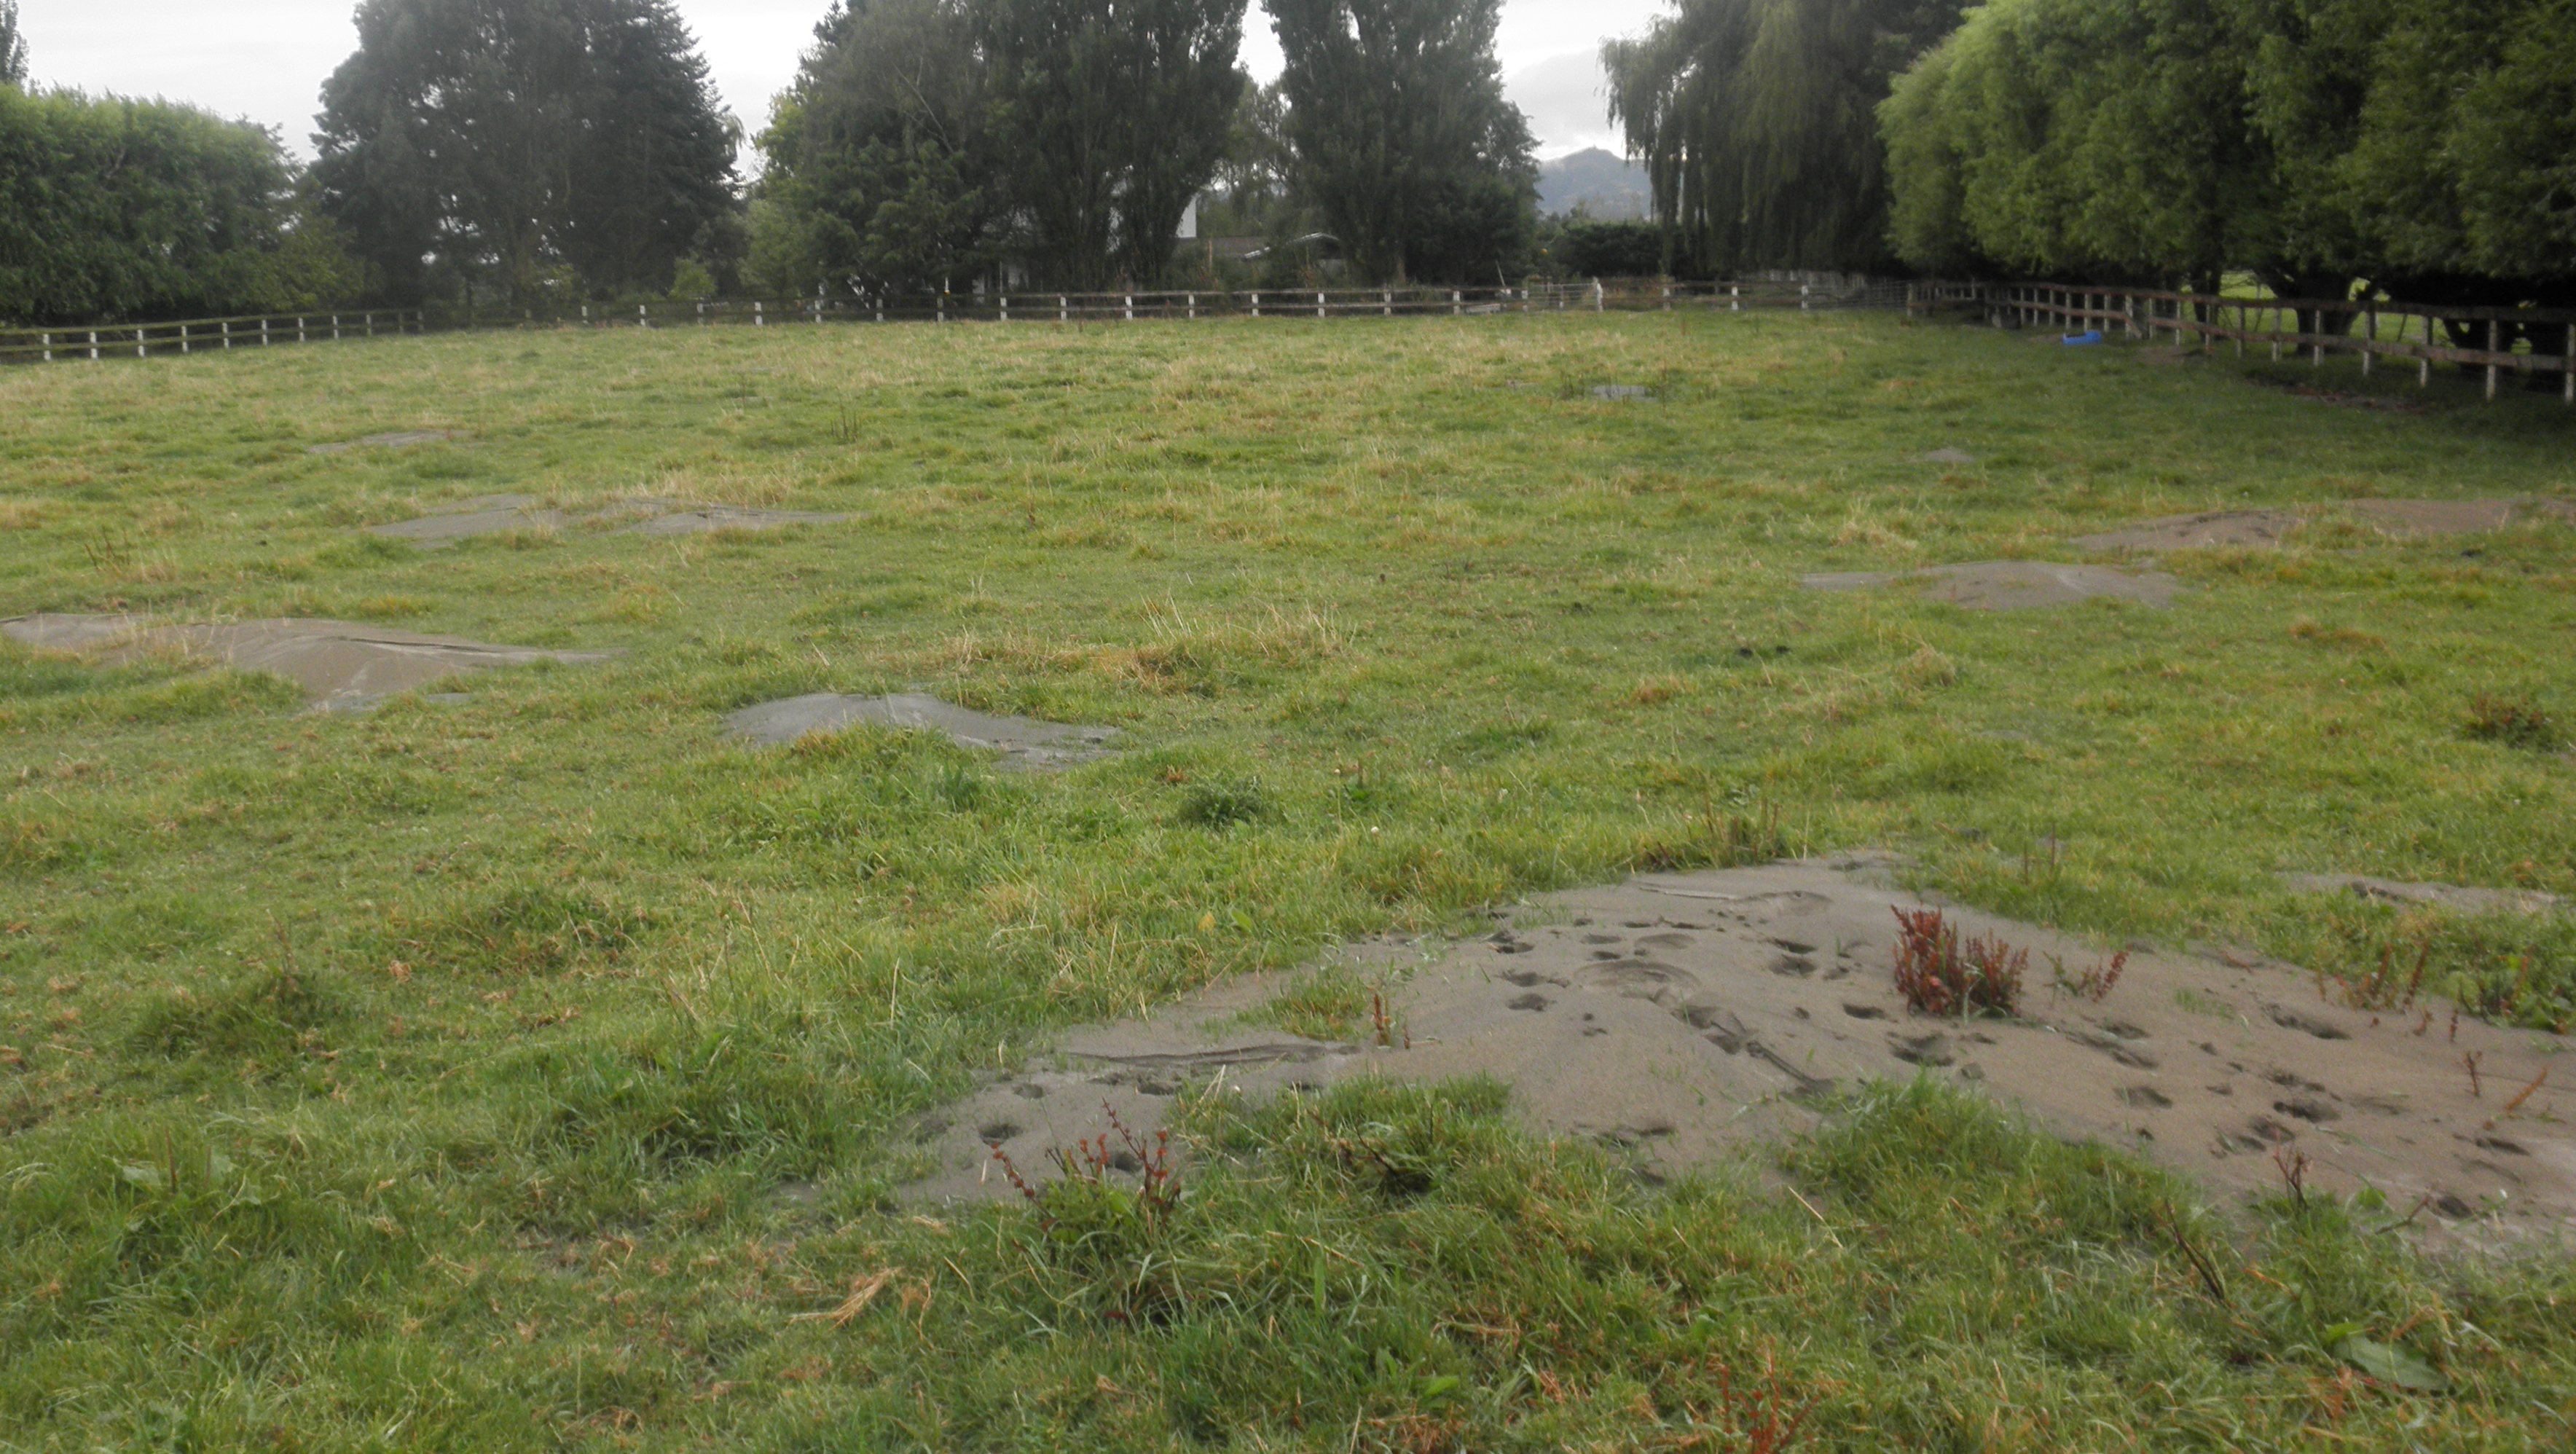
Figure S35. Sand–silt blows, fissures, and blisters that formed at the Hardwick site location L18 during the 4 September 2010 M 7.1 Darfield and the 22 February 2011 M 6.2 Christchurch earthquakes. View from L8 of L18. Plants, trees, and fence posts provide a sense of scale. Photograph by C. Hardwick and R. Hardwick.
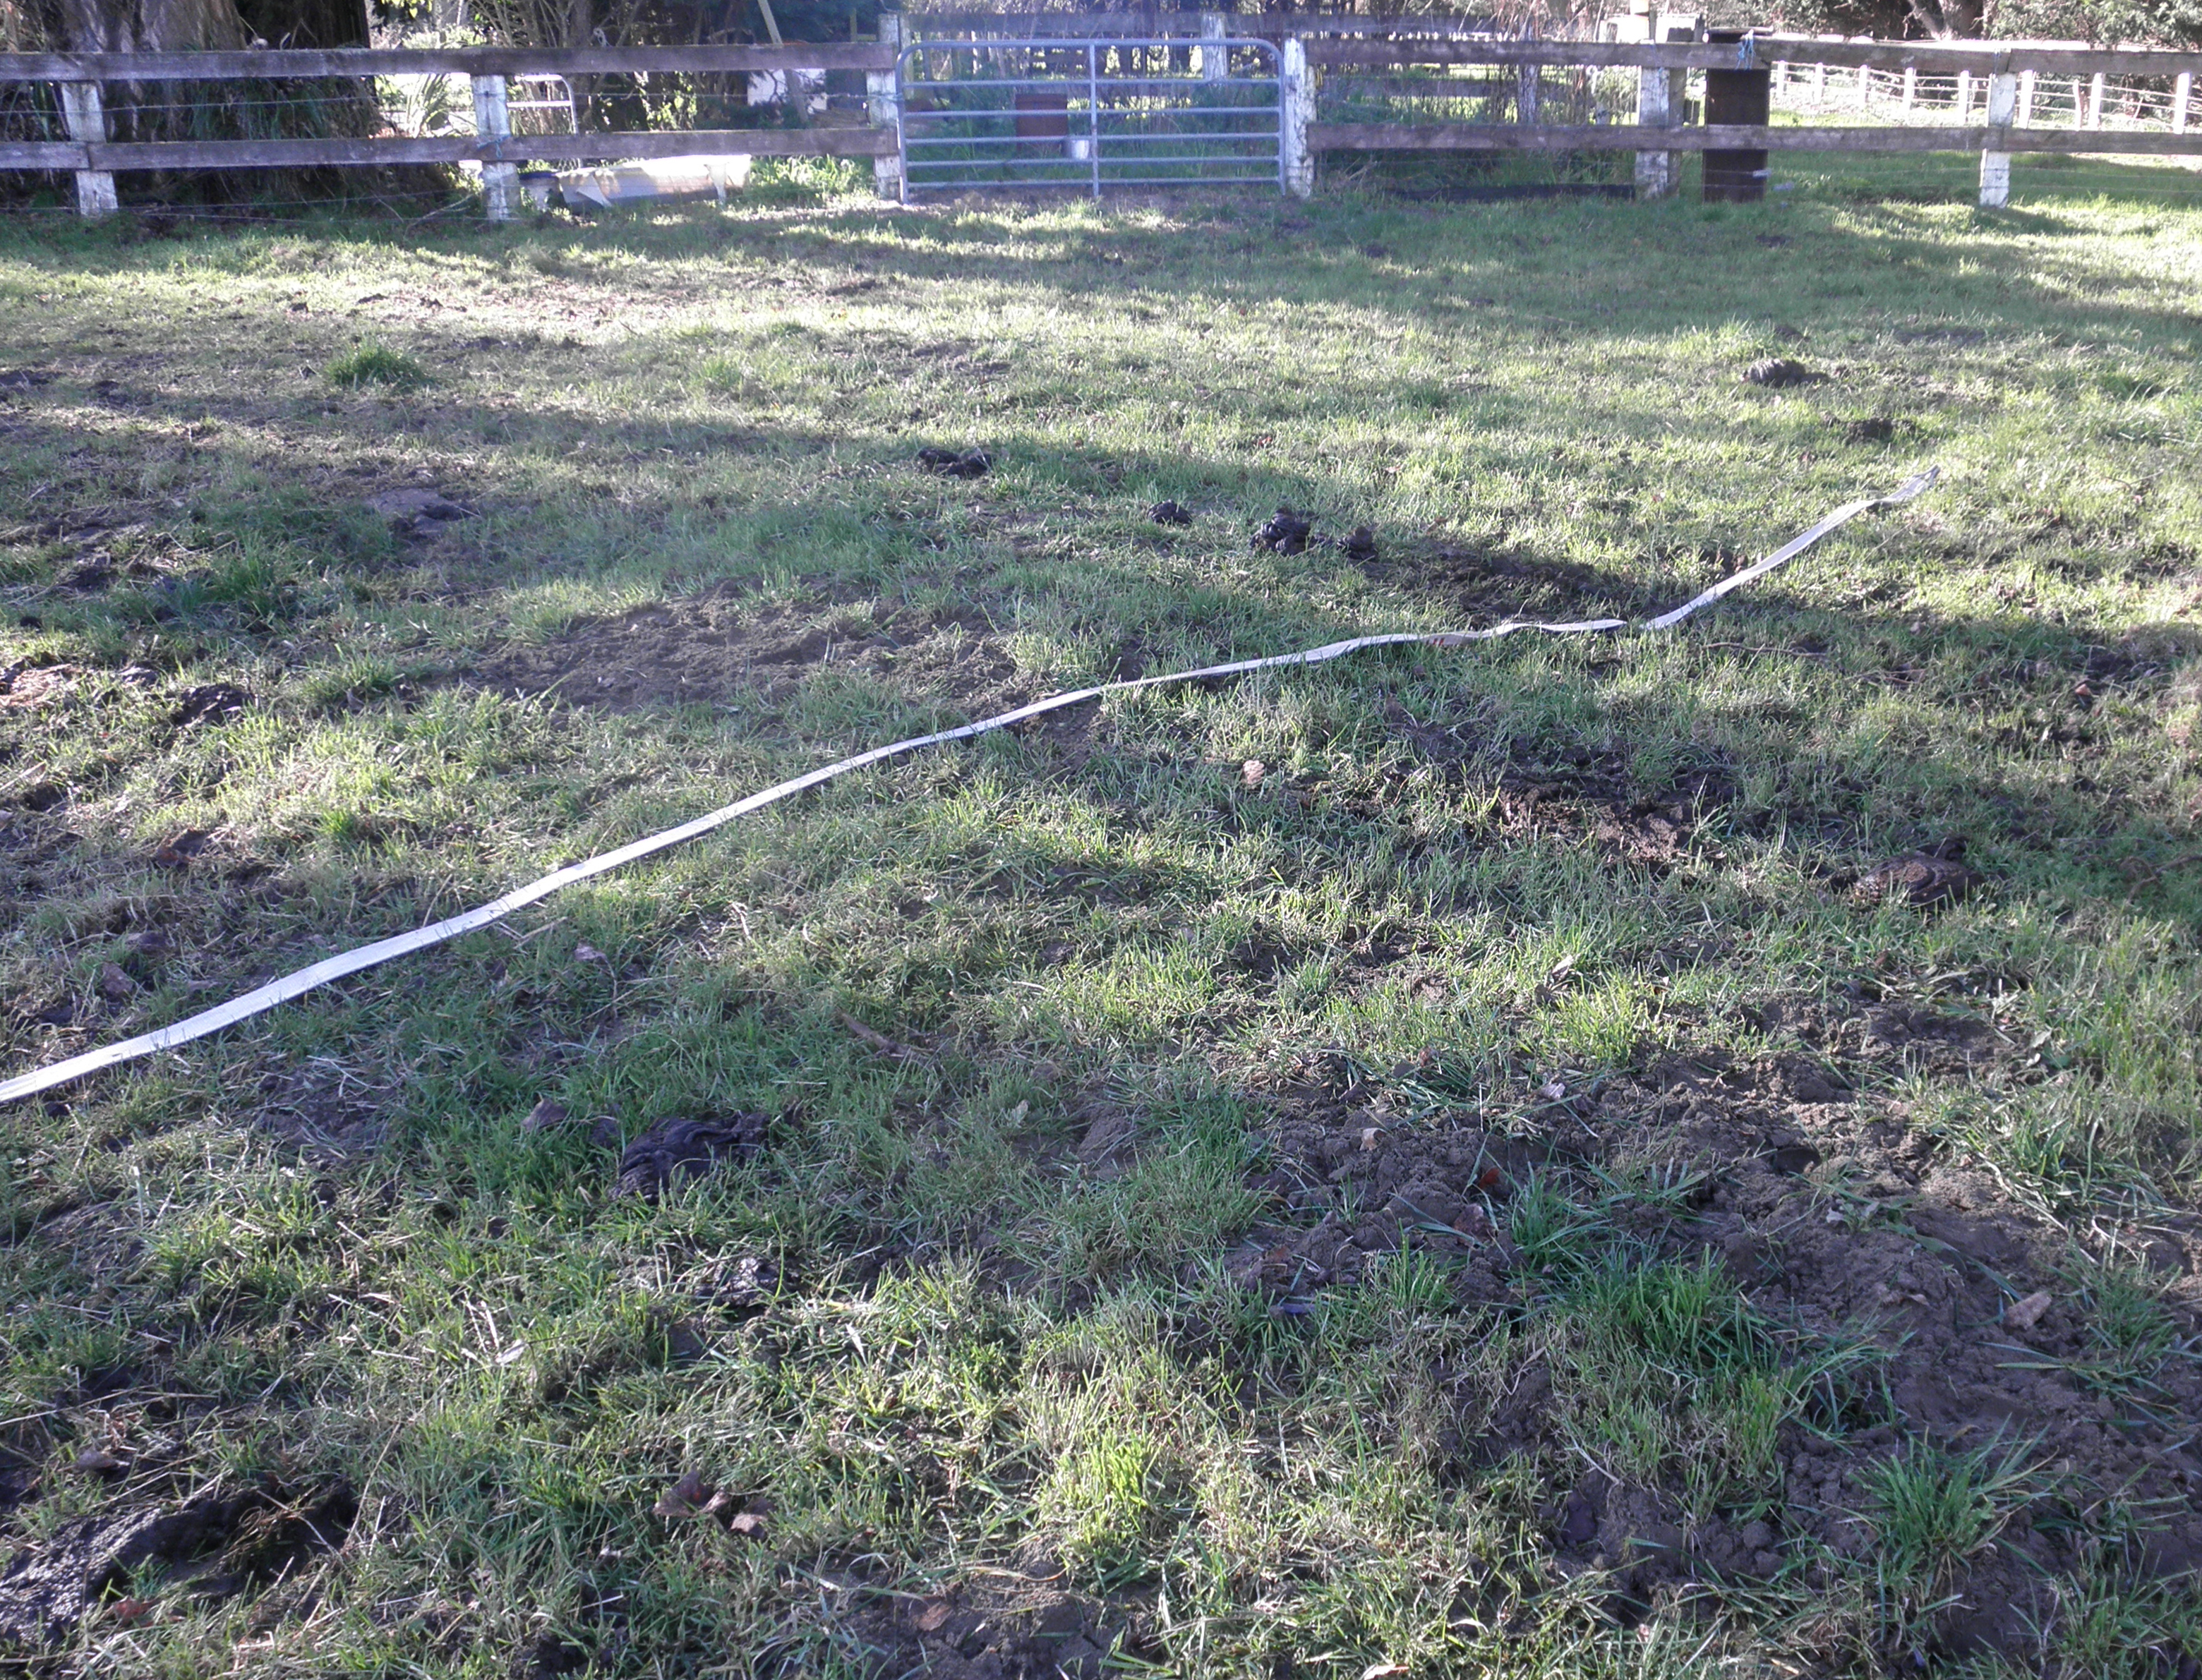
Figure S36. Blister, or a raised ground surface, that formed at the Hardwick site location L18 during the 4 September 2010 M 7.1 Darfield and the 22 February 2011 M 6.2 Christchurch earthquakes. The white tape helps to see the deformed ground surface, which was flat before the September 2010 earthquake. Grass, trees, and fence posts provide a sense of scale. Photograph by C. Hardwick and R. Hardwick.
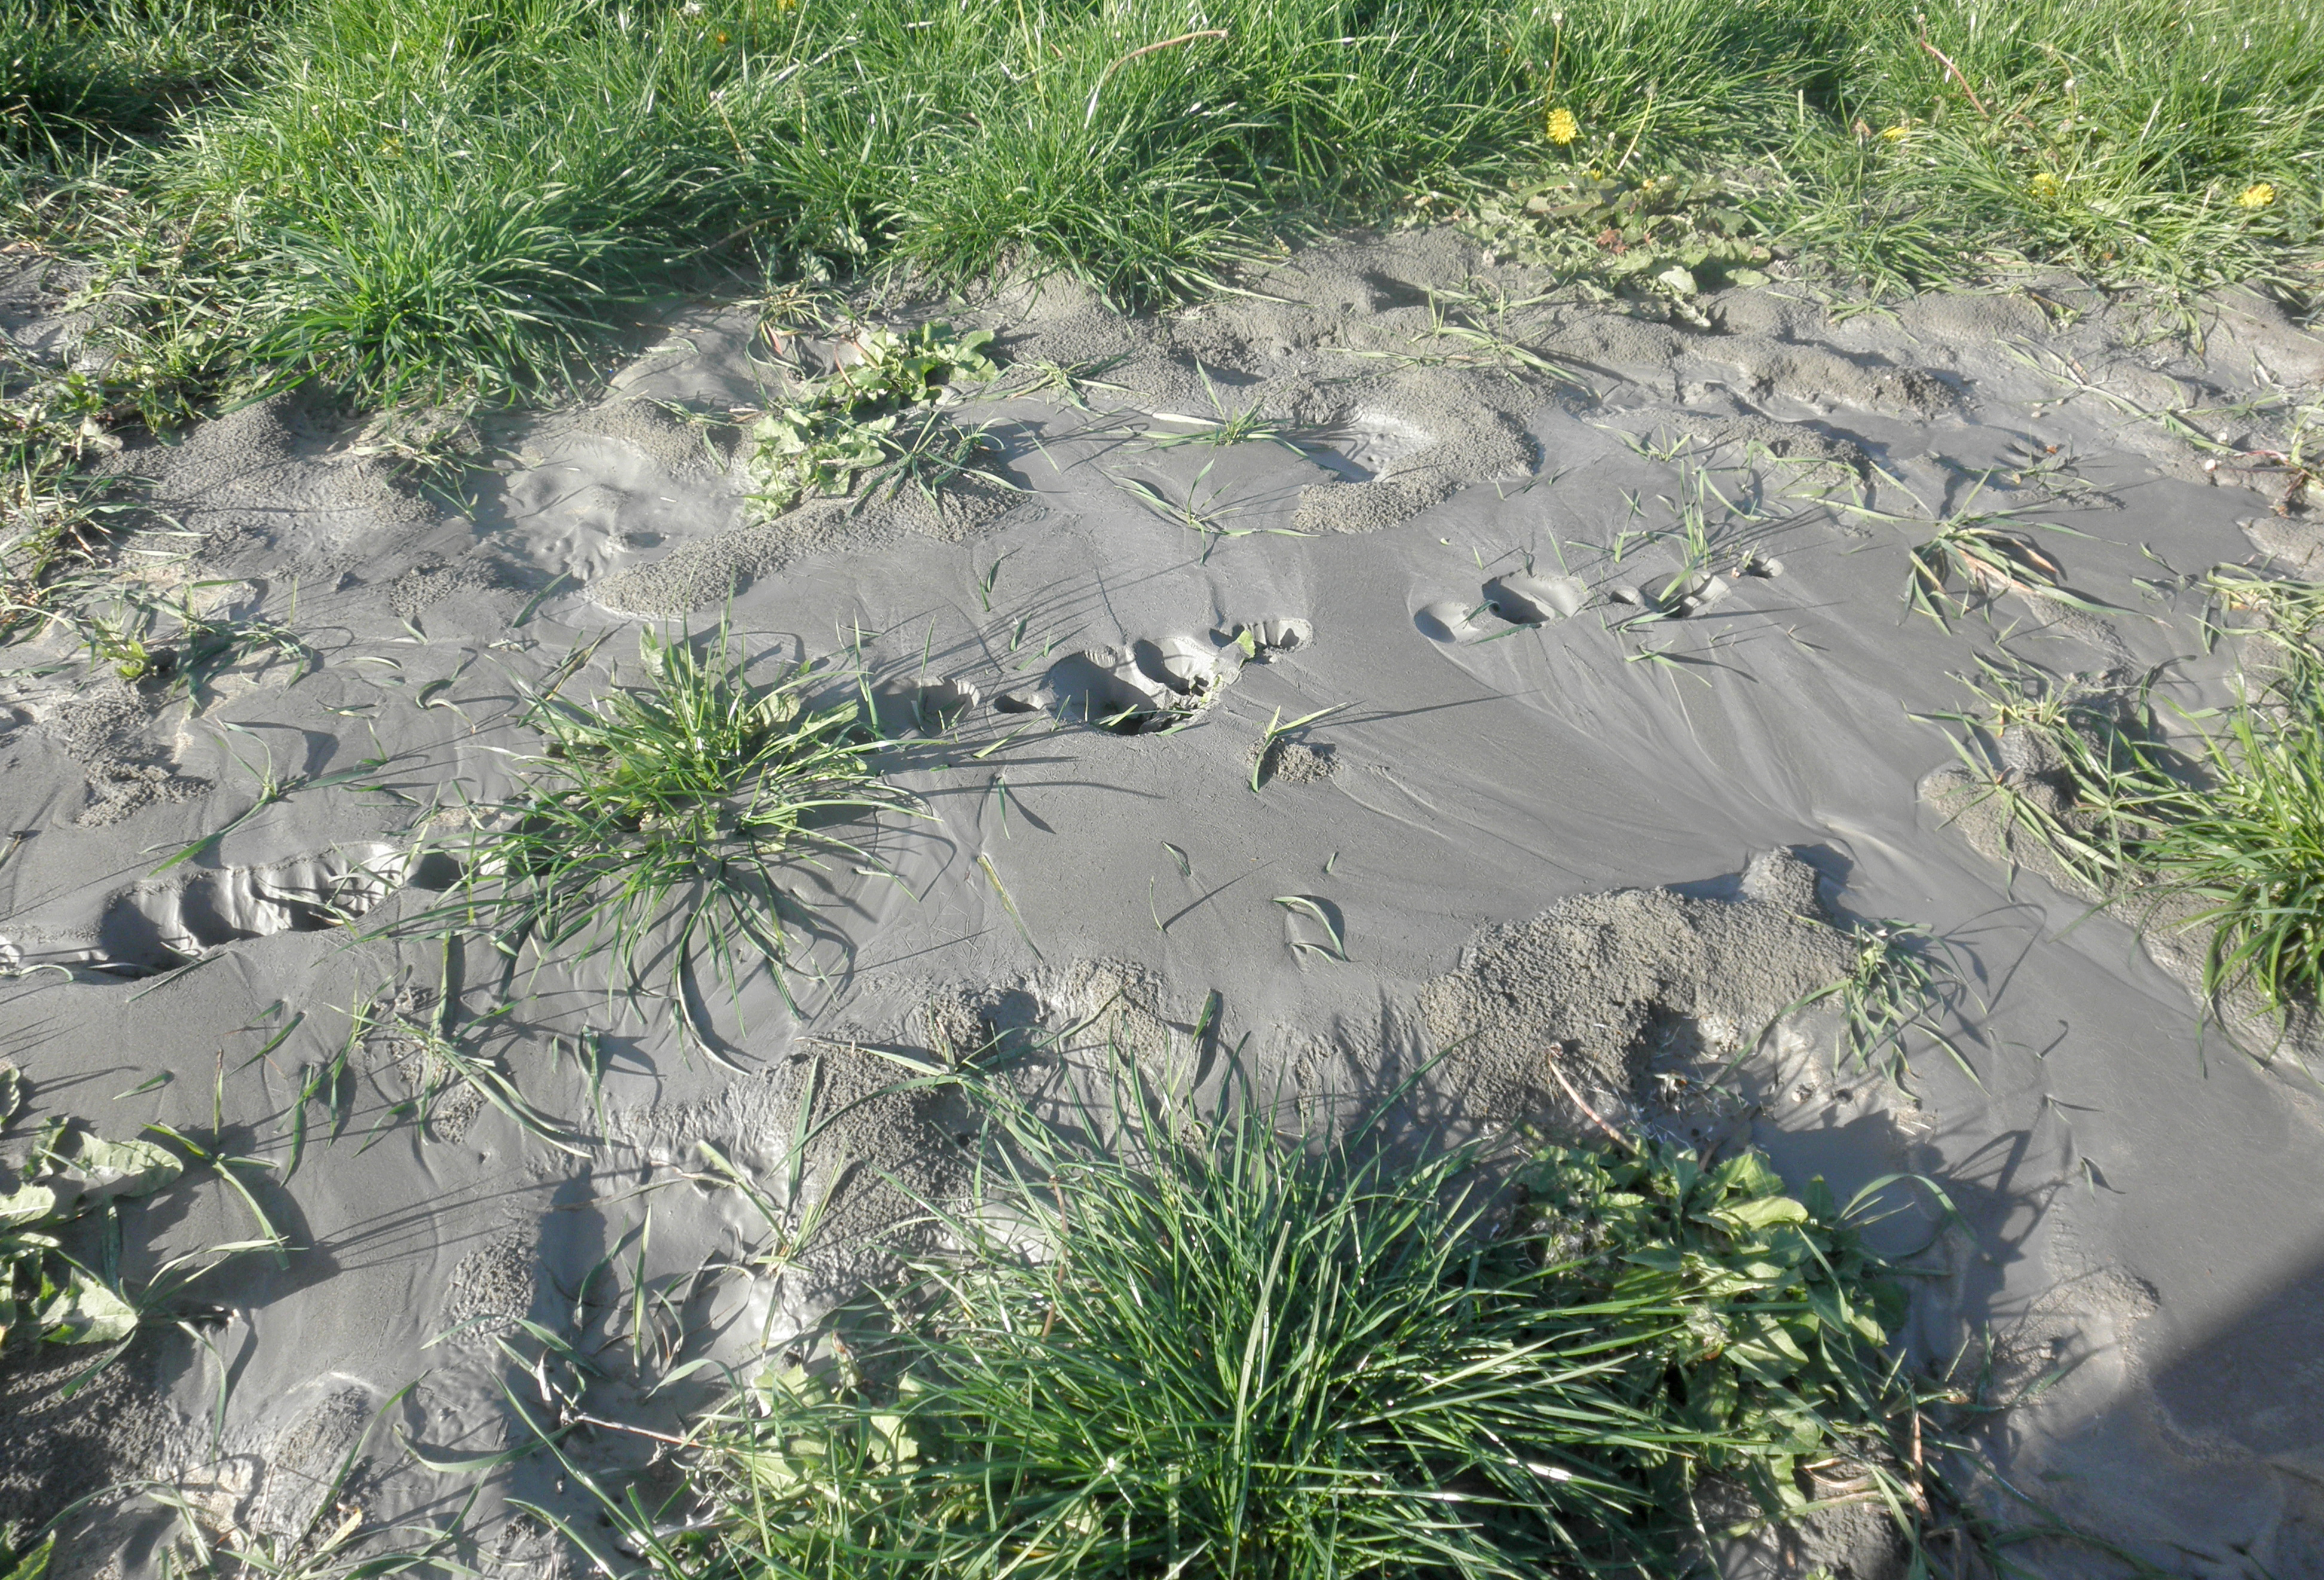
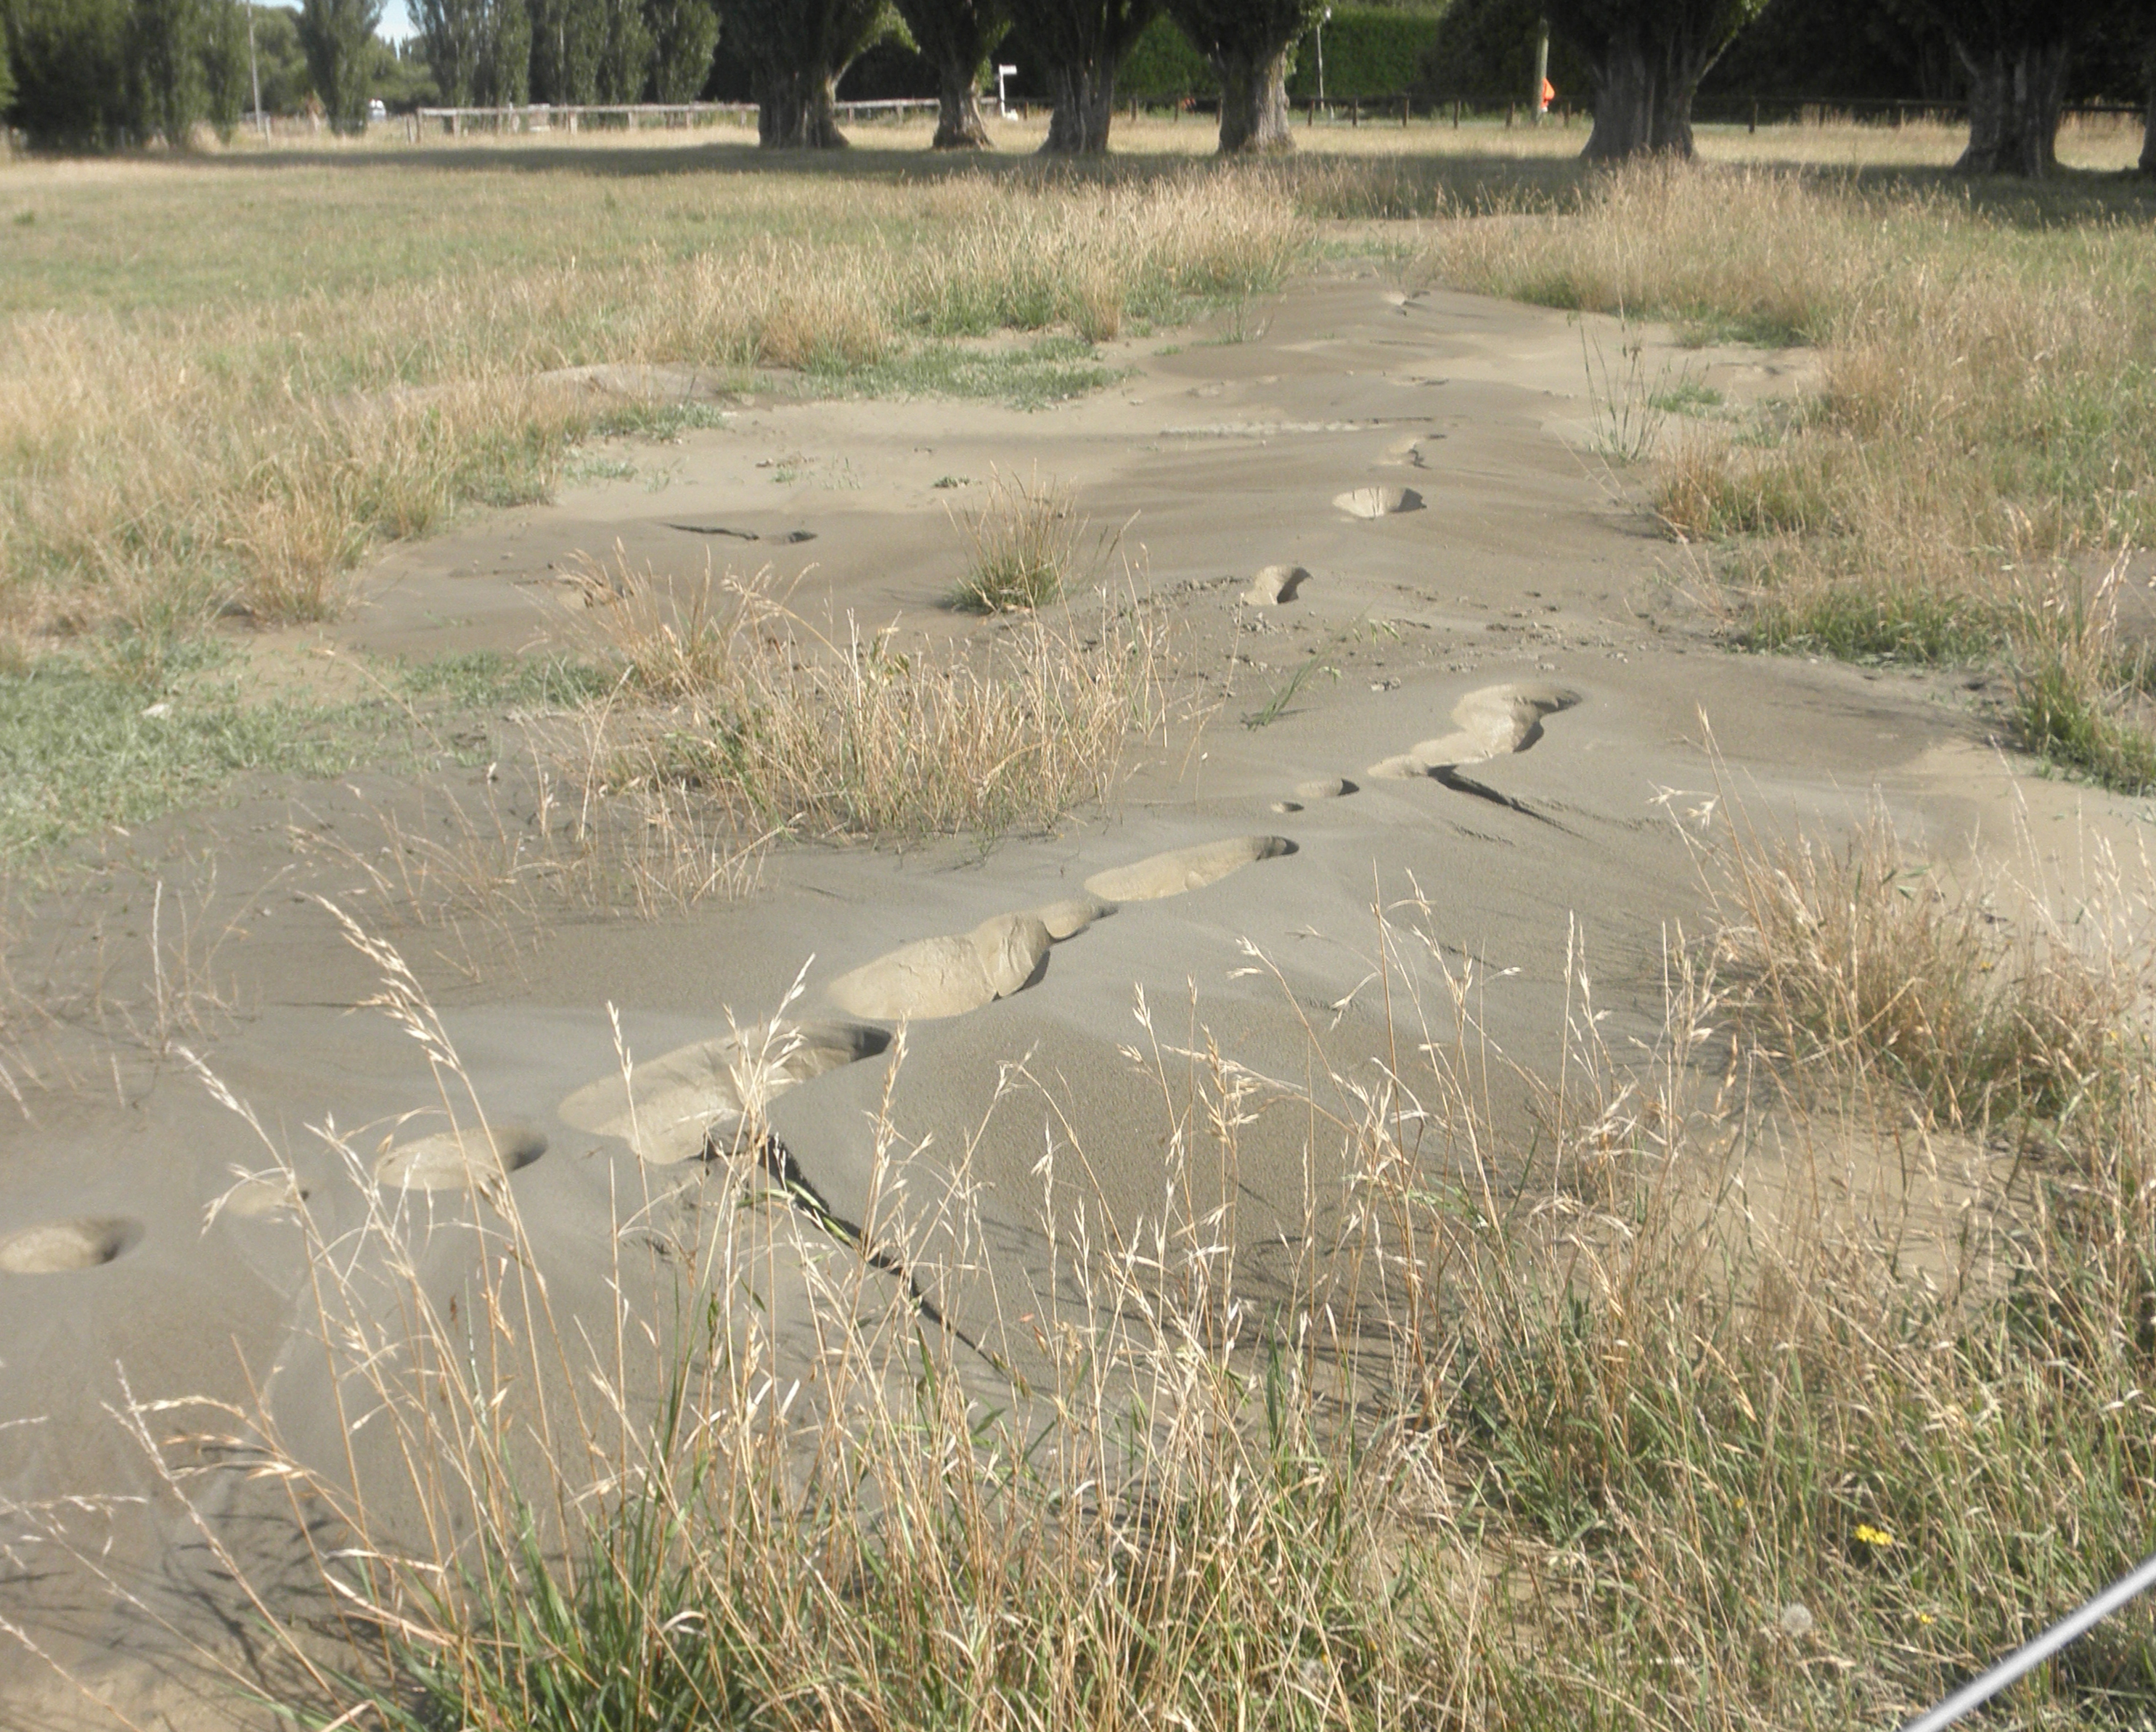
Figure S37. Sand–silt fissures that formed at the Hardwick site location L19 during the 22 February 2011 M 6.2 Christchurch earthquake. Vented material includes tan and gray sand and silt. Similar features formed at this location during the 4 September 2010 M 7.1 Darfield earthquake but had been worked into the topsoil before the February 2011 event. Plants, fence posts, and hedge provide a sense of scale. Photograph by C. Hardwick and R. Hardwick.
Figure S38. Vent of sand–silt blow that formed at the Hardwick site location L19 during the 22 February 2011 M 6.2 Christchurch mainshock and aftershocks. Layering can be seen in the vent. Thickness of this particular compound sand blow is ~28 cm. A measuring tape provides the scale. Photograph by C. Hardwick and R. Hardwick.
Figure S39. Aerial photograph of the Marchand site acquired after the 4 September 2010 M 7.1 Darfield earthquake (modified from Almond et al., 2010) showing the locations (e.g., 2 or L2; 3 or L3) of liquefaction features summarized in Tables S2 and S3. A few of the liquefaction features are shown in Figure S40.
Figure S40. Sand blows and fissures that formed at the Marchand site locations L17, L18, L20, and L21 during the 4 September 2010 M 7.1 Darfield earthquake. Grass, hedge, and a measuring tape in the foreground provide a sense of scale. Adapted with permission from Almond et al. (2010).
Almond, P., T. Wilson, F. L. Shanhun, Z. Whitman, A. Eger, D. Moot, M. Cockcroft, and D. Nobes (2010). Agricultural land rehabilitation following the 2010 Darfield (Canterbury) earthquake: A preliminary report, Bull. New Zeal. Soc. Earthq. Eng. 43, no. 4, 432–438.
[ Back ]