This electronic supplement presents two additional figures showing the synthetic test results and a table that includes peak resonance frequency and average VP and VS for all the stations inside the northern Mississippi embayment.
Figures S1 and S2 illustrate the models, power spectral ratios, and the resulting velocities. The average velocity in the layered model is calculated first by computing the travel time in every layer, knowing the thickness and velocity of each layer, and then dividing the total thickness of the sediment column by the sum of the travel times. Layered models are modified from Langston et al. (2005) and a priori information on the depth of the major geologic boundaries (Paleozoic–Upper Cretaceous–Tertiary). Crust and upper-mantle velocities and densities, as well as attenuation factors for the sediments, are from Langston (2003).
Table S1. Station data and horizontal-to-vertical (H/V)–vertical-to-horizontal (V/H) analysis and results.
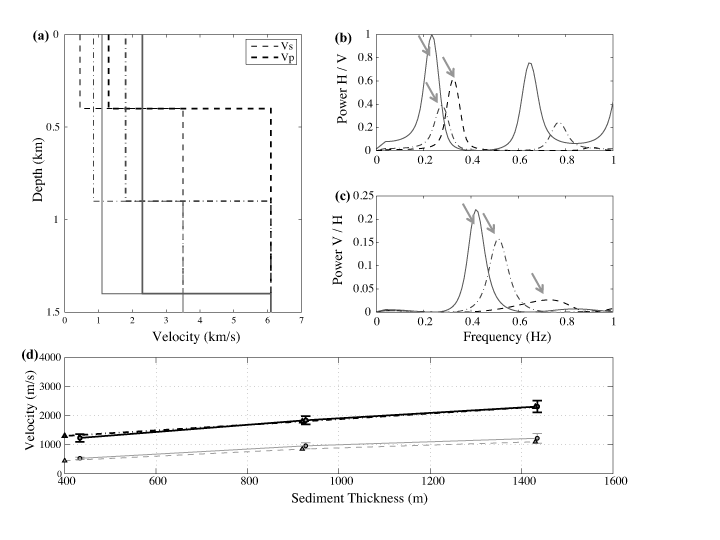
Figure S1. Synthetic modeling showing the (a) P- (bold lines) and S-wave (unbold line) velocity structure of a layer over half-space used to generate synthetic waveforms. Power spectra of (b) H/V and (c) V/H ratio. Dashed, dotted-dashed, and solid lines correspond to stations on sediment thicknesses of 0.4, 0.9, and 1.4 km, respectively. Arrows indicate the peak frequency of H/V and V/H spectra. (d) Measured velocities for P waves (solid black line), S waves (solid gray line), and input models (dashed lines) are in close agreement. Circles and triangles are measurement and observation points, respectively. Smoothing of five points applied.
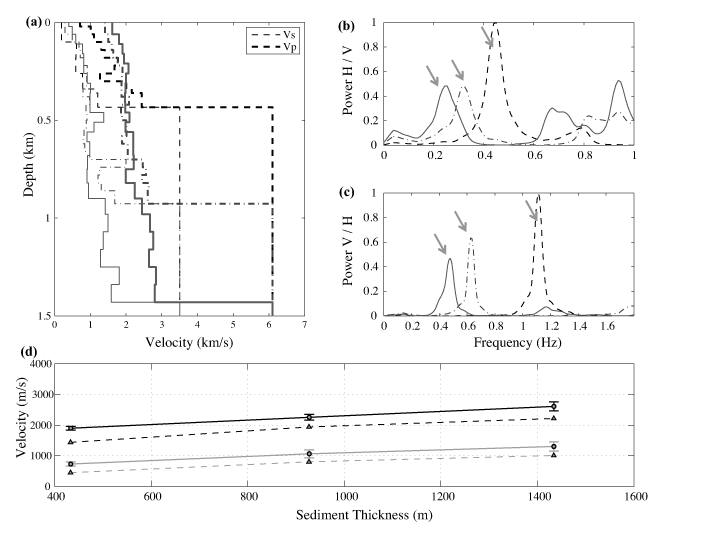
Figure S2. Synthetic modeling showing the (a) layered P- (bold lines) and S-wave (unbold line) velocity structures used to generate synthetic waveforms. Power spectra of (b) H/V and (c) V/H ratio. Dashed, dotted-dashed, and solid lines correspond to stations on sediment thicknesses of 0.4, 0.9, and 1.4 km, respectively. Arrows indicate the peak frequency of H/V and V/H spectra. (d) Measured velocities for P waves (solid black line) and S waves (solid gray line) are higher than the input models (dashed lines). Circles and triangles are measurement and observation points, respectively. Smoothing of five points applied.
Langston, C. A. (2003). Local earthquake wave propagation through Mississippi embayment sediments: I. Body wave phases and local site responses, Bull. Seismol. Soc. Am. 93, 2664–2684.
Langston, C. A., P. Bodin, C. Powell, M. Withers, S. Horton, and W. Mooney (2005). Bulk sediment QP and QS in the Mississippi embayment, central U.S., Bull. Seismol. Soc. Am. 95, 2162–2179.
[ Back ]