This electronic supplement contains two supplementary tables (Tables S1 and S2) and four supplementary figures (Figs. S1–S4). Tables S1 and S2 contain the details of 12 splay fault scenarios and 12 landslide scenarios examined in the main article. Figures S1 and S2 show the initial seafloor deformation and the resulting coastal tsunami amplitudes due to 12 splay fault scenarios. Figures S3 and S4 show the initial seafloor deformation and the resulting coastal tsunami amplitudes due to 12 landslide scenarios.
Table S1. Parameters of all splay fault scenarios used in the main article.
Table S2. Parameters of all landslide scenarios used in the main article.
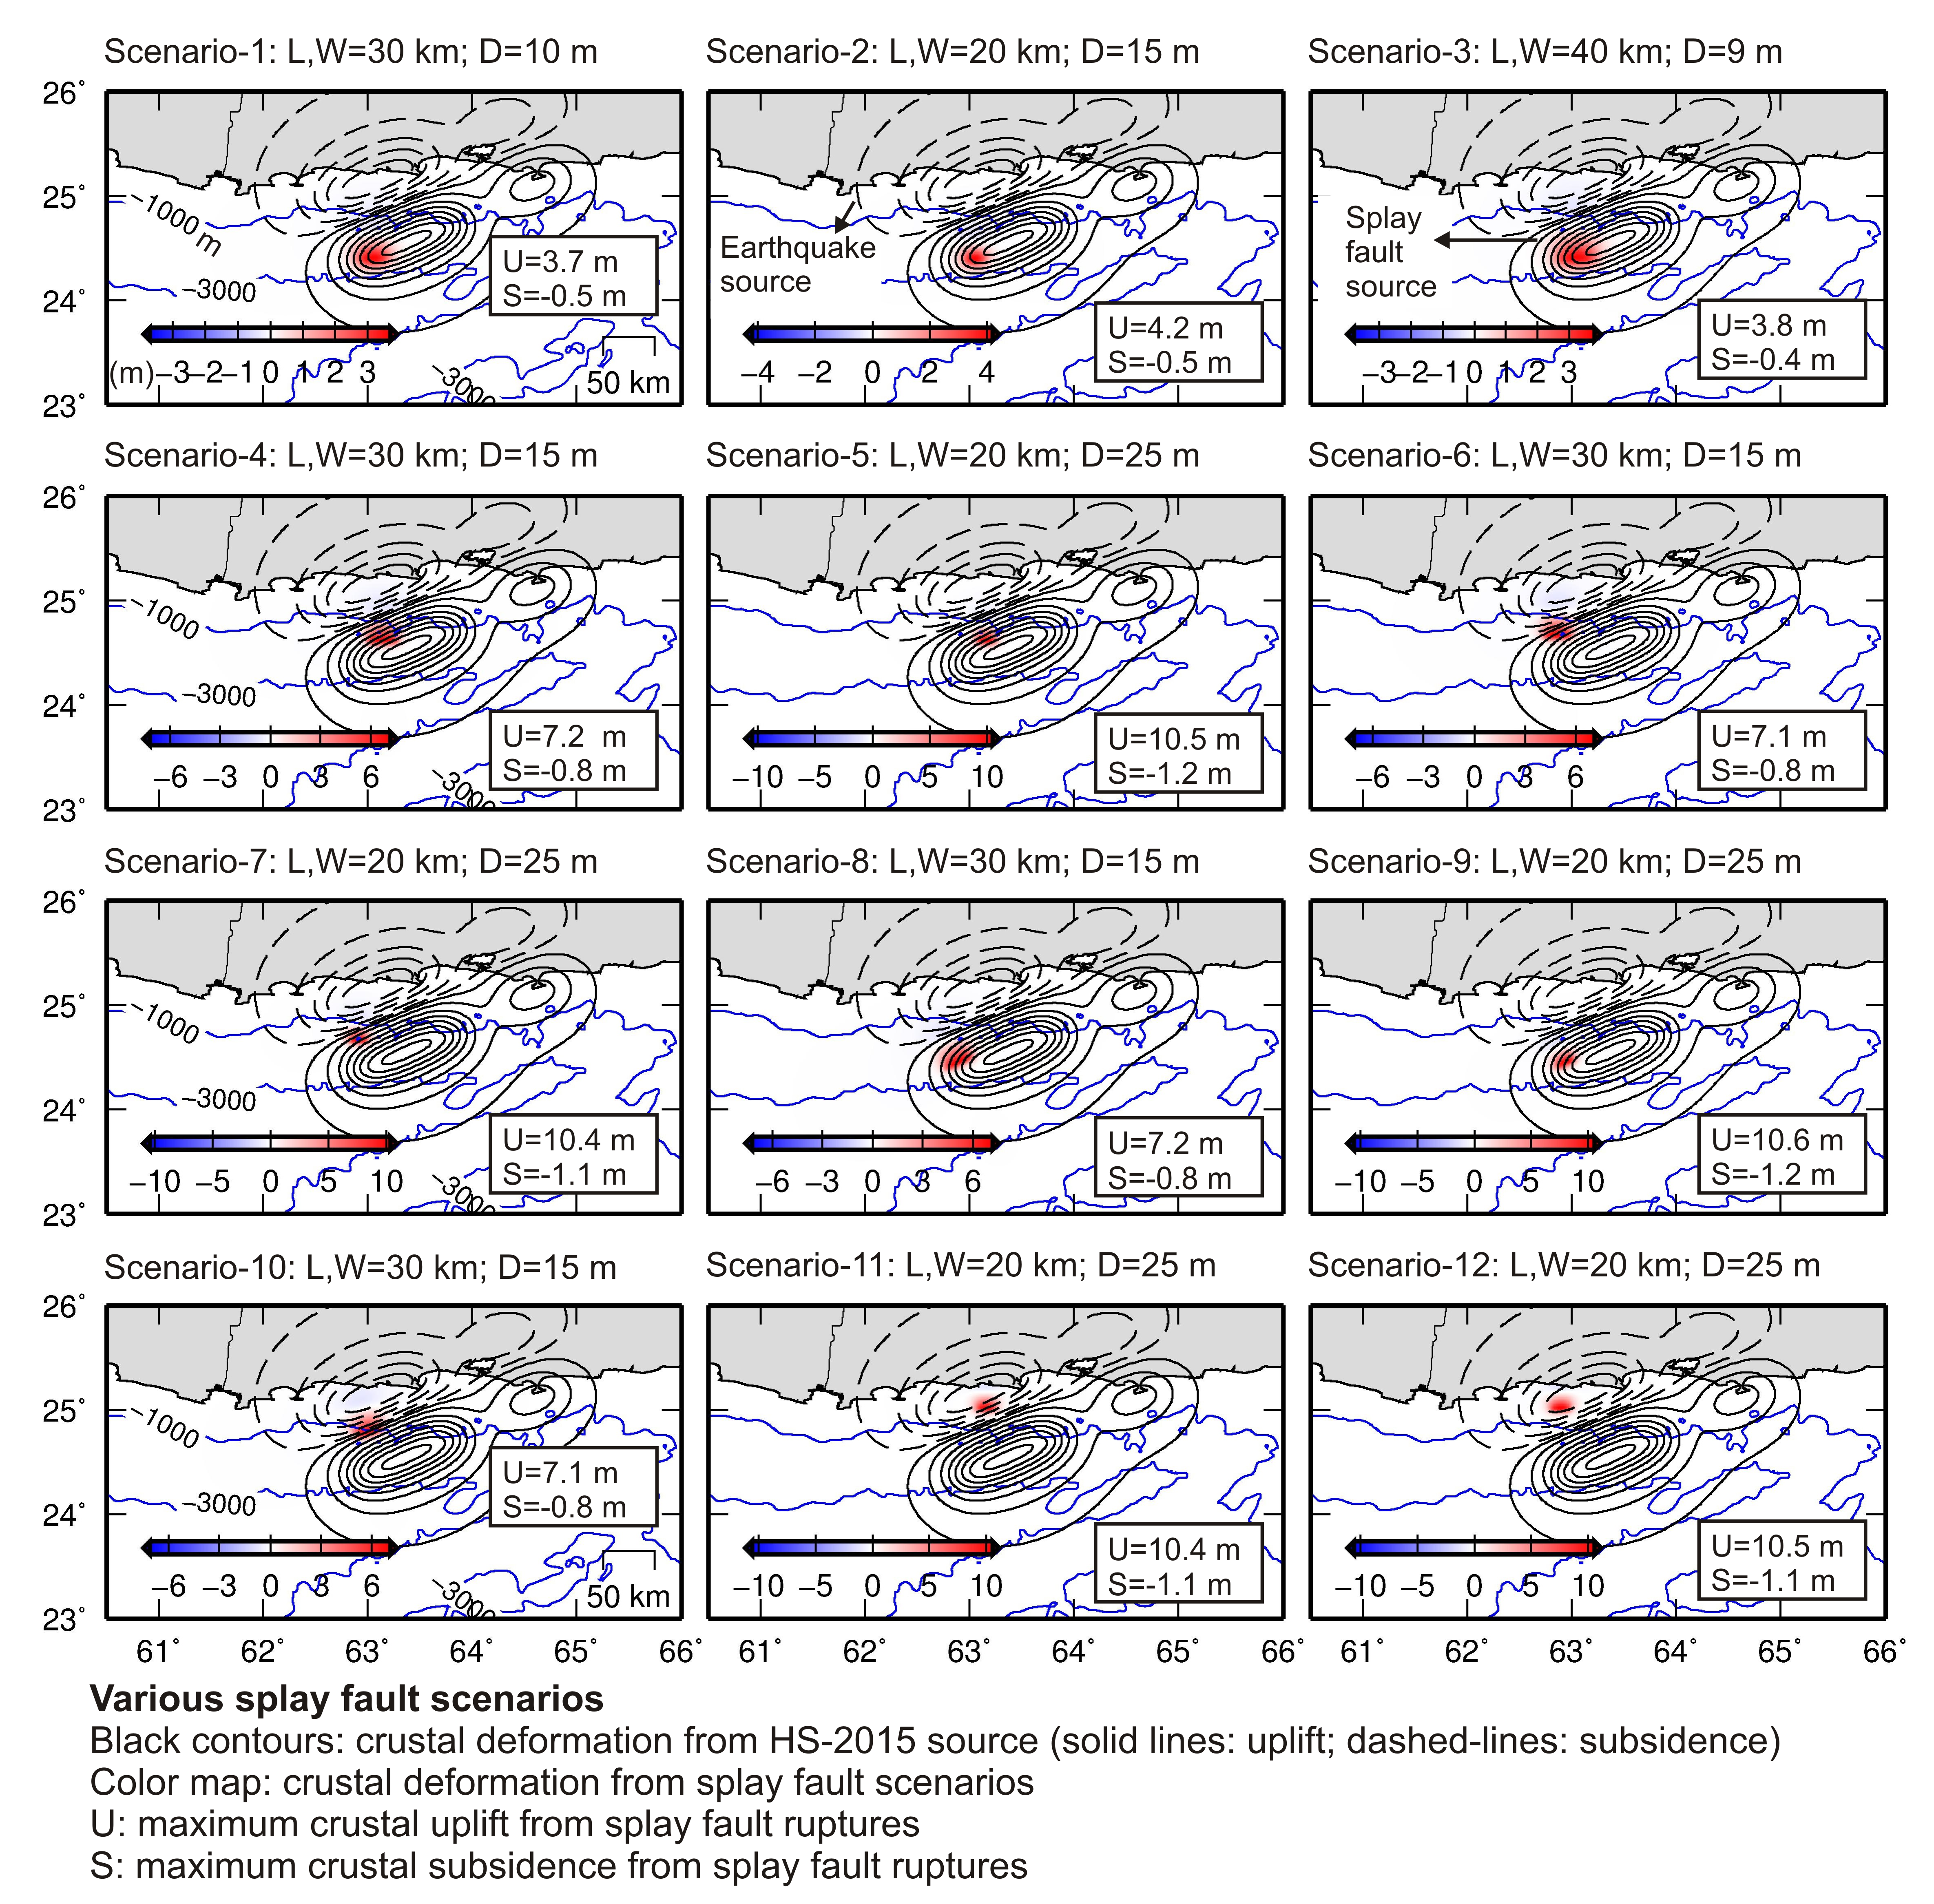
Figure S1. Map showing the locations of all 12 splay fault scenarios used in the main article along with the seafloor deformations generated by them (color maps in meters). Black contours show crustal deformation generated by the earthquake source of Heidarzadeh and Satake (2015; hereafter HS-2015). Blue contours show bathymetry in meters. U, uplift; S, subsidence; L, length; W, width; and D, displacement of the splay fault.
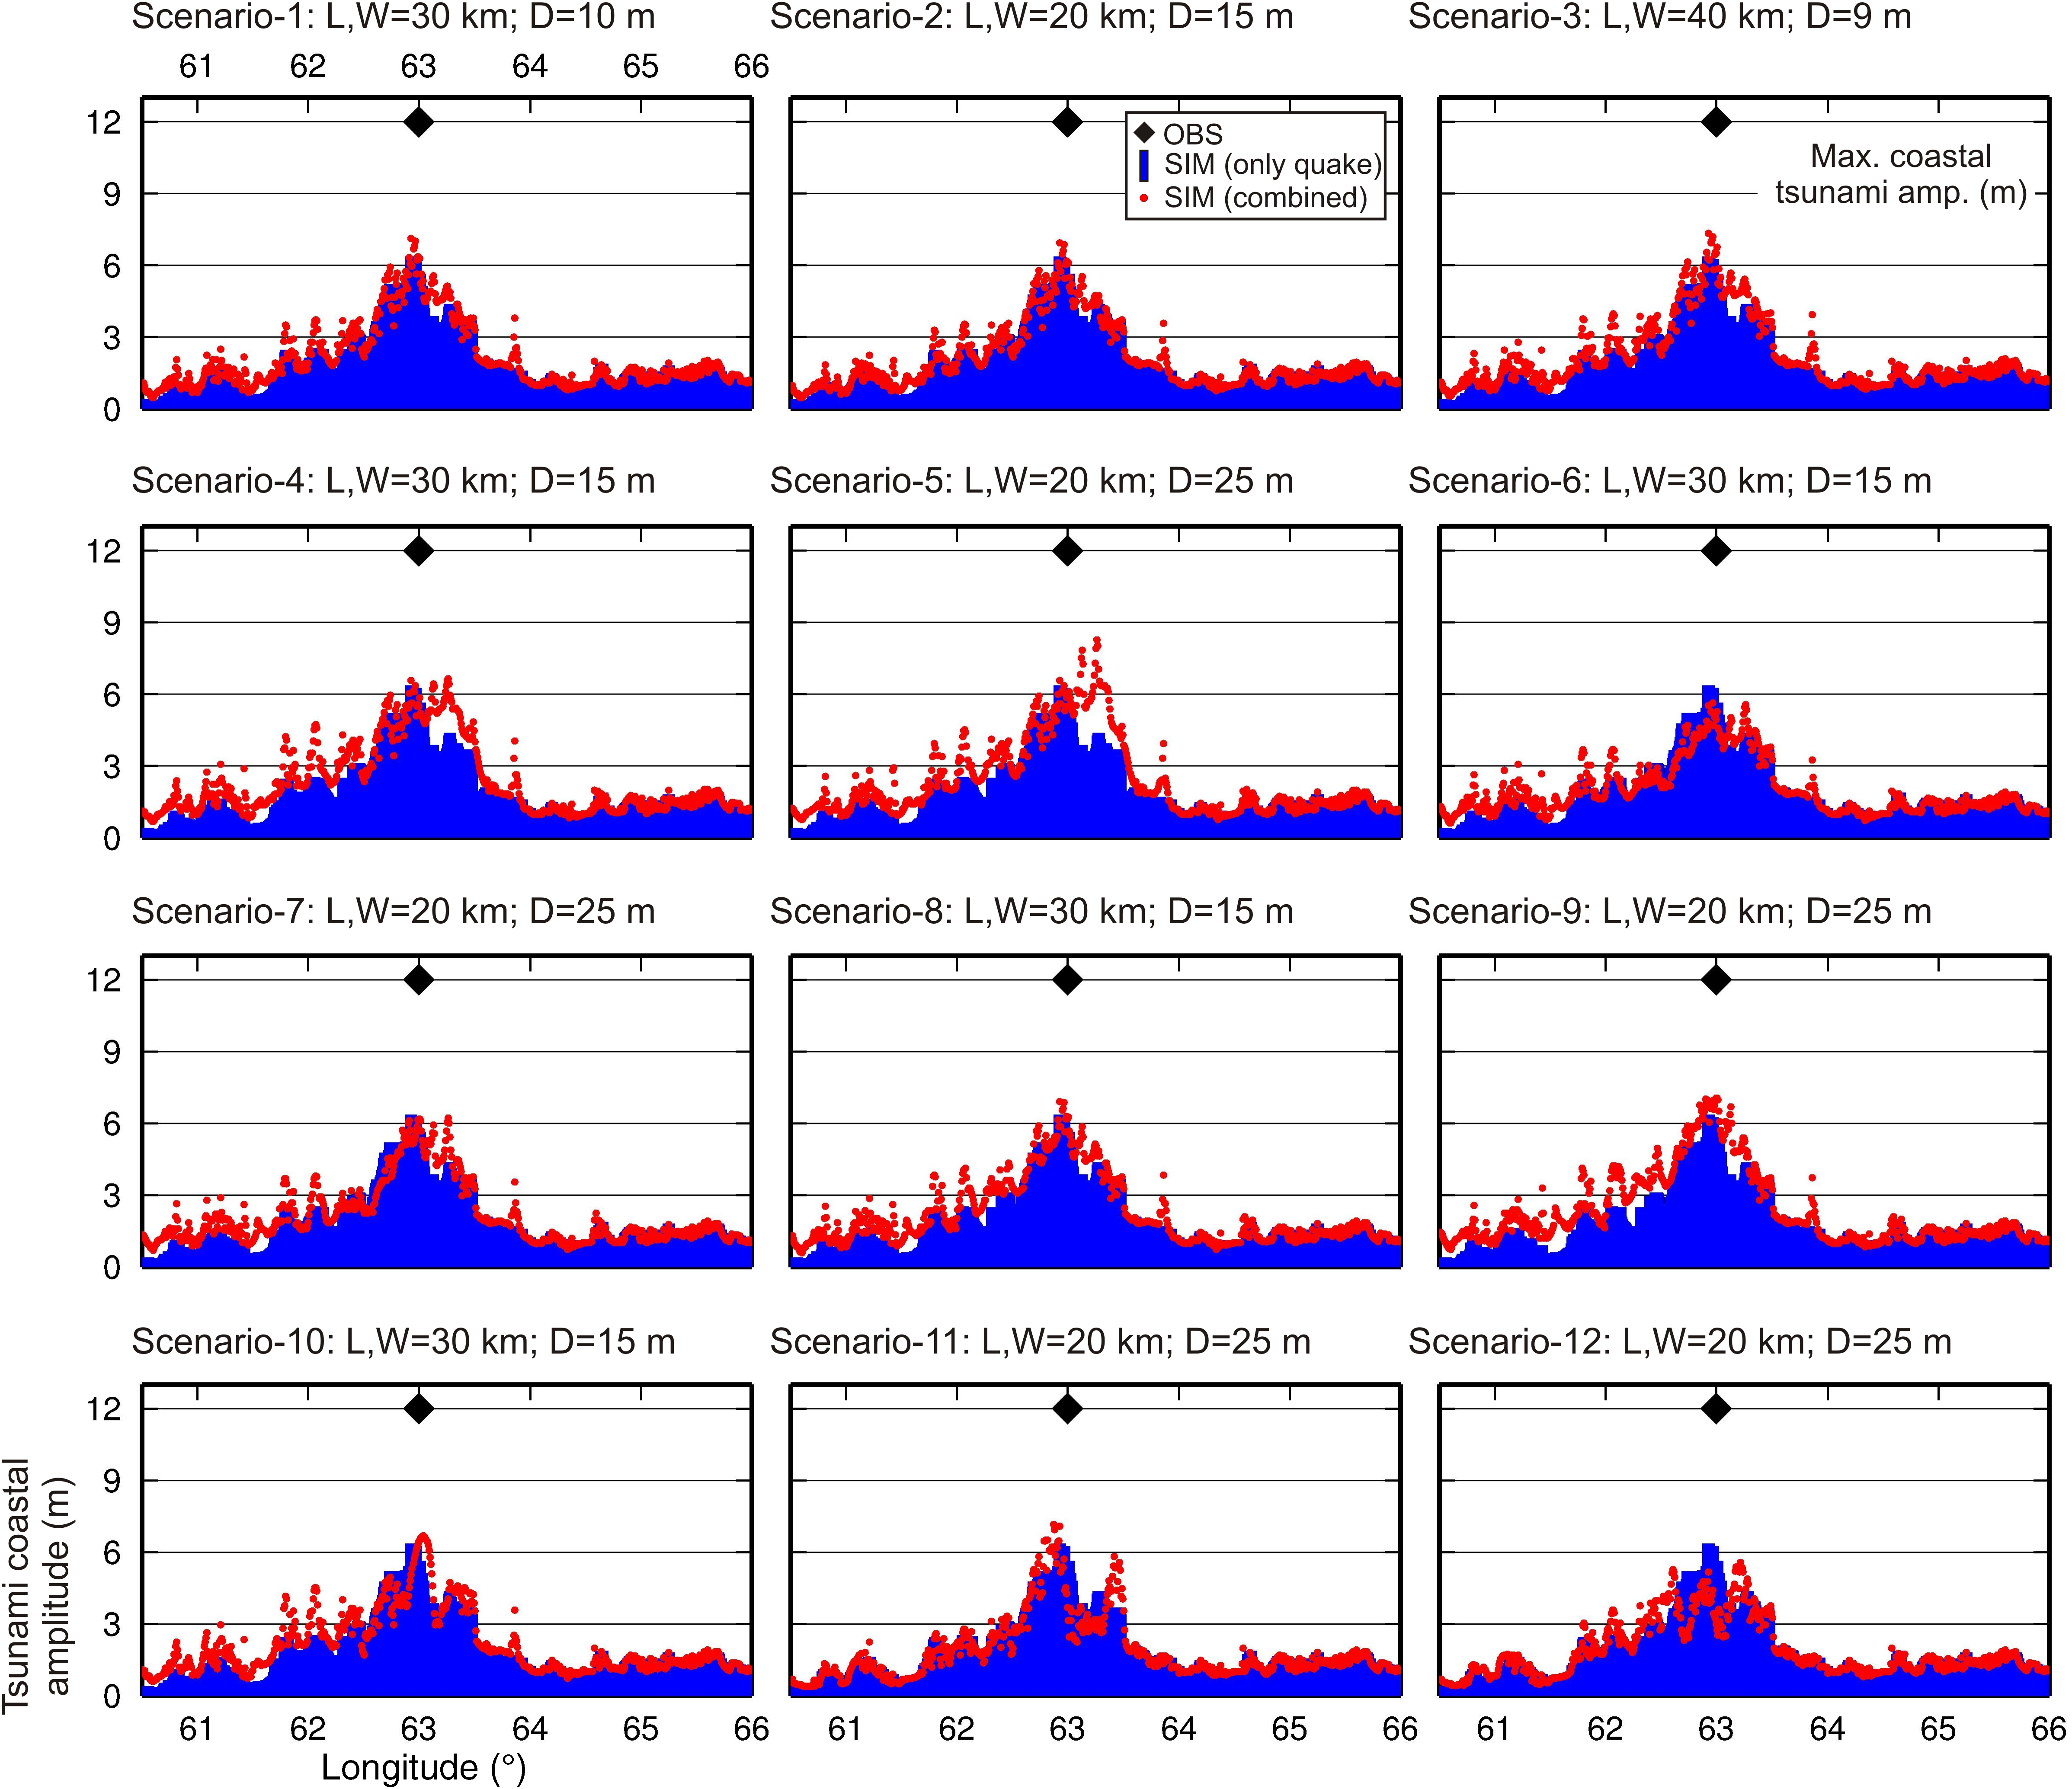
Figure S2. Coastal tsunami amplitudes generated by the combined earthquake and splay fault (red circles) for all 12 splay fault scenarios in comparison with those of only earthquake source (blue bars) and those of observations (black diamond). U, uplift; S, subsidence; L, length; W, width; and D, displacement of the splay fault.
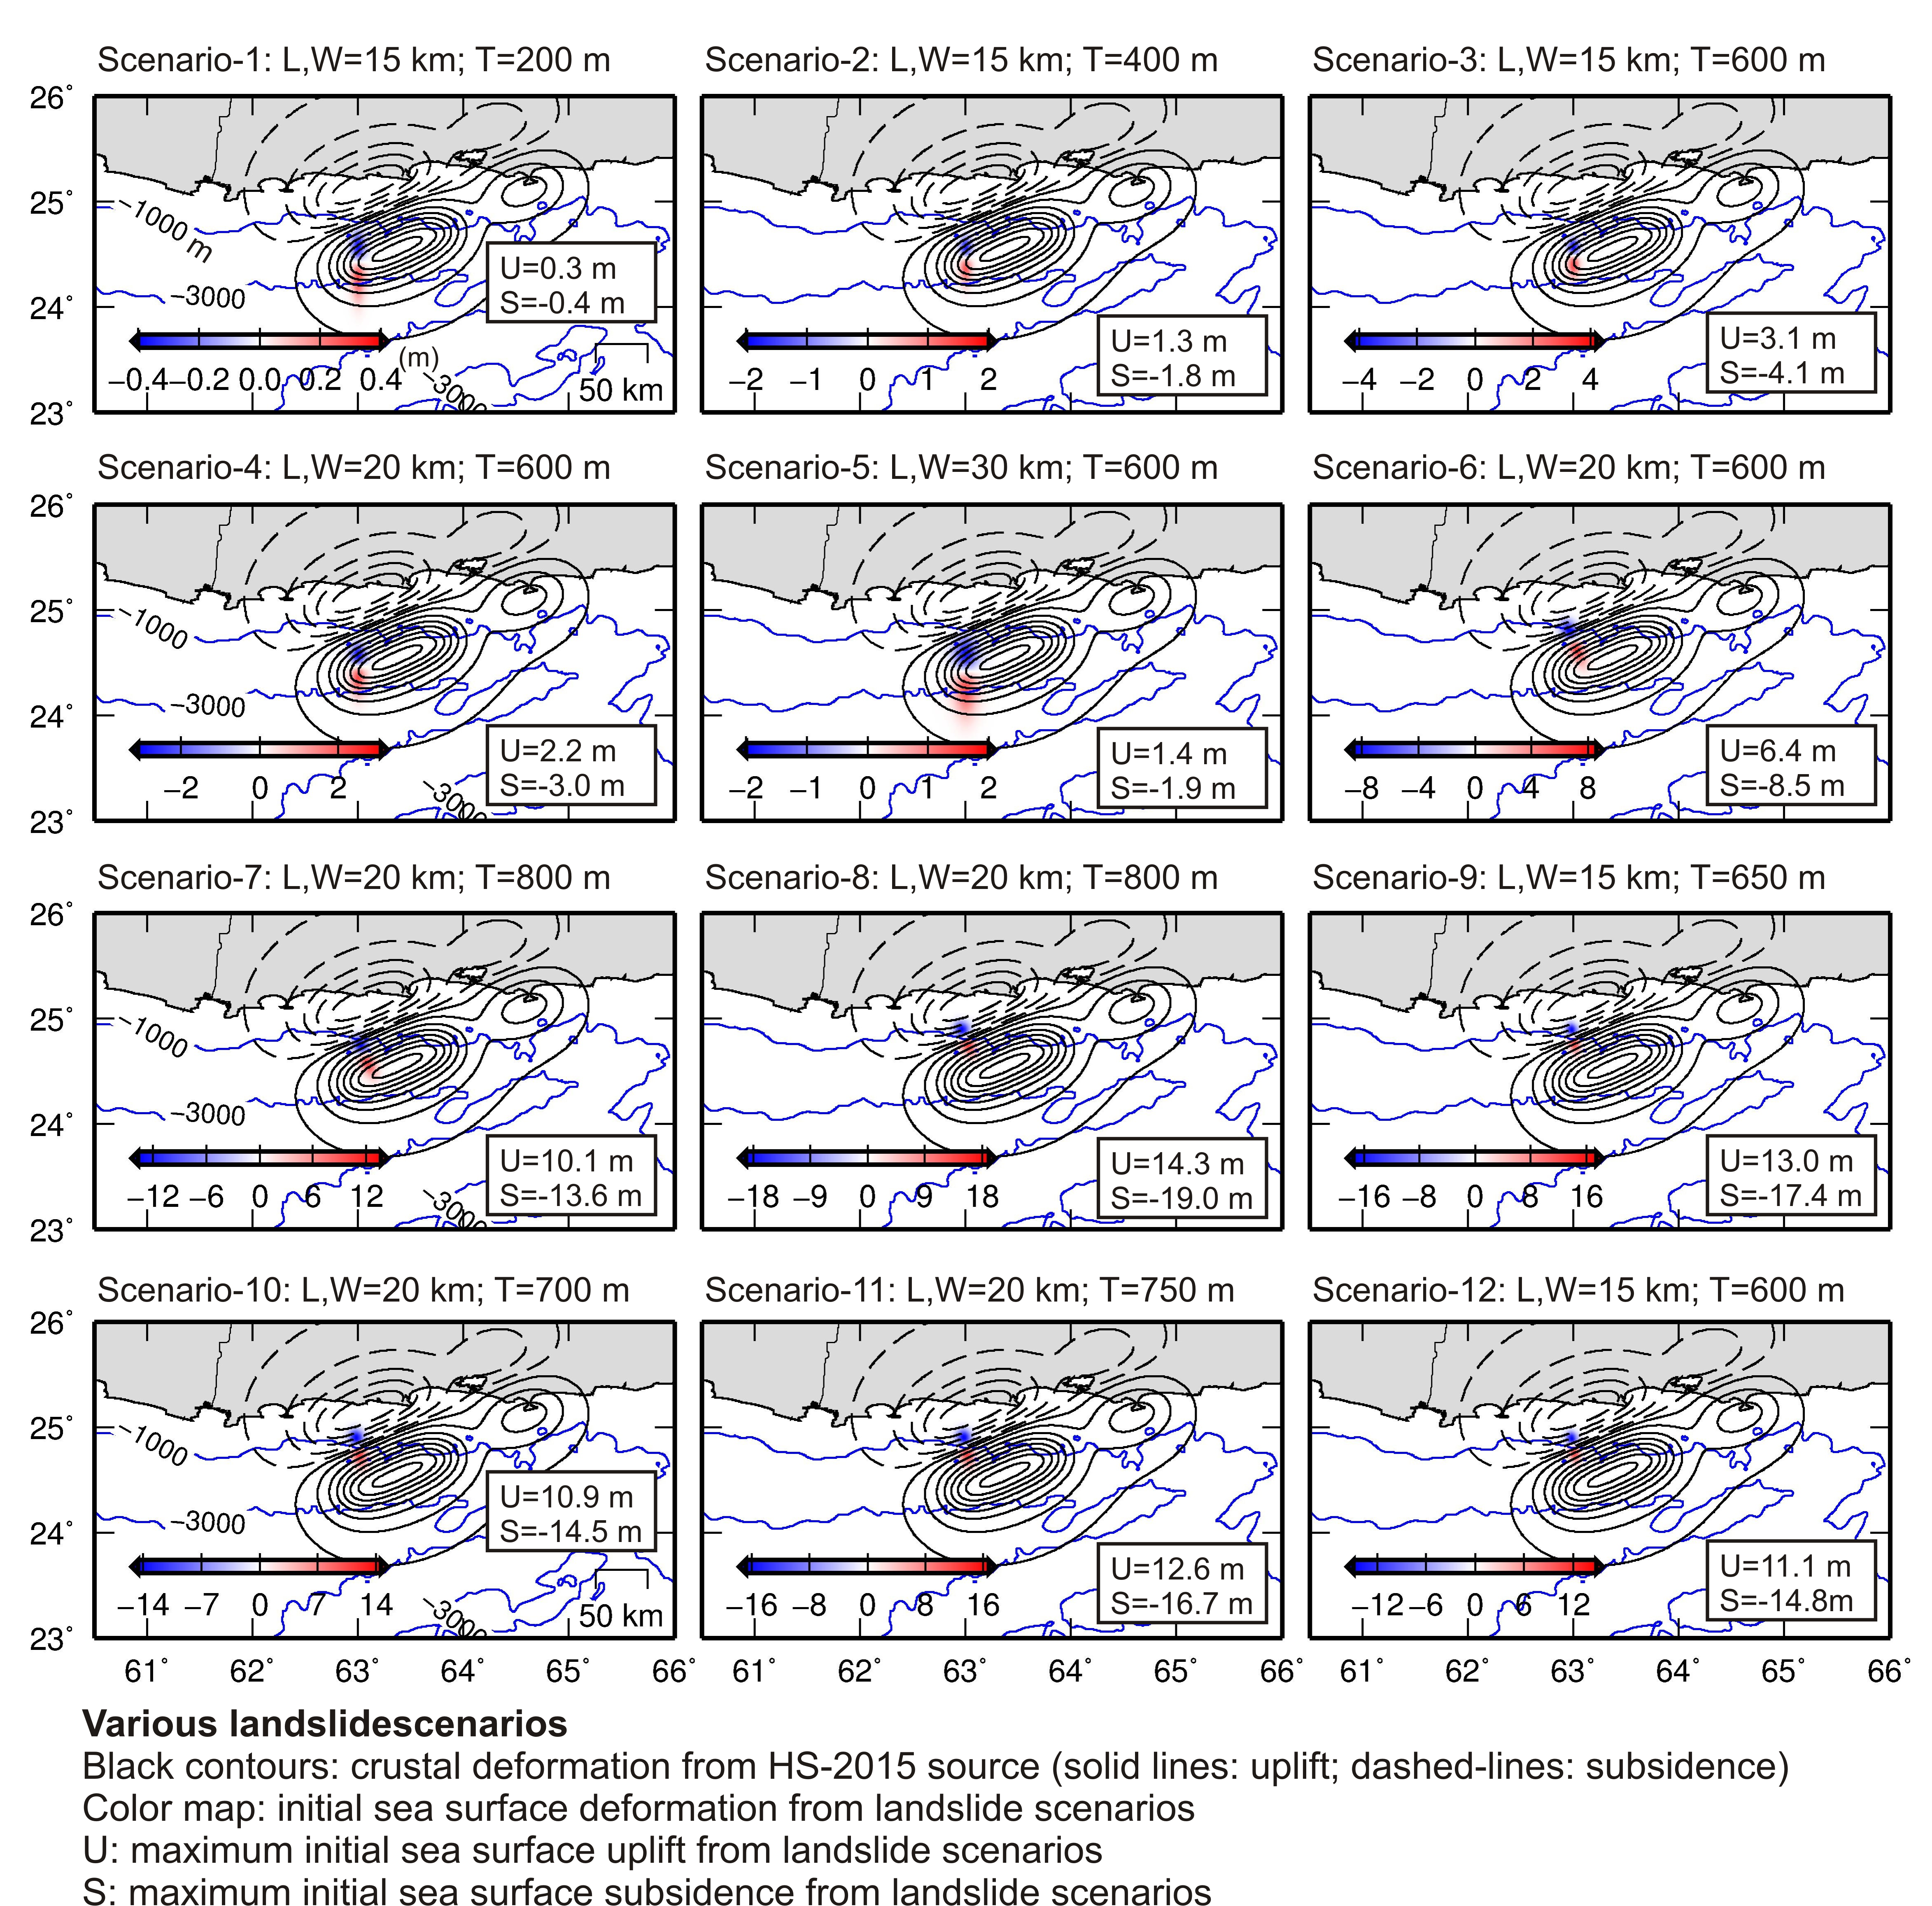
Figure S3. Map showing the locations of all 12 landslide scenarios used in this study along with the initial sea surface amplitudes generated by them (color maps in meters). Black contours show crustal deformation generated by the earthquake source of HS-2015. Blue contours show bathymetry in meters. U, uplift; S, subsidence; L, length; W, width; and D, displacement of the splay fault.
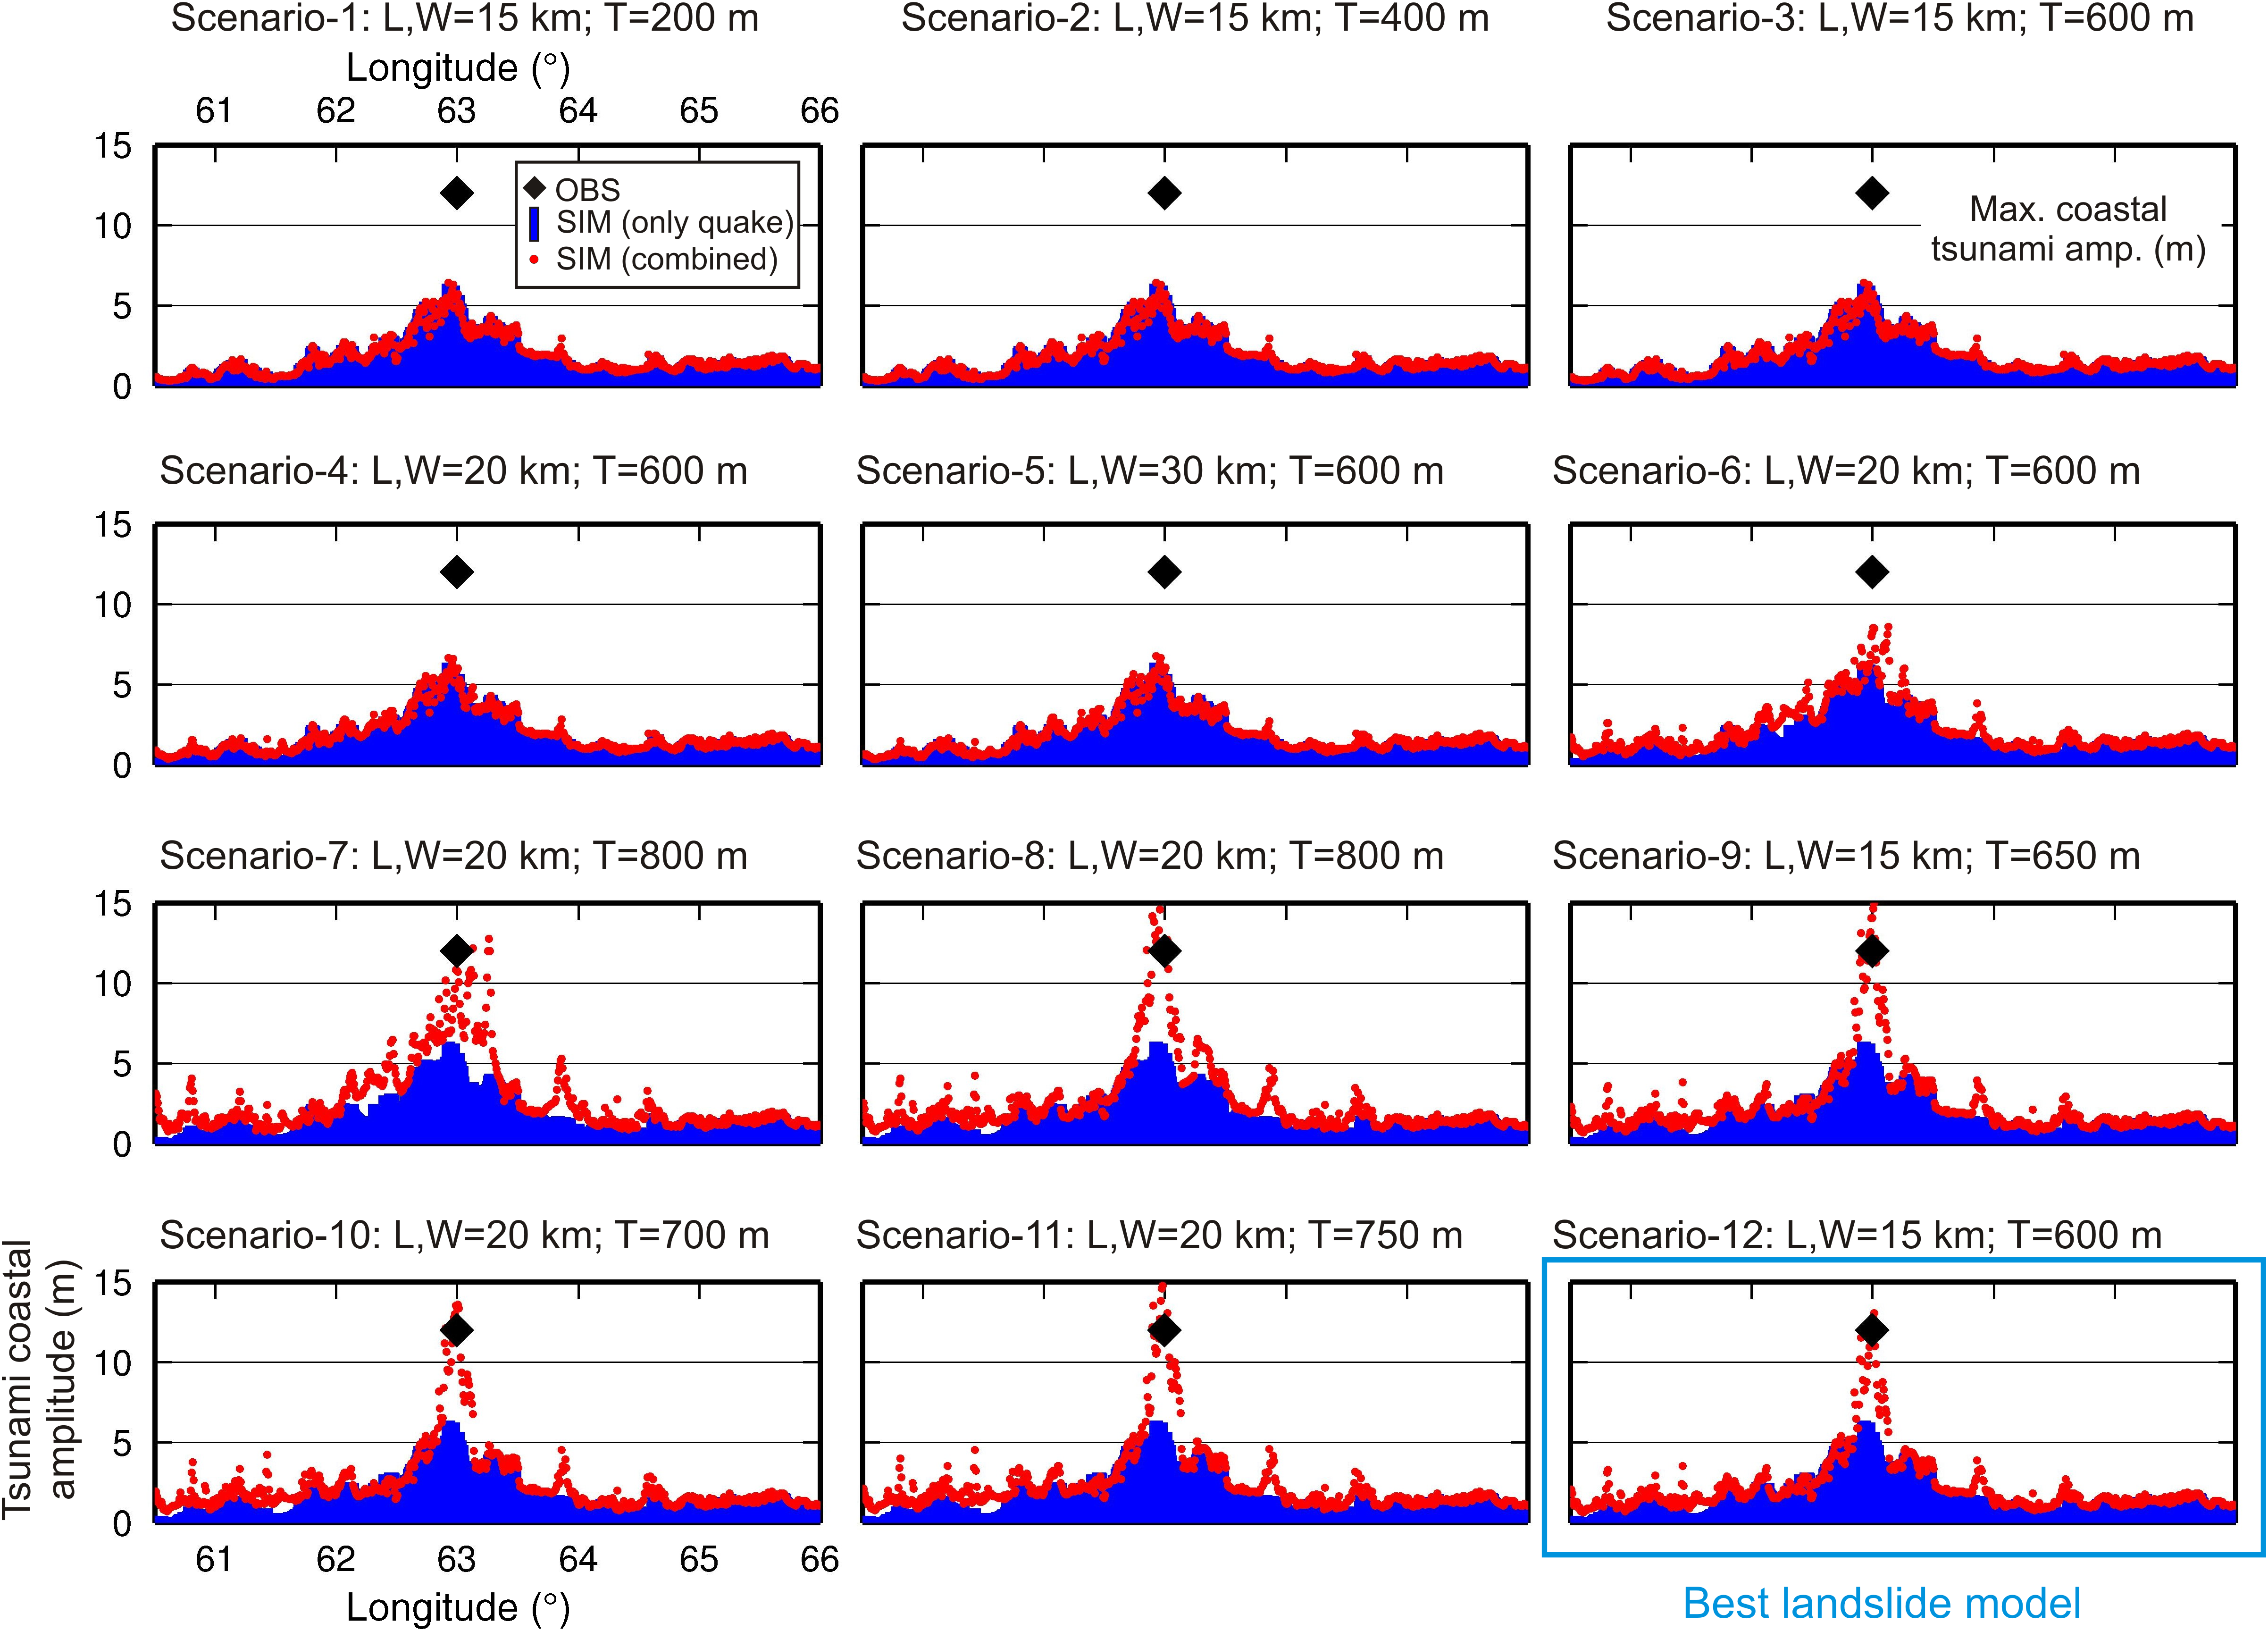
Figure S4. Coastal tsunami amplitudes generated by the combined earthquake and landslide scenarios (red circles) for all 12 landslide scenarios in comparison with those of only earthquake source (blue bars) and those of observations (black diamond). U, uplift; S, subsidence; L, length; W, width; and D, displacement of the splay fault.
Enet, F., and S. T. Grilli (2007). Experimental study of tsunami generation by three-dimensional rigid underwater landslides, J. Waterw. Port Coast. Ocean Eng. 133, 442–454.
Heidarzadeh, M., and K. Satake (2015). New insights into the source of the Makran tsunami of 27 November 1945 from tsunami waveforms and coastal deformation data, Pure Appl. Geophys. 172, nos. 3/4, 621–640.
[ Back ]