|
|
Publications: SRL: EduQuakes |
EduQuakes
November/December 2006
Classroom Seismographs and the Challenge of Encouraging a Culture of Scientific Inquiry in K–12 Schools
Alan L. Kafka, John E. Ebel, Michael Barnett, Anastasia Macherides-Moulis, Leslie Campbell, and Steve E. Gordon
Curiosity about how the world works, and systematic reasoning to investigate what we are curious about—these lie at the heart of what it means to be a scientist. In our experience with operating seismographs in K–12 schools, we are finding that what it means to be a student (and a teacher) is often very different. While curiosity does seem to be alive and well in the minds of young elementary school children, it is sadly less and less apparent as students progress through the later years of elementary school and beyond (e.g., National Research Council 2000). Furthermore, we are finding that few K–12 science teachers tend to dwell within a culture of curiosity and scientific investigation. We are thus experiencing a noticeable culture gap when we collaborate with teachers and students on educational seismology projects.
Theoretically, seismographs-in-schools projects provide an opportunity for us to encourage curiosity and a culture of inquiry and scientific investigation in K–12 schools and to give young students a full appreciation of the nature of scientific inquiry. But then we hit this culture gap: Often the students do not show evidence of curiosity, nor do the teachers appear able or willing to model and reinforce such curiosity. How then might we promote the development of curiosity and scientific reasoning in K–12 schools? To foster new generations of scientists and scientifically literate citizens will require teachers who are themselves comfortable with inquiry and the open-ended nature of research. And so we face a conundrum, as the teachers with whom we seek to collaborate are themselves products of an educational system that is sorely lacking a culture of curiosity and inquiry. This presents a formidable challenge. In this article, we describe our efforts to encourage a culture of inquiry and scientific investigation in K–12 schools as part of our Boston College Educational Seismology Project (BC-ESP), which currently includes educational seismographs in a dozen schools in the Boston area (http://www2.bc.edu/~kafka/SeismoEd/BC_ESP_Home.html).
A simple example highlights the difference between the culture of science and the culture we have found in K–12 schools: finding the optimal location for the seismograph in a classroom. This would appear to be an excellent opportunity to solve a problem through hypothesis testing and experimentation, and it does not require sophisticated scientific training to think through how to investigate this problem. We naively assumed that the mere presence of the seismograph in the classroom would create a sense of team effort to solve problems like this, but we are finding that many of the teachers would rather just “ask the experts” what the best location is. Even when the “experts” suggest moving the instrument to another location and observing the difference in background noise, the teachers will almost always wait for us to come to the school to do the moving.
We do not blame the teachers for this lack of interest in scientific inquiry. Rather, this situation is often the result of a lack of confidence and understanding of scientific content and inquiry. For instance, 93% of students in grades 5–8 are taught by teachers who have little or no training in the physical sciences (National Center for Education Statistics 2003), and as a result of this lack of background many teachers often lack confidence in their ability to conduct scientific inquiry (Weiss et al. 2003). Therefore, a question that we must ask ourselves as an educational seismology community is how can we improve teacher confidence and reduce the barriers that prevent teachers and students from engaging in scientific inquiry in classrooms. We have been attempting to implement our BC-ESP program with that goal in mind.
In our thinking about the implementation of our BC-ESP program, we have come to view scientific inquiry as consisting of four levels of engagement. The first level is the “Wow, we recorded an earthquake!” level, i.e., the simple excitement of students having recorded a distant earthquake with their own seismograph. It is truly fascinating that it is possible to record earthquakes at great distances using seismographs. The students certainly seem to appreciate this, and this is a level of engagement that we certainly can reach in all of our BC-ESP classrooms. If this were the only benefit of having a seismograph in a classroom, the effort might still be worth it, but this is hardly the ideal that seismologists had in mind when they developed the concept of seismographs in K–12 classrooms.
The next level of engagement is “basic inquiry,” which involves such things as exploring what seismic waves are recorded on your seismogram of an earthquake and investigating how this seismogram is different from that of other earthquakes you recorded. This level of inquiry is primarily observational with moments of richer scientific experience embedded and has been reached in some of our BC-ESP classrooms—but all too often, the participants are satisfied with the first level of engagement.
The third level of engagement involves making systematic observations, such as maintaining databases of recordings, plotting graphs of observations, and classifying how one type of observation varies as a function of another. Although this type of inquiry is at a more sophisticated level than “basic inquiry,” we have more often achieved this level of engagement than the second level. This is primarily because we force the issue through specific curriculum exercises, such as earthquake tracking and an exercise we developed to determine the classroom seismograph’s sensitivity to earthquakes of different sizes and at different distances from the school. It is quite rare, however, that the teachers or students decide by themselves that something recorded on their seismograph is worth keeping track of in a systematic manner, and it is particularly rare for them to see graphing and organizing data as tools for investigating something they are curious about.
The fourth level is looking for patterns in the seismograms and possibly discovering something that wasn’t known before. This does not need to be a “great discovery”; small discoveries occur all the time in scientific investigations. For example, the students might discover that if they locate their seismograph in a particular corner of the room, they record earthquakes better. Or, they might discover that magnitudes tend to be lower than the officially reported magnitudes when they calculate them from their own school’s seismograph. Unfortunately, this level of engagement is, even in the best of situations, left to the “experts.”
An essential goal for us then is to encourage our teacher and student colleagues to raise their experience of science to higher levels of engagement and to encourage them to experience firsthand what it means to be a scientist. There are many excellent resources available for science education based on seismology (e.g., http://web.ics.purdue.edu/~braile/indexlinks/educ.htm, http://www.jclahr.com/science/earth_science, http://www.iris.edu/about/ENO), and in developing our BC-ESP curriculum, we have borrowed from some, adapted from others, and developed some of our own (e.g., Barnett et al. 2005). Below are examples of classroom projects that we use to encourage inquiry in our BC-ESP schools.
We like to begin our BC-ESP curriculum experience with an inquiry-based exercise in which the students are asked to build their own seismograph. The purpose of this exercise is to give them an opportunity to figure out for themselves what it takes to design and build an instrument that records ground motion. The students are given a variety of materials (such as tape, straws, empty paper towel rolls, glue, rubber bands, springs, marbles, etc.) and are instructed to build an instrument that can detect motion. They are encouraged to think through this problem from first principles to determine what attributes a seismograph should have in order to detect motion.
Having encouraged the students to think about what it takes to record earthquakes, another inquiry-based exercise that we use is earthquake tracking. This exercise was modeled after the epicenter plotting exercise described by L. W. Braile and S. J. Braile (2001) (http://www.web.ics.purdue.edu/~braile/edumod/epiplot/epiplot.htm, which provides a simple yet effective way for students to directly experience the concepts underlying earthquakes and plate tectonics. Each week, the students plot on a map of the Earth all earthquakes of magnitude = 5.0 that occurred during that week. As the weeks progress, the students construct a cumulative plot that eventually includes earthquakes that occurred during an entire school year. They initially observe a distribution of epicenters that seems random, but after about a month, they see patterns developing, and the Pacific Ocean’s “Ring of Fire” begins to emerge from the scatter. By the end of a few months other plate boundaries begin to emerge.
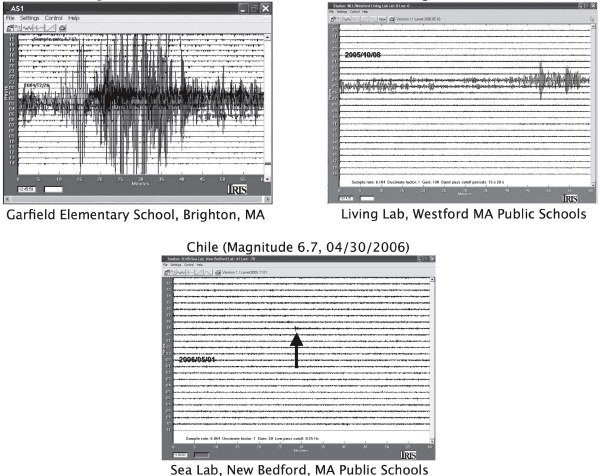
▲ Figure 1. (A) The great Sumatra earthquake of 26 December 2004 (magnitude 9.0) recorded by an AS1 seismograph operating in a classroom at Garfield Elementary School in Brighton, Massachusetts. (B) The magnitude 7.6 earthquake in Pakistan that occurred on 8 October 2005 recorded by an AS1 seismograph operating at the “Living Lab,” a science program for K–5 students operated by the Westford, Massachusetts, public schools. (C) The magnitude 6.7 earthquake that occurred in Chile on 30 April 2006 recorded by an AS1 seismograph operating at Sea Lab, a science education center of the New Bedford, Massachusetts, public schools. Although the signal from this earthquake is weak, it is definitely observable on the seismogram (dark arrow).
When students walk into their classroom and see the seismograph screen on the day of a very well-recorded earthquake, it is hard to miss that an earthquake was recorded (figure 1). However, most of the time the screen shows much less dramatic vibrations, such as students walking near the seismograph, people slamming doors, large trucks passing by the building, and natural non-earthquake vibrations such as wind. By observing the seismograph screen on a regular basis, the students can eventually learn to recognize when an earthquake has been recorded, and they can learn a lot about the different types of earthquake signals they recorded. To help them with this inquiry, we developed an exercise in which they are shown examples of earthquakes already recorded on AS1 seismographs, ranging from very dramatic (and hard to miss) recordings of earthquakes to very subtle ones that are hard to identify (figure 1). With these examples as a guide, they are asked to identify different types of signals so they can learn how to recognize the “fingerprints” of an earthquake on their seismogram and to distinguish earthquake signals from other types of recorded vibrations. This exercise is later followed by more formal instruction on seismic wave propagation and the various types of waves that are generated by earthquakes.
When a significant earthquake occurs, many of the BC-ESP participants are indeed curious to know (from the experts) if they recorded it, but they are often reluctant to think through the answer by themselves by analyzing the size of the earthquake, the distance of the earthquake from their school, and what earthquakes have previously been recorded at their school. To encourage them to think through this problem by themselves, the students are asked to make a plot of earthquakes recorded versus not recorded by their seismograph (see figure 2). There should be a curve on that graph representing the threshold for how big an earthquake must be at a given distance in order for them to record it. Figure 2 shows our results for the AS1 seismograph operating at Boston College. The students’ results will be similar, but not identical, to the results shown in figure 2, because their site is different from the Boston College site (the fact that the results are different is also an opportunity for a rich scientific discussion). Once they have constructed a plot for their classroom seismograph like the one shown in figure 2, they should be able to predict in advance whether an earthquake that has occurred somewhere in the world is big enough that it is likely to be recorded by their seismograph.
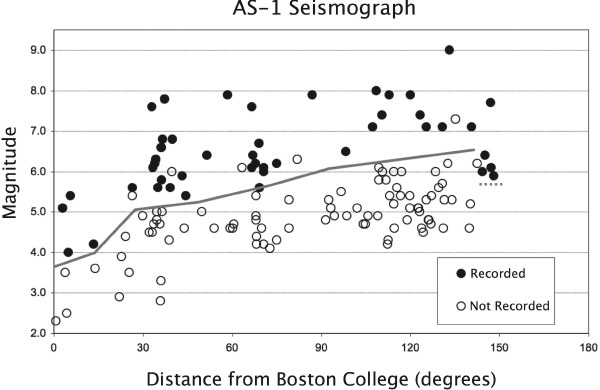
▲ Figure 2. Plot of earthquakes recorded (closed circles) versus not recorded (open circles) by the AS1 seismograph operating at Boston College. The gray curve is an estimate of the threshold for how big an earthquake must be at a given distance in order for the AS1 to record it at this particular site. Dashed line corresponds to unusually strong signals from “PKP” waves that travel through the Earth’s core and are focused in that narrow range of distances.
Although we have had some success using these exercises in introducing the students to the world of scientific research, we still face major challenges to raising the BC-ESP experience to the higher levels of engagement in scientific inquiry. For example, we would like to engage the students in a more active role in monitoring earthquakes. Monitoring of natural phenomena is one of the core activities of geoscientists, and when seismologists originally conceived of the idea of seismographs in schools it was expected that the students would use their seismographs and data on the Internet to monitor earthquakes on a daily basis. Unfortunately, however, in the case of earthquakes, the concept of using a scientific instrument to monitor a natural phenomenon has not been easy for us to integrate into the routine of a K–12 classroom. Typically, the teachers and students will do the earthquake tracking exercise when they are told to and will check their seismograph if we specifically remind them to, but if other competing issues arise in the classroom, earthquake monitoring is often dropped for weeks at a time. This is not particularly surprising given that most teachers are increasingly discouraged by their district leaders from inquiries that are not directly related to the material that will be covered by standardized tests (Falk and Drayton 2004), or they are unsure of how to guide and lead their students in such inquiries. Thus, unless there happens to be a teacher and/or some students who are particularly engaged in this project, the participants are often only aware that a major earthquake was recorded in their classroom if one of the BC-ESP staff e-mails them to ask them to check their seismograph.
Another major challenge we have encountered is in having the teachers and students develop a sense of ownership of their classroom seismograph. Part of being a scientist involves maintaining instrumentation. We encourage the teachers to learn how to operate the AS1, and there is an excellent manual describing how to operate it (Baldwin and Ortiz 2005), but very few teachers seem comfortable with the simplest of tasks involved in maintaining and troubleshooting their seismograph. Experimentation focused on identifying the optimal location of their seismograph in the classroom is a perfect teachable moment for how scientists use instrumentation to measure natural phenomena, but without direct guidance from BC-ESP staff, the teachers are reluctant to get involved. Active engagement in determining the ability to record earthquakes as a function of magnitude and distance is another ideal way for the BC-ESP participants to develop a sense of ownership of the classroom’s seismograph because the results will be unique to their particular site. Thus, we encourage the participants to maintain a magnitude-distance graph like that shown in figure 2 for their own classroom seismograph.
Scientists and science educators face major challenges in encouraging a culture of scientific inquiry in K–12 classrooms (e.g., National Research Council 2000). Here we have described some of our efforts to use classroom seismographs as a medium for addressing this issue and for introducing K–12 students to the world of scientific research. Unfortunately, the culture of the educational system in our society, the demands of the classroom, and the current emphasis on standardized tests are all impediments to creating a classroom environment in which curiosity about how the world works is valued. Nonetheless, we have been very fortunate to work with a number of K–12 teachers who do a great job of bucking this trend and encouraging curiosity and a culture of inquiry in their classrooms. Inspired by these teachers, we are optimistic that, given the right guidance and encouragement, K–12 teachers and their students can reach higher levels of inquiry (and in the process enjoy science more).![]()
REFERENCES
Baldwin, T. M., and A. M. Ortiz (2005). Seismology Instruction with AmaSeis: Installation and Use of the AS-1 Seismometer, SpiNet–Science Education Solutions, www.scieds.com/spinet/pdf/AS1AmaSeis.pdf
Barnett, M., A. L. Kafka, A. Pfitzner-Gatling, and E. Syzmanski (2005). The Living Earth: Inviting students into the world of scientific research through seismology. Journal of College Science Teaching 34 (6), 50–54.
Falk, J., and B. Drayton (2004). State testing and inquiry based science: Are they complementary or competing reforms? Journal of Educational Policy 54 (4), 345–387.
National Center for Education Statistics (2003). Qualifications of the Public School Teacher Workforce: Prevalence of Out-of-Field Teaching 1987–1988 to 1999–2000. Washington, DC: US Department of Education.
National Research Council (2000). Inquiry and the National Science Education Standards: A Guide for Teaching and Learning. Washington, DC: National Academy of Sciences, 224 pp.
Weiss, I. R., J. D. Pasley P. S. Smith, E. R. Banilower, and D. J. Heck (2003). Looking Inside the Classroom: A study of K-12 Mathematics and Science Education in the United States. Chapel Hill, NC: Horizon Research, Inc. Also available at http://www.horizon-research.com/insidetheclassroom/reports/looking/.
Weston Observatory
Department of Geology and Geophysics
Boston College
Weston, Massachusetts
kafka [at] bc.edu
(A.L.K.)
[Back]
Posted: 02 November 2006