This electronic supplement contains three tables of information about the parameters used in the automatic picking procedure. Figures S1 and S2 show the obtained results, presented as histograms illustrating the differences (dt) between the automatic arrival times and concurrent reference times (manually picked), for the GeoNet and the Provincia Autonoma di Trento (PAT) datasets. Figure S3 displays a comparison between automatically and manually determined quality classes using a matrix representation.
Table S1. Parameters controlling the automatic picking algorithm (see main article for details).
Table S2. 1D velocity models used for locating earthquakes through the HYPOELLIPSE code (steps 6 and 8 in the RSNI-picker flowchart). The expected crossover distance is also reported for each dataset.
Table S3. Coefficient values of equation 5, as derived from the Markov chain Monte Carlo method.
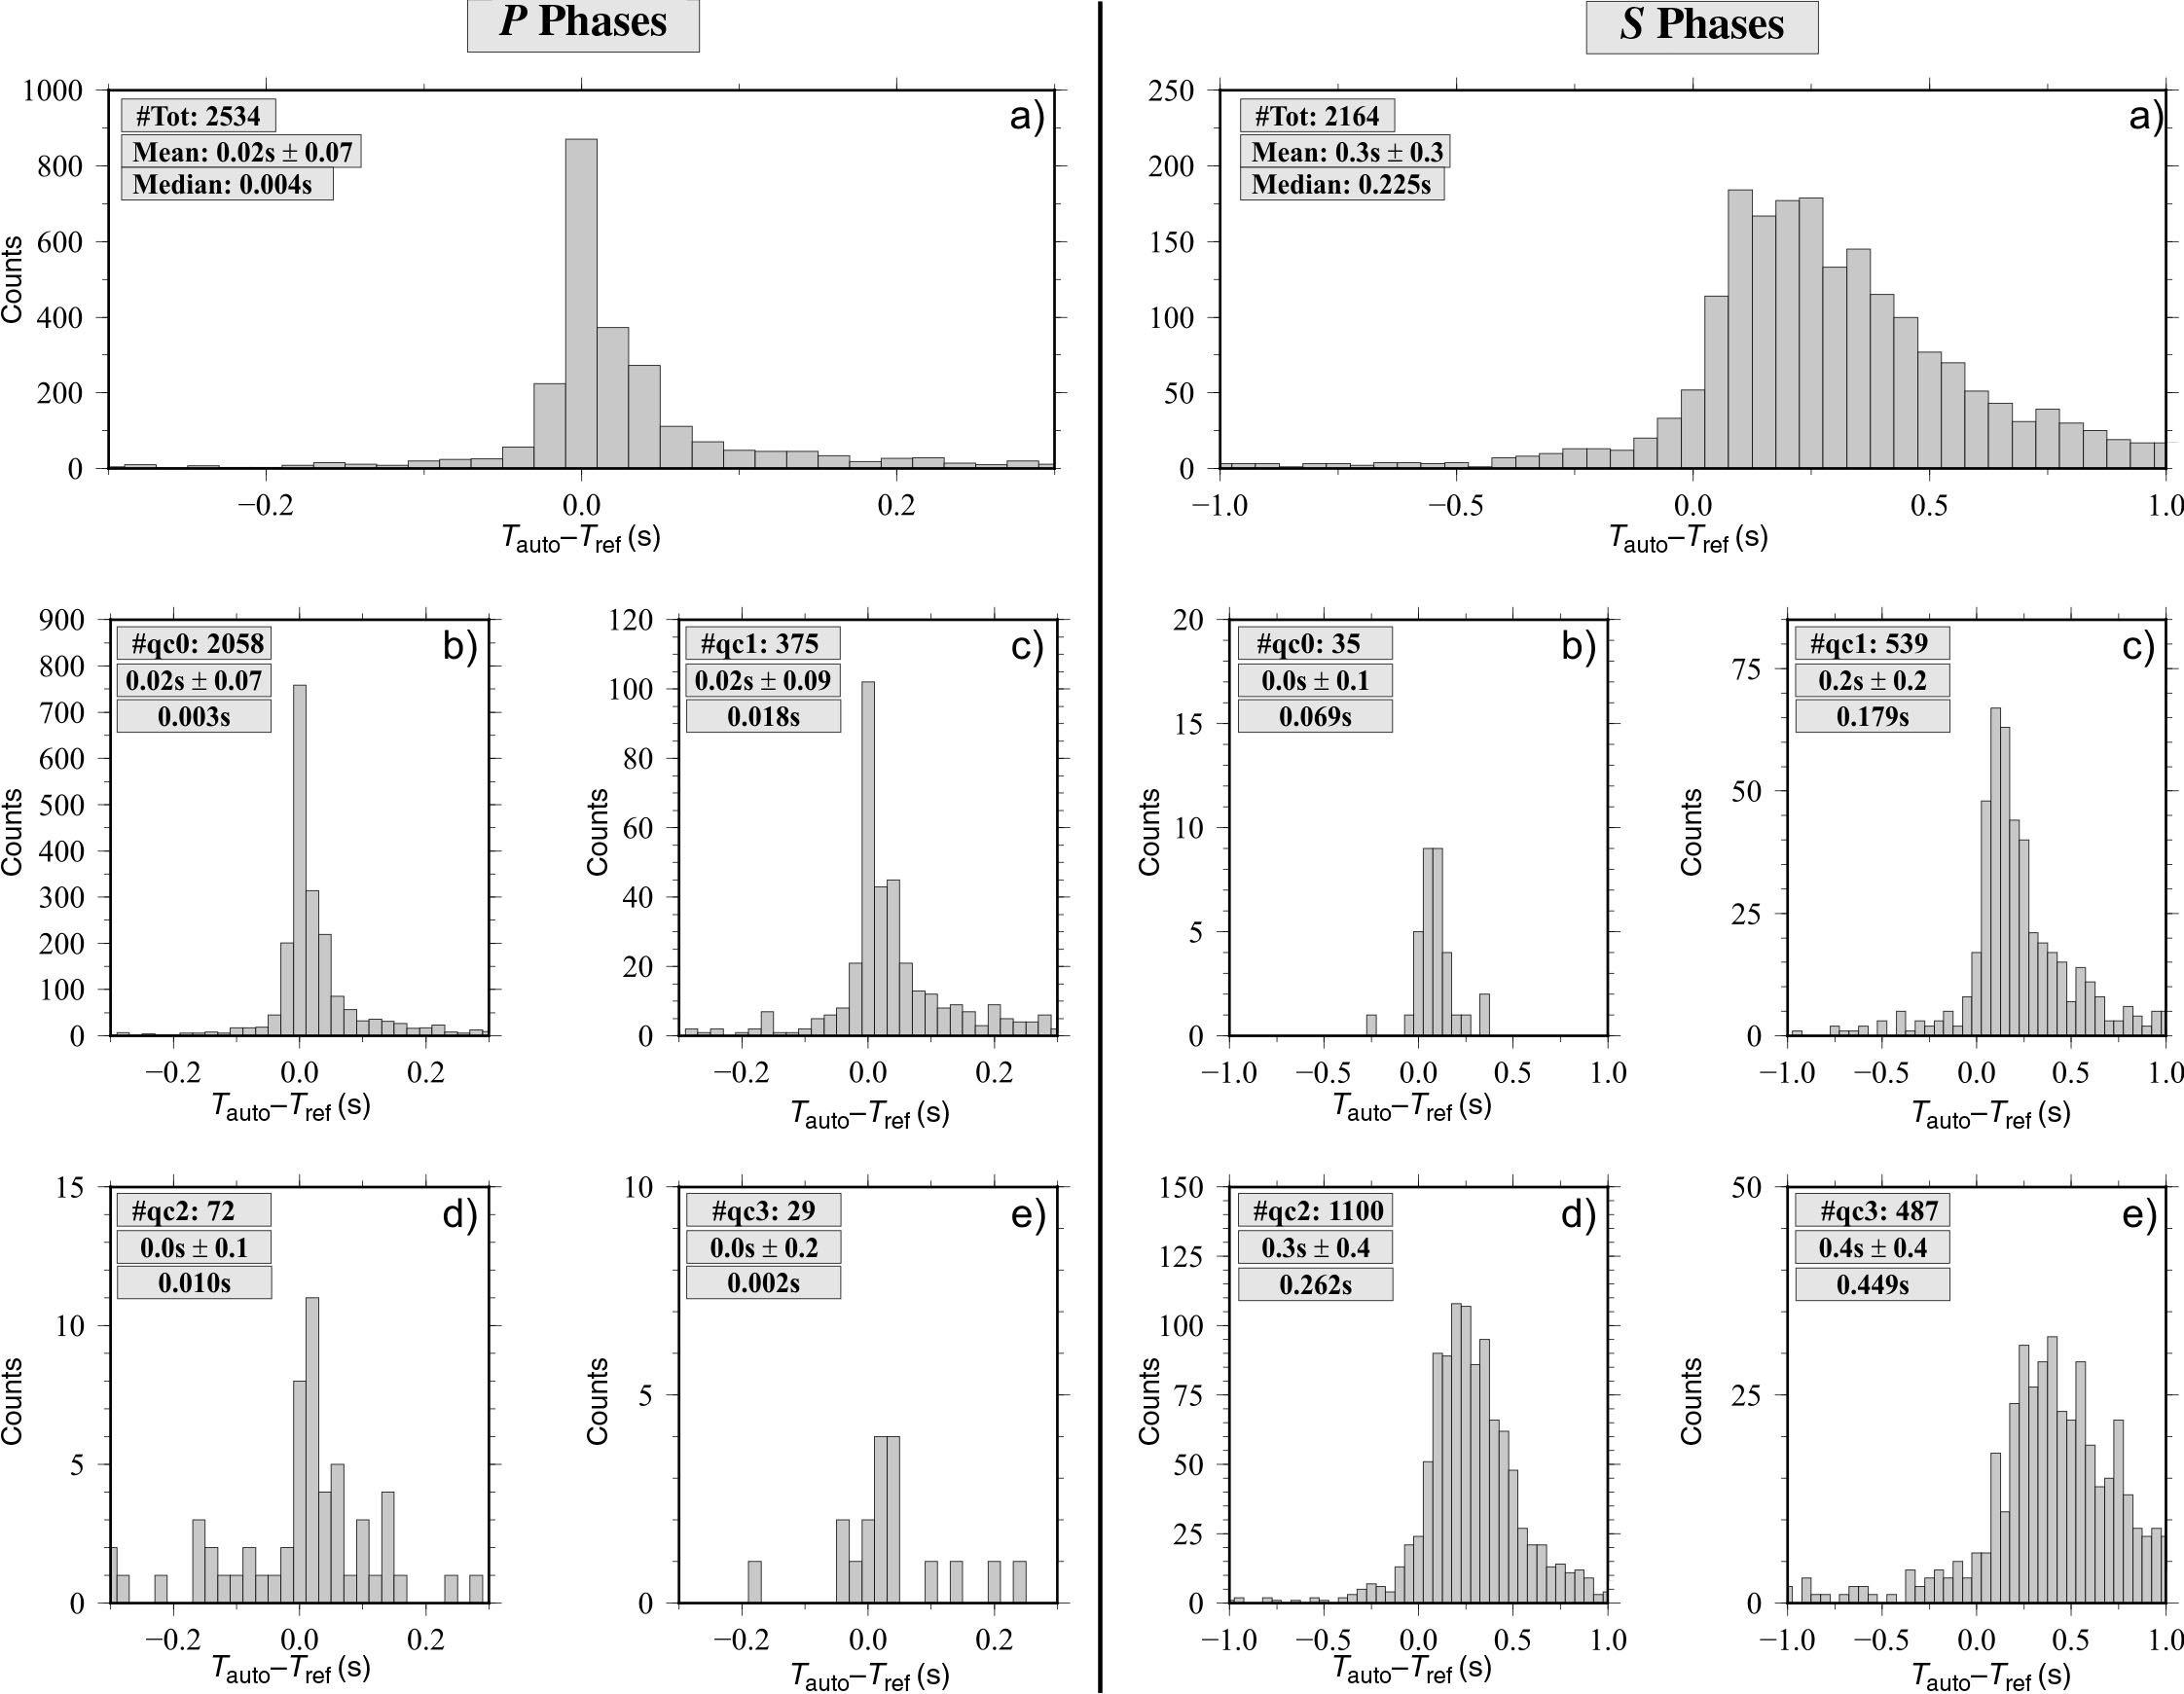
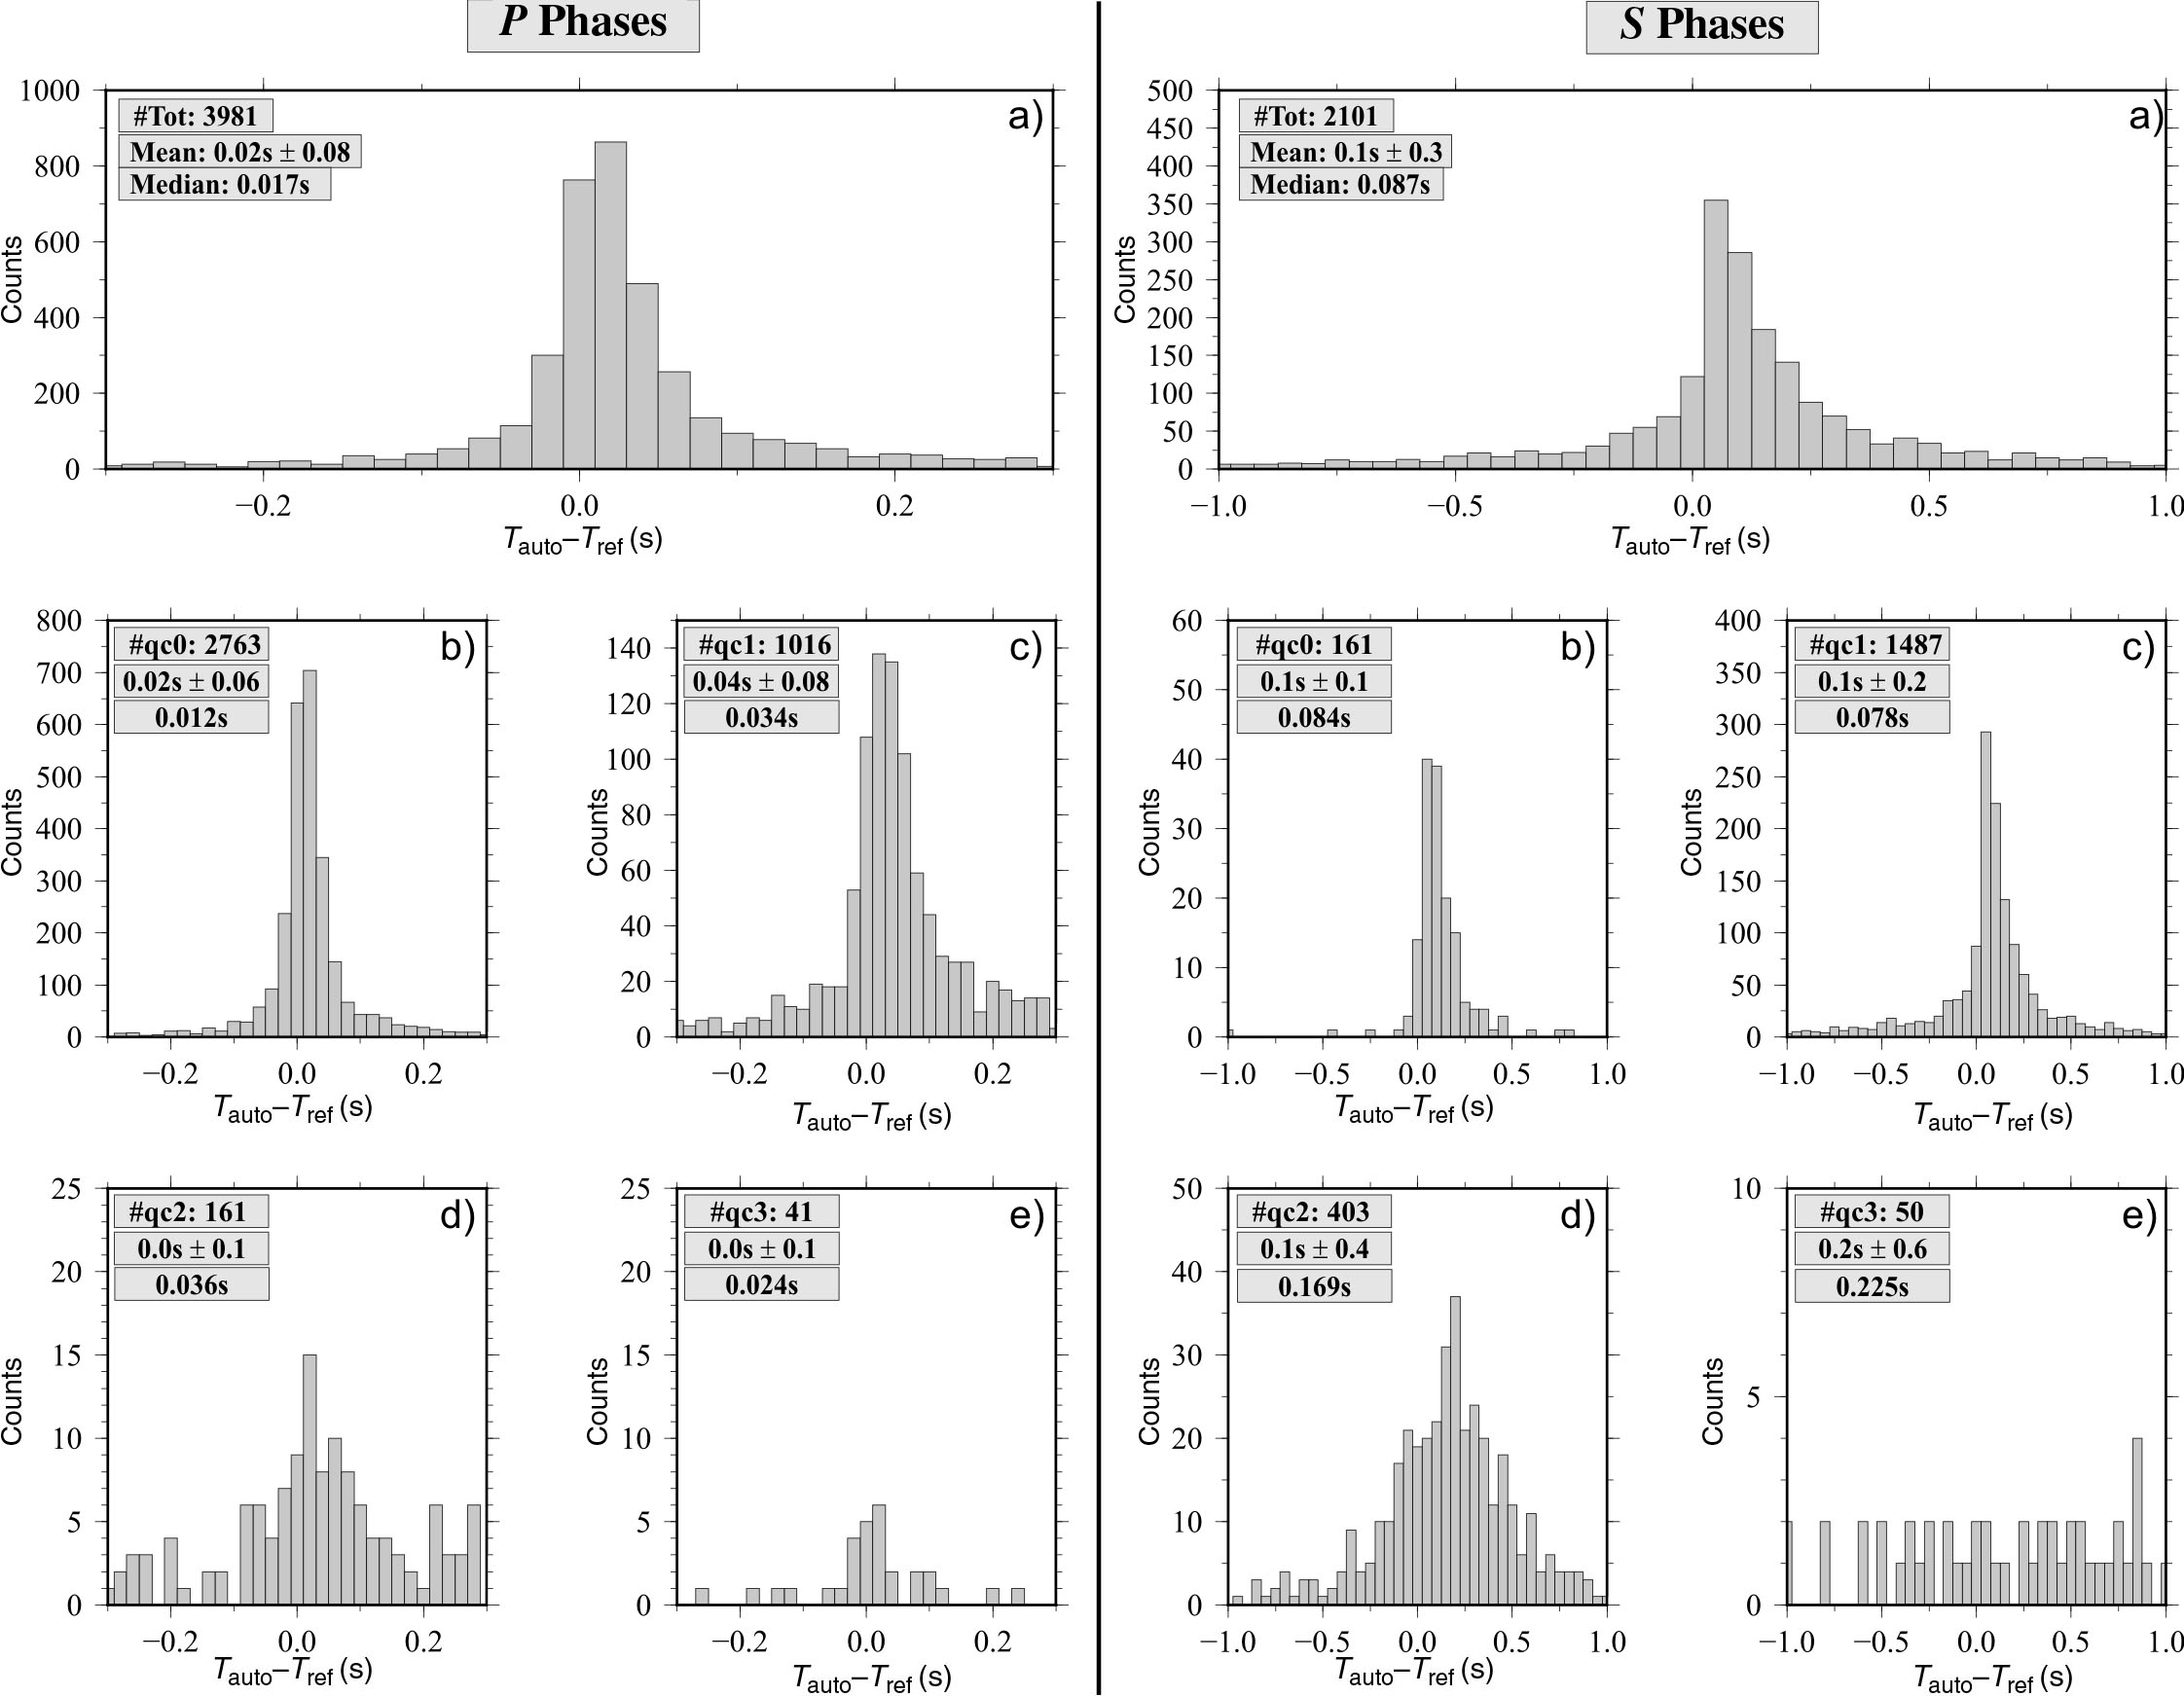
Figure S1. Difference (dt) between automatic arrival times and concurrent reference arrival times (manually picked) for the GeoNet dataset. (Top) Histograms for P and S phases. (Middle and bottom) Histograms for P and S phases, grouping automatic readings as a function of quality weight class. The mean and standard deviation and the median of the time differences between manual and automatic picks are indicated next to each histogram.
Figure S2. Same as Figure S1 but for the PAT dataset.
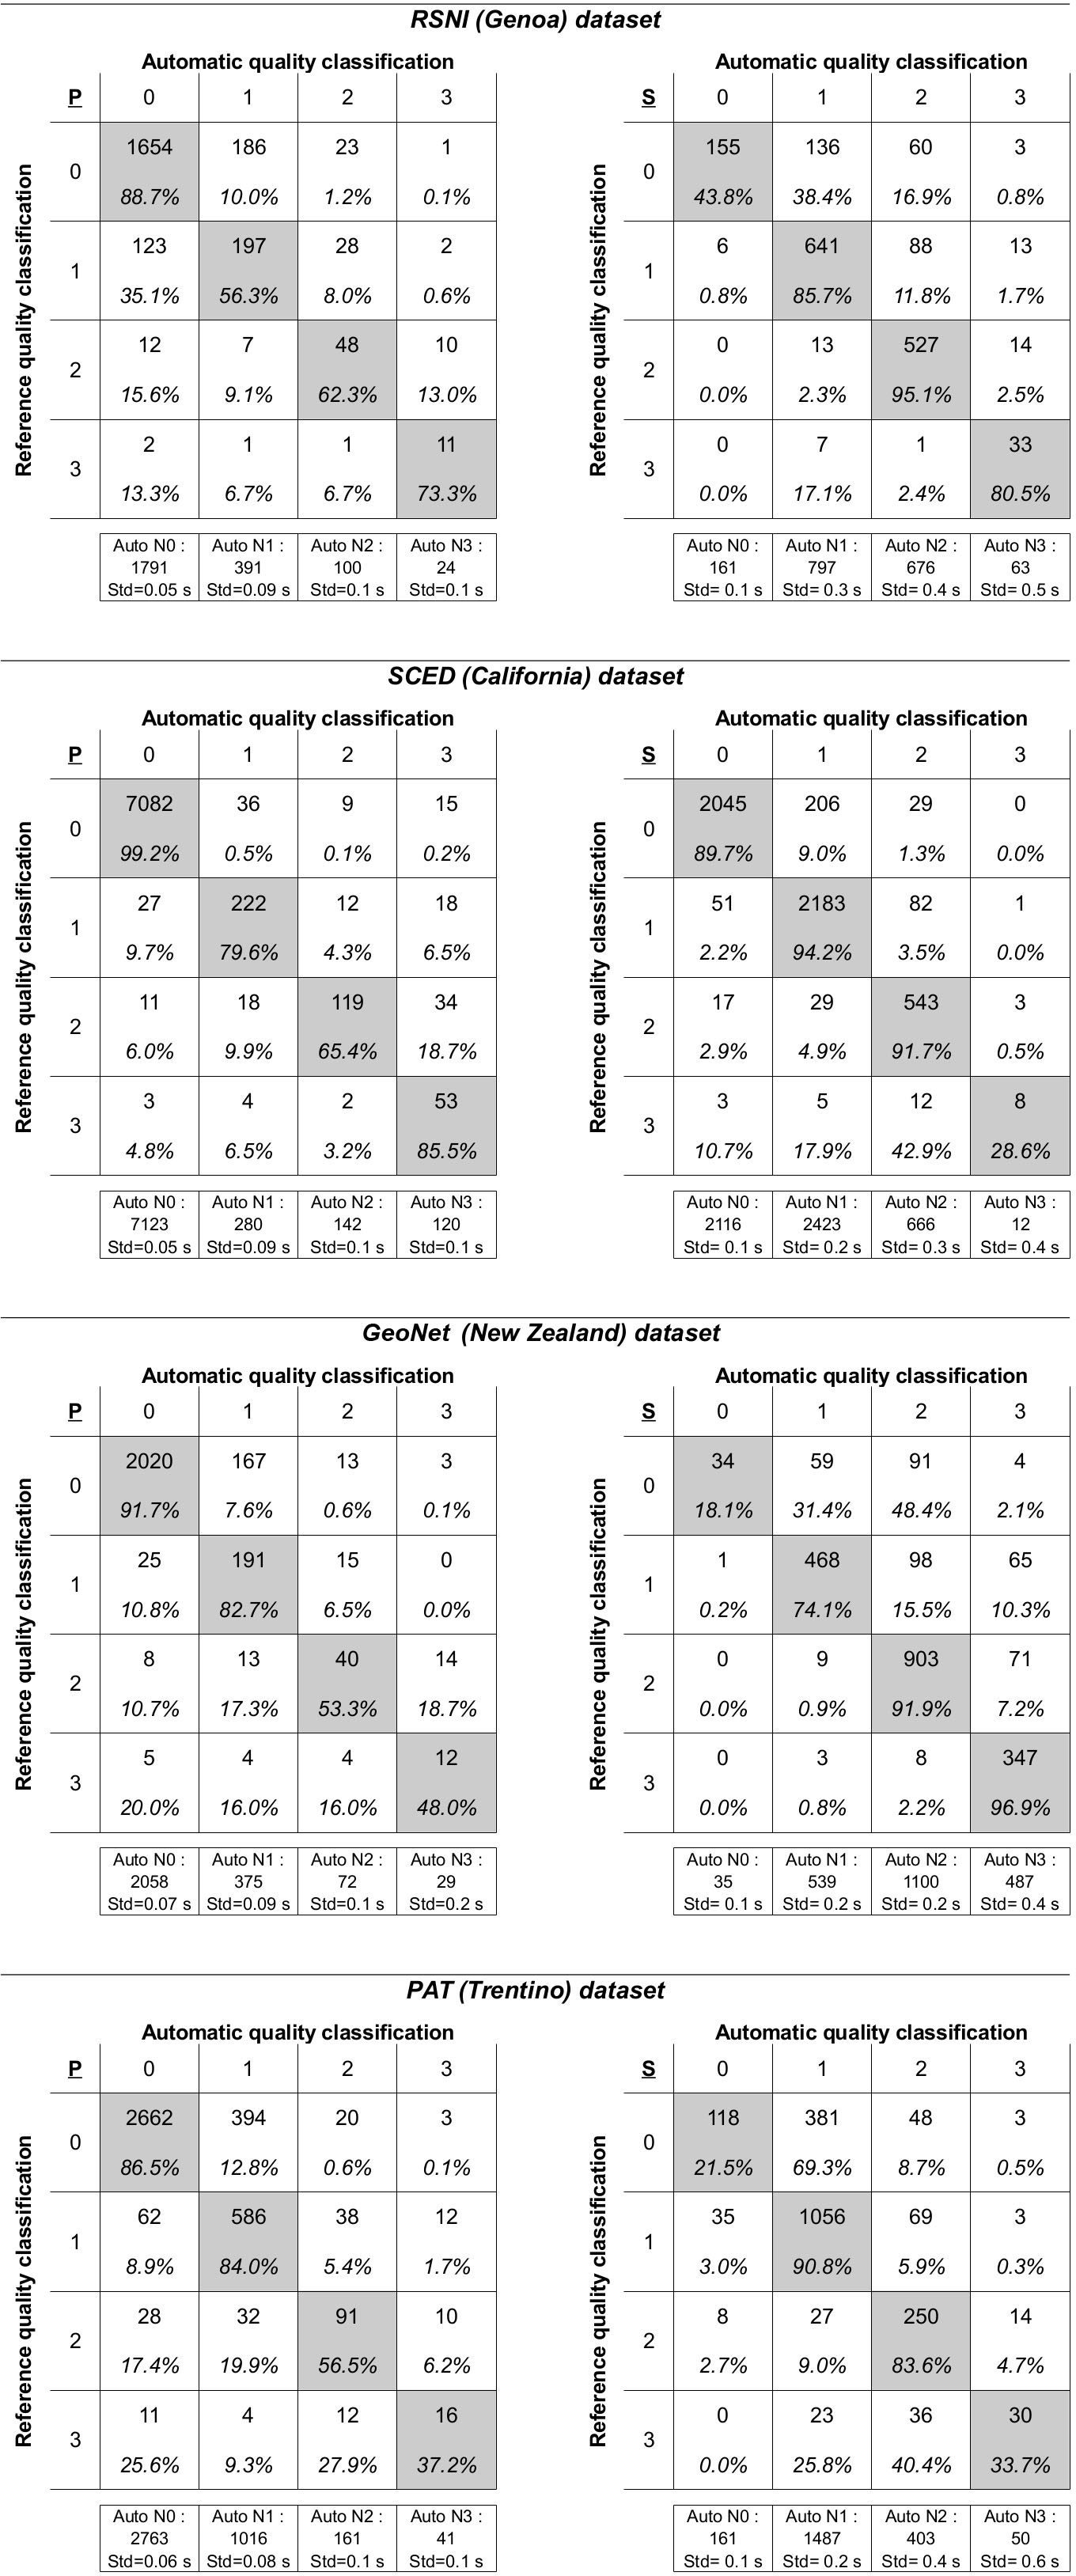
Figure S3. Comparison between automatically and manually determined quality classes using a matrix representation for the 4 seismic dataset analysed. Each cell shows the number of picks belonging to different quality classes as derived from automatic or manual procedure, and their percentage relative to the whole number of reference picks of that quality class. Diagonal elements represent same reference and automatic assigned quality class, off-diagonal elements represent picks that were upgraded or downgraded by the automatic procedure. In the lowermost row, the standard deviation of (dt) distribution for each quality
[ Back ]