
OMG Earthquake! Can Twitter Improve Earthquake Response?
Paul Earle, Michelle Guy, Richard Buckmaster, Chris Ostrum, Scott Horvath, and Amy Vaughan
U.S. Geological Survey
Electronic Supplement: Listing of Twitter messages in the first 360 seconds following the 30 March 2009 Morgan Hill, California, magnitude 4.3 earthquake.
INTRODUCTION
Following the 12 May 2008 Wenchuan, China, earthquake, discussion circulated on the Internet describing how the U.S. Geological Survey’s earthquake notification lagged behind firsthand accounts sent through Twitter, a popular Internet-based service for sending and receiving short text messages, referred to as “tweets.” A prominent technology blogger, Robert Scoble (http://scobleizer.com), is generally credited for being the first to aggregate and redistribute tweets from people in China who directly experienced and reported the shaking resulting from the Wenchuan earthquake.
Subsequent earthquakes generated volumes of earthquake- related tweets, and numerous accounts are on the Web. For example, Ian O’Neill discusses Twitter activity following a magnitude 3.3 Los Angeles earthquake on 24 January 2009 in his blog (http://astroengine.com). He showed a remarkable increase in frequency of tweets containing the word “earthquake” after the event and discussed the possibility of a Twitter-based earthquake detector. Similarly, following the 30 March 2009, Morgan Hill, California, magnitude 4.3 earthquake, Michal Migursk (http://mike.teczno.com) noted an increase in earthquake-related tweets.
Access to firsthand accounts of earthquake shaking within seconds of an earthquake is intriguing, but is there any reliable information that can be gleaned from the Twitter messages? To explore this question, we provide a quick review of Twitter and its capabilities and investigate the possibility of using the tweets to detect seismic events and produce rapid maps of the felt area. In this exploratory study, we examine the tweets that followed the 30 March 2009 Morgan Hill earthquake.
WHAT IS TWITTER?
Twitter is a service that allows anyone to send and receive 140-character text messages (tweets) via any Internet-enabled device. Tweets can be sent and received through a Web page, mobile device, or third-party Twitter applications. Tweets can be sent publicly or privately to a specified user. All users who opt to “follow” a Twitter user will receive that user’s tweets and messages. It is these public messages that really separate Twitter from instant message services that typically involve person-toperson chatting rather than person-to-world.
The underlying premise is that messages are short “status” updates of what a user is doing. In general, the messages are declarative and do not beg a reply (e.g., “eating toast” or “heading out for the party at John’s house”). In this way, Twitter communication differs from e-mail or instant messaging, which generally demand attention and often carry an expectation of response. If users are interested in what their friends are up to, they can scan their Twitter stream and choose to comment if they wish.
A common response to the Twitter concept is, “Who would care about my inane thoughts?” or “Why would I care about someone else’s inane thoughts?” These are fair questions. However, when large groups of people are thinking the same thing, at the same time, the inane can become relevant. For example: “Was that a big truck or an earthquake?”
USING TWITTER FOR EARTHQUAKE DETECTION AND ASSESSMENT
The potential to use tweets for earthquake response is based on the fact that public tweets are stored in an openly searchable database. At the most basic level, the database can be searched for matching strings; e.g., “Earthquake” or “Britney.” The searches can also be restricted to a specific date range and circular geographic area defined by latitude, longitude, and a radius. Twitter searches are conducted using their Web interface, thirdparty clients, or through a set of application program interfaces (APIs) (http://apiwiki.twitter.com/). Using the Twitter APIs, the tweet database can be searched automatically without having to manually enter searches into the Twitter Web site. The most straightforward Twitter API is just the long Uniform Resource Locater (URL) that defines the search. When this URL is entered into a browser’s address window, a text file is returned with all the tweets matching the search criteria.
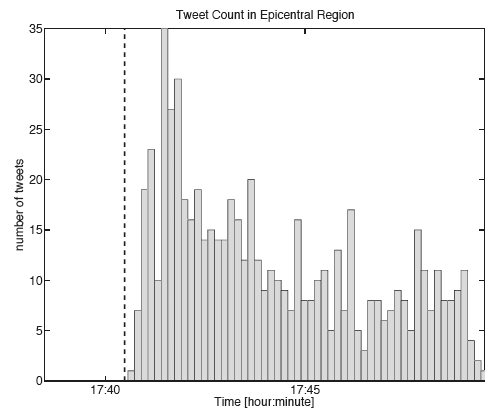
▲ Figure 1. Tweet count following the 2009 MW 4.3 Morgan Hill, CA, earthquake. Tweets are binned in 10-second intervals, and the dashed line marks the origin time of the earthquake. After the earthquake, the tweet frequency quickly rose above the background level of less than one per hour to about 150 per minute.
EARTHQUAKE DETECTION
Using Twitter’s search capabilities, we assessed the potential use of Twitter for earthquake detection and mapping the felt area by examining the tweets generated after the 30 March 2009 Morgan Hill, California, earthquake. The earthquake occurred at 17:40:29 UTC (10:40:29 a.m. local time at the epicenter) and had an Mw of 4.3 and a depth of 6 km.
We produced a time history of tweet count (Figure 1) before and after the Morgan Hill earthquake by extracting all geocoded tweets containing the word “earthquake” within a 200-km radius of the event. Using only geocoded tweets improves the chances that the tweets are associated with the earthquake. However, this reduces the number of relevant tweets by about 50 percent because not everyone who uses Twitter supplies their location.
The first geocoded tweet about the earthquake arrived 19 seconds after the origin time and reported “omfg, earthquake.” The text and times of the tweets in the first six minutes are included in the electronic supplement. Figure 1 shows how the tweet frequency quickly rose above the background level (less than one per hour) to about 150 per minute. The tweet count is plotted as a function of time after the earthquake and binned in 10-second intervals. The dashed line marks the origin time of the earthquake. Given the signal-to-noise seen in Figure 1, it is clear that monitoring tweet count can, in at least some cases, be used to indicate that an earthquake has occurred.
The potential response time for a Twitter-based earthquake detector is impressive. The typical delay for tweet transmission, according to Twitter engineers, is about five seconds. By running a simple automatic algorithm, the Morgan Hill earthquake could have been detected in under a minute.
How does this compare to current U.S. Geological Survey response time? Currently, the Northern California Seismic Network (NCSN) releases earthquake information faster than any network contributing to the Advanced National Seismic System (ANSS). The first solution issued by the NCSN is an automatic “quick look” solution that has a hypocenter but no magnitude. For the Morgan Hill earthquake, the quick look solution was released in 22 seconds.
Most regional networks wait until a magnitude is determined before publishing an earthquake location. The average release time for magnitude 3.5 and above is two-and-ahalf minutes in densely instrumented regions like Southern California. The average release time increases to about eight minutes in regions of the United States covered by sparser networks. For earthquakes occurring outside the United States, the USGS National Earthquake Information Center, on average, posts earthquake locations within 20 minutes for magnitude 5.5 and above.
There is an additional lag in getting ANSS earthquake information to the public. To protect the USGS Web servers from the initial burst of hits that follow felt earthquakes, the USGS earthquake Web pages are cached and served through a commercial service. This caching process delays the time the information is available to the public by about a minute.
Based on past response times and typical caching delays, ANSS earthquake information is generally available to the public within 1.5 to 20 minutes after the event depending on its location and magnitude. Comparing this response to Figure 1, it appears that the assertion that Twitter is faster than the USGS for early earthquake notification is correct, for some earthquakes. However, many limitations do exist. Most notable is the lack of seismographically derived information, such as precise location, magnitude, and depth, which can be used to assess the potential impact of an earthquake.
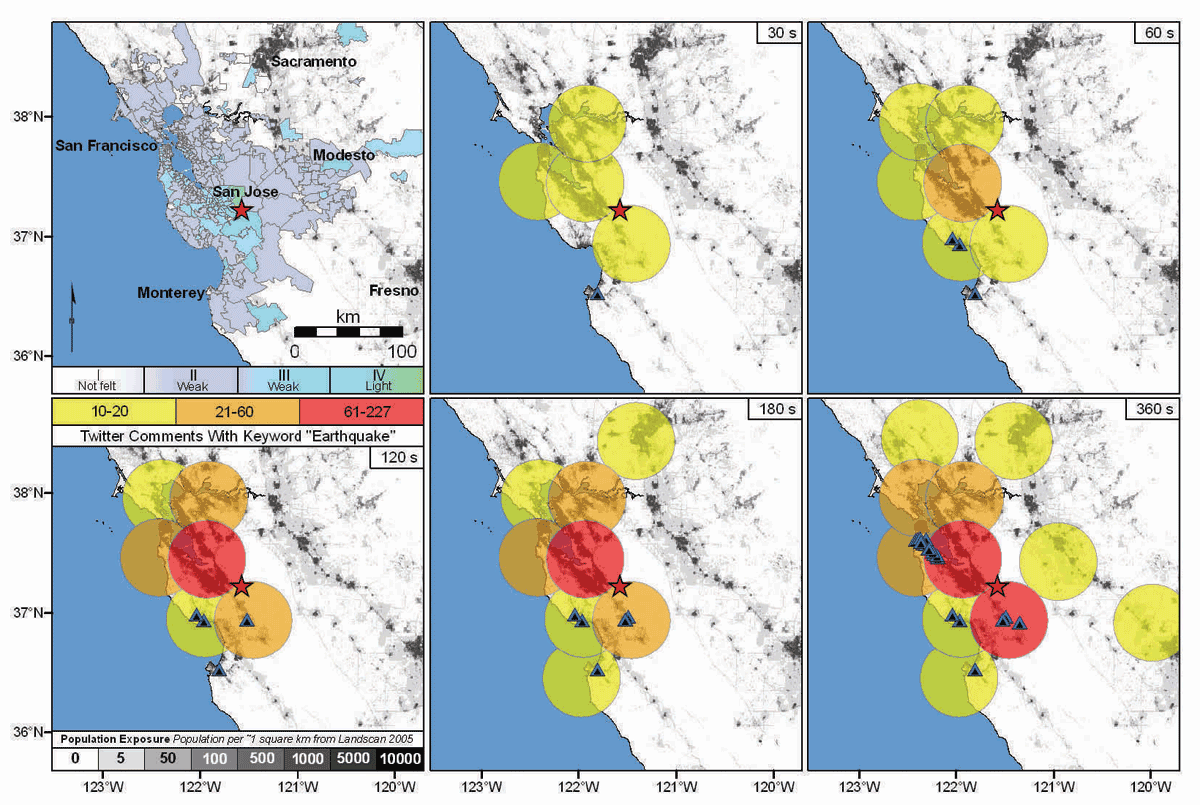
▲ Figure 2. Comparison of the intensity map produced by the USGS DYFI system (upper left) and the geocoded tweet counts for the 30 March 2009 MW 4.3 Morgan Hill earthquake. The extent of the geographic tweet search is indicated by the size of the circles, which are color coded by the number of tweets. The population is shown in the background as gray scale and the tweets with exact latitude and longitude geo-references are shown as black triangles with blue outlines. The different panels show the integrated tweet count at discrete times after the earthquake as indicated in the upper right corner of the maps. [Click image to view larger version.]
MAPPING THE FELT REGION
Even though an accurate location and magnitude cannot be obtained, a qualitative indication of the severity of shaking can be extracted by reading the information contained in the tweets. The tweets following the Morgan Hill earthquake indicated it was not a catastrophic event. Most people just reported that an earthquake had occurred, but a few described what they felt. For example, a person in Boulder Creek, California, reported “just felt a mild earthquake,” and a user in San Francisco tweeted, “Just had a small earthquake in SF.”
Reading and interpreting the tweets is a manual process, so it can take time to filter through the numerous responses for potentially useful data. It is also difficult to assess the significance of a tweet if the epicenter is unknown. A twitterer might report slight shaking but be a long distance from a significant quake. However, it is possible to automatically process the geocoded tweets to get a rough indication of the felt area. Figure 2 compares the intensity map produced using Internet questionnaires submitted to the USGS “Did You Feel It?” system (DYFI) (Wald et al. 1999a) to maps produced by counting geocoded tweets for the Morgan Hill earthquake.
The tweet maps in Figure 2 show the number of tweets returned using a series of geographic searches in the epicentral area for five time intervals following the earthquake. The searches were conducted over a grid of points covering the entire mapped area, with each search being limited to a radius of 36 km. To cover the entire area, the circles must overlap so adjacent circles may contain identical tweets; this results in double counting of some tweets. This is a consequence of the Twitter API implementing its geocoded searches by radius and not polygon.
The double counting of tweets can potentially be avoided by doing one’s own geocoding of the tweets based on a user’s location information that is also returned by the Twitter API. Several Twitter clients that run on GPS-enabled mobile devices have the option of returning the precise latitude and longitude from which the tweet was submitted. For the Morgan Hill earthquake, we received several dozen GPS geocoded tweets. These are plotted as triangles on the maps in Figure 2.
We require at least 10 contributing tweets from a given region before plotting. This likely reduces the plotting of tweets that are incorrectly geocoded or unrelated to shaking because such contaminating tweets would likely be less spatially correlated than those emanating from the region that experienced perceived shaking. This cut-off level is likely dependent on the number of tweets contributing for a given earthquake, and further study on additional earthquakes is needed to determine the best way to apply it.
Comparing the DYFI map and the tweet-count map, one sees the tweets do a decent job of mapping out the felt region. At 60 seconds after origin time, a rough idea of the felt area is available, and after six minutes the observations extend from Monterey to Sacramento, similar to the DYFI results. The color-coding of the tweet count shows the majority of tweets emanate from the epicentral area, suggesting that tweet frequency could be correlated with intensity falloff; however, this is likely a rare example, since the number of tweets is surely dependent on the population (shown in gray scale). And for large earthquakes, it is assumed that people in the high-intensity regions will take life-saving actions rather than tweeting.
As with earthquake detection, the main drawback for mapping the felt area using Twitter is the lack of quantitative data; the potential advantage is speed. DYFI questionnaires allow a calibrated assignment of Modified Mercalli intensity to each submission, and therefore accurate intensity maps can be made, whereas Twitter maps provide a rough outline of where the quake was felt. The USGS ShakeMaps and DYFI maps are derived from better data than a tweet-based map and should be considered authoritative once they are produced.
Twitter responses are fast; it takes only 60 seconds after an earthquake occurs to get a rough idea of the felt area. Comparatively, the first completed questionnaire used to construct the DYFI intensity map for the Morgan Hill earthquake was received 140 seconds after the event, and the first instrumentally derived maps of shaking from the USGS ShakeMap system (Wald et al. 1999b) were generated in six minutes.
LIMITATIONS
The exploratory results shown in Figures 1 and 2 indicate that a Twitter-based earthquake detection and characterization system is worth further investigation, but limitations exist. Earthquake tweets have been reported following many earthquakes, but the March 30 earthquake likely represents a best-case scenario for mapping the felt area using Twitter. The density of Twitter users in the San Francisco Bay area is likely among the world’s highest, and the region’s population is widely distributed, providing decent observational coverage. More accurately, assessing the potential and robustness of a Twitter-based system is difficult because only tweets spanning the previous seven days can be searched. This makes a comprehensive historical study impossible without constructing a local archive of tweets.
The number of tweets following the Morgan Hill earthquake was significant, but not as large as we had anticipated. About 500 geocoded tweets were found in the six minutes following the earthquake, which was likely felt by several million people. For comparison, there were over 17,000 “Did You Feel It?” questionnaires filled out for this earthquake. Given the density of computer-savvy people in the Bay Area, earthquakes in other regions may not produce sufficient tweets to provide useful data. The number of earthquake tweets may increase as Twitter becomes more popular, but they might also decrease if enthusiasm for the service wanes.
A source of noise for constructing Twitter-based felt maps is people tweeting or re-tweeting (the forwarding of someone else’s tweet) about an earthquake they did not actually feel based on tweets submitted by others who felt the earthquake. For example, after the Morgan Hill earthquake, a user in Silicon Valley reported, “Damn! I totally just missed an earthquake because I was walking.” Weeding out such tweets might be difficult to do automatically. The majority of the tweets in the initial seconds after an earthquake contain text that is consistent with what people might tweet after experiencing shaking; however, it is difficult to automatically determine when the transition to chatter occurs and the tweets should no longer be used to map the felt area.
Incorrect tweet geolocations are a serious issue for using tweets to map the felt region. The Twitter search API likely geocodes a tweet from the location string the user entered in his or her profile. The location string is not required to set up a Twitter account and can be as vague or specific as the user wants. Some Twitter clients for GPS-enabled devices update this string on a per tweet basis; however, most tweets are tagged with the static location in the user’s profile. Given this, a tweet from a New Yorker on vacation in San Francisco will most likely mislocate to New York. Since these tweets are likely not spatially correlated, requiring a minimum number of tweets in a region before declaring it a felt area will reduce their contaminating effect. Additionally, Twitter is introducing a service that will allow each tweet to be tagged with its geolocation so tweet location accuracy will likely increase with time.
Tweets using the word “earthquake” clearly do not all correspond to people feeling shaking, but the background level of earthquake tweets seems fairly low. In the example of the Morgan Hill event, the number of tweets in the region surrounding the epicenter rose from about one per hour to 150 per minute (a signal-to-noise ratio of 9,000). This background level, however, is likely not constant and one can imagine circumstances that would create a rapid increase in earthquake tweets for a nonseismic event. For example, if the San Jose Earthquakes soccer team won an important game, the number of tweets containing “Earthquakes” might increase, or a sonic blast from the space-shuttle might generate false reports. For these and other reasons, any notifications based on tweets should not definitively state an earthquake occurred, but potentially could state that Twitter earthquake chatter has increased and seismically derived information will follow.
The robustness of the Twitter service following a large earthquake is also a potential problem. The majority of California’s population would feel a repeat of the 1906 San Francisco earthquake, likely flooding Twitter with responses and potentially taking down the service. Power outages generated by such an event would also likely cripple the Internet near the rupture zone and possibly beyond. Another potential issue is hackers trying to generate a false earthquake by systematically flooding Twitter with messages containing the word “earthquake.” Measures could be taken to reduce the chance of a successful attack, but with enough effort an automated system could be fooled.
From an emergency response standpoint, obtaining quantitative estimates of shaking are essential. For example, given accurate maps of shaking from ShakeMap, the California Department of Transportation can prioritize bridges to be inspected, and the Los Angeles Unified School District can rapidly determine which schools may have been damaged (Wald et al. 2008). We believe, with Twitter’s current implementation at the time of this writing, that aggregating tweets alone into a uniform, verified, actionable compilation is not possible, and emergency responders should continue to rely on seismically derived products such as ShakeMap.
Based on the preceding discussion, it is evident that a Twitter-based system should not be a stand-alone tool to inform emergency responders and the public about earthquakes. But such a system does have potential to augment and enhance current USGS/ANSS capabilities.
DISCUSSION
It is clear from scanning tweets and blogs that some people are critical of the USGS’s “slow” earthquake response (e.g., http://scobleizer.com/2008/05/12/quake-in-china/). This is understandable. Earthquakes are scary, potentially deadly events, and the seconds during and following earthquake shaking can seem much longer. Improving the USGS/ANSS response time could potentially help reduce anxiety following an earthquake.
One way to reduce this anxiety while still producing quantitative information is to speed up ANSS instrumentally based locations and magnitude determinations. In California, work on prototype earthquake early warning systems is already underway (e.g., Allen et al. 2009). These systems have the potential to produce estimates of hypocentral parameters and magnitude within eight seconds after an earthquake.
In the meantime and in regions without dense seismic networks, Twitter potentially provides a very inexpensive way to rapidly detect earthquakes and map out their felt areas. A Twitter-based system could provide a quick confirmation that there was an event and that seismographically derived information will follow.
The social aspects of how people respond to earthquakes are also interesting. Reading the tweets following an earthquake provides an unfiltered account (albeit short) of how people felt and reacted to the earthquake. Their thoughts are not modified by discussion with others or biased by knowing the magnitude. The tweets from the March 30 earthquake also show the persistent public confusion between intensity and magnitude, as illustrated by people trying to guess the magnitude of the earthquake, having no idea where it actually occurred; for example, “Minor earthquake. Maybe a 4.” and “ just felt an earthquake here … 5.5?”
Some of the tweets are also humorous. Eleven hours before the Morgan Hill earthquake, someone in the area tweeted, “Confession: I am always scared to rearrange my bedroom, because typicaly [sic] within a week a small earthquake happens. Tick-tock.” Other tweets have more tragic implications. Ten minutes after the 12 May 2008 Wenchuan, China, earthquake, a user reported “jesus! Serious earthquake here in Chengdu.”
The focus of this discussion has been on using Twitter for augmenting instrumentally derived data. Other social-networking tools and Internet data-mining techniques have similar potential. Automatically scanning other services such as Facebook and Flickr could yield firsthand accounts and damage photos. Internet-based systems that do not rely on social networking are also feasible. The European-Mediterranean Seismological Centre (EMSC) has implemented a system to map out the felt region of an earthquake by geocoding the IP addresses of people visiting its Web site (Bossu et al. 2008). The rapid increase in Web visits is often EMSC’s first indication that an earthquake has occurred.
We have focused on the use of Twitter for earthquake detection and characterization, but it has also been used for communicating other types of hazard information. The Alaska Volcano Observatory attracted thousands of followers on its Twitter stream when Redoubt Volcano was active, and the Centers for Disease Control used Twitter to release timely information regarding the H1N1 “Swine Flu” outbreak, increasing its followers over 8,000 percent in one month.
The results from this exploratory study are for a single earthquake, and more extensive work is needed to fully understand the limitations and benefits of using Twitter to rapidly detect and characterize earthquake shaking. Such a study is difficult because Twitter only allows access to the previous seven days of tweets. As a first step, the USGS has begun archiving tweets containing “earthquake” and “quake.” A more extensive study will be conducted once these data have been collected. The initial results from the Morgan Hill earthquake, however, indicate Twitter and other social networking sites have the potential to inexpensively augment the current suite of ANSS products.
We are optimistic that Twitter and other social media tools will have applications in earthquake response. These tools are, at their root, a way for people to communicate, and millions of people are using them. After natural disasters people have used, and will continue to use, social media to describe what they saw and experienced. The challenge will be sifting the wheat from the chaff. Those interested in this project can create a Twitter account and follow @USGSted or e-mail USGSted [at] usgs [dot] gov.
ADDENDUM
Since the initial writing of this article, Twitter has introduced fields for latitude and longitude into a tweet’s metadata. In this article, the use of “geocoded tweet” refers to tweets that were returned via Twitter’s location-based search API and not to tweets that contain geographic coordinates in their metadata. This metadata extension will likely improve the dependability of tweet geocoding. Additionally, Twitter has introduced a separate stream for “retweets,” which can be distinguished from regular user updates. This distinction will likely reduce the number of out-of-context tweets when trying to identify which tweets originated from a user who actually experienced the shaking.
ACKNOWLEDGMENTS
This study was funded in part by the American Recovery and Reinvestment Act of 2009. We thank Jim Dewey, Stuart Sipkin, David Oppenheimer, David Hebert, and two anonymous reviewers for comments that improved the document. Several additional limitations of using Twitter for earthquake response were added based on comments from an anonymous reviewer, including the reference to the San Jose earthquakes.
REFERENCES
Allen, R.M., P. Gasparini, and O. Kamigaichi (eds.) (2009). Earthquake Early Warning Special Issue, Seismological Research Letters 80 (5), 682–782.
Bossu, R., G. Mazet-Roux, V. Douet, S. Rives, S. Marin, and M. Aupetit (2008). Internet Users as Seismic Sensors for Improved Earthquake Response, Eos, Transactions, American Geophysical Union 89 (25), http://www.agu.org/pubs/crossref/2008/2008EO250001.shtml.
Wald, D. J., K. Lin, K. Porter, and L. Turner (2008). ShakeCast: Automating and improving the use of ShakeMap for post-earthquake decision-making and response. Earthquake Spectra 24, 533–553.
Wald, D. J., V. Quitoriano, L. Dengler, and J. W. Dewey (1999a). Utilization of the Internet for rapid community intensity maps. Seismological Research Letters 70, 680–697.
Wald, D. J., V. Quitoriano, T. H. Heaton, H. Kanamori, C. W. Scrivner, and B. C. Worden (1999b). TriNet “ShakeMaps”—rapid generation of peak ground-motion and intensity maps for earthquakes in southern California. Earthquake Spectra 15 (3), 537–556.
[ Back ]
Posted: 19 February 2010