This electronic supplement contains tables of 1D velocity models used to generate the high-frequency synthetics, and figures of source models and peak ground motion synthetics.
The tables summarize the 1D velocity models used to generate the high-frequency synthetics used in this research. San Diego State University computes the high frequency using a 3D velocity model approach.
Table S1. 1D velocity model used by U.S. Geological Survey–Golden, Colorado (USGSG).
Table S2. 1D velocity model used by the URS Corporation and U.S. Geological Survey–Pasadena, California (URSUSGSP) (embayment sites).
Table S3. 1D velocity model used by URSUSGSP (nonembayment sites).
Characteristics of the modeled sources and ground motions as calculated by the three modelers are shown. We assume that modern seismicity trends are a good indicator of the 1811–1812 seismogenic zone and that events NM1, NM2, NM3—the December, January, and February earthquakes—occurred in the southern, northern, and central segments, respectively.
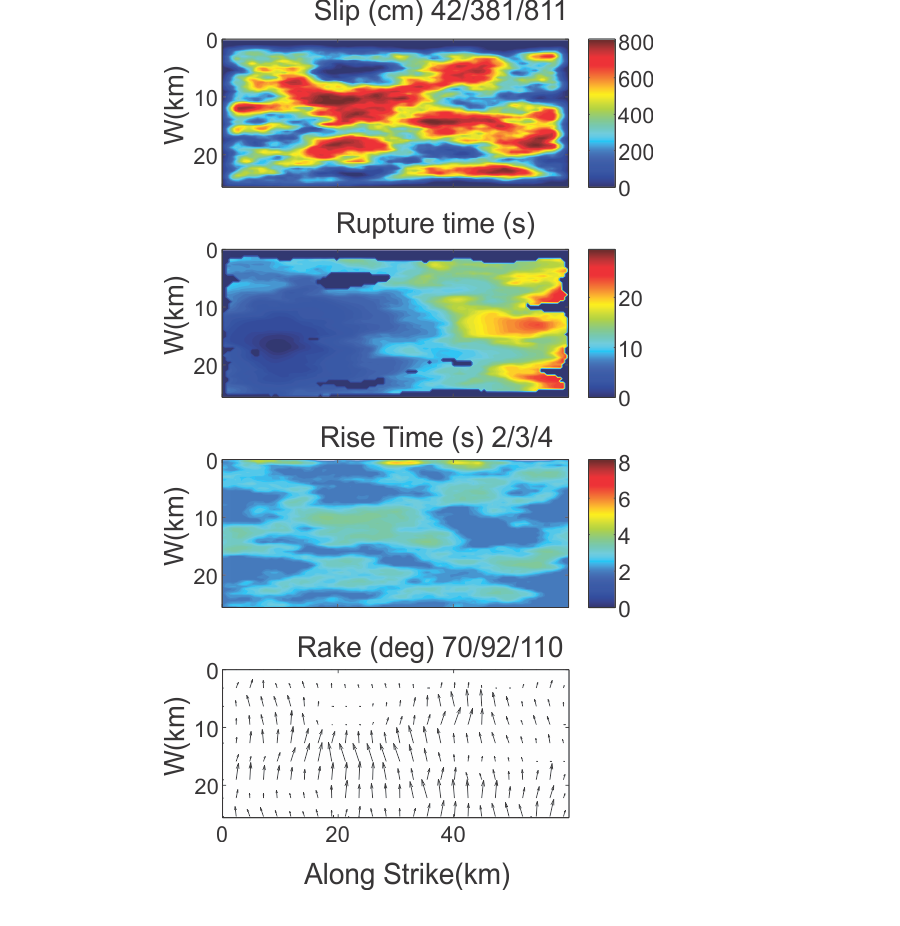
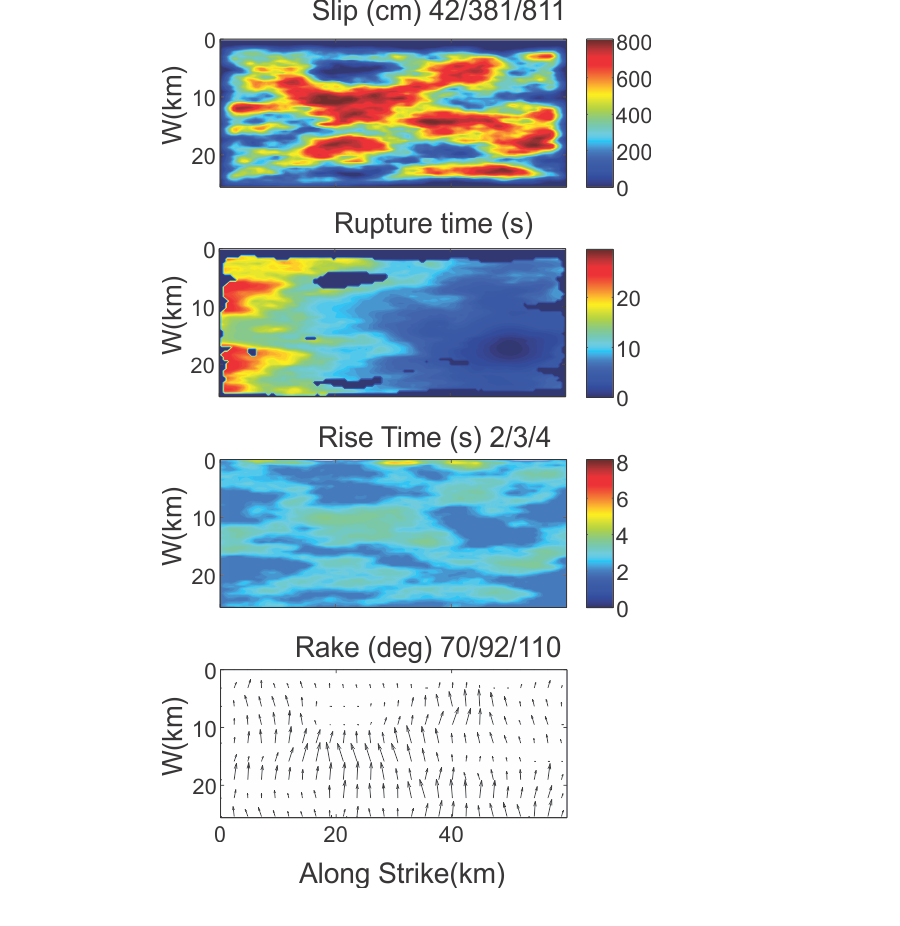
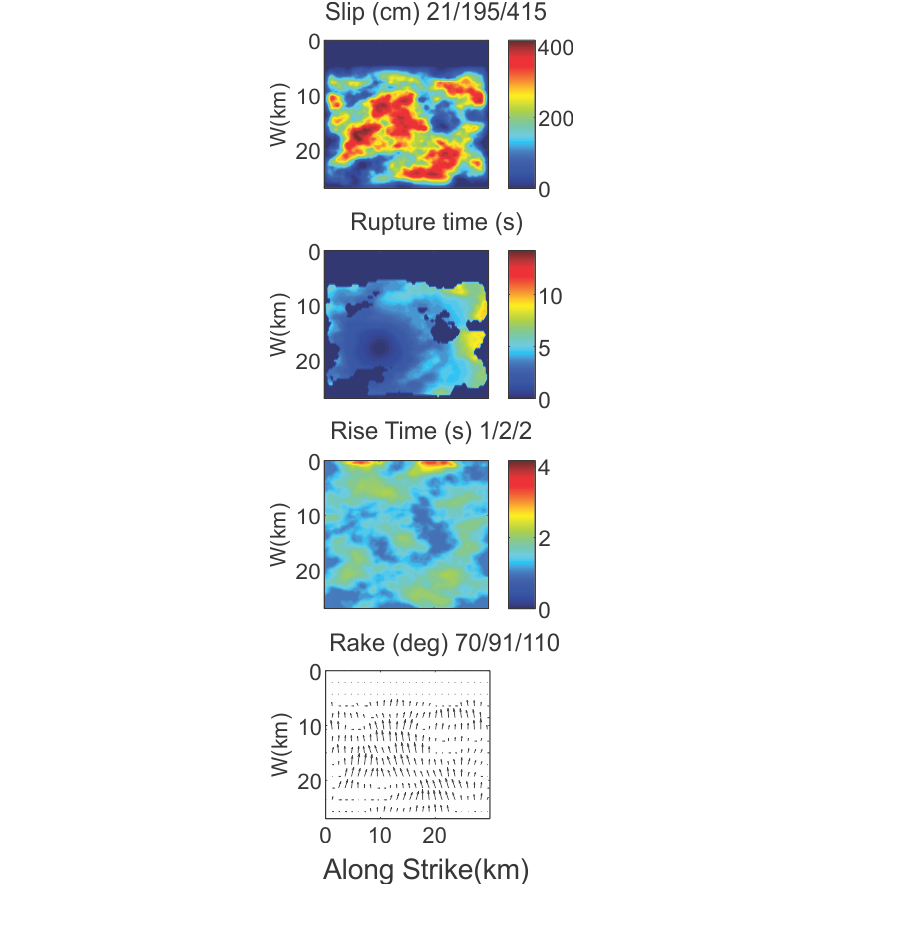
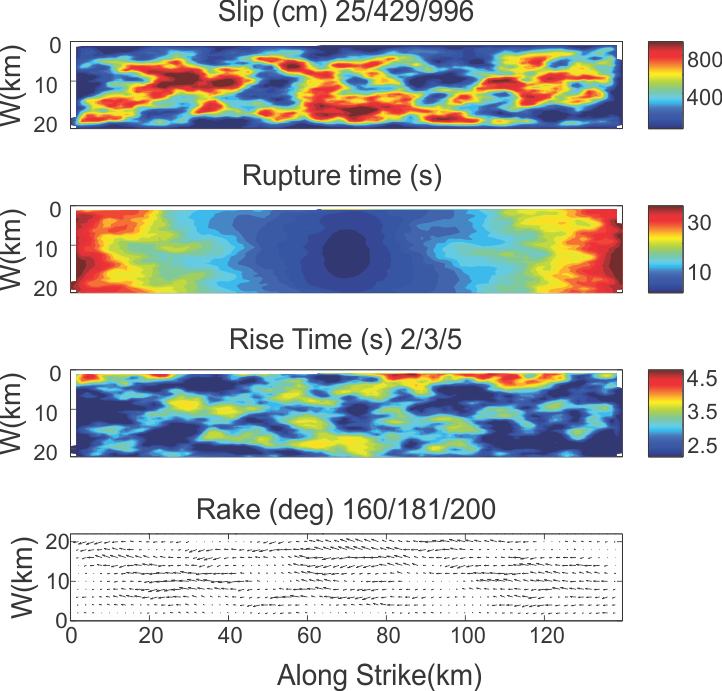
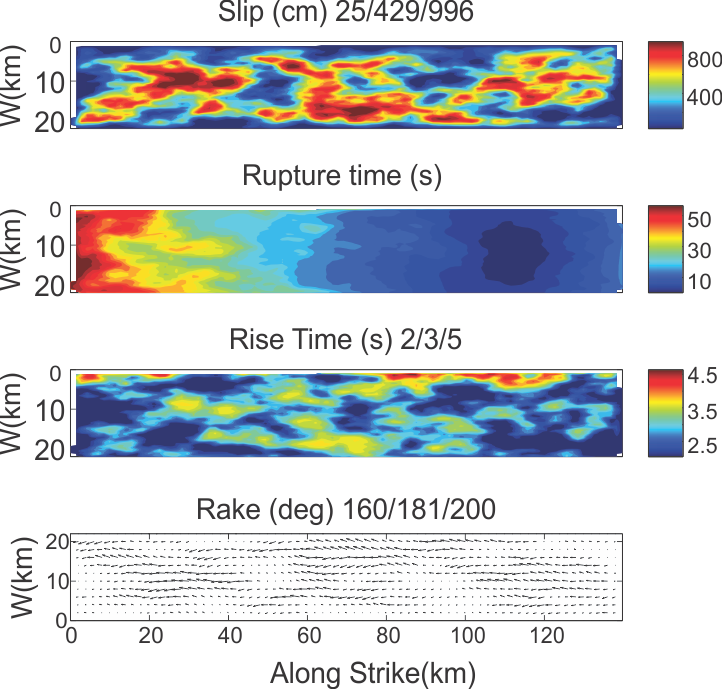
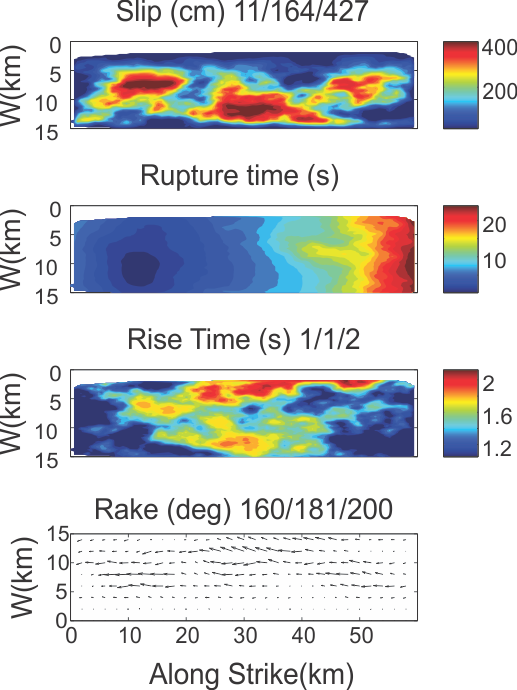
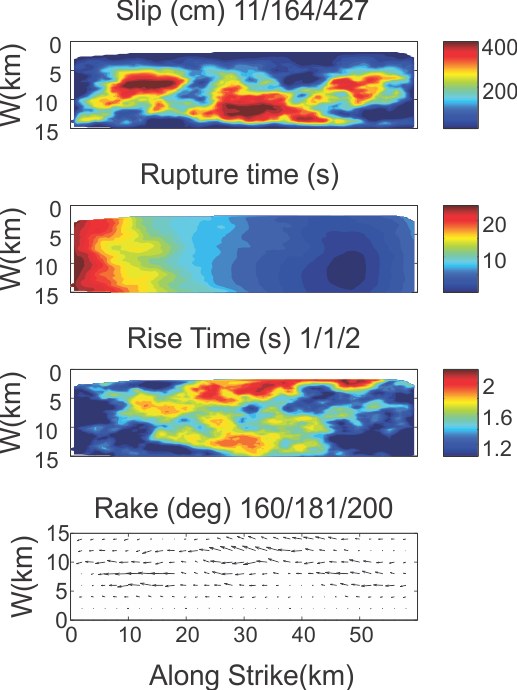
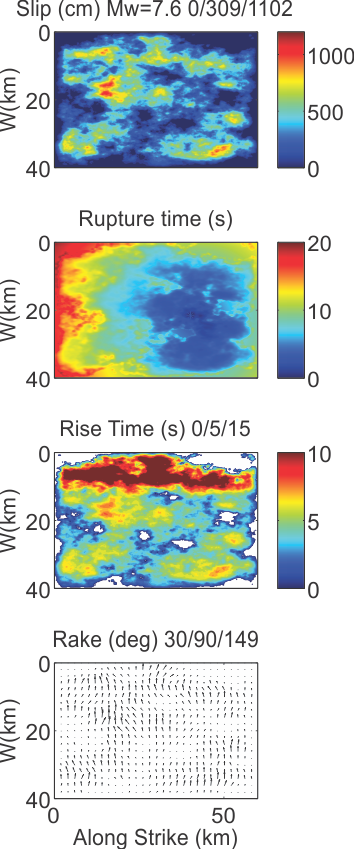
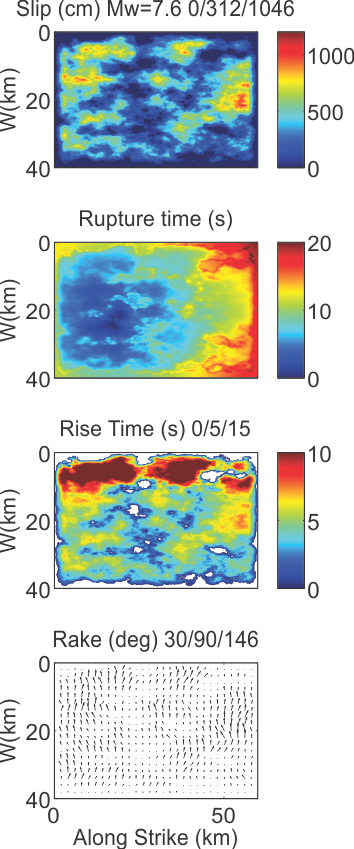
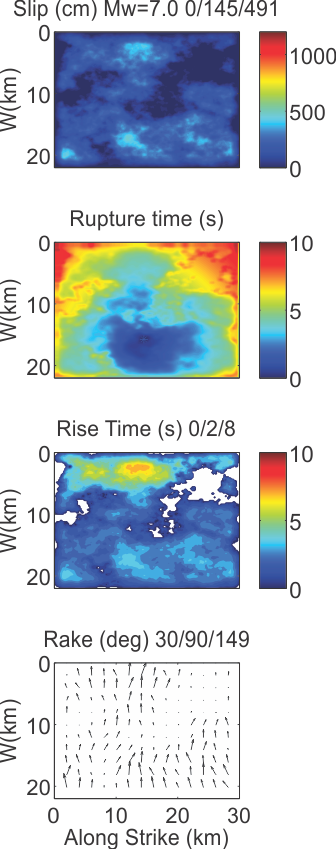
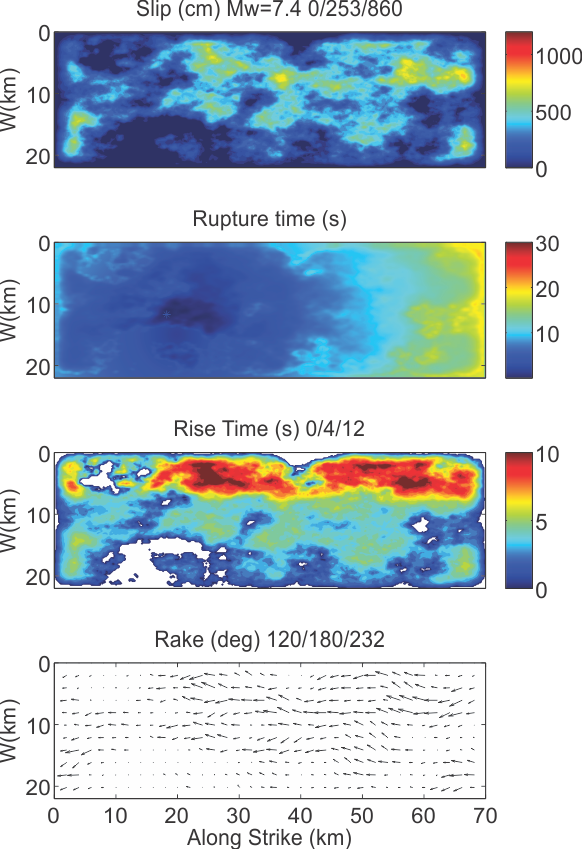
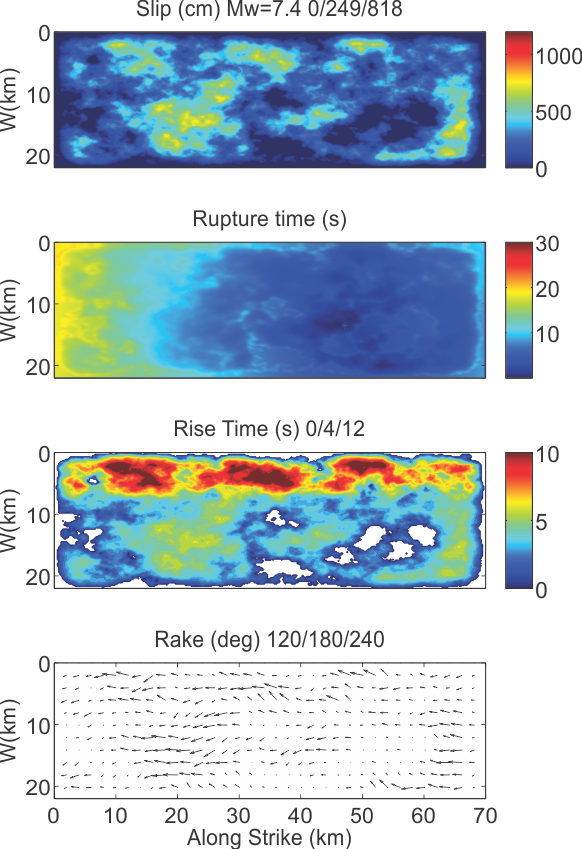
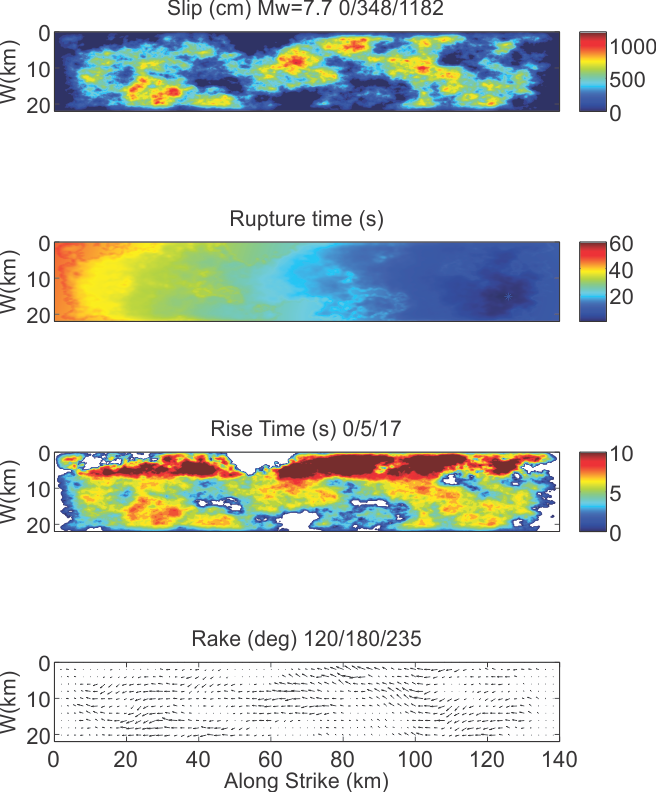
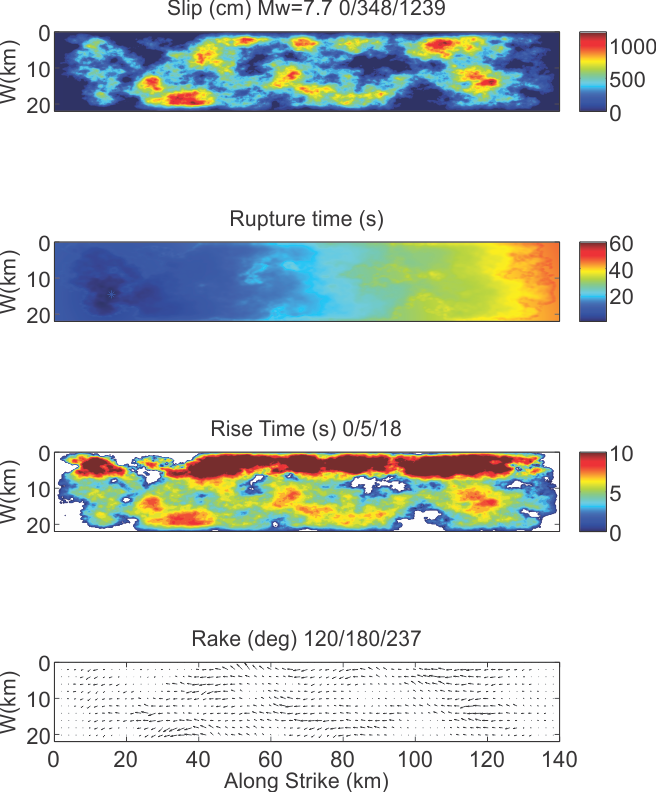
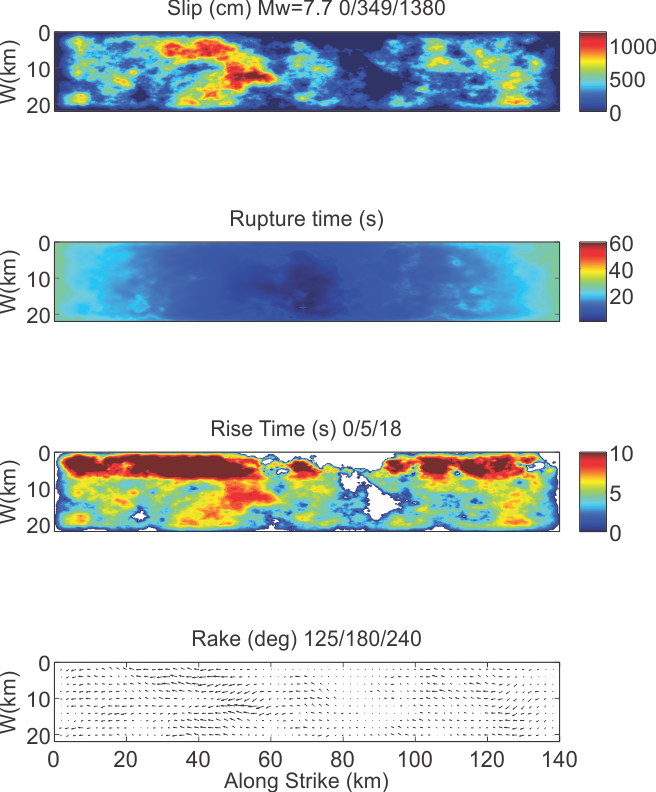
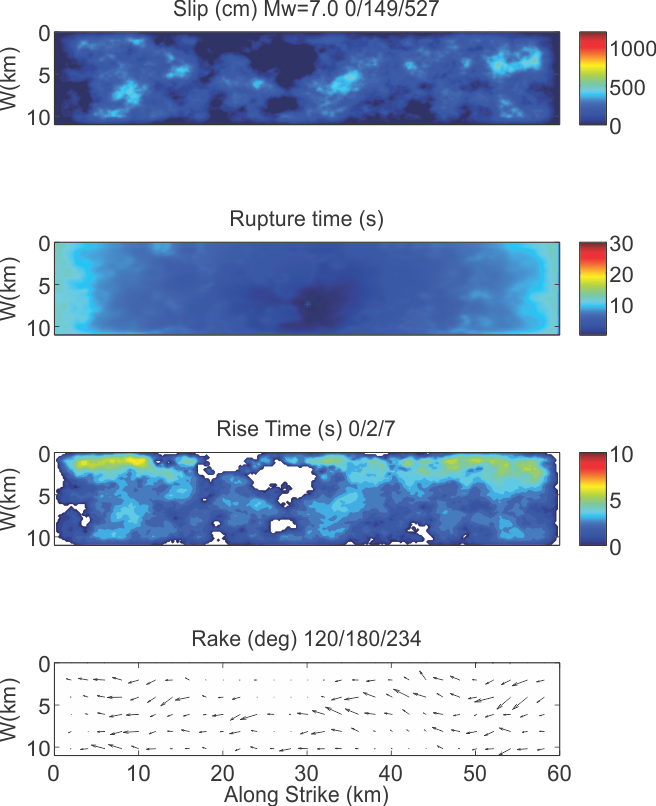
Figures show slip, rupture time, rise time, and rake.The minimum/mean/maximum are reported above each plot.
Figure S1. Mw 7.6 earthquake on the central segment. Hypocenter 1.
Figure S2. Mw 7.6 earthquake on the central segment. Hypocenter 2.
Figure S3. Mw 7.0 earthquake on the central segment. Hypocenter 1.
Figure S4. Mw 7.7 earthquake on the southern segment. Hypocenter 1.
Figure S5. Mw 7.7 earthquake on the southern segment. Hypocenter 2.
Figure S6. Mw 7.7 earthquake on the southern segment. Hypocenter 3.
Figure S7. Mw 7.0 earthquake on the southern segment. Hypocenter 1.
Figure S8. Mw 7.0 earthquake on the southern segment. Hypocenter 2.
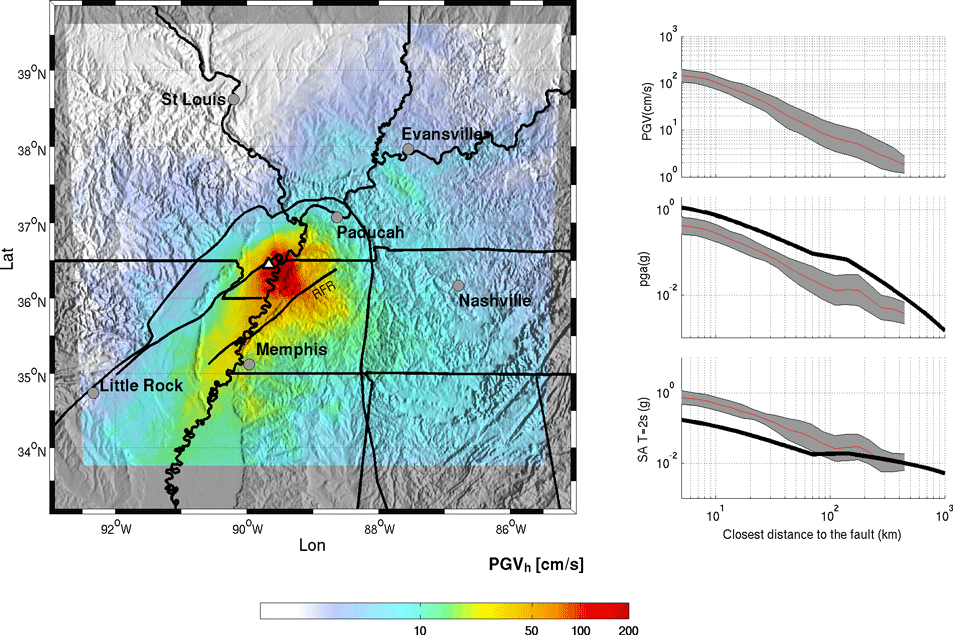
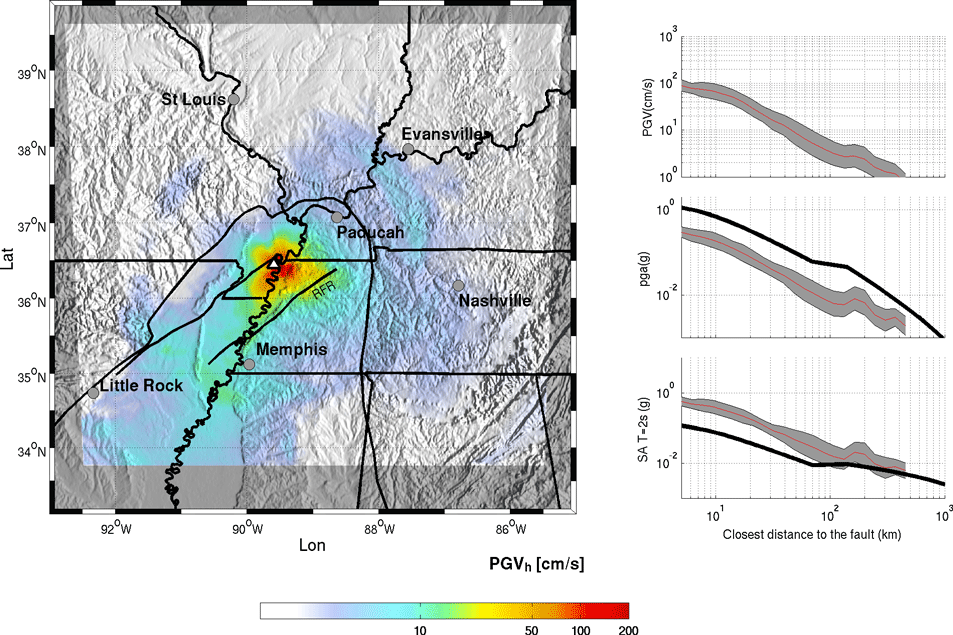
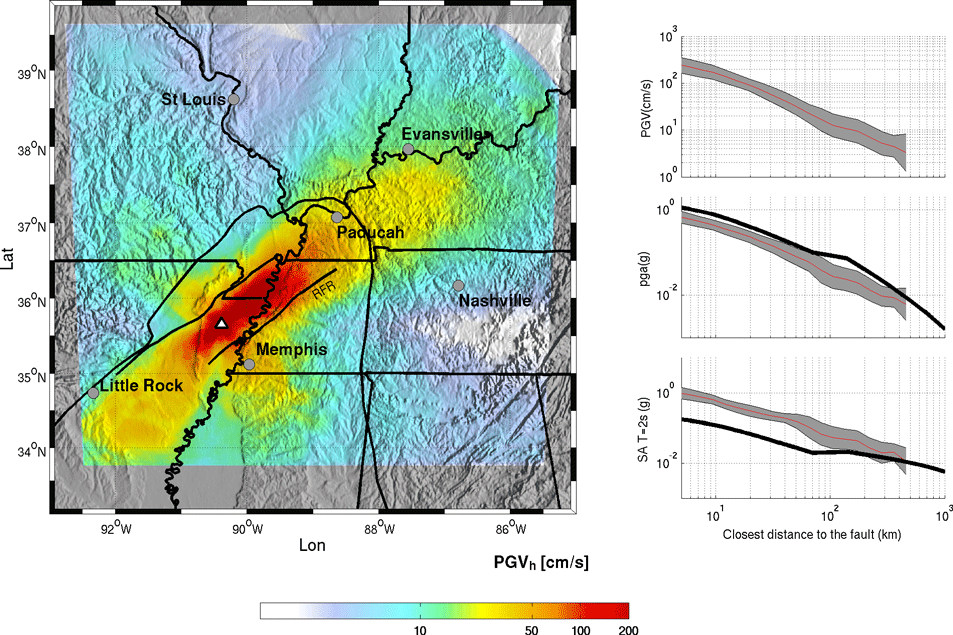
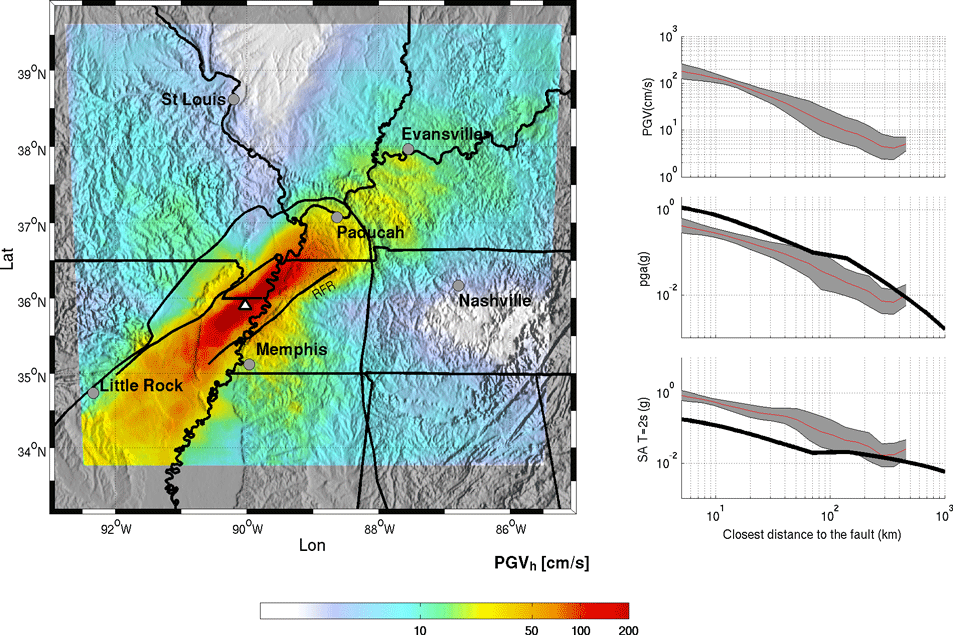
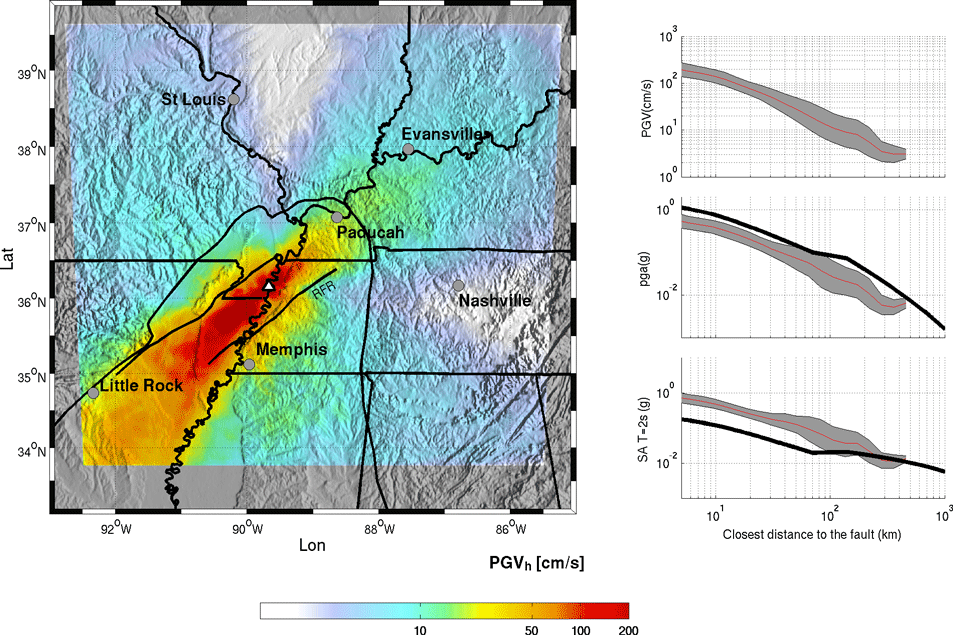
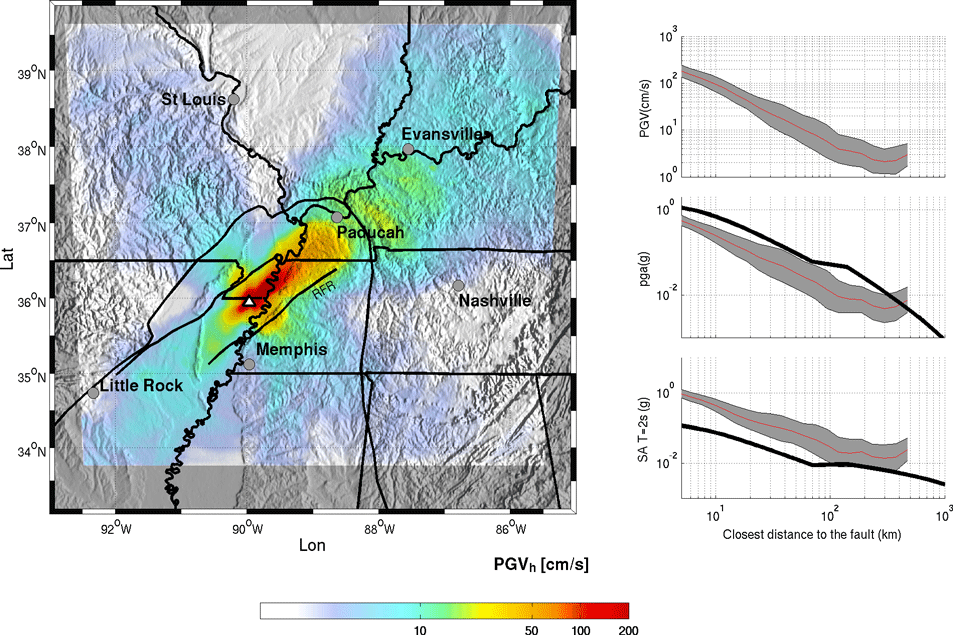
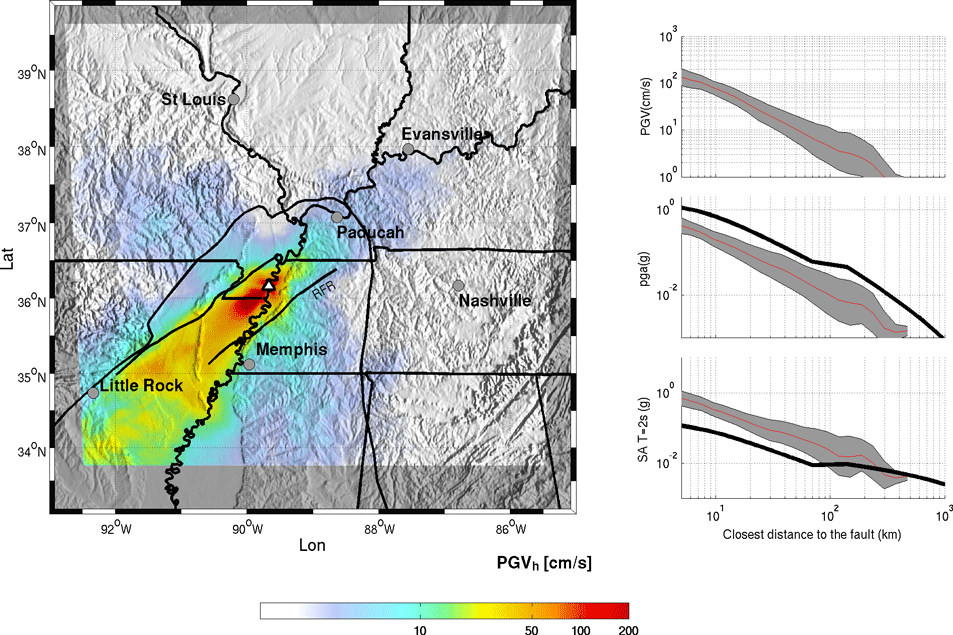
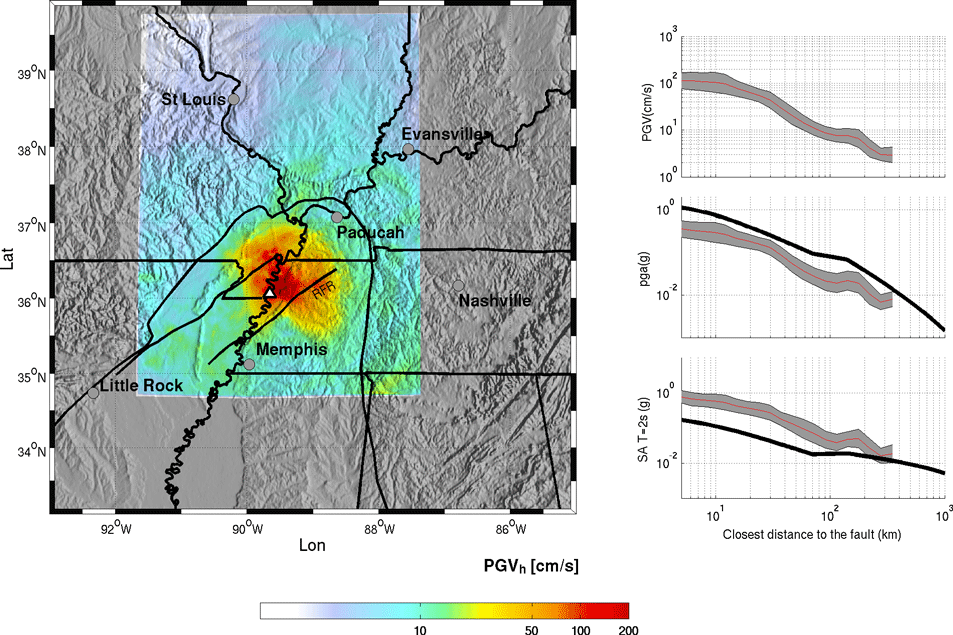
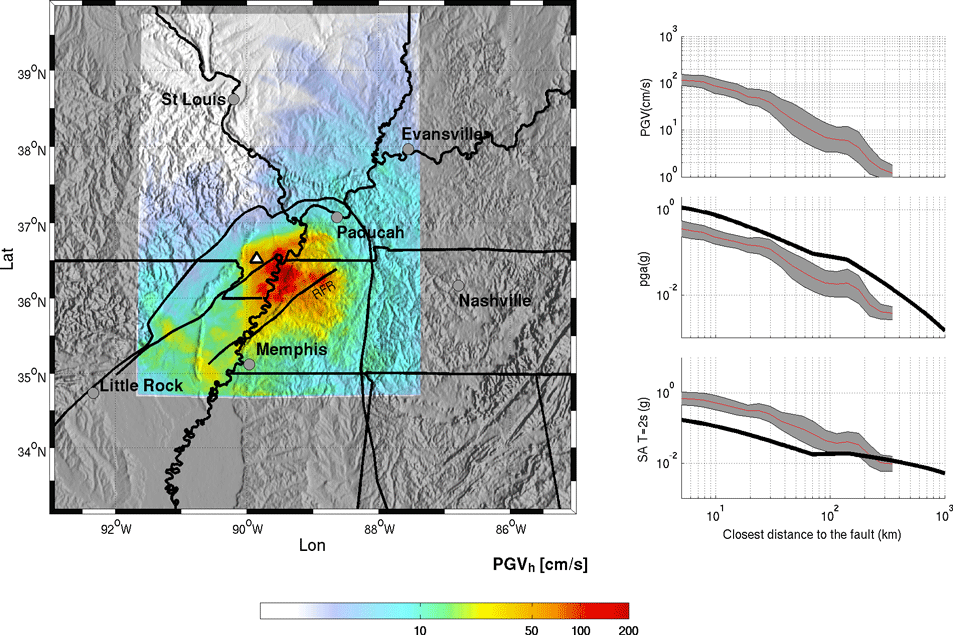
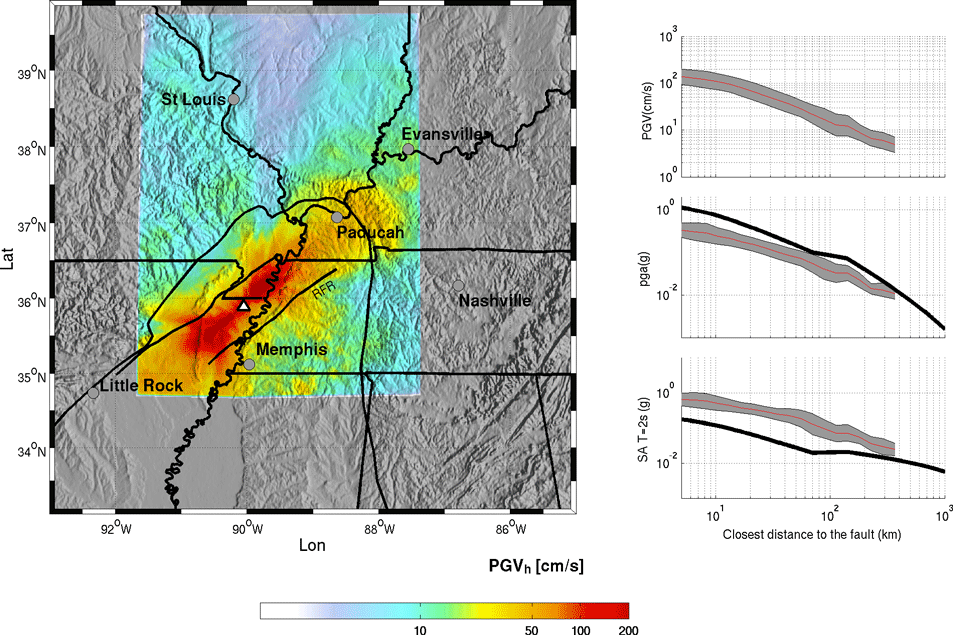
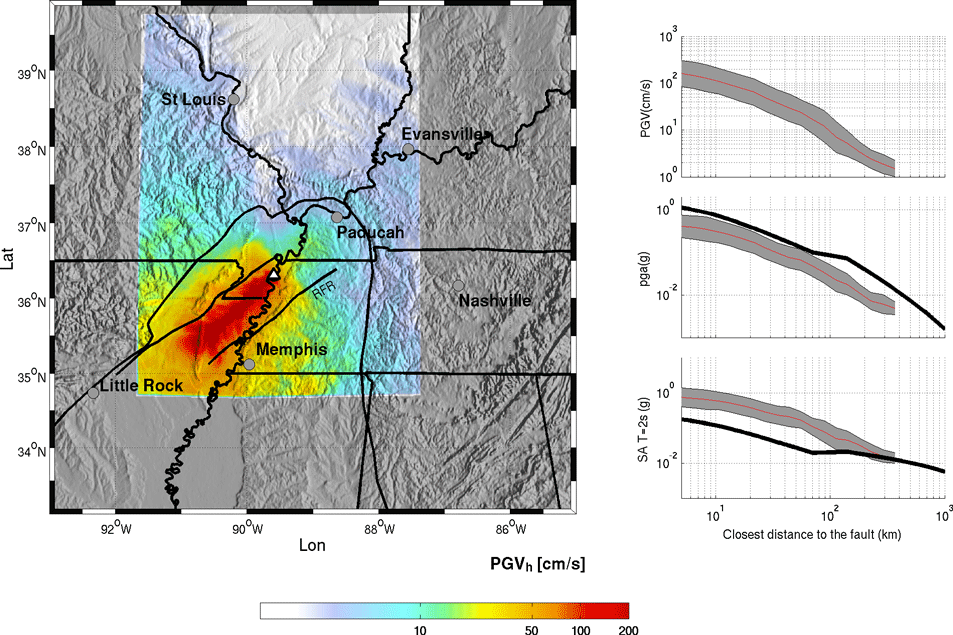
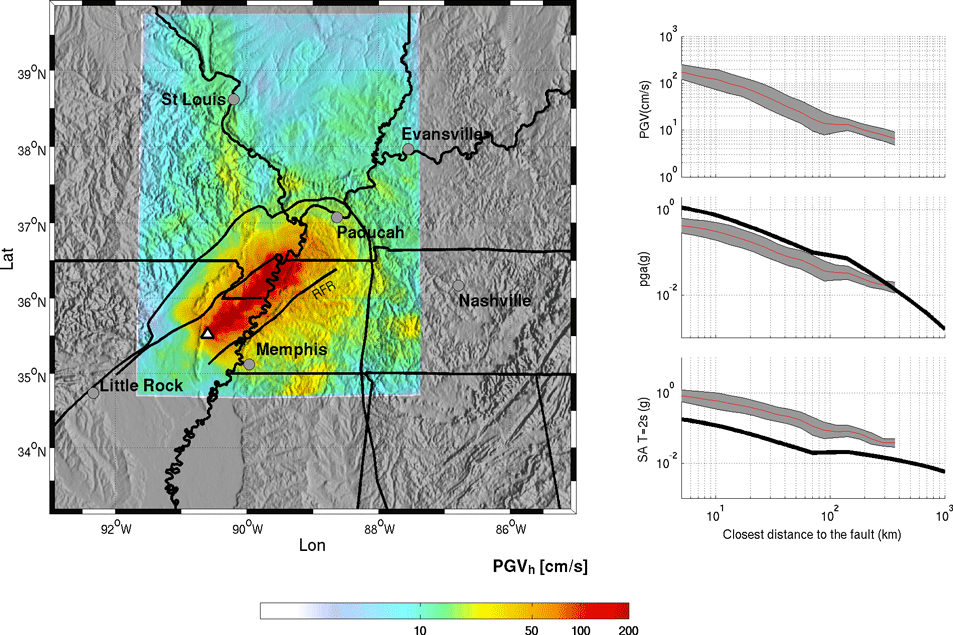
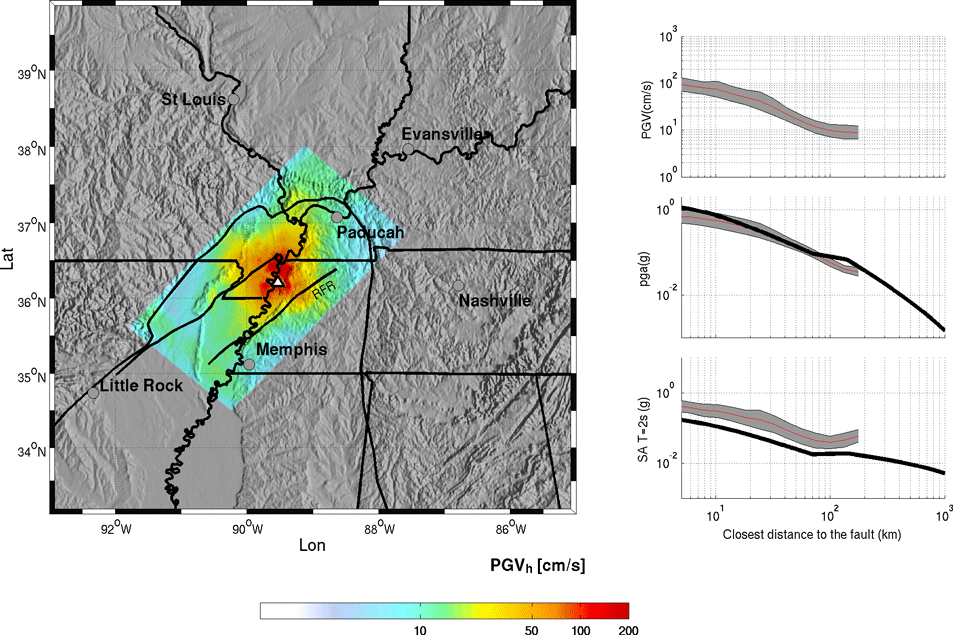
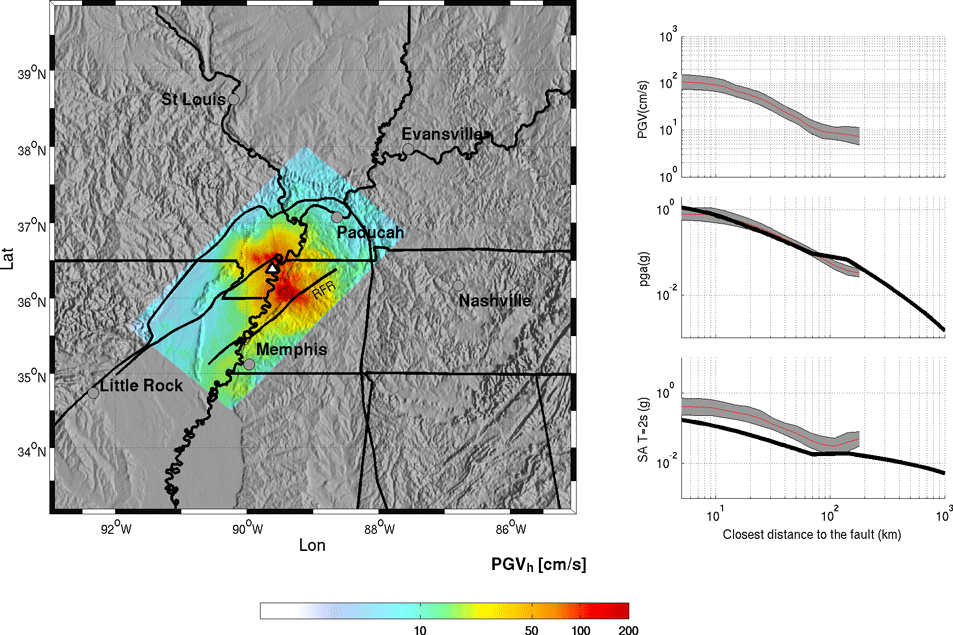
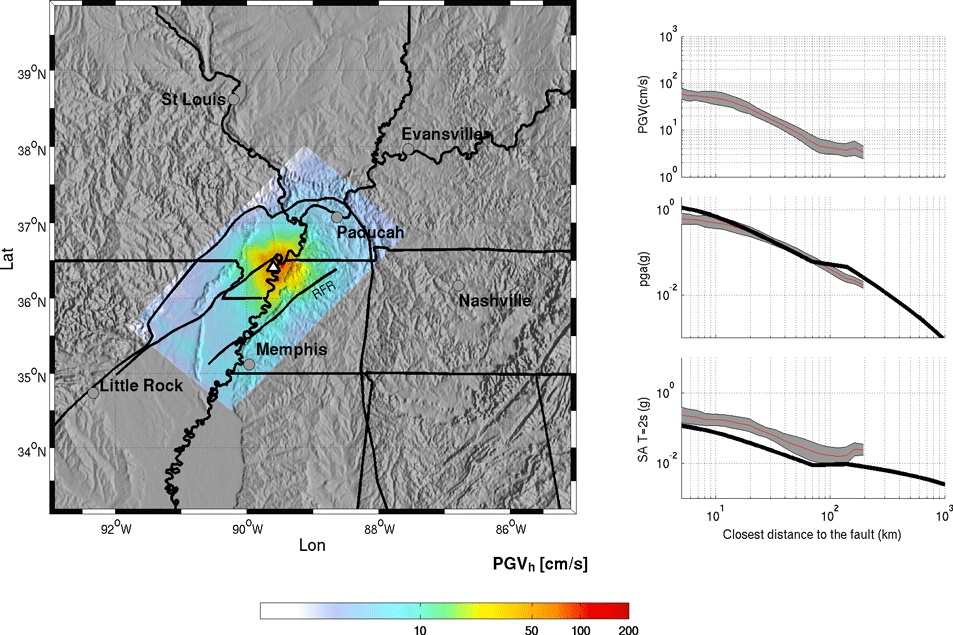
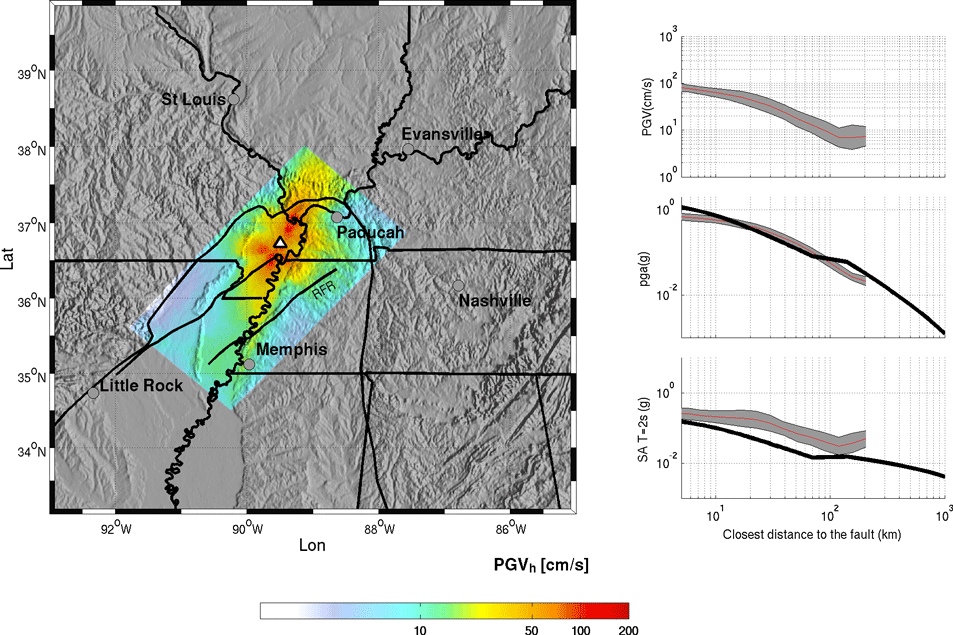
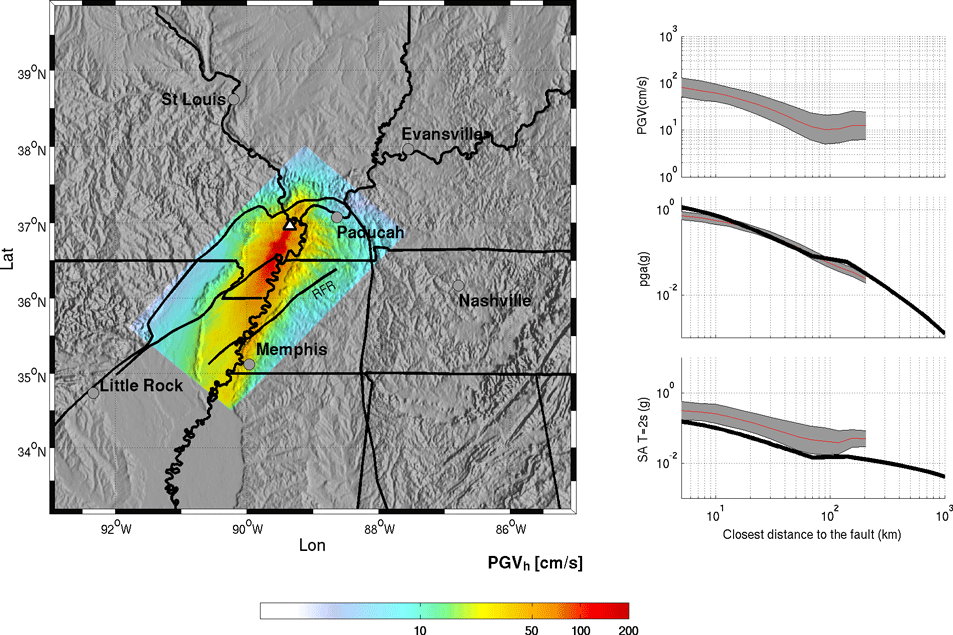
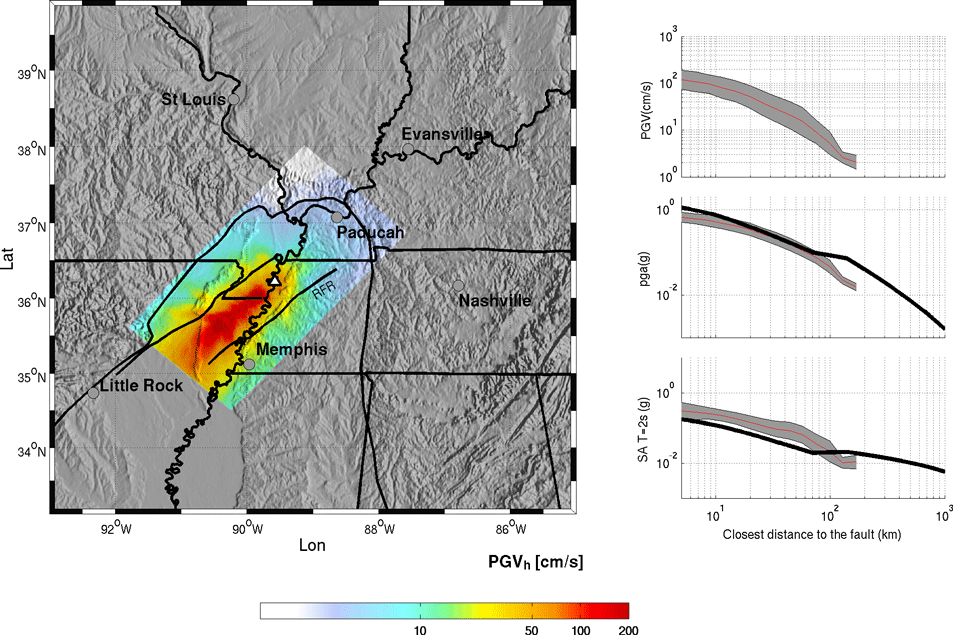
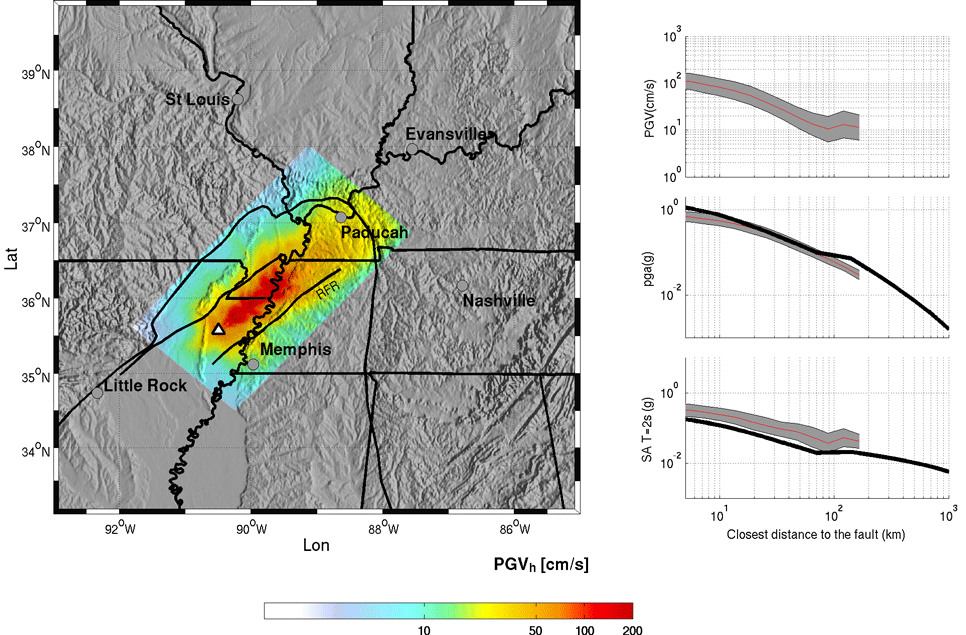
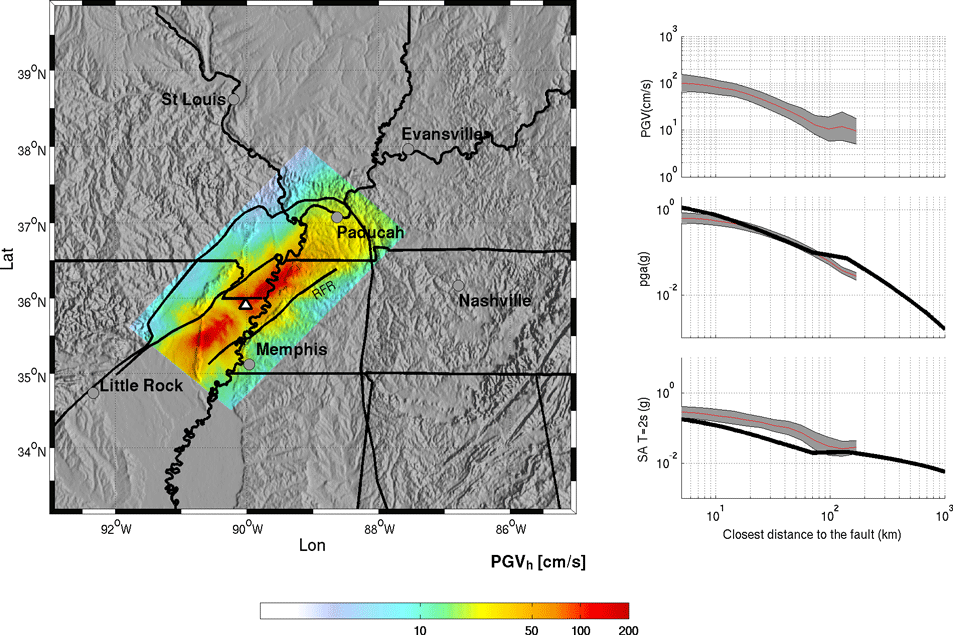
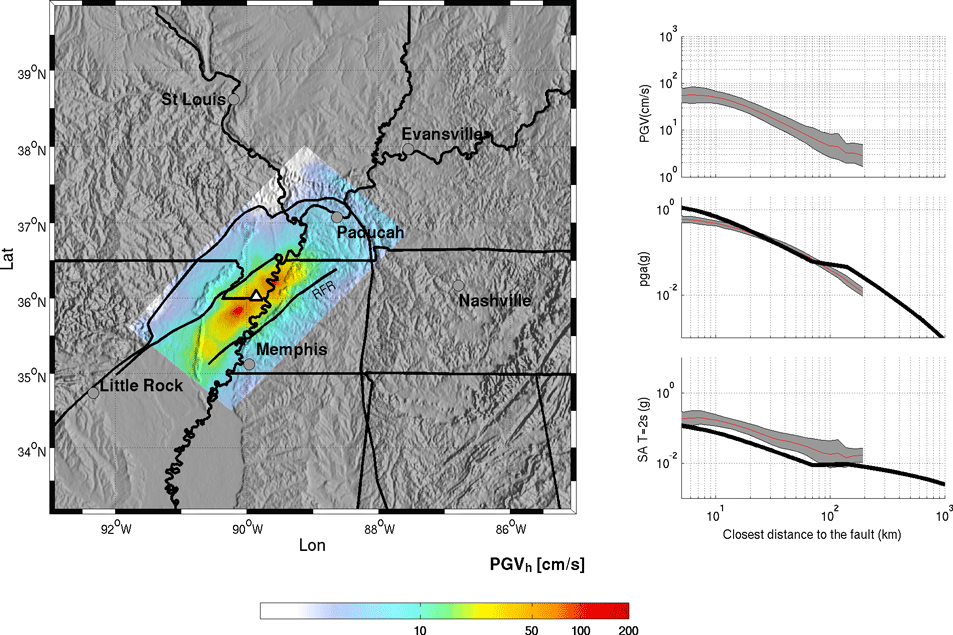
Figures show peak horizontal ground velocity (PGVh), distance versus spectral acceleration (SA) for T = 2 s, peak horizontal ground acceleration (PGA), and peak horizontal ground velocity (PGV).
Figure S9. Mw 7.6 earthquake on the central segment. See Figure S1 for source description.
Figure S10. Mw 7.6 earthquake on the central segment. See Figure S2 for source description.
Figure S11. Mw 7.0 earthquake on the central segment. See Figure S3 for source description.
Figure S12. Mw 7.7 earthquake on the southern segment. See Figure S4 for source description.
Figure S13. Mw 7.7 earthquake on the southern segment. See Figure S5 for source description.
Figure S14. Mw 7.7 earthquake on the southern segment. See Figure S6 for source description.
Figure S15. Mw 7.0 earthquake on the southern segment. See Figure S7 for source description.
Figure S16. Mw 7.0 earthquake on the southern segment. See Figure S8 for source description.
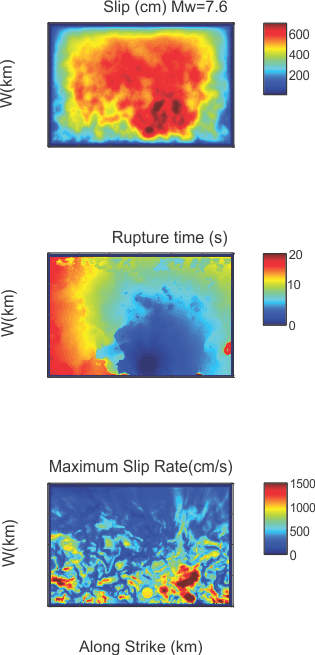
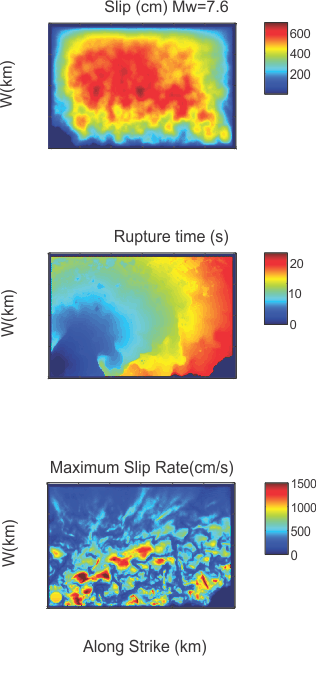
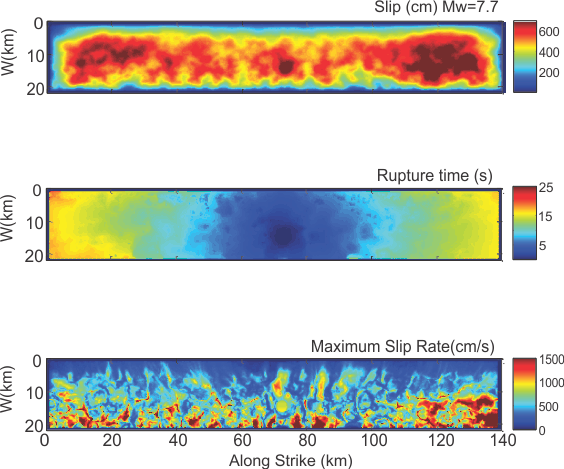
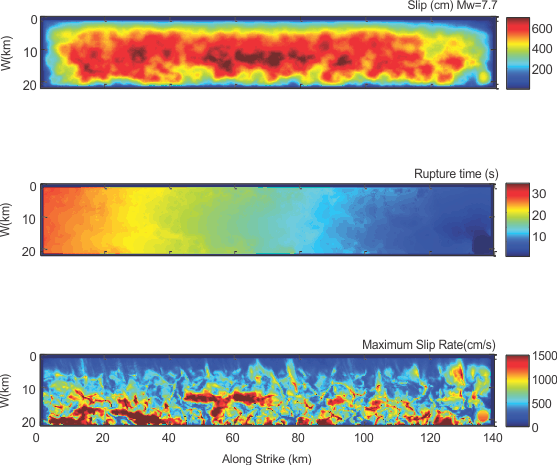
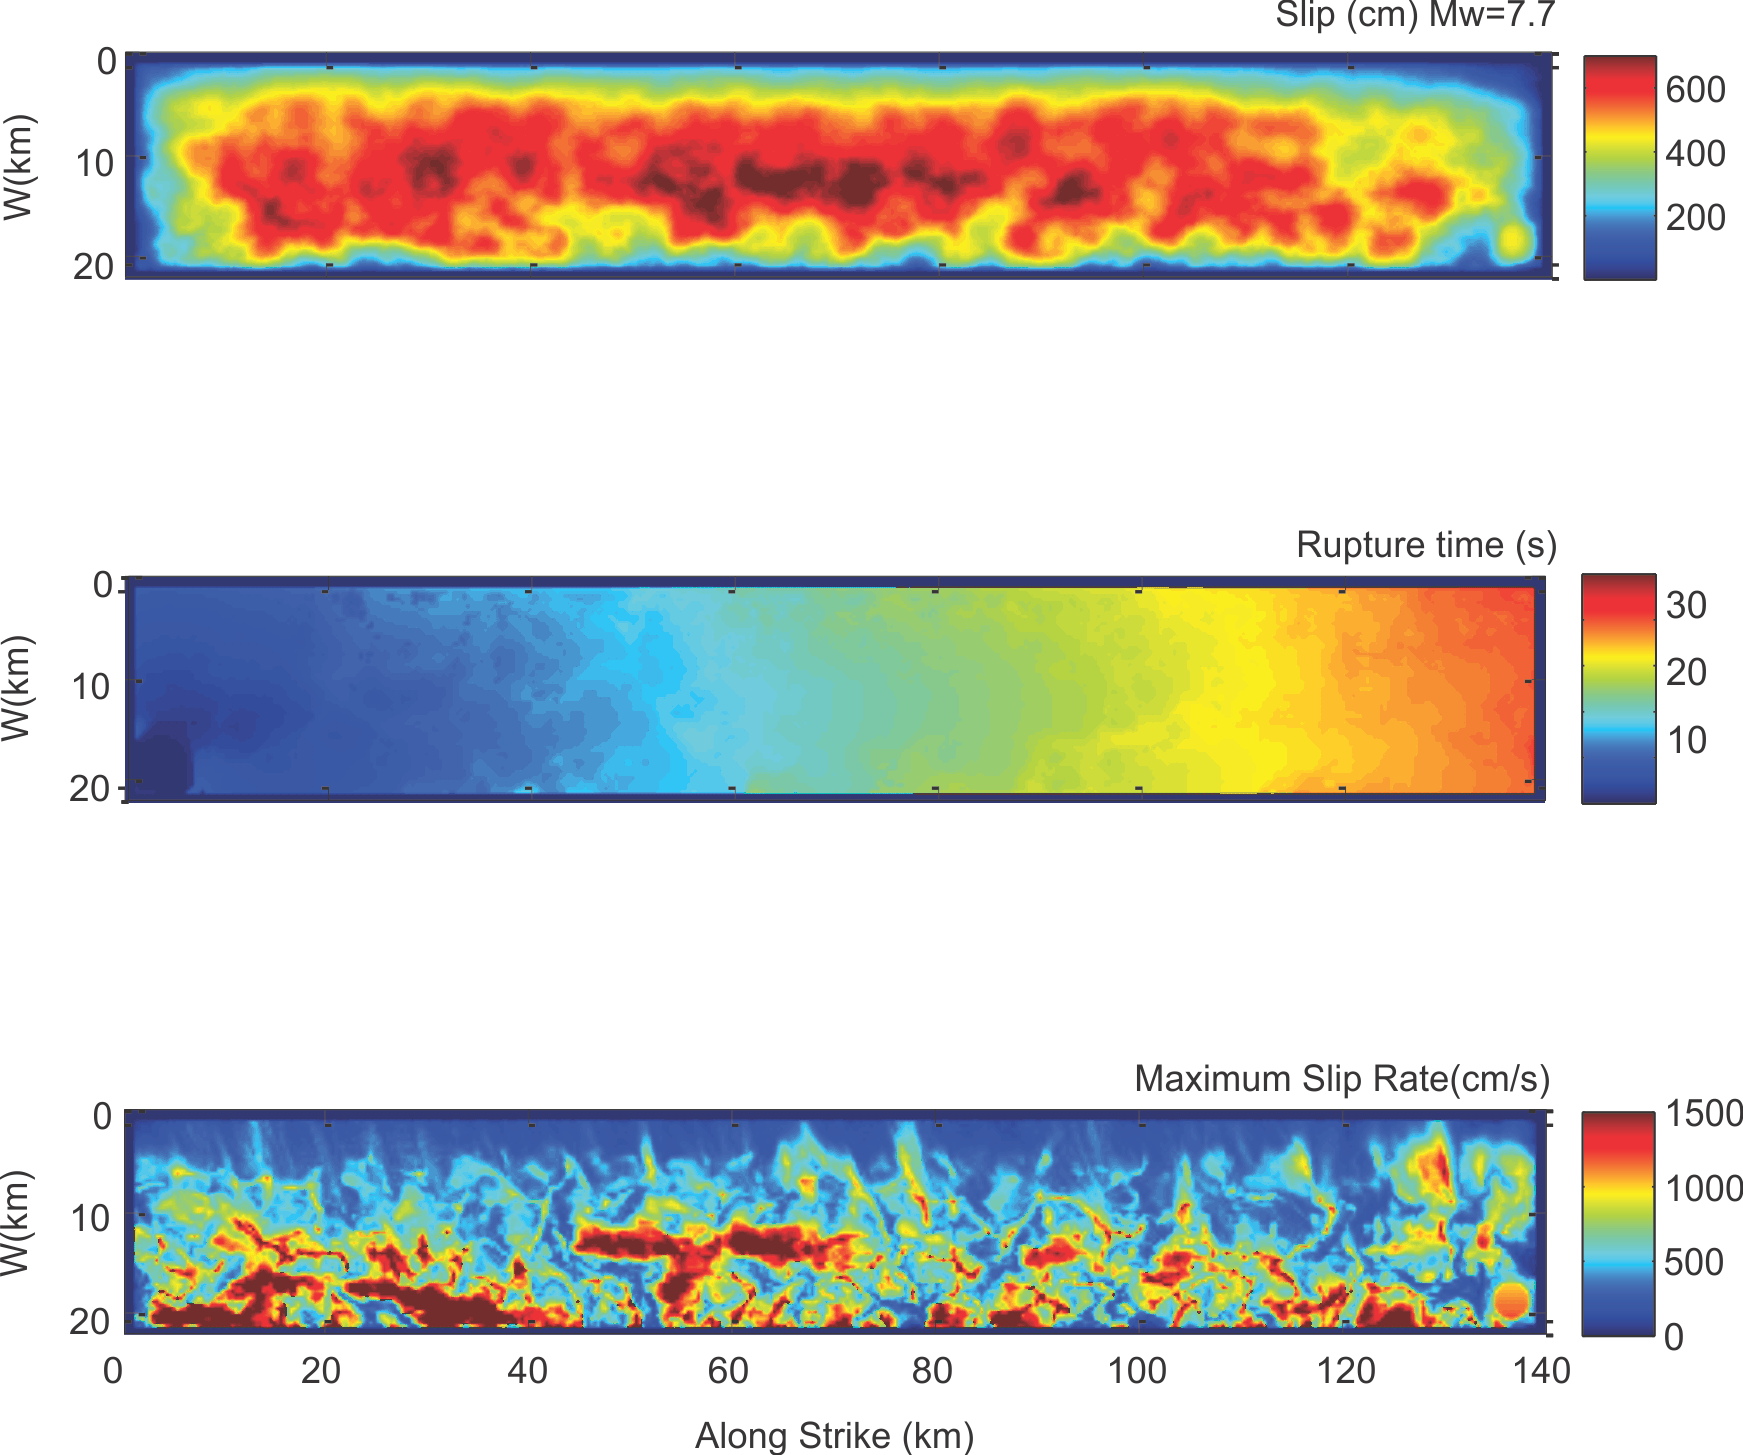
Figures show slip, rupture time, and maximum slip rate.
Figure S17. Mw 7.6 earthquake on the central segment. Hypocenter 1.
Figure S18. Mw 7.6 earthquake on the central segment. Hypocenter 2.
Figure S19. Mw 7.7 earthquake on the southern segment. Hypocenter 1.
Figure S20. Mw 7.7 earthquake on the southern segment. Hypocenter 2.
Figure S21. Mw 7.7 earthquake on the southern segment. Hypocenter 3.
Figures show peak horizontal ground velocity, distance versus SA for T = 2 s, peak horizontal ground acceleration, and peak horizontal ground velocity.
Figure S22. Mw 7.6 earthquake on the central segment. See Figure S17 for source description.
Figure S23. Mw 7.6 earthquake on the central segment. See Figure S18 for source description.
Figure S24. Mw 7.7 earthquake on the southern segment. See Figure S19 for source description.
Figure S25. Mw 7.7 earthquake on the southern segment. See Figure S20 for source description.
Figure S26. Mw 7.7 earthquake on the southern segment. See Figure S21 for source description.
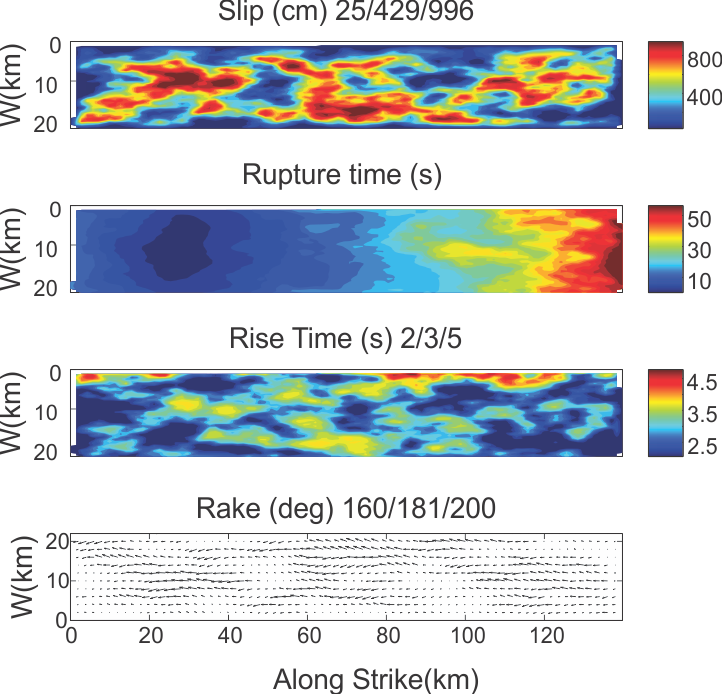
Figures show slip, rupture time, rise time, and rake. The minimum/mean/maximum are reported above each plot.
Figure S27. Mw 7.6 earthquake on the central segment. Hypocenter 1.
Figure S28. Mw 7.6 earthquake on the central segment. Hypocenter 2.
Figure S29. Mw 7.0 earthquake on the central segment. Hypocenter 1.
Figure S30. Mw 7.4 earthquake on the Northern Segment. Hypocenter 1.
Figure S31. Mw 7.4 earthquake on the Northern Segment. Hypocenter 2.
Figure S32. Mw 7.7 earthquake on the southern segment. Hypocenter 1.
Figure S33. Mw 7.7 earthquake on the southern segment. Hypocenter 2.
Figure S34. Mw 7.7 earthquake on the southern segment. Hypocenter 3.
Figure S35. Mw 7.0 earthquake on the southern segment. Hypocenter 1.
Figures show peak horizontal ground velocity, distance versus SA for T = 2 s, peak horizontal ground acceleration, and peak horizontal ground velocity.
Figure S36. Mw 7.6 earthquake on the central segment. See Figure S27 for source description.
Figure S37. Mw 7.6 earthquake on the central segment. See Figure S28 for source description.
Figure S38. Mw 7.0 earthquake on the central segment. See Figure S29 for source description.
Figure S39. Mw 7.4 earthquake on the Northern Segment. See Figure S30 for source description.
Figure S40. Mw 7.4 earthquake on the Northern Segment. See Figure S31 for source description.
Figure S41. Mw 7.7 earthquake on the southern segment. See Figure S32 for source description.
Figure S42. Mw 7.7 earthquake on the southern segment. See Figure S33 for source description.
Figure S43. Mw 7.7 earthquake on the southern segment. See Figure S34 for source description.
Figure S44. Mw 7.0 earthquake on the southern segment. See Figure S35 for source description.
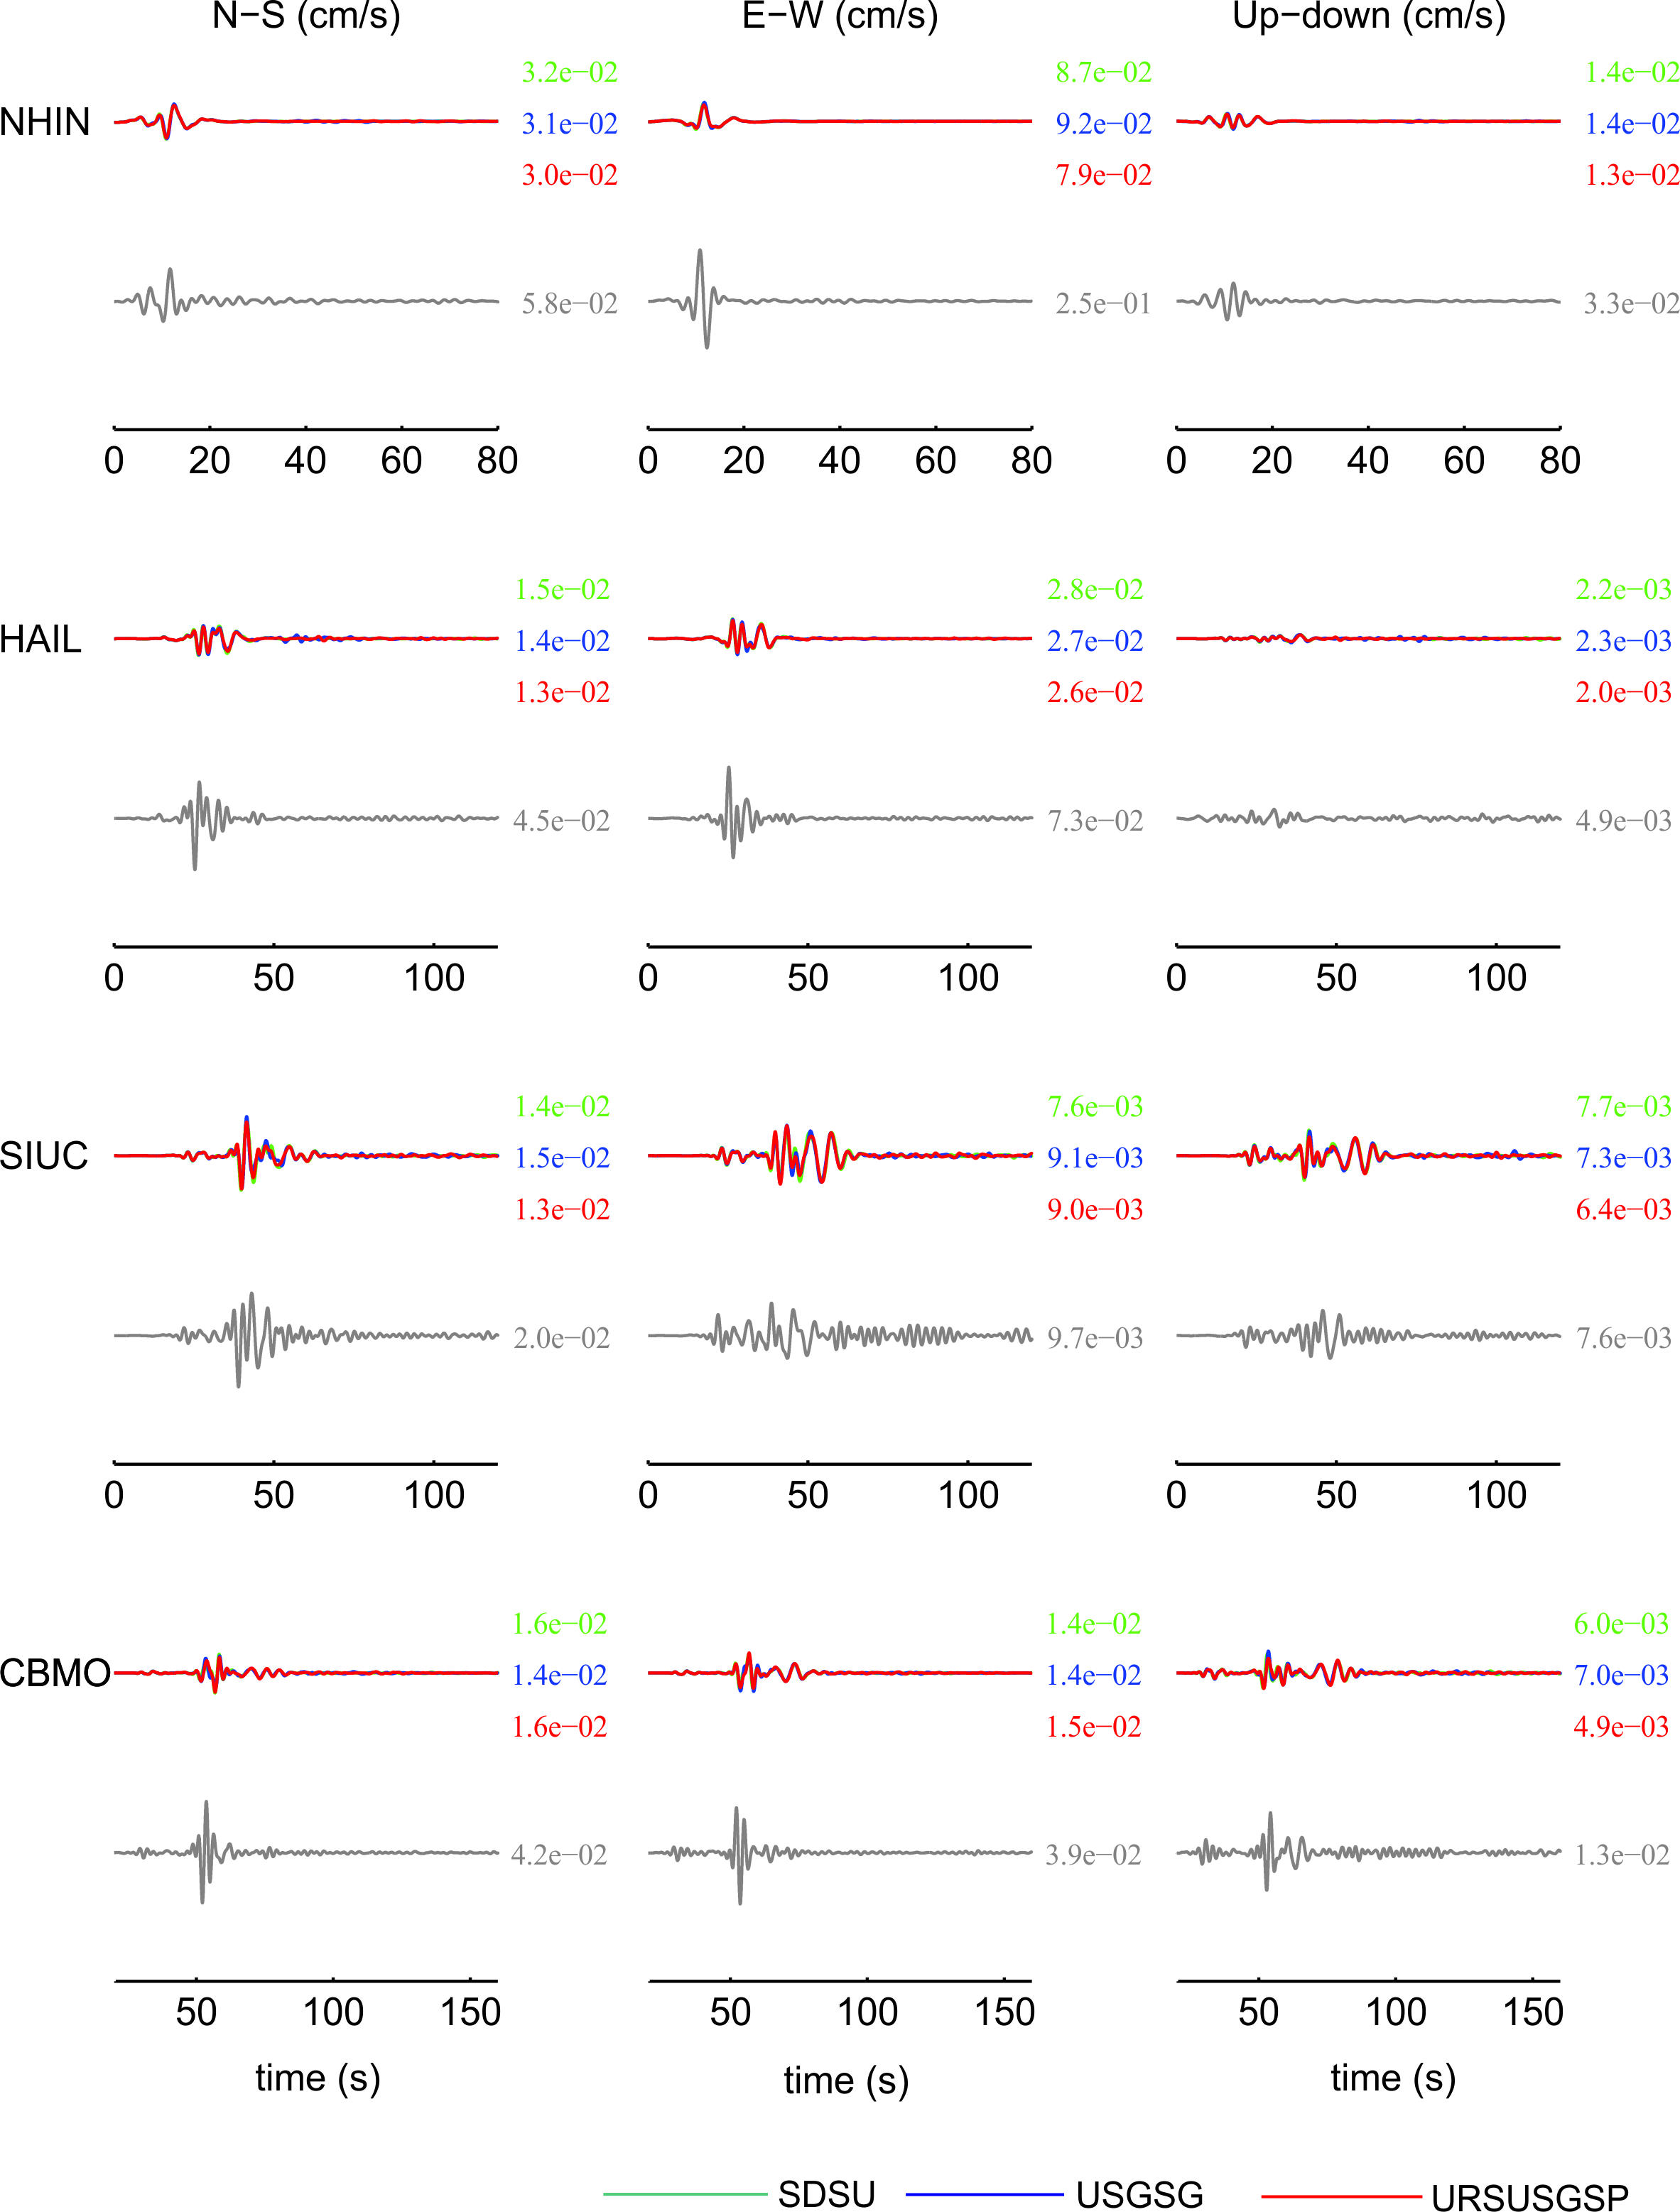
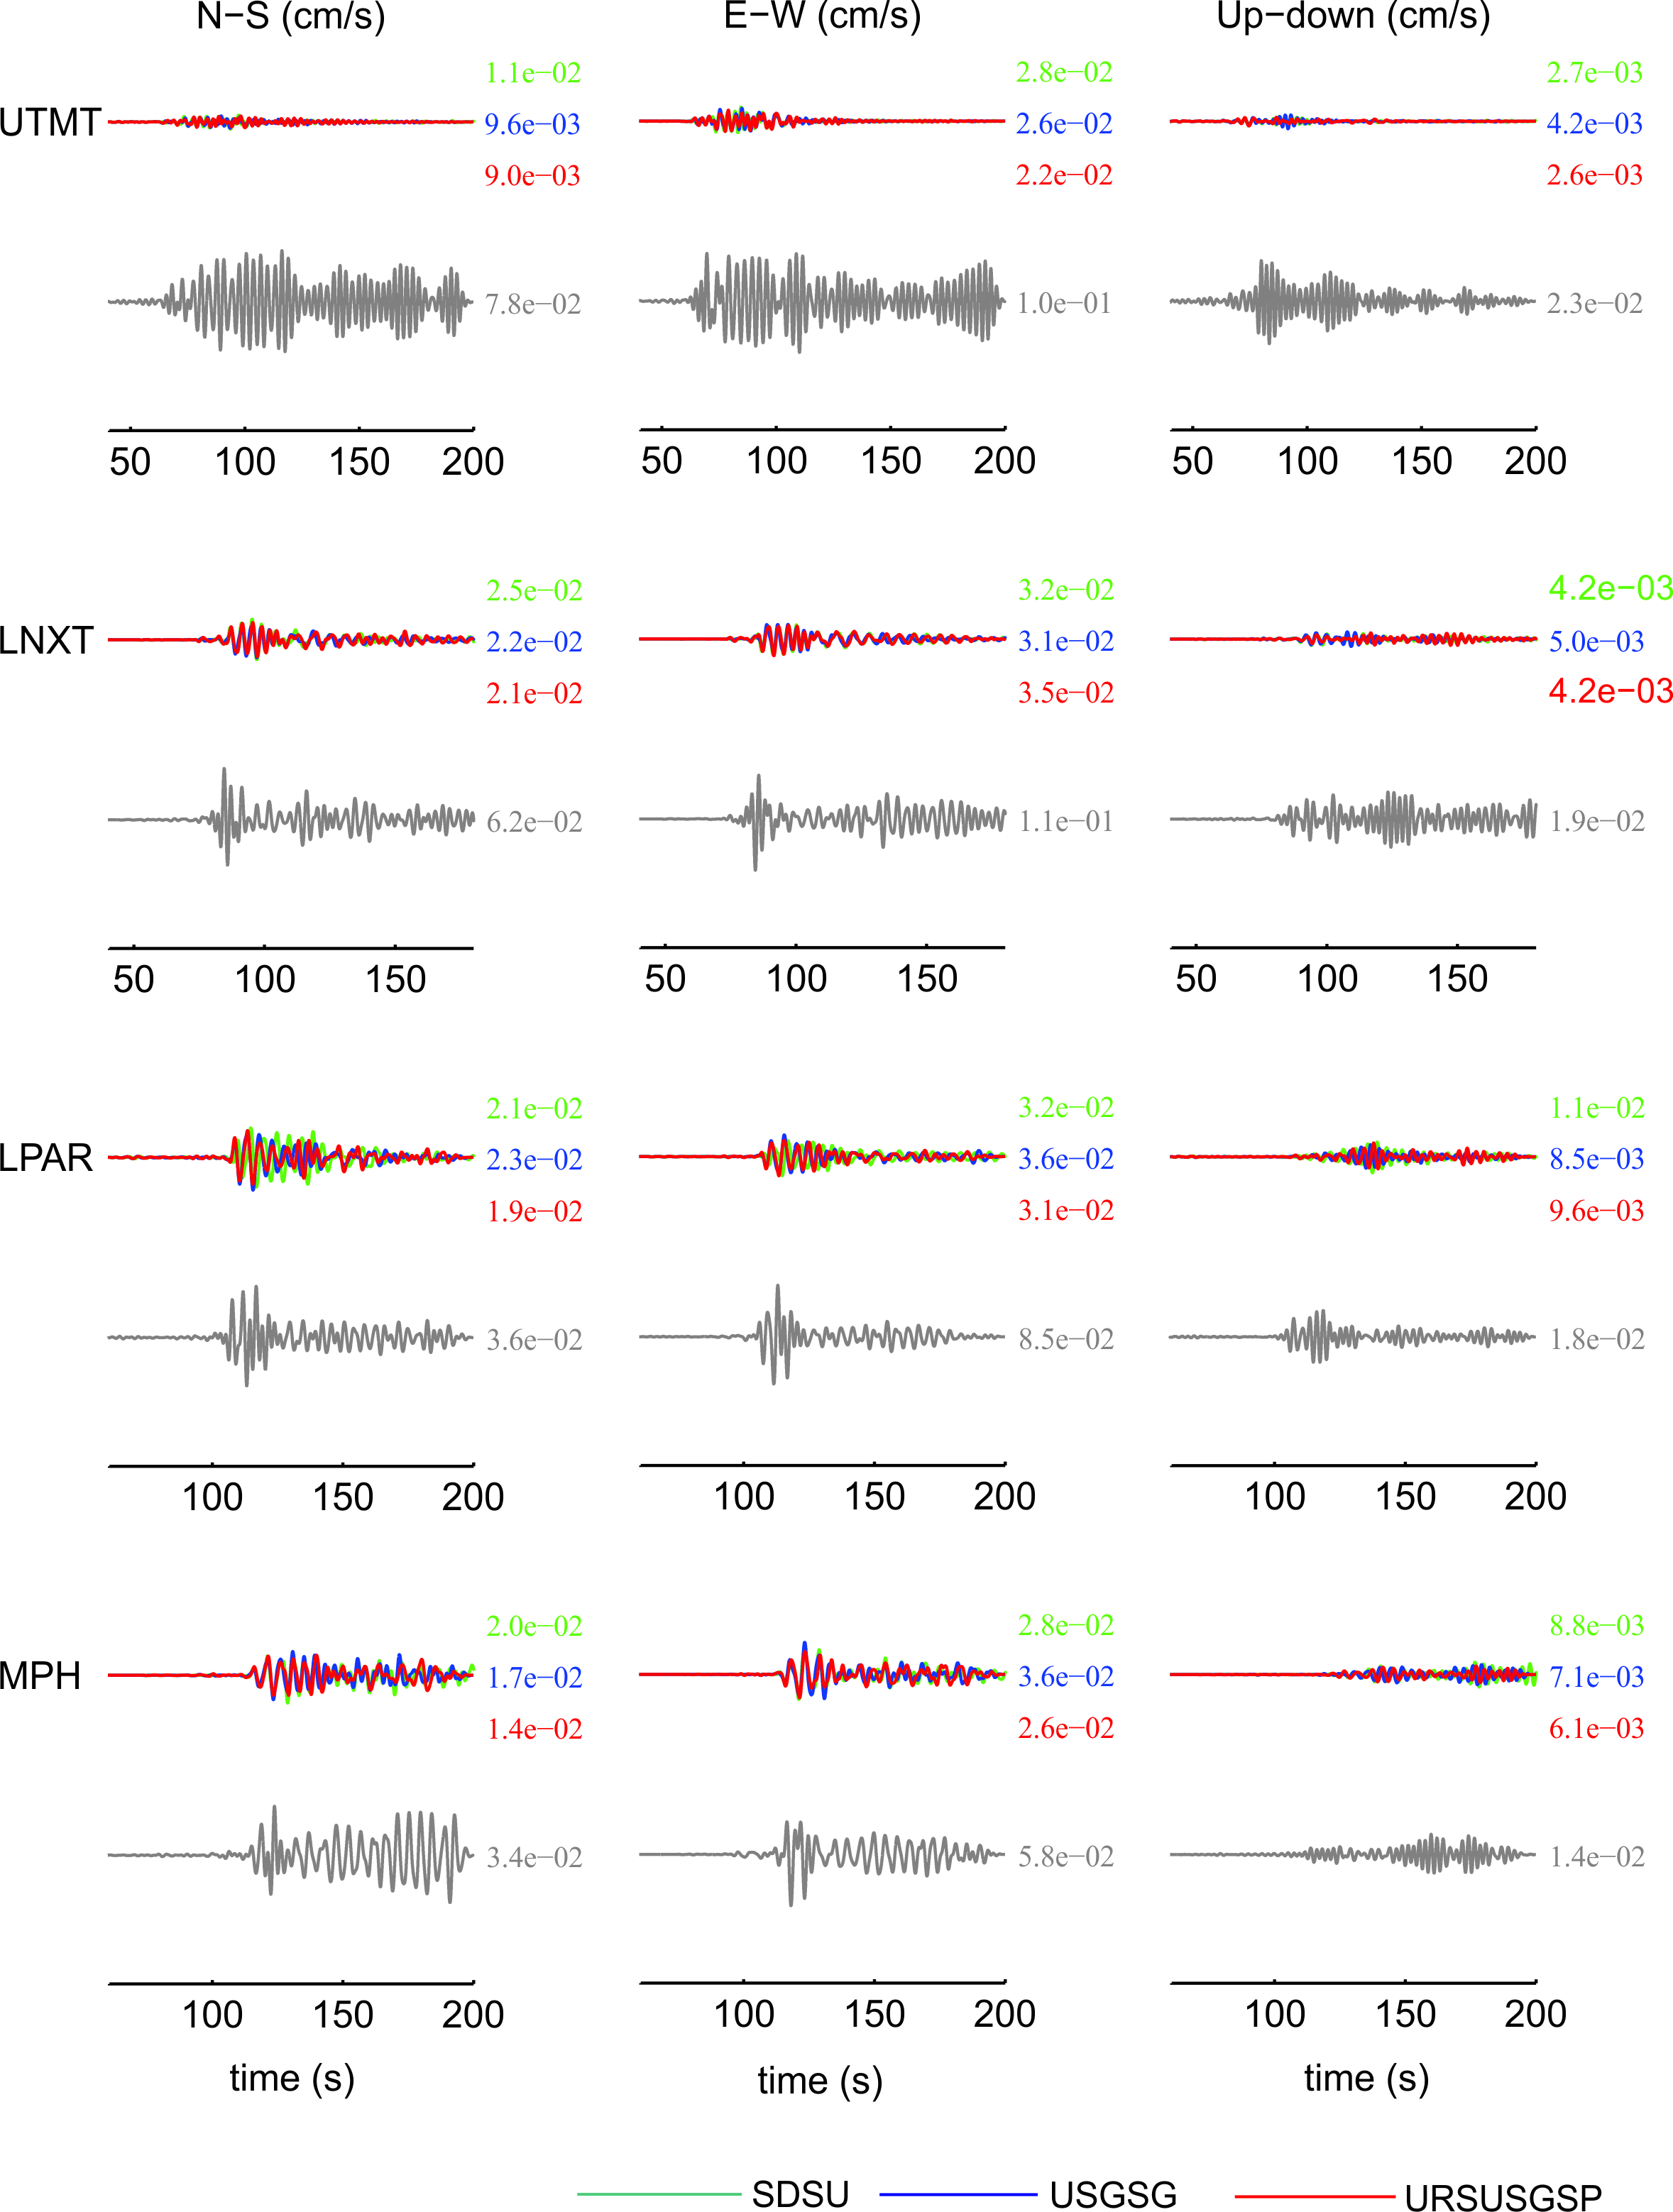
Synthetic ground-motion velocities are plotted together with the observed records at different stations for the 2008 M 5.4 Mt. Carmel earthquake. See Figure A1 in the appendix of the main article for the location of the stations displayed. Observed and synthetic peak values are included for each station.
Figure S45. Set 1 of synthetic ground motions (color lines) and observed (gray continuous line) for the three models. (N-S, north–south direction; E-W, east–west direction)
Figure S46. Set 2 of synthetic ground motions (color lines) and observed (gray continuous line) for the three models. (N-S, north–south direction; E-W, east–west direction)
[ Back ]