
ITACA (ITalian ACcelerometric Archive): A Web Portal for the Dissemination of Italian Strong-motion Data
Lucia Luzi, Salomon Hailemikael, Dino Bindi, Francesca Pacor, and Francesco Mele
Istituto Nazionale di Geofisica e Vulcanologia
Fabio Sabetta
Dipartimento della Protezione Civile
Online material: Additional information on the Italian strongmotion database.
INTRODUCTION
The Italian strong-motion database contains 2,182 threecomponent waveforms generated by 1,004 earthquakes with a maximum magnitude of 6.9 (1980 Irpinia earthquake) for the period from 1972 to 2004. The database is devoted to serving the seismological and engineering communities and can be accessed online at http://itaca.mi.ingv.it, where a wide range of search tools enables the user to interactively search events and recording stations and retrieve waveforms with particular characteristics. The user can specify parameters through a graphical user interface (GUI). A range of display options allows users to view data in different contexts and to extract and download time series and spectral data.
The database was created during a joint project between the Istituto Nazionale di Geofisica e Vulcanologia (Italian Institute for Geophysics and Volcanology, INGV) and the Dipartimento della Protezione Civile (Department of Civil Protection, DPC). The aim of the project was the collection, homogenization, and distribution of data acquired over the time period 1972–2004 in Italy by different Italian institutions, namely Ente Nazionale per l’Energia Elettrica (Italian Electricity Company, ENEL), Ente per le Nuove Tecnologie, l’Energia e l’Ambiente (Italian Energy and Environmental Organization, ENEA), and the DPC. The project had multiple purposes, such as permanent strong-motion monitoring and temporary monitoring during seismic sequences or before permanent installation.
This database updates the ENEA strong-motion data collection, which ended in 1993, and the European database, where the most recent Italian data pertain to the Umbria-Marche sequence of 1997–1998 (Ambraseys et al. 2002). In addition, we reviewed strong-motion metadata and data processing to increase data quality and reliability. This article describes the project and provides an overview of the search capabilities available at the database interface Web site.
DATABASE CONSTRUCTION
The database was created and implemented in three main steps:
- Definition of the database schema
- Collection and processing of waveforms
- Review of seismic event, station and instrument metadata
Definition of the database schema
The first issue we addressed was the database schema and selection of commercial software for the relational database management system (RDBMS). The database is handled through two different RDBMSs: Microsoft Access 2003 for data input and DVD release and Sun Microsystems MySQL for Web distribution. We selected Microsoft Access 2003 because of the simplicity of the software, its worldwide distribution, and the ability to link to spatial data management software such as ESRI products or software for scientific implementations such as Matlab.
We created 48 tables to store the seismic event information, the recording stations, the installed instruments, and the strong-motion parameters, which are connected through a relational structure to avoid data redundancy.
We then defined a standard format for the waveform data: the file name is composed of 33 characters that include event date and time, recording network, recording site, component, correction flag, and time series type (acceleration, velocity, displacement, or acceleration spectrum). We chose this naming convention to facilitate file organization and management with simple operating system (OS) commands. The waveform file is in ASCII (American Standard Code for Information Interchange) format; it contains a metadata header of 43 rows that describes the event, the recording site, and the instrument metadata. Processing information is also included for correct use of the data. Each waveform record has a self-consistent structure. The waveforms are also available in seismic analysis code (SAC; Goldstein et al. 2003), a format used by the seismological community. They are distributed both in processed and raw format, so that expert users can reprocess the data according to their needs.
Collection and processing of waveforms
The strong-motion dataset is composed of waveforms recorded by a wide variety of instruments. Before 1997 the accelerometers were almost entirely analog; after 1997 these were progressively substituted with digital ones. The heterogeneity of the records convinced us that individual waveform processing was preferable to automatic processing. The strong-motion dataset was therefore processed in a homogeneous way, in spite of the different sources, to obtain reliable estimates of acceleration, velocity time series, and acceleration response spectra.
We removed the linear trend of each raw analog record and convolved the obtained signal with the instrument response. Then we bandpass-filtered the time series, selecting the highpass frequency by visual inspection of the Fourier spectrum, in order to detect the deviation from an omega-square shape. The low-pass frequency was generally selected close to the instrument corner frequency, usually centered on 20–25 Hz.
We have not yet convolved the digital records with the instrument response, because in these cases, the instrument response is generally flat beyond 50 Hz. Because few records had a usable pre-event, we removed the linear trend fitting the entire record. We applied a bandpass filter, selecting the highpass frequency similarly to the analog records, while the lowpass frequency was generally applied in the range of 25–30 Hz. We selected the filter type to avoid phase shifts in the signal, which can alter the calculation of velocity and displacement timehistories and the shape of the elastic response spectra at frequencies higher than the applied low-cut (Boore and Bommer 2005). A raised cosine filter was used for the analog records, often triggered on the S-phase, and an acausal 4th-order Butterworth was used for the digital signals, after applying a cosine taper at the beginning and at the end of the record to avoid the filter transients. Preserving the low-frequency content of these records was of primary importance during the processing phase.
Review of seismic event, station, and instrument metadata
Reviewing the seismic event, station, and instrument metadata required the largest effort because the data were extremely unhomogeneous and sparse. In many cases, we undertook new field surveys for those stations that recorded the mainshock of strong earthquakes or the aftershocks of important seismic sequences, or when evident site effects were detectable from the records.
The seismic event metadata have an accuracy that reflects the network and instrument evolution during the 30-year time span covered by the strong-motion database. The Italian seismic network managed by INGV (ING until 1999) increased from 12 instruments in 1972 to about 180 in 2004. As an example, the Italian Seismic Bulletin of 1972 included only six phases for the magnitude 5 event recorded offshore of Ancona in 1972, while an event with the same magnitude in 2004 was recorded by more than 70 instruments of the Italian Seismic Network, owned by INGV.
We used different catalogs to retrieve the hypocentral parameters and magnitudes for different periods:
- ING catalog (internal database of INGV) for events in the period 1972–1982;
- Catalog of Italian Seismicity—CSI (http://www.ingv.it/CSI/), version 1.1 (Castello et al. 2006) and version 2.0 (R. Di Stefano, personal communication) for events subsequent to 1982;
- Bollettino Sismico Italiano (INGV—CNT 2007, http://legacy.ingv.it/%7eroma/reti/rms/bollettino/) for some events subsequent to 1982; and
- Catalogo Parametrico dei Terremoti Italiani CPTI04 (http://emidius.mi.ingv.it/CPT104/) used only for some surface wave magnitude values and as a reference for alternative hypocenters.
We preferred the CSI catalogs because the hypocentral parameters are instrumentally determined by integrating the Italian seismic network with regional and non-Italian networks. Events localized offshore or showing large horizontal errors in these catalogs were relocated using the procedure proposed by Mele et al. (2002).
Each event is associated with one or more magnitude estimates (local magnitude, Ml; surface wave magnitude, Ms; moment magnitude, Mw; body wave magnitude, Mb). The Mw is evaluated from the solution of the parameters of the centroid moment tensor (CMT) or from the regional centroid moment tensor (RCMT; Pondrelli et al. 2006) and Earthquake Mechanisms of the Mediterranean Area (EMMA version 2, Vannucci and Gasperini 2004). The Mb and Ms are attributed on the basis of the International Seismological Centre (ISC; http://www.isc.ac.uk) bulletin or the National Earthquake Information Centre (NEIC; http://earthquake.usgs.gov/regional/neic) catalog. For earthquakes with low magnitude values (< 4), the reference is the local magnitude, Ml, obtained from INGV instrumental catalogs.
For the focal mechanisms, we adopted the classification of Zoback (1992), which discriminates among five main types: normal faulting, predominately normal faulting with strikeslip component, strike-slip faulting (with eventual minor normal or thrust component), thrust-faulting, and predominately thrust-faulting with strike-slip component. The fault geometry, strike, dip, and rake are reported for the major events. They are obtained from the Istituto Nazionale di Geofisica e Vulcanologia’s Database of Individual Seismogenic Sources (DISS) Version 3.0.2 (http://www.ingv.it/DISS/).
The geographic distribution of the seismic events included in the database is shown in Figure 1A. The events are mainly located in the Apennines and in the eastern Alps. The magnitude distribution is shown in Figure 1B; only 38 events have local magnitudes equal to or higher than 5, representing a small percentage of the total (about 4%). The distribution of peak ground acceleration (PGA) values reflects the event distribution. Only 15% of the waveforms (about 640, if all the components are examined) have PGA values greater than 50 gal (Figure 2).
We included the station metadata in the database after collecting pre-existing data and performing field investigations. In particular the metadata concerning 620 strong-motion stations have been collected; 330 of these are now inoperative because they were part of temporary networks or were equipped with old analog instruments that have been removed.
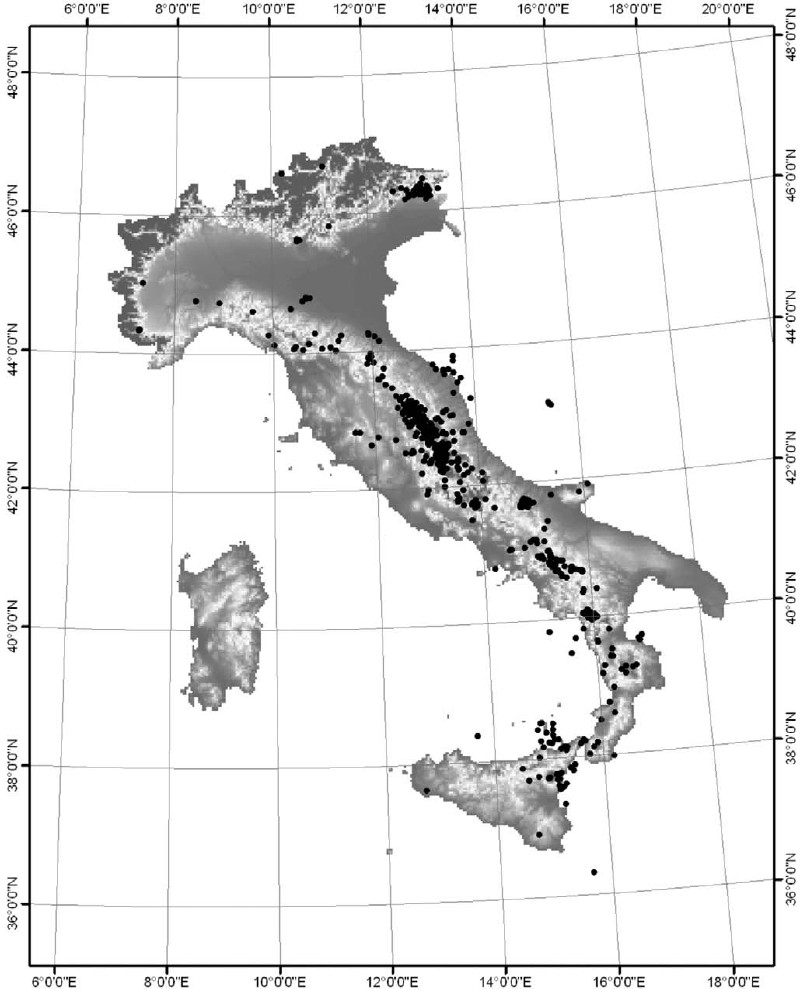
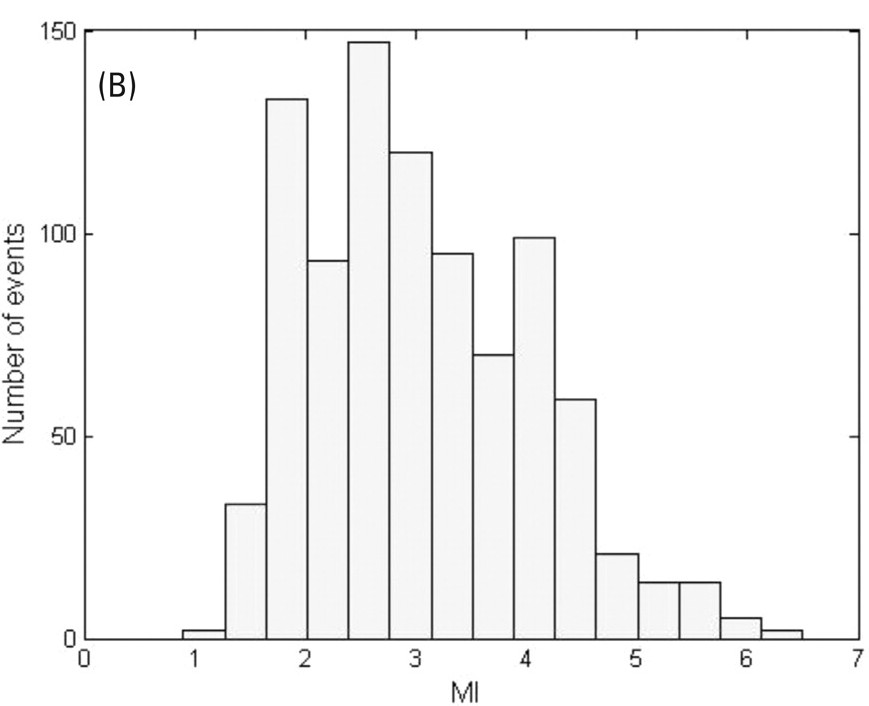
▲ Figure 1. (A) Map of Italy showing the geographic distribution of seismic events and (B) local magnitude distribution.
Station metadata are composed of different levels. The descriptive level includes all the synthetic information regarding the site, such as name, code, address, coordinates, topographic map location, geotechnical class, type of installation, etc. The map level includes the station location on a topographic map or an aerial photograph and a geologic map. The table level includes different useful parameters for the geotechnical site characterization, including stratigraphic logs, standard penetration test (SPT) logs, Vs/Vp profiles, dispersion curves, fundamental frequencies, site response functions, etc. Furthermore, the station metadata have been stored in specific metadata reports (about 400 pdf files have been compiled), which can be downloaded through the Web interface to the database.
During the project we undertook field investigations to characterize the sites that recorded the strongest Italian events (i.e., 1980 Irpinia, Mw 6.9; 1984 Lazio-Abruzzo, Mw 5.9; 1997 Umbria-Marche, Mw 6.0). We applied different geophysical techniques, depending on the nature and importance of the site: downhole, cross-hole, seismic refraction, seismic reflection, spectral analysis of surface waves, and noise measurements (single station or array). In addition, we performed detailed geological and geomechanical surveys on rock sites showing remarkable amplification phenomena.
THE ONLINE DATABASE
Strong motion data dissemination is achieved through the database Web portal at http://itaca.mi.ingv.it.
The data acquired by different institutions are stored in a RDBMS on the Web server. Intuitive graphical user interfaces allow queries selecting station, seismic event, and waveform parameters. The strong-motion recordings selected with a search query can be downloaded by Web clients in raw and processed format, together with the velocity and displacement time series and acceleration response spectra. A schematic of the user interface is illustrated in Figure 3.
The database can be explored through searchable key fields: 10 for the stations, eight for the seismic events, and nine for the waveforms. The design philosophy of the database is that separate queries can be performed through three distinct database interfaces: stations, events, and waveforms. Alternatively, a progressive search can be done starting with the selection of seismic event parameters and progressively constraining the results with station and waveform parameters, with a record of the choices made displayed at the top of each Web page.
Each query (event, station, waveform, or progressive search) returns a list of matching results, and the single outcome can be explored in detail. Figure 4 shows the user interface for the selection of the recording stations. From the list of outcomes the recordings and the details relative to a single station can be retrieved. Both recording stations and events are plotted using the Google Maps interface that allows the user to display the points either on a satellite image or a basic map (or both), as shown in Figure 5.
The geotechnical information (stratigraphy, number of blows in standard penetration tests, or Vs/Vp profile, etc.), when available, is displayed in a table format, as shown in Figure 6.
For a single event the epicenter is shown together with the triggered stations. Each station can be selected in order to display the recorded waveform (Figure 7).
When a progressive search is made, the user can start with the event characteristics and gradually refine the search by specifying the station and the waveform parameters (Figure 8). In this case only, the selected waveforms can be downloaded in a zip file that contains unprocessed and processed acceleration, velocity, displacement, and acceleration response spectra.
The waveforms that satisfy the required conditions can be displayed with the aid of a Sun Microsystems Java applet (Figure 9) that allows the user to perform simple operations such as zoom in/out, change plot options (axis labels, axis limits, background and foreground color, etc.) and save or print the plot.
CONCLUSION AND FUTURE DEVELOPMENTS
The main features of the Web interface and the relational database management system for the dissemination of the archived Italian strong-motion dataset have been presented. The database has been designed to be a very useful tool for scientific research in the seismological and engineering fields and in particular for data analysis focused on seismic risk assessment.
Several decisions need to be made in order to keep the database constantly updated in the future and improve the amount of information regarding recording sites, waveforms, and seismic events.
One of the most important future challenges will be to perform a correct evaluation of the transfer functions of most of the recording sites, in order to improve the knowledge on the site response. This goal will be reached through the analysis of the recorded waveforms and direct geotechnical site characterization.
Our project emphasizes the importance of site characterization, and many activities have been conducted for this purpose for sites of relevant interest. Moreover, we have established cooperation with the Network of Research Infrastructures for European Seismology (NERIES)—Joint Research Geotechnical Site Characterization (JRA4) to plan and perform geophysical field investigations on 10 Italian recording sites (contract no. RII3-CT-2006-026130; http://www.neries-eu.org/). Even with the amount of work that has already been done with respect to site characterization and site response, there is still much to do. In particular, the nonlinear behavior of soils will require continued monitoring to record a greater number of ground motions in the 100 gal or larger range, as well as continued analysis of these records. ![]()
ACKNOWLEDGMENTS
This work was supported by grants from the understanding between the INGV and DCP in the time span 2004–06. The authors are very grateful to the anonymous reviewer who contributed to the improvement of this paper.
REFERENCES
Ambraseys, N., P. Smit, R. Sigbjornsson, P. Suhadolc, and B. Margaris. (2002). Internet-Site for European Strong-Motion Data. European Commission, Research-Directorate General, Environment and Climate Programme.
Boore, D. M., and J. J. Bommer (2005). Processing of strong motion accelerograms: Needs, options and consequences. Soil Dynamics and Earthquake Engineering 25, 93–115.
Castello, B., G. Selvaggi, C. Chiarabba, and A. Amato (2006). CSI Catalogo della sismicità italiana 1981–2002, version 1.1. INGVCNT, Roma. http://www.ingv.it/CSI/.
Global Centroid Moment Tensor Project. http://www.globalcmt.org Goldstein, P., D. Dodge, M. Firpo, and L. Minner (2003). SAC2000: Signal processing and analysis tools for seismologists and engineers. In IASPEI International Handbook of Earthquake and Engineering Seismology, ed. W. H. K. Lee, H. Kanamori, P.C. Jennings, and C. Kisslinger. London: Academic Press.
Istituto Nazionale di Geofisica e Vulcanologia MedNet - Mediterranean Very Broadband Seismographic Network. http://mednet.rm.ingv.it. Istituto Nazionale di Geofisica. ING Catalogue (1450 B.C.–1990). Roma.
Mele, F., L, Badiali, C. Marcocci, and A. Piscini (2002). Locator: i codici. Un sistema di localizzazione in tempo quasi reale. Technical notes of Centro Dati e Informazione sui Terremoti, n. 6 / 2002.
Pondrelli, S., S. Salimbeni, G. Ekström, A. Morelli, P. Gasperini, and G. Vannucci (2006). The Italian CMT dataset from 1977 to the present. Physics of the Earth and Planetary Interiors 159 (3–4), 286–303; doi:10.1016/j.pepi.2006.07.008, http://www.bo.ingv.it/RCMT/.
Vannucci, G., and P. Gasperini (2004). The new release of the database of Earthquake Mechanisms of the Mediterranean Area (EMMA version 2). Annals of Geophysics 47 (1), supplement, 307–334.
Zoback, M. L. (1992). First- and second-order patterns of stress in the lithosphere: The World Stress Map Project. Journal of Geophysical Research 97 (B8), 11,703–11,728.
[ Back ]
Posted: 26 September 2008