September/October 2011
Bad Assumptions or Bad Luck: Why Earthquake Hazard Maps Need Objective Testing
During World War II, future Nobel Prize winner Kenneth Arrow served as a military weather forecaster. “My colleagues had the responsibility of preparing long-range weather forecasts, i.e., for the following month,” he wrote. “The statisticians among us subjected these forecasts to verification and found they differed in no way from chance. The forecasters themselves were convinced and requested that the forecasts be discontinued. The reply read approximately like this: ‘The commanding general is well aware that the forecasts are no good. However, he needs them for planning purposes.’” (Gardner 2010). Seismologists often encounter a similar situation when developing earthquake hazard maps, which ideally describe the level of earthquake hazards in a region and provide a scientific foundation for earthquake preparation and mitigation. However, in recent years many large and destructive earthquakes have occurred in places mapped as having relatively low hazard (Kerr 2011). A striking example is the March 2011 M 9.1 earthquake off Tohoku, Japan, which occurred in an area shown by the Japanese national earthquake hazard map as one of relatively low hazard. Figure 1, from Geller (2011), illustrates his point that
The regions assessed as most dangerous are the zones of three hypothetical “scenario earthquakes” (Tokai, Tonankai, and Nankai; see map). However, since 1979, earthquakes that caused 10 or more fatalities in Japan actually occurred in places assigned a relatively low probability. This discrepancy—the latest in a string of negative results for the characteristic earthquake model and its cousin, the seismic-gap model—strongly suggests that the hazard map and the methods used to produce it are flawed and should be discarded.
…in recent years many large and destructive earthquakes have occurred in places mapped as having relatively low hazard…
Similar discrepancies have occurred around the world. The 2008 Wenchuan earthquake (M 7.9) in China occurred on a fault system assessed, based on the lack of recent seismicity and slow slip rates, to have low hazard. Another example is the convergent boundary between Africa and Eurasia in North Africa. The 1999 Global Seismic Hazard Map, which shows peak ground acceleration expected at 10% probability in 50 years, features a prominent hazard “bull’s-eye” at the site of the 1980 M 7.3 El Asnam earthquake. The largest subsequent earthquakes to date, the 2003 M 6.8 Algeria and 2004 M 6.4 Morocco events, did not occur in the bull’s-eye or regions designated as having high hazard levels. The 2010 M 7.1 Haiti earthquake similarly occurred on a fault mapped in 2001 as having low hazard, and it produced ground motion far greater than the map predicted.
EVALUATING HAZARD MAPS
In the above cases, the maps significantly underpredicted the earthquake hazard. However, their makers might argue that because the maps predict the maximum shaking expected with some probability in some time interval, the much larger earthquakes and resulting shaking that actually occurred are rare events that should not be used to judge the maps as unsuccessful. So how should we judge a map’s performance? Currently, there are no generally agreed upon criteria. It is surprising that although such hazard maps are widely used in many countries, their results have never been objectively tested.
A basic principle of science is that methods should be accepted only after they are shown to be significantly more successful than ones based on null hypotheses, which usually are based on random chance. Otherwise, they should be rejected, regardless of how appealing their premises might seem.
Results from other fields, such as evidence-based medicine, which objectively evaluates widely used treatments, are instructive. For example, Moseley et al. (2002) found that although more than 650,000 arthroscopic knee surgeries at a cost of roughly $5,000 each were being performed each year, a controlled experiment showed that “the outcomes were no better than a placebo procedure.”
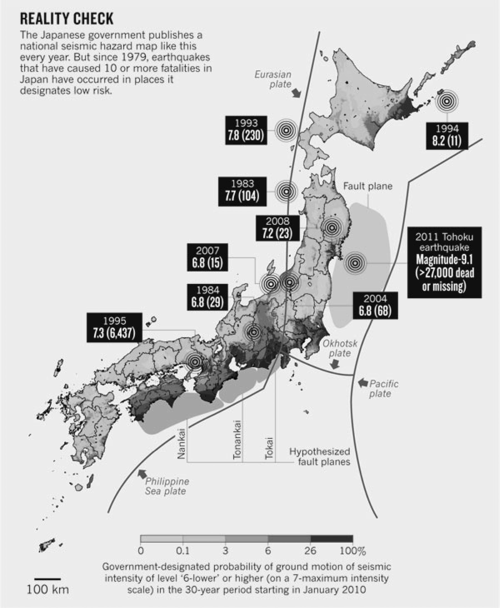
▲ Figure 1. Comparison of Japanese government hazard map to the locations of earthquakes since 1979 that caused 10 or more fatalities (Geller 2011).
Weather forecasts, which are conceptually similar to earthquake hazard mapping, are routinely evaluated to assess how well their predictions matched what actually occurred (Stephenson 2000). Forecasts are also tested to see if they do better than using the average of that date in previous years, or by assuming that today’s weather will be the same as yesterday’s. Over the years, this process has produced measurable improvements in forecasting methods and results and yielded much better assessment of uncertainties. This conceptual approach is also used by climate modelers, who present and compare the predictions of a range of models and discuss how the various assumptions used in constructing the models contribute to uncertainties.
The recent examples of large earthquakes producing shaking much greater than predicted by the hazard maps indicate the need for an analogous process. This would involve developing objective criteria for testing such maps by comparison to the seismicity that actually occurred after they were published. Such testing would show how well the maps worked, give a much better assessment of their true uncertainties, and indicate whether or not changes in the methodology over time resulted in improved performance. Various metrics could be used. A natural one is to compare the maximum acceleration observed over the years in regions within the hazard map to that predicted by the map and by some null hypotheses. One simple null hypothesis is that of a regionally uniformly distributed seismicity. Figure 1 suggests that the Japanese hazard map is performing worse than such a null hypothesis.
It is surprising that although such hazard maps are widely used in many countries, their results have never been objectively tested.
It is important to test maps using as long a record as possible. As a result, the major challenge for such testing is the availability of only a relatively short earthquake shaking record. A number of approaches could be used to address this issue. One would be to jointly test maps from different areas in addition to testing maps from individual areas, which might give more statistically significant results.
In testing, it is important to avoid biases due to new maps made after a large earthquake that earlier maps missed. Statisticians refer to such a posteriori changes to a model as “Texas sharpshooting,” in which one first shoots at the barn and then draws circles around the bullet holes. In some cases assessing whether and how much better a new map predicts future events than an older one may take a while—sometimes hundreds of years—to assess.
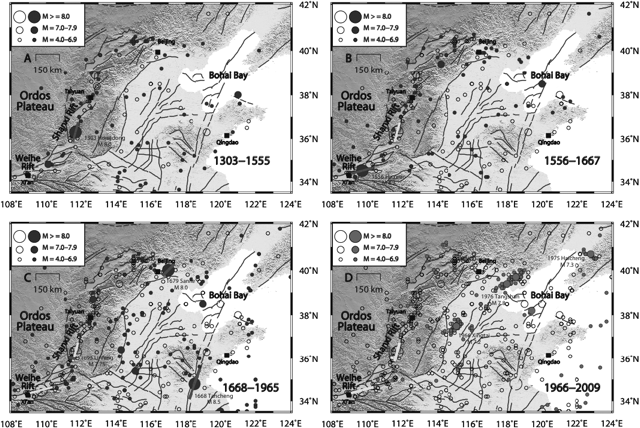
▲ Figure 2. Earthquake history of north China, showing that seismicity has migrated such that no fault segment has ruptured twice in 2,000 years. Solid circles are locations of events during the period shown in each panel; open circles are the locations of events from 780 BCE to the end of the previous period (AD 1303 for panel A). Bars show the rupture lengths for selected large events (Liu et al. 2011).
Hypothesis testing is the heart of the scientific method. Notwithstanding the difficulties, it is essential that a continuing process of serious and objective testing be conducted for the methods used to produce seismic hazard maps. Meanwhile, hazard maps should be presented to the public and policy makers with clear discussion of the uncertainties in these maps.
ARE THE ASSUMPTIONS REASONABLE?
Several crucial assumptions are used in making hazard maps. These involve 1) where and when large earthquakes will occur, 2) how large they will be, and 3) how much ground motion they will produce. The first two assumptions are based on the concept of recurrence of characteristic earthquakes, a model that has failed even in a seemingly very well-behaving place—Parkfield, California, on the San Andreas fault (Jackson and Kagan 2006). Earthquake history may give some guidance, but the earthquake history available from instrumental and paleoseismic records is often too short compared to the long and variable recurrence time of large earthquakes. In such cases, the magnitudes of the largest future earthquakes and the resulting shaking expected are poorly known. Thus, for example, the Japanese mapmakers discounted the probability of an M 9 event off Tohoku (Stein and Okal 2011). The shortness of the earthquake records can also cause hazard assessment to be biased by recent large events, which produce high-hazard bull’s-eyes in maps (Swafford and Stein 2007). These bull’s-eyes can be misleading, especially in mid-continents where the spatiotemporal patterns of seismicity are more irregular than those at plate boundaries. For example, a 2,000-year record from north China shows migration of large earthquakes between fault systems spread over a broad region such that no large earthquake ruptured the same fault segment twice in this interval (Figure 2). Hence a short subset of the record would bias hazard assessment.
Another problem is whether to assume that the probability of a major earthquake is constant with time or varies. The latter, which assumes that earthquake recurrence follows a seismic cycle, predicts lower probability for the first two-thirds of the mean recurrence interval and higher probability later as the earthquake is presumed overdue. The seismic cycle assumption is appealing and is why the Tokai, Tonankai, and Nankai areas are predicted to have high hazard in Figure 1. However, large earthquakes often fail to occur preferentially in the expected seismic gaps.
Hazard maps of necessity depend on their makers’ assumptions. This dependence can be illustrated by comparing maps of the same area made with different assumptions, which can predict hazards differing by factors of three to four. These differences illustrate some of the uncertainties that make assessing the performance of hazard maps crucial.
…methods should be accepted only after they are shown to be significantly more successful than ones based on null hypotheses, which usually are based on random chance.
MISSION IMPOSSIBLE?
Ideally hazard maps would neither underpredict the hazard, leading to inadequate preparation, nor overpredict it, diverting resources unnecessarily. One hopes that objective testing of successive generations of hazard maps will improve their performance. However, there are limits on how well hazard maps can ever be made. Some are imposed by lack of knowledge and the intrinsic variability of earthquake processes. Others may reflect the fact that maps are produced on the basis of postulates, such as the characteristic earthquake and/or seismic cycle models. If these models fundamentally diverge from the actual nonlinear physics of earthquake occurrence— as may well be the case—then no amount of tweaking and tuning of models can produce hazard maps that come close to the ideal. Such a development might seem discouraging, but may prove to be the case. Objective testing of hazard maps is the only way to find out.
REFERENCES
Gardner, D. (2010). Future Babble: Why Expert Predictions Fail—and Why We Believe Them Anyway (Toronto: McClelland & Stewart).
Geller, R. J. (2011). Shake-up time for Japanese seismology. Nature 472, 407–409.
Jackson, D. D., and Y. Y. Kagan (2006). The 2004 Parkfield earthquake, the 1985 prediction, and characteristic earthquakes: Lessons for the future. Bulletin of the Seismological Society of America 96, S397–S409.
Kerr, R. (2011). Seismic crystal ball proving mostly cloudy around the world. Science 332, 912–913.
Liu, M., S. Stein, and H. Wang (2011). 2000 years of migrating earthquakes in north China: How earthquakes in mid-continents differ from those at plate boundaries. Lithosphere 3; doi:10.1130/L129.
Moseley, J. B., K. O’Malley, N. J. Petersen, T. J. Menke, B. A. Brody, D. H. Kuykendall, J.C. Hollingsworth, C. M. Ashton, and N. P. Wray. (2002). A controlled trial of arthroscopic surgery for osteoarthritis of the knee. New England Journal of Medicine 347 (2), 81–88.
Stein, S., and E. Okal (2011). The size of the 2011 Tohoku earthquake needn’t have been a surprise. Eos 92, 227–228.
Stephenson, D. B. (2000). Use of the “Odds Ratio” for diagnosing forecast skill. Weather and Forecasting 15, 221–232.
Swafford, L., and S. Stein (2007). Limitations of the short earthquake record for seismicity and seismic hazard studies. In Continental Intraplate Earthquakes, Special Paper 425, 49–58, S. Stein and S. Mazzotti, eds. (Boulder, Colorado: Geological Society of America).
To send a letter to the editor regarding this opinion or to write your own
opinion, you may contact the SRL editor by sending e-mail to
<srled [at] seismosoc [dot] org>.
[Back]
Posted: 18 August 2011