|
|
Publications: SRL: Historical Seismologist |
March/April 2012
The Sarez-Pamir Earthquake and Landslide of 18 February 1911
Nicholas Ambraseys1 and Roger Bilham2
- Department of Civil and Environmental Engineering, Imperial College, London, U.K.
- Department of Geological Sciences, University of Colorado, Boulder, Colorado, U.S.A.
INTRODUCTION
A hundred years ago 2.4 cubic km of rock fell from a Pamir mountainside >700 m to the valley floor, releasing potential energy equivalent to an Mw 7.8 ± 0.1 earthquake. Its fall created the world’s highest dam, impounding a 17-km3 lake that remains to this day. Seismograms recorded in Europe and Asia registered an earthquake at the approximate time of the fall, and soon after the details of the landslide had been evaluated a controversy arose concerning whether these seismograms had recorded an earthquake that had triggered the landslide, or whether the seismograms had merely registered waves generated by the potential energy release of the landslide’s impact. Boris Galitzin (1915) reasoned that the radiated energy almost exactly equaled the potential energy released by the fall, and hence represented the unique case of the hypocenter and the epicenter being identical. Otto Klotz (1916) translated Galitzin’s article with a preface underlining its importance, and Harold Jeffreys, in a 1923 article, despite revealing flaws in Galitzin’s calculations, confirmed both the approximate coincidence in location of the two events and the equality of energy release computed by Galitzin. However, that same year Richard Oldham dismissed the implications of Jeffreys’s calculations, noting that the maximum epicentral damage was offset from the landslide and that the area of felt shaking was typical of a deep earthquake. Though Oldham’s arguments were eventually to win, it would take another decade before it was realized that it was the long duration of energy release in the landslide that accounted for its apparent absence in distant seismograms. The details of the causal earthquake, and the curious equality in landslide and earthquake energy, have never been fully resolved. We attempt to do so in this article. We quantify what is known of the earthquake and trace the history of exploration and analysis of the landslide, whose effects remain a threat to Pamir populations to this day.
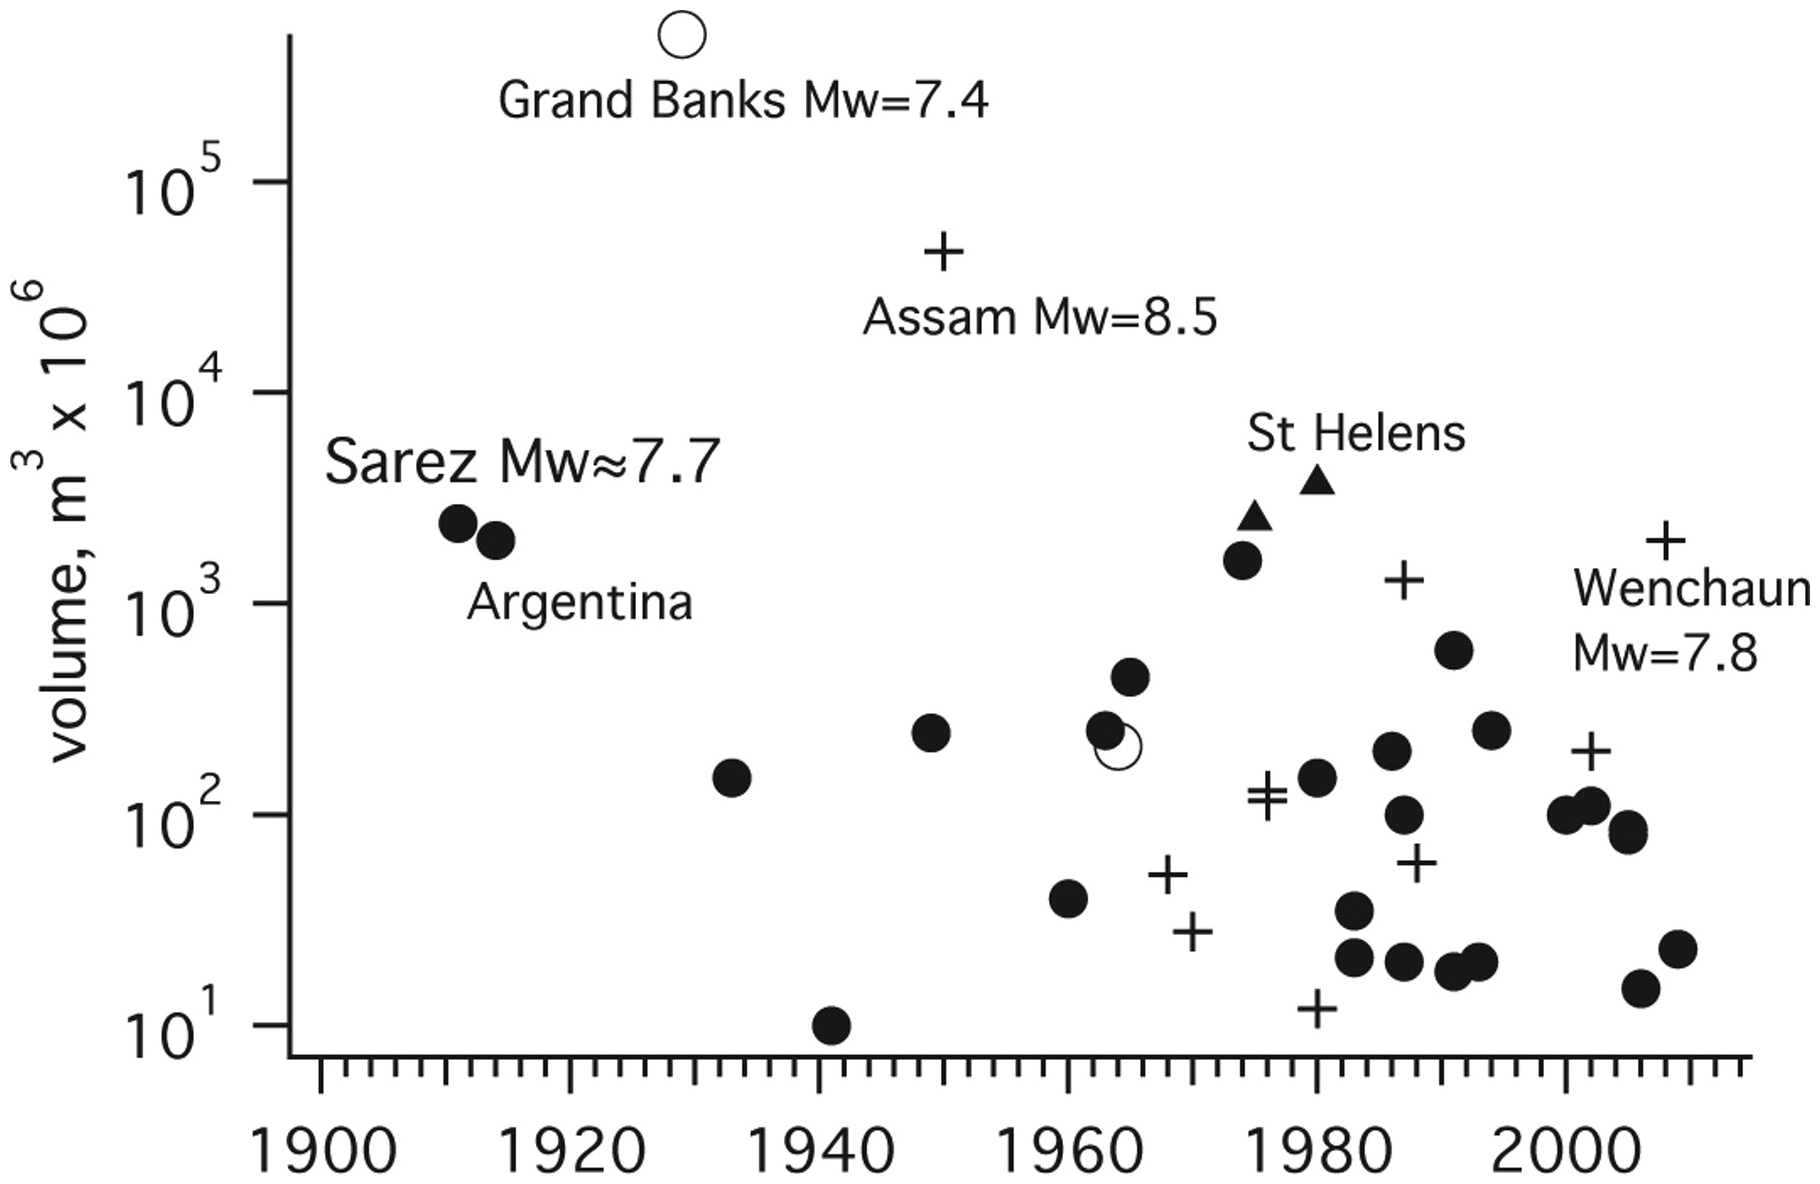
▲ Figure 1. Significant landslides since 1900. Open circles indicate submarine slides, and triangles are volcanic flank collapse events. Cumulative volumes from multiple earthquake-induced slides are indicated by crosses (after Keefer 1984).
The landslide blocked the Murghab River at Usoy, impounding the 60-km-long, 550-m-deep Lake Sarez, named after the town it flooded a year after the collapse. The level of Lake Sarez currently hovers approximately 40 m below the summit of the Usoy landslide, in approximate equilibrium between river discharge and leakage through the porous upper part of the debris pile. The level of the lake fluctuates seasonally, but a decrease in permeability has resulted in a mean rate of rise of 18.5 cm/yr in the past five decades. The future stability of the dam is a concern (Alford and Schuster 2000a, 2000b) but is not discussed here.
We first place the volume of the landslide in context. The volume of the Usoy slide is the largest single landslide in the world to have occurred in the past century (Figure 1). It was accompanied by numerous smaller landslides with an unknown total volume. These subsidiary landslides occurred largely within an area we identify as Intensity VI (MSK) in Figure 2, with the most prominent slides occurring within the zone of Intensity VII. The area affected by triggered landslides in mountainous regions is approximately proportional to earthquake magnitude (Keefer 1984). For example, the 1950 Assam earthquake (Mw = 8.5) resulted in a 47-km3 surge of sediments downstream in the following several decades (Kingdon-Ward 1953; Goodbred et al. 2002). The 2008 Wenchuan earthquake (Mw = 7.9) launched ≈150,000 slides, which dammed >100 rivers with a cumulative landslide volume of 5–15 km3 (Wang 2008; Huang and Li 2009; Parker et al. 2011). In the years following the 1911 Pamir earthquake, landslides were mapped between Pasor and Irkht and along the length of Lake Sarez, consistent with the ≈50-km radius for landslide activation anticipated from an Mw ≈ 7.5 earthquake (Keefer and Wilson 1989). Access routes were inadequate to provide a thorough survey of the zone affected by minor landslides.
We relate the history of the several official and private expeditions to the central Pamir that were responsible for investigating the evidence for the epicentral damage. Then we attempt to locate and assign a magnitude to the earthquake from these data and to place the earthquake in the context of what we now know of the tectonics of the northern Pamir range.

▲ Figure 2. Pamir and surroundings with locations discussed in text. Isoseismal contours (MSK) dashed.
NEWS OF SHAKING AND EXPLORATIONS OF THE EPICENTRAL REGION
The earthquake occurred in winter in a sparsely inhabited part of the Pamir Mountains in Tajikistan (Figure 2), then in the Russian empire, where the mean elevation is 4.4 km amid 2.8 km of local relief. The population density of the region in 1911 is not known, but about 20 years later it was less than 1/km2, as compared with 3/km2 today. The region was inhabited mostly by nomads in transit, rather than by a sedentary population, who migrated with the seasons between the valley floor and higher slopes, maintaining one or two refuges at different levels for the different seasons. They lived in their winter pastures (kishlak) and their summer highland pastures (yaylak), mostly in yurts (dwellings made of a wooden lattice-frame covered with felt), which are fully earthquake proof (Figure 3C). They pastured their animals at different elevations in different seasons. More substantial structures using adobe construction were found in villages sited on alluvial fans near the rivers or higher up on gentle slopes. Russian military and administrative posts used mud brick and stone dwellings. Roads were simple tracks for pack animals, mostly skirting steep, unstable slopes or passing through narrow, short tunnels dug through mountainsides. The damage and loss of life caused by the earthquake were chiefly due to rock- and landslides that killed livestock, spoiled the few patches of cultivated land, and destroyed vital tracks and mountain passes, isolating the region. Many of the few sedentary inhabitants eventually migrated to neighboring Chinese territory.
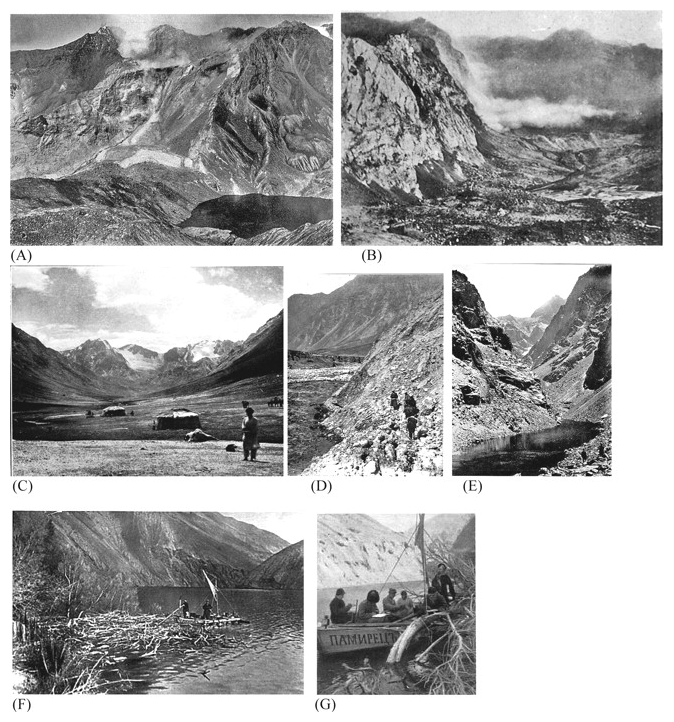
▲ Figure 3. Photo montage of contemporary photographs of the Usoy landslide and its approaches and maps by Shpilko (1914, 1915), Stein (1928), and Chuenko (1936). (A) The natural dam of Usoy thrown across the Bartang River. In the background is the scarp left after the collapse of the south face of the mountain. Clouds of dust raised by rock falls were seen on higher slopes in August 1915. The crest of the dam is on the left in the foreground, with the western end of Lake Sarez on the right (Stein 1933, Plate 373). (B) One of the rockslides followed by ice flow (Preobrazhenski 1915). (C) Kirghiz camp near the head of Bashgumbaz Valley in 1913 (Stein 1933, Plate 379). (D) Center: Crossing debris thrown down by the earthquake near Palaz in the Tanimz Valley in 1915 (Stein 1933, Plate 369). (E) The gorge of Bartang River blocked above Raut by the earthquake. A newly formed tarn can be seen in the foreground; the former riverbed was buried under rock debris in 1915 (Stein 1933, Plate 371). (F) Shpilko’s expedition surveying in a homemade boat in Lake Sarez in 1913 (CECD 2007). (G) Shpilko’s surveying boat in Lake Sarez in 1913 (CECD 2007; Stein 1933 Plate 371).
The isolation of the region and the midwinter snow conditions delayed news of the earthquake from reaching Petrograd. The first news of the disaster that reached Rushon (Figure 2) was brought by a Tadjik villager from the village of Basid who, because tracks to the south had been made impassable by avalanches and slides, descended the Bartang River using a native skin boat. As a result it was six weeks before the local Russian administration had identified the region of maximum damage, a further two months before they knew details about the landslide, and almost two years before the first field study of the effects of the earthquake and survey of the rockslide were undertaken.
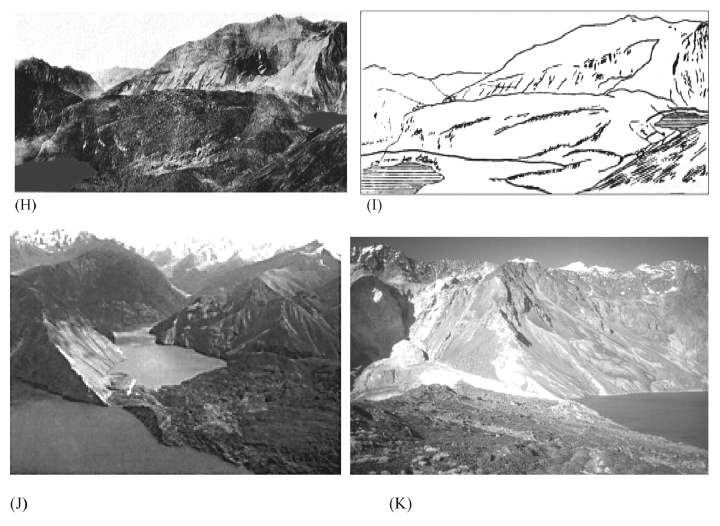
▲ Figure 3 (continued). (H) Usoy slide in 1915. On the left is a small tributary impoundment of water off Lake Sarez, the so-called Shadau Ozero (Preobrazhenski 1920). (I) Location of the shores of lakes Sarez and Shadau on either side of the Sarez natural dam in 1915 (hatched) and in 1934 (thick shore line), after Chuenko (1936). (J) Lake Shadau in the background. (K) View of Usoy rockslide avalanche dam (foreground) and the downstream (west) end of Lake Sarez. The source area of the rockslide is in the distance at the far left. Photo by S. F. Cunha.
In contrast, despite heavy late winter snowfall, telegraph communications in northern India provided almost imme diate worldwide news of a violent earthquake beyond India’s North-West Frontier Province (now the Khyber Pakhtunkhwa province of Pakistan). At 23:15 on 18 February 1911 the Gilgit diary of the political agent (IO1) notes that two shocks closely spaced in time were felt in Peshawar, the first of which was strong but did not cause any damage (IO2). According to the Civil and Military Gazette the earthquake was also recorded at 00:12 19 February by the seismograph in Simla, where it was not felt, the shock originating from a reported distance of 600 miles (cmg2) consistent with an epicenter near Usoy. By the end of February the earthquake had been reported from other parts of the North-West Frontier Province, notably from Gupis and Mastuj where some damage occurred, and from Srinagar and Muzaffarabad in Kashmir, where it was generally felt (IO3).
On 24 February 1911 a modest earthquake with a location somewhere in the North-West Frontier Province, which may have been responsible for a second landslide near Gilgit, was reported from Gilgit. Survey of India triangulation parties who were working under Henry Gordon Bell in the Karakoram in the summer of 1911 reported this slide had destroyed the road north of Gilgit (Mason 1914, 2). During the period between 14 May and 3 June 1911 intelligence reports reaching British Agencies in Persia confirmed that 90 lives and a number of livestock had been lost in the 18 February earthquake (IO4). Other reports from Khorug confirmed that because of the fall of rocks, communications between Rushon (Kala-i-Vomar) and Roshorv (Oroshar) were completely interrupted and that the villages of Basid, Oroshar, Pasor (Agats Kurgan), and Nisir were almost totally destroyed (IO5).
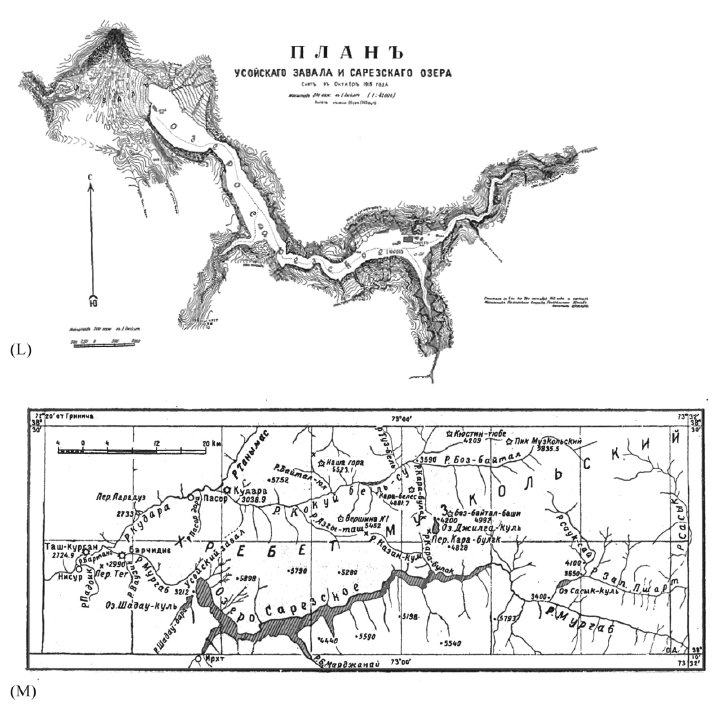
▲ Figure 3 (continued). (L) Topographic map of Lake Sarez in October 1913 (Shpilko 1914). (M) Map of Lake Sarez and of the region around it, showing locations mentioned in Russian sources and shown on maps of 1934 (Chuenko 1936).
Two attempts were made to reach the epicentral region near the junction of the Murghab and Bartang rivers. The first was made in April 1911 from the northwest, from the Pamirski Post by P. Zaimkin, who was despatched down the Murghab Valley. He was forced to return on finding his westward route blocked by massive rockslides and ice-flows at the town of Sarez (Agakhanjanz 1989). The second was made by an expedition from the southwest, sent by the Governor of Rushon (Kala-i-Vomar) from Khorug up the Bartang Valley. Here the attempt to reach Oroshar (Roshorv), the headquarters of the district, was frustrated by the complete destruction of the tracks and passes.
News in the Petrograd press in mid-1911 confirmed that the Murghab River was dammed by a rockslide caused by an earthquake. In October 1911 the rising waters of the lake had started flooding the village of Sarez and other villages. It was not until the end of 1911 that the full picture of the effects of the earthquake became known in Petrograd, including the news that the natural dam across the Murghab River was likely to collapse when the lake behind it was impounded. Schultz (1914, 1916), who visited the Oroshorb district during the winter after the earthquake, found that the people of Sarez were already building a new kishlak, which they named Shadzud, to settle on the upper part of the Gunt River and Toguzbulak. By the spring of 1912 Sarez was totally submerged.
By 1912 concern about the possible failure of the natural dam at Usoy had reached the authorities in Petrograd, but for almost a year no decision was made what to do. It seems that it was a letter from D. D. Bukinist in the press on 22 July 1913 that finally triggered some action from the authorities. He had visited the region, and on his return from Kala-i-Vomar he reported to the Army authorities, and in the press, that failure of the natural dam and the release of the impounded water in Lake Sarez was threatening the survival of the people in the downstream region as far as the Amu Daria (Bukinist 1913).
It was decided, therefore, to send an expedition into the epicentral region to report on the effects of the earthquake and in particular on the stability of the natural dam at Usoy. The expedition was led by the Commander of the Khorug Station, G. A. Shpilko, whose mission included examining the areal extent and depth of Lake Sarez, observing changes of the depth of the lake, mapping the landslide, and monitoring the behavior of the dam (Figures 3F and G). It was very difficult to approach the epicentral region and move along the shores of the new lake due to the unstable and steep slopes newly created by the earthquake, so a boat was engaged to undertake the sur veying. Considering the difficulties encountered by Shpilko, it is quite remarkable that his detailed report was completed on time, on 24 February 1914. The report contains his own observations and measurements in addition to reports written by others and extracted from newspapers (Shpilko 1914, 1915).
A description of the effects of the earthquake as they appeared in December 1911, when Lake Sarez was still filling, is given by Berg (1915), who in April 1914 published a summary of information regarding the rising waters in Lake Sarez and the appearance of lake water seeping from the downstream face of the dam. Additional information about the damage to the few man-made structures and to the ground itself may be gleaned also from a visit by Kudriavcheva in 1914, who describes the situation created by the earthquake along the route from Muzi-kol and the Tanmas River to Kudara (Yangi kurgan) and farther to the south to Pasor (Agats Kurgan), Barchadiv, Irkht, and Lyangar (Kudriavcheva 1915).
In August 1915 Aurel Stein traversed the epicentral region and compiled a detailed record of his observations and photo graphs. Stein encountered Preobrazhenski’s expedition, which had just arrived for a systematic survey of the natural dam at Usoy. Preobrazhenski had traveled by skin raft from the south ern extension of Lake Sarez, which he had reached by way of the Lyangar pass (Stein 1933, 297–303; Preobrazhenski 1920). Stein’s 1933 narrative borrows details regarding the effects of the earthquake from the publications of Pultov (1913) and Obruchev (1922), whose findings had been shown to him in the field by Preobrazhenski. Stein also was aware of the earlier reports by Bogdanovich (1911, 1914).
One interesting remark coming from those who passed through the region after the earthquake is that most of the larger rockslides that blocked narrow valleys and defiles seemed to have originated from only one side of the valley, while small rock- and landslides came from both sides of the valley, damming gorges and narrow valleys.
These few reports, and in particular the local information collected years later by Okmir Agakhanjanz (1989, 1996), confirm that small and large landslides and rock falls in the region were widespread, and while not of uncommon size they were most certainly of uncommon number and caused disruption to communications (Dalvaux et al. 2011). The exception was perhaps in the region between Pasor, Irkht, and Basid, where numerous rockslides originated mostly during the daytime at high elevations on gentle slopes that in the absence of earthquake shaking would have been considered relatively stable. Some of the vertical ground deformation that showed throws of a few meters were most probably scarps of landslides or sackungen rather than the surface ruptures of significant faults; they were of very short length and of irregular orientation. There is a little more information about the earthquake in Gubin (1960, 341).
EPICENTRAL DAMAGE AND A FORESHOCK
The massive rockslide that accompanied the mainshock and overwhelmed Usoy was preceded by a foreshock recorded by the sole survivors from that village. Two men were traveling at night from Usoy to Sarez, anxious to avoid avalanches triggered by warming of the snow-clad mountainsides that typi cally accompanies sunrise. About midway, ≈8 km from Sarez, they encountered an unexpected pre-dawn avalanche that they deduced must have been triggered by an earthquake. Upon arrival at Sarez, the villagers there confirmed that they too had been shaken by a small earthquake (Agakhanjanz 1989, 1996). For it to have been felt by the villagers at rest in the town of Sarez and not by those on foot, and for it not to have been noticed in villages elsewhere, suggests that this foreshock may have been quite local and relatively modest (e.g., M ≤ 4.5).

▲ Figure 4. Epicentral map (see Figure 2 for location). Dashed 60-km circle indicates the approximate macroseismic epicenter within which damage to buildings was severe (MSK > VIII). Focal mechanisms 1967–2011 for earthquakes >5.0 and shallower than 60 km (from Harvard CMT). Named villages indicate where felt reports were recorded. Lake Sarez stretches 65 km east of the landslide that buried Usoy.
Some two hours later the same two Usoy survivors, and everyone in Sarez, were shaken by the mainshock. People rushed out of their houses, two of which fell in and four of which were damaged. They then heard a deep roaring sound coming from the west, drowned by the sound of falling masses of rock that lasted for some time. In the morning all was covered with dust, which was still hanging in the air while the ground continued to shake from aftershocks. On returning home from Sarez to Usoy, the two men could no longer find their village. Usoy and its entire population were now buried beneath the landslide. The dust from the slide failed to settle for three days, with tremors continuing to be felt for a few more days. Rocks continued to fall from the hillsides for 15 years (Agakhanjanz 1989, 1996).
Excluding damage and loss of life caused from landslides and rock falls, the region most seriously affected by structural damage was the northernmost part of the Rushan district, which extends along the Bartang River from Pasor to Basid over a distance of about 50 km (Figure 4). In the absence of detailed descriptions of the fragility of damaged structures, the death toll in villages provides an approximate but imperfect proxy for identifying the region of maximum shaking intensity. Along the Bartang River to the south, in the scattered homesteads of Pasor (Agatskurgan), which were occupied by herdsmen, five men, 16 women, and nine children were killed by the collapse of mud/stone dwellings. Further down the river at Bartchadiv the number of fatalities is not known, but in nearby Nisor, 17 men, 14 women, and nine children were killed through building collapse. At Sagnob (Saunab or Tashkurgan), six women and four children lost their lives, and at Rukhch (Karakurgan), two men and two women were killed. The largest number of fatalities was in the large village of Roshorv (Oroshar), where the death toll was 45 men, 58 women, and 77 children. Basid was almost totally ruined but with no casualties.
Destruction to tracks, roadways and pathways extended for some distance westward, downstream from Basid. Strong shaking extended in the west and east directions (Agakhanjanz 1989, 1996). Further down the Bartang River at Rushon, the headquarters of the Roshon district, the earthquake only caused some panic. Further to the south in the Shungan district at Sokhcherv, Shungan, and Khurog, and as far south as Ishkashim, the shock caused some concern but no damage. It seems that there was some damage at Faizzabad Badakhshanski (in Afghanistan), where a few houses and some badghirs (masonry cooling vents), which had been damaged by a previous earthquake on 1 January 1911, collapsed without casualties.
There was considerable damage at Irkht, Lyangar, and at Bashgumbaz, Nazarovsk, as well as in the region of Muz-i-kol where the shock was widely felt. At the military headquarters of Pamirski Post (Murghab), it is said that the earthquake lasted two minutes and that it was strong enough to cause some panic and to cause pendulum clocks to stop. A second shock an hour later cracked a few more houses (Shpilko 1914; Kudriavcheva 1915). In Rangkul (China) the first shock was noticed by only a few people, while the second shock was generally felt. At Bulungkol, Karakuli, and Kyzilrabot (China), all we know is that shaking was widely felt. The easternmost place from which we have evidence that the earthquake was felt is Tashkurgan (Taxkorgan), where it was noticed only by a few people.
To the north the shock was strong at Irkeshtan, where it was followed at intervals by feebler aftershocks that caused no damage. The earthquake was perceptible as far as the Alai district, and it was just felt with about the same intensity at Darutkurgan, Kokand, Andijan, Tashkent, and Kashgar. Photos of Lake Karakul show that ice was broken and the lake waters ran up the eastern bank of the lake, leaving behind a bank of ice on shore about 0.5 km long on their retreat (Agakhanjanz 1989, 1996).
The earthquake was felt in many parts of the North-West Frontier Province. A few houses were damaged in Mastuj and Gupis, and in Yasin, Hunza, Gilgit, and Chilas the shaking was reported as strong. The shock was generally felt along the Punjab Northern State Railway toward and close to Lahore, but the shock was not felt by the citizens of Lahore. It was perceptible, however, at Peshawar, Muzzaferabad, and Srinagar (IO1–4; cmg). A few people felt the earthquake at Pyandz (Serai-Kamar, Baumanavad or Kirovabad) in Tajikistan, the westernmost felt location. The expeditions in the damaged region confirmed that in some parts along the upper Bartang River the effects of the earthquake were serious enough to eventually cause the population to migrate eastward to China through the Pamirs. The villages of Ghudara (Kudara), Bar Chidif (Barchidiv), Sarez, Withoy (Usoy), Thawnob (Savnov), Nisor, Roshrov, and Yerxt (Irkht) were relocated to regions outside the path of rising waters that were considered safer from further slides. Some of the abandoned villages were reoccupied by immigrants (Zarubin 1917).
In Shpilko’s account, the total loss of life caused by both the earthquake and the landslides amounted to 302 men, women, and children. Our estimate is 318. For the particular time of the day and year in which the earthquake happened, the total number of casualties was relatively small; it would have been much greater had all the people lived in adobe houses and not in yurts. Had the earthquake occurred during the summer at mid-morning, it is possible that it would have resulted in fewer fatalities.
One can take exception to part of Shpilko’s report: He extends the damaging effects of the earthquake into Afghanistan and across to the Amu Daria River. He refers to reports that in Kabul 300 houses were destroyed and 400 people killed, while at Kala-i-Yavun 60 houses collapsed and 240 people lost their lives. At Konabad (Khanabad), 70 houses fell, causing two deaths, but at Faizzabad a few houses were ruined with no fatalities. In fact these were caused by the earthquakes of 1 and 3 January 1911, with magnitude Ms 7.1 and 8.3 and centered in Afghanistan and Kyrghistan, respectively (tv; zo; Ambraseys and Bilham 2009).
INTENSITY DISTRIBUTION
From some of the above observations, Oldham (1923) had noted that although shaking intensity was high near the Usoy slide, shaking had been felt more than 400 km from Usoy. He was of the opinion that tremors felt at a distance of 400 km were unlikely to have been caused by the impact of a distant landslide. Quantitative evaluations of epicentral intensity and its attenuation with distance, however, were marred by the absence of a range of assembled structures sensitive to damage at varying intensities of shaking. Oldham (1899) had encountered a similar problem when assigning intensities to the 1897 Shillong earthquake, for which he devised a simpler intensity scale than those prevailing at the time in Europe. Above MSK VII, all adobe, rubble-stone, or masonry houses can be damaged beyond repair or destroyed, giving the mistaken impression that intensity IX or X shaking has been experienced. That is, the MSK scale and others “saturate” at Intensity >VII MSK, and any town or village thus appears equally, but no more, devastated by higher intensities. Compounding intensity assessment difficulties, many of the villagers lived in yurts, dwellings that are indestructible under the strongest shaking, but since the earthquake happened at night in sub-zero temperatures, those few people who lived in houses, rather than yurts, were all indoors where the death toll was high. Similar difficulties are encountered if intensity estimates are sought from damage to epicentral roads and bridges. Bridges were mostly short simple wooden structures for foot or cattle passage. Roads were mostly footpaths, sometimes cut into steep cliffs, vulnerable to rock falls or fissuring but otherwise immune to damage.

▲ Figure 5. Decay of MSK intensity with distance from adopted epicenter at 38.3°N, 72.30°E. Circles indicate observations, and the lines are empirical attenuation curves for the Himalaya superimposed on the observed data for Mw = 7.2 and Mw = 7.4 respectively, together with the least-squares fit to observed intensity data from the 1905 Kangra Mw = 7.8 western Himalayan earthquake. Intensities >VII and <II were not used to determine the best fitting empirical curves.
As a consequence, all that can be said for most of the maximum intensities observed in the earthquake is that they exceeded VII+ (MSK), but by how much it is not possible to say. This estimate is smaller but more realistic than the intensities assigned by Shpilko (1914, 1915) VIII (RF), Oldham (1923) X (RF), Gorshkov et al. (1941, 28–29) IX (Mercalli), and Kondorskaya and Shebalin (1982) IX (MSK). On what grounds these estimates were made it is difficult to say. In Table 1 we list intensities >VII based on reported damage. Where no quantitative information on building fragility is provided in our source materials, we identify with an asterisk those evaluations that we consider to be unreliable indicators of true shaking intensity.
At great distances from the earthquake, where low felt intensities prevailed, we extend previous analyses by discriminating between intensities II and III, and we consider sites where the shock was reported as not having been felt, for example from Ghazi, Kabul, and Samarkand in the west; Alma Ata in the north; and Lahore, Dehra Dun, Simla, and Delhi in the south (Gubin 1960). The radius of perceptibility (Intensity 3) is estimated from Figure 5 as 400 km.
We equate the epicentral region with the region where the earthquake caused the collapse of local houses with loss of life. It extends from northeast of Pasor to southwest of Basid, along the valley of the Bartang River that affords the only passage through the epicentral region. We adopt the center of this region (38.3°N, 72.3°E), approximately 25 km west of the Usoy slide, as the apparent macroseismic epicenter of the earthquake. This corresponds roughly to the epicentral region favored by Oldham (1923).
We next compare the attenuation of intensities with distance that were observed for the Kangra Mw = 7.8 earthquake and with two empirical synthetic attenuation curves published for the Himalaya. We select the Kangra earthquake since it was similar in magnitude to the Pamir earthquake and occurred in the mountains of the Himalaya near the Intensity II isoseismal zone of the 1911 earthquake. The empirical attenuation curves take the form: I = a + bMw + cR + dlog(R) where I is the MSK intensity observed at epicentral distance R km. Thus:
Mw = (I − 0.46 + .004*km + 2.54*log(km))/1.54 = 7.4 ± 0.4 (Ambraseys and Douglas 2004)
Mw = (I − 6.05 + .0006*km + 3.91*log(km))/1.11 = 7.2 ± 0.7 (Szeliga et al. 2010)
Mw for the Pamir earthquake estimated from these intensity curves (7.2 < Mw < 7.4) is consistent with estimates for magnitude (Ms* = 7.4 ± 0.4) derived below from Milne seismograms, but lower than the Mw = 7.7 surface wave estimate (Tables 2 and 3) and the estimate of 7¾ published by Gutenberg and Richter (1965, 233). The observed decay of intensity with distance beyond 200 km appears to be larger than observed for the average curves derived for Himalayan attenuation, mostly from shallow earthquakes. This suggests that the earthquake was shallow and was not associated with the cluster of seismicity apparent in Figure 6 at ≈100 km depth (Engdahl et al. 1998).
INSTRUMENTAL LOCATION AND MAGNITUDE
The earthquake occurred at 23:15 Tashkent time on 5 February in the Old Style (O.S. Julian) calendar applicable in Russia in 1911. This corresponds to 18:41 GMT in the night of 18 February in the New Style (N.S. Gregorian) calendar not adopted by Russia until 14 February 1918. It was well recorded by intermediate- and long-period instruments, as well as by 29 Milne seismograph stations worldwide (Turner and Milne 1912). In addition it was recorded at 11 seismological stations in Russia up to 33° (Nikiforov 1912, 6). However, clocks were poor and a biased azimuthal coverage prevented a relatively accurate free position from being determined; readings could only confirm the general area of occurrence. The instrumental position of the earthquake listed by Gutenberg and Richter (1965) is 40.0°N, 73.0°E (±0.5°), which is in the Alai Mountains 200 km to the north of Lake Sarez. The Centennial Catalog of Engdahl and Villaseñor (2002) adopts this location and zero depth.
| Name | MSK | North | East | km | Reference |
|---|---|---|---|---|---|
| Andijan | 4.5 | 40.79 | 72.34 | 274 | Zakaspiskoe Obozrenie 1911 |
| Barchidiv | 8.5* | 38.30 | 72.48 | 18 | nv, sp1, zo |
| Bartang | 38.06 | 71.86 | 47 | ||
| Bashgumbaz | 6 | 37.66 | 73.55 | 130 | Nikonov 1917 |
| Basid | 8.5* | 38.15 | 72.08 | 27 | Zarubin 1917, IO3 |
| Bulungkol | 4 | 38.68 | 74.77 | 216 | sp1 |
| Chilas | 3.5 | 35.43 | 74.09 | 354 | na |
| Darut-Kurgan | 5 | 39.54 | 72.19 | 137 | Schultz 1914, 1916 |
| Faizzabad | 6 | 37.12 | 70.58 | 199 | nv, sp1 |
| Gilgit | 3.5 | 35.92 | 74.29 | 316 | na |
| Gupis | 4 | 36.23 | 73.44 | 249 | IO4, IO1 |
| Hunza | 3.5 | 36.27 | 74.68 | 307 | IO4, IO1 |
| Irkeshtan | 4.5 | 39.68 | 73.92 | 205 | Nikonov 1917 |
| Irkht | 7 | 38.13 | 72.62 | 35 | sp1 |
| Ishkashim | 6 | 36.73 | 71.62 | 183 | sp1, zo |
| Karakuli | 6 | 37.78 | 75.22 | 260 | nv, sp1 |
| Kashgar | 4 | 40.93 | 72.50 | 290 | |
| Khorug | 6.5 | 37.49 | 71.54 | 112 | sp1, IO3, zo |
| Kizil-Rabat | 5.5 | 37.45 | 74.85 | 242 | sp1, zo |
| Kokand | 4.5 | 40.54 | 70.94 | 272 | Obl. Turkestansk. Vedom.1911, zo |
| Kudara | 9* | 38.42 | 72.65 | 34 | Nikonov 1917 |
| Lahore | 1 | 31.56 | 74.39 | 767 | IO4 |
| Lake Karakul | 5.5 | 39.03 | 73.55 | 134 | |
| Lyangar | 37.87 | 72.72 | 61 | ||
| Mastuj | 4 | 36.28 | 72.52 | 223 | IO4 |
| Murghab | 5.5 | 38.17 | 73.95 | 144 | nv, sp1 |
| Muzaffarabad | 2.5 | 34.35 | 73.48 | 448 | IO4 |
| Nazarovsk | 7 | 38.13 | 73.23 | 83 | Schultz 1914, 1916 |
| Nisur | 8* | 38.28 | 72.40 | 13 | nv, sp1, Zarubin 1917, IO3 |
| Pamirski Post | 5 | 38.17 | 73.95 | 144 | pa |
| Pasor | 8.5* | 38.40 | 72.62 | 31 | nv, sp1,IO3, zo |
| Peshawar | 2.5 | 34.00 | 71.54 | 478 | IO4 |
| Pyandz | 2 | 37.24 | 69.10 | 304 | Spesivcheva 1933 |
| Rang-Kul | 3 | 38.47 | 74.38 | 180 | sp1 |
| Roshorv | 8.5* | 38.32 | 72.28 | 10 | nv, sp1, Zarubin 1917, IO3 |
| Rukhch | 8.5* | 38.35 | 72.48 | 19 | nv, sp1, zo |
| Rushon | 6.5 | 37.95 | 71.55 | 76 | sp1,Veber 1915, IO3 |
| Sarez | 7.5* | 38.21 | 72.79 | 45 | nv, sp1, Zarubin 1917, zo |
| Savnob | 8.5* | 38.32 | 72.40 | 13 | nv, sp1, Zarubin 1917, zo |
| Shungan | 3.5 | 37.62 | 71.60 | 97 | |
| Simla | 1 | 31.11 | 77.17 | 914 | cmg |
| Sokhcherv | 6.5 | 37.72 | 71.55 | 92 | sp1 |
| Srinagar | 2.5 | 34.08 | 74.80 | 517 | IO4, cmg |
| Tashkent | 4.5 | 41.33 | 69.29 | 416 | Obl. Turkestansk. Vedom 1912 |
| Tashkurgan | 4 | 39.85 | 70.55 | 226 | sp1 |
| Usoy | 38.26 | 72.61 | 29 | zo, iz, pa | |
| Yasin | 3.5 | 36.37 | 73.34 | 232 | IO1 |
|
* Intensities considered indistinguishable from MSK VIII. sp1 = Shpilko (1914, 1915). Other source abbreviations can be found in the “Historical Records” section of the References list. | |||||
| Station | Phase | T1 | A1 | T2 | A2 | D0 | Ms | mB |
|---|---|---|---|---|---|---|---|---|
| BER | M | 18 | 7 | 46.7 | ||||
| DBN | M | 18 | 2900 | 18 | 1000 | 44.8 | 8.31 | |
| UPP | M | 16 | 800 | 13 | 445 | 40.5 | 7.77 | |
| POT | M | 14 | 550 | 10 | 1500 | 43.0 | 8.14 | |
| GTT | M | 25 | 1700 | 45.0 | 7.98 | |||
| OSA | M | 24 | 2600 | 49.6 | 8.25 | |||
| CRT | M | 15 | 190 | 58.6 | 7.44 | |||
| VIE | M | 14 | 290 | 12 | 365 | 41.3 | 7.54 | |
| TRI | M | 21 | 700 | 20 | 230 | 43.5 | 7.58 | |
| BEO | M | 14 | 240 | 39.1 | 7.33 | |||
| KRA | M | 11 | 70 | 38.8 | 6.84 | |||
| STR | M | 12 | 500 | 46.9 | 7.69 | |||
| UCC | M | 26 | 800 | 48.6 | 7.69 | |||
| HOH | M | 20 | 630 | 45.9 | 7.66 | |||
| BRK | M | 20 | 110 | 20 | 5 | 102.7 | 7.38 | |
| DBN | PH | 5 | 4 | 5 | 8 | 44.8 | 7.2 | |
| UPP | PH | 5 | 7 | 5 | 2.5 | 40.5 | 6.8 | |
| POT | PH | 3 | 10 | 43.0 | 7.3 | |||
| GTT | PH | 5 | 10 | 5 | 2 | 45.0 | 7.2 | |
| BEO | PH | 5 | 28 | 39.1 | 7.5 | |||
| HOH | PH | 2 | 1 | 2 | 4 | 45.9 | 7.4 | |
| GTT | PZ | 5 | 12 | 45.0 | 7.1 | |||
| DBN | SH | 10 | 65 | 44.8 | 7.4 | |||
| UPP | SH | 10 | 21 | 11 | 17 | 40.5 | 7.1 | |
| GOT | SH | 9 | 25 | 9 | 30 | 45.0 | 7.1 | |
| BEO | SH | 5 | 25 | 39.1 | 7.4 | |||
| HOH | SH | 2 | 2 | 4 | 4 | 45.9 | 6.8 | |
| Average Ms = 7.7 ± 0.4 Average mB = 7.2 ± 0.2 |
||||||||
| Station | A | D0 | Ms* |
|---|---|---|---|
| Kodaikanal | 9.5 | 28.3 | 7.2 |
| Colombo | 7.0 | 32.0 | 7.1 |
| Helwan | 5.3 | 35.1 | 7.0 |
| Malta | 5.0 | 45.8 | 7.1 |
| Kew | 19.0 | 51.2 | 7.8 |
| Guildford | 30.4 | 51.5 | 8.0 |
| Hazlemere | 15.0 | 51.6 | 7.7 |
| Edinburgh | 13.0 | 51.8 | 7.6 |
| Stonyhurst | 9.0 | 51.9 | 7.5 |
| Eskdalemuir | 17.4 | 51.9 | 7.8 |
| Shide | 30.0 | 52.0 | 8.0 |
| Bromwich | 90.0 | 52.0 | 8.5 |
| Bidston | 10.0 | 52.3 | 7.5 |
| Paisley | 9.0 | 52.5 | 7.5 |
| Mauritius | 2.0 | 60.0 | 6.9 |
| Rio Tinto | 4.8 | 60.5 | 7.3 |
| S. Fernando | 12.0 | 60.8 | 7.7 |
| Azores | 3.4 | 73.3 | 7.2 |
| Perth | 1.5 | 80.8 | 6.9 |
| St. Vincent | 2.6 | 85.0 | 7.2 |
| Cape | 1.3 | 88.0 | 6.9 |
| St. Helen | 2.5 | 91.1 | 7.2 |
| Victoria | 1.3 | 92.1 | 6.9 |
| Toronto | 2.8 | 94.3 | 7.3 |
| Adelaide | 1.3 | 95.2 | 7.0 |
| Baltimore | 1.8 | 97.6 | 7.1 |
| Sydney | 1.1 | 102.3 | 6.9 |
| Honolulu | 2.0 | 103.8 | 7.2 |
| mean Ms* = 7.4 ± 0.4 | |||
Kondorskaya and Shebalin (1977) report the epicenter at 38.2°N, 72.8°E, give a depth of 26 km, and assign to the event a magnitude of Ms = 7.4. But this is the location adopted by Medvedev (1952), who copied it from Shpilko (1914) and Galitzin (1915)—a location that is not instrumental but macroseismic and corresponds to that of Lake Sarez (Sarez General Information 2010; http://www.tajik-gateway.org/index.phtml?id=3050&lang=en). Their tabulated focal depth of 26 km is also macroseismic, derived from isoseismals.
Contrary to a focal depth of 60–80 km often assigned to this earthquake (e.g., Kalmetieva et al. 2009, 57), there is no evidence that the earthquake was subcrustal. Maximum surface waves recorded teleseismically are recorded at the time expected from a crustal earthquake. Also, the long sequence of aftershocks, and the difference between surface- and body-wave magnitudes, do not suggest a subcrustal focus. The rapid attenuation of intensity with distance (Figure 5) also does not suggest a subcrustal focus.
We calculated the surface-wave magnitude of the earthquake as Ms = 7.7 ± 0.32 from the Prague formula using readings from 12 stations (Table 2). This value is comparable to Ms = 7 listed by Gutenberg and Richter (1965), from Gutenberg’s worksheet (see Figure 7). The body-wave magnitude, which was calculated from long- or medium-period instruments, gave mΒ = 7.3 (Table 2). The surface-wave magnitude Ms* calculated from 27 Milne seismograms (Table 3) is Ms* = 7.4 ± 0.4 (see Ambraseys and Douglas 2000 and Ambraseys 2001).
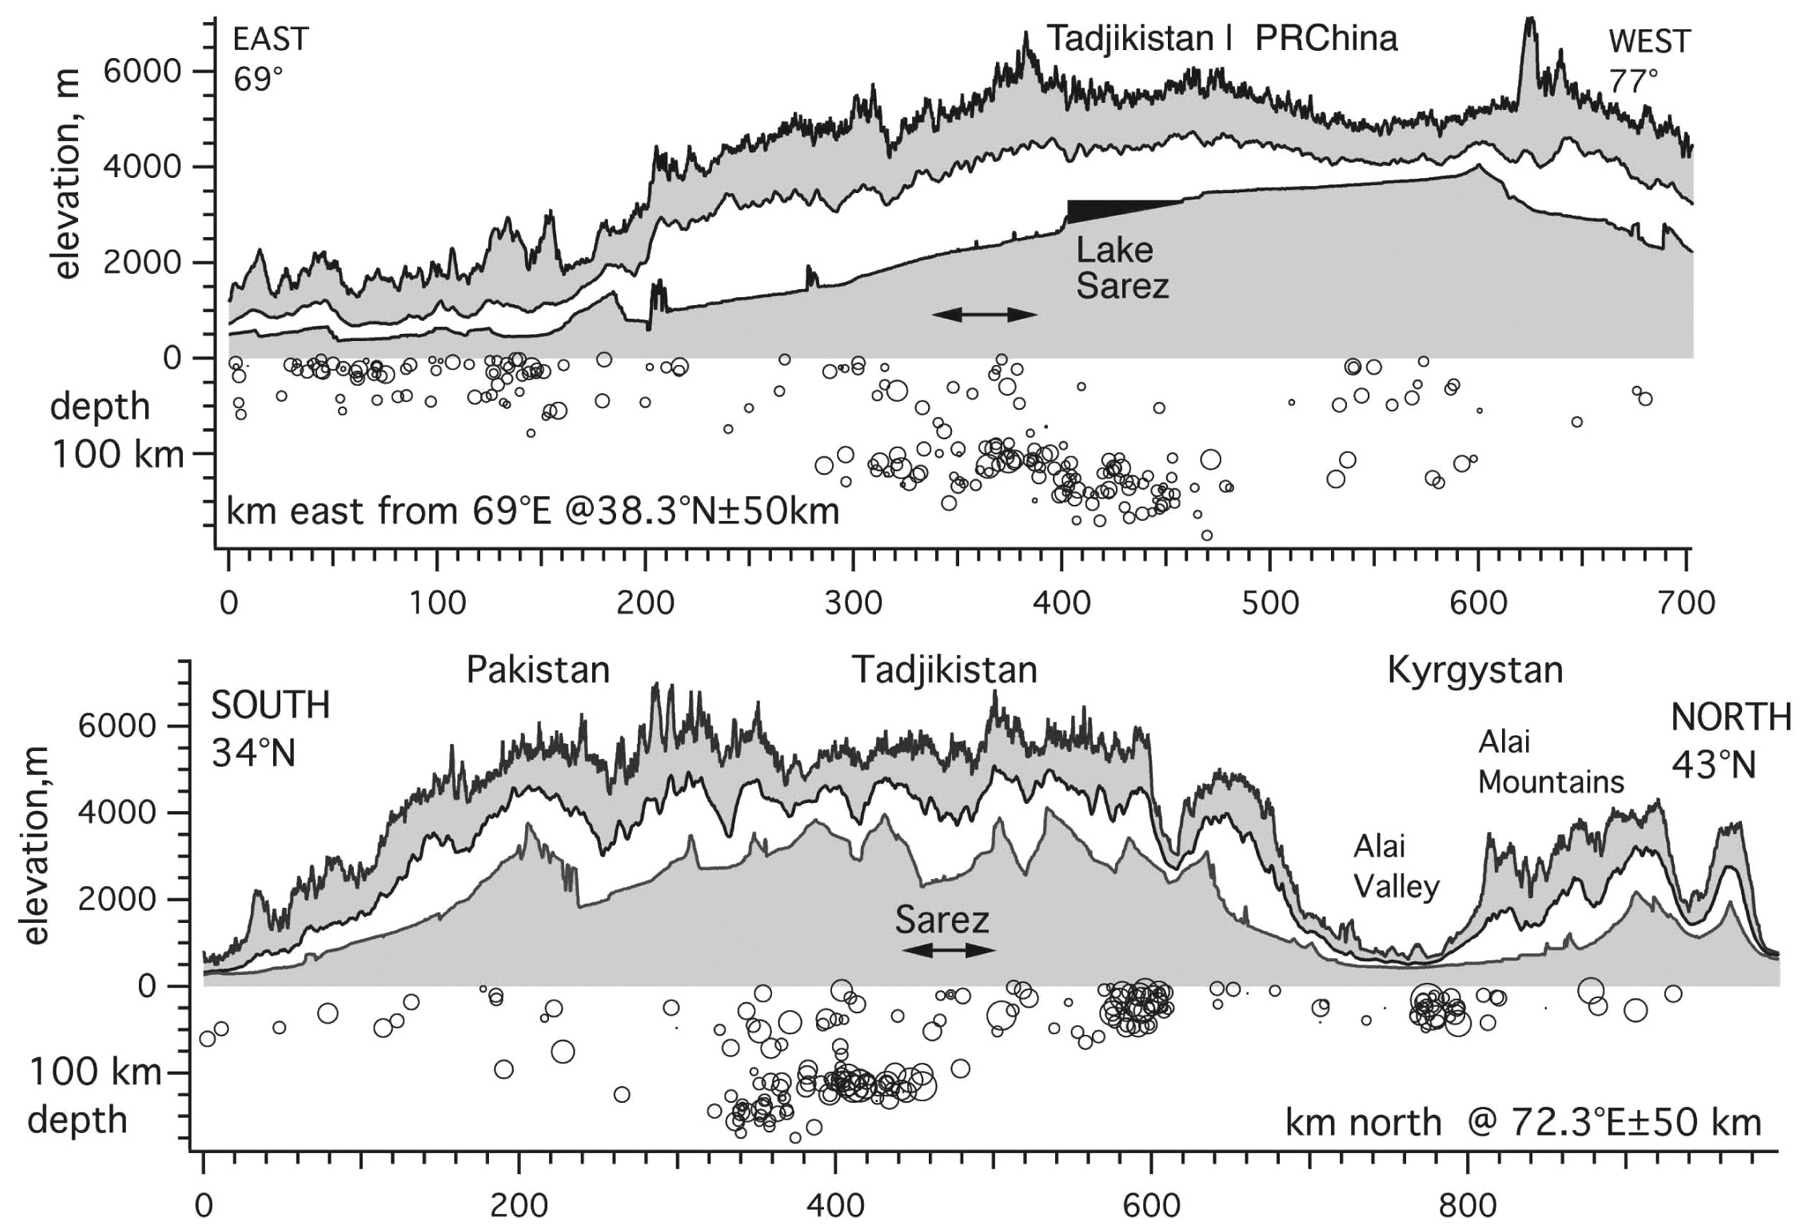
▲ Figure 6. East-west and north-south seismic sections through the epicenter (double arrow indicates region of maximum damage in 1911) showing Lake Sarez to scale, and maximum, mean, and minimum elevations in 100-km swaths. Microseismicity to 170 km from Engdahl et al. (1998). South-dipping subduction and numerous E/W drainages are apparent on the N/S section, and headward erosion of western-directed drainage in the east-west section.
Three instrumental magnitude assessments are thus available for the earthquake: MsPrague = 7.7, MsShort period = 7.2, MsMilne = 7.4, and two macroseismic estimates from intensity data (7.4 and 7.2). A simple unweighted mean of these estimates yields Mw = 7.4 ± 0.2, equivalent to an energy release of 0.4–1.6 1023 ergs (Kanamori 1977). We consider the surface-wave magnitude (Ms = 7.7 ± 0.3, a median value of Ms = 7.7 with variance of 0.2) to be the most reliable magnitude for the earthquake, recognizing that macroseismic estimates of Mw depend on assumptions concerning attenuation and depth that may be inapplicable to the Pamir.
Small shocks continued to be felt at Khurog for some time, presumably belonging to the aftershock sequence of the main event. There is no evidence, however, for protracted seismic activity or for aftershocks large enough to be located instrumentally. Also there is no evidence that could justify Nikonov’s (1992) claim that there were “significant effects in seismic processes following the main impounding period.” We believe that the filling of Lake Sarez was too slow to induce seismicity in the region.
TECTONIC SETTING
The epicenter is located approximately 100 km south of the main Pamir fault, one of three large thrust faults bounding the northern Pamir and the southern Alai mountains (Abdrachmatov et al. 2002; see Figure 2 this paper). Focal mechanisms near the northern Pamir thrusts consist mostly of thrust earthquakes consistent with a Benioff zone dipping to the south at approximately 45° (Chatelain et al. 1980; Burtman and Molnar 1993, 76; Fan et al. 1994; Negredo et al. 2007; Sobell et al. 2011). The studies, however, do not examine the details of structural complexity at shallow depths in the Pamir. Recent tomographic studies with double-difference epicentral relocations confirm a ≈45° south-dipping belt of seismicity extending to 120 km beneath the 1911 epicentral region (Koulakov and Sobolev 2006).
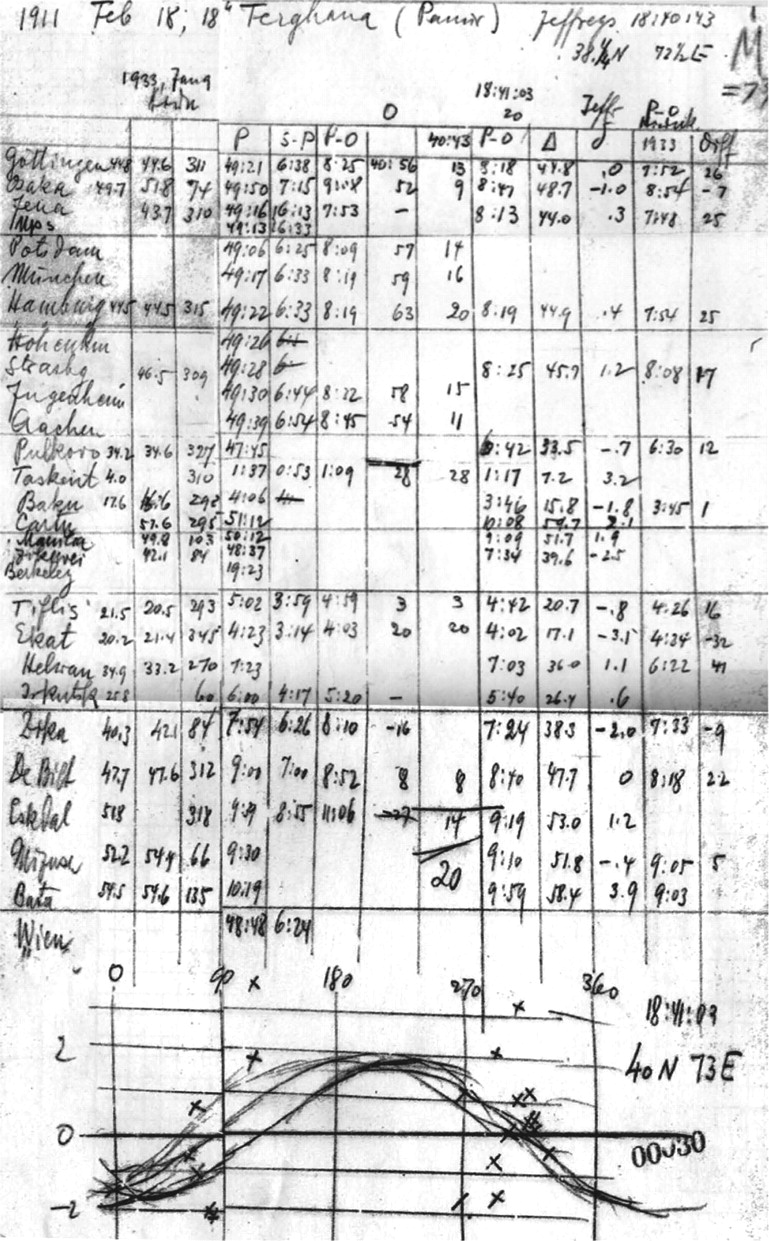
▲ Figure 7. Gutenberg’s 1946/47 worksheet (00030) for the 2 February 1911 earthquake is titled “1911 Feb 18; 18h Ferghana (Pamir).” Inscribed in the top right corner is Galitzin’s origin time, presumably taken from Jeffreys (1923), and Gutenberg’s calculated magnitude (clipped) as M = 7¾. The calculated location (40°N, 73°E) is at lower right.
Strike-slip faulting occurs to the northwest and southwest of Lake Sarez, and a single strike-slip mechanism is recorded at 56 km depth to the east of Sarez (Figure 4). A cluster of earthquakes with thrust mechanisms is prominent approximately 100 km beneath the inferred epicenter of the 1911 earthquake (Figure 6). At shallower depths within the central Pamir, however, focal mechanisms are mostly normal-faulting events on north-striking faults associated with apparent east-west extension of the range (Mohadjer et al. 2010).
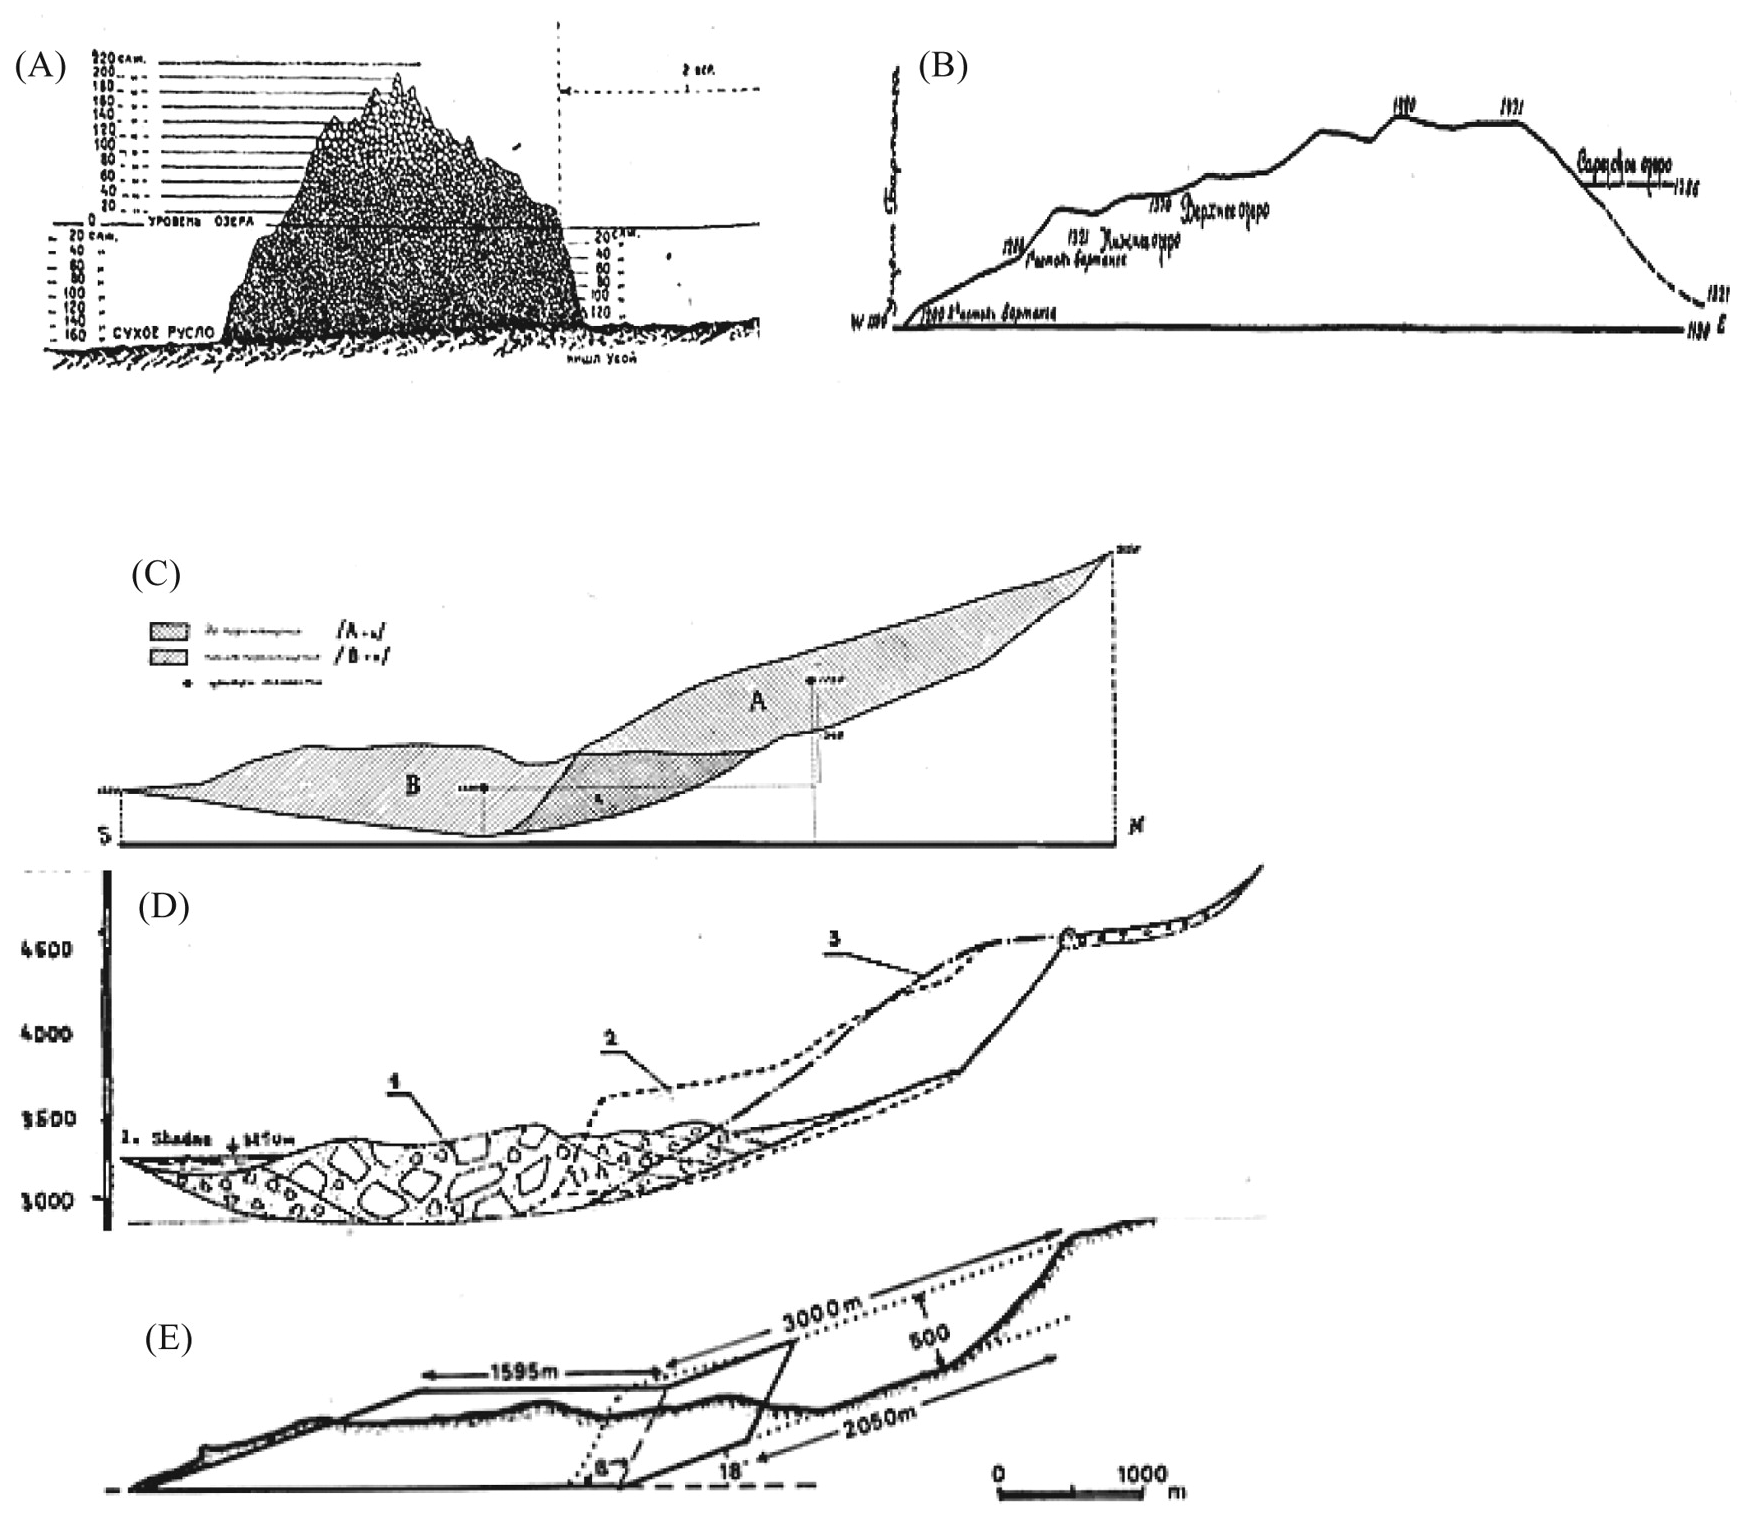
▲ Figure 8. Longitudinal and transverse sections of the Usoy slide. (A) Cross-section of rockslide near the end of the natural dam, at the opposite side of the valley at kishlak Usoy. On the right, the water level in Lake Sarez in October 1913, after Shpilko (1914). Notice the looser state of the slide material near the upper part of the rock mass. (B) Cross-section at the lowest point of the crest of the natural dam, after Preobrazhenski (1920). (C) General profile of the Usoy slide in 1915. Volume of slide = 2.21 km3 (after Preobrazhenski 1920). The lowering of the center of gravity of the sliding mass from A to B is shown as 340 sezhen = 725 m (1 sezhen = 2.1356 m). (D) Crosssection of the Usoy rockslide avalanche dam. 1 = transported slide material; 2 = original cross-section according to Preobrazhenski (1920); and 3 = alternative profile, after Gaziev (1984). (E) Section used to assess the residual strength mobilized during sliding and the spread of deformation (Ambraseys and Srbulov 1995).
It is possible then that the fault responsible for shaking in 1911 was either a strike-slip fault or a normal fault. Although Quaternary faults have been mapped in the vicinity of Lake Sarez, there is no evidence that the earthquake was associated with surface faulting. From the radius of maximum damage (80 km) and from the significant surface waves in the distant seismograms, we assume that the hypocenter was shallower than 40 km. It is possible that surface rupture occurred but was not noticed, or that it occurred in an inaccessible part of the Academi Nauk range. Assuming a magnitude of Mw = 7.7 suggests a fault dimension of the order of 50–80 km with mean slip of 6–10 m depending on its width.
Recent GPS studies between Osh and Khurog indicate convergence of 11.8 ± 2 mm/yr, or more than one half of the convergence rate between the Indian and Eurasian plates at this longitude (Mohadjer et al. 2010). East-west extension occurs between Khorog and the eastern edge of the Pamir at 8.4 ± 3 mm/yr, hence the surface geology experiences approximately simple shear. Were the Pamir earthquake to have occurred on the only fault active in the region one might anticipate a recurrence interval of a few hundred years. However, numerous faults exist in the region (Strecker et al. 1995), and it is possible that renewal times on the causal 1911 fault are to be measured in millennia, perhaps explaining the abundance of landslide materials available to be shaken loose in 1911.
| Galitzin 1915 | Jeffreys 1923 | Mw = 7.5 | Mw = 7.7 Mw = 7.9 | 4–6 Gt | |
|---|---|---|---|---|---|
| Usoy slide | 2.1–6 | 0.008–0.024 | 3–4.3 | ||
| Earthquake | 4.3 | 0.01–0.05 | 1.1 | 2.2 | 4.5 |
THE LANDSLIDE DAM AT USOY
We now evaluate the energy released by the Usoy landslide. Galitzin’s 1915 analysis considered the mean potential energy released by the descent, whereas Jeffreys (1923, 1924) noted that only a fraction of this energy would be converted to seismic waves due to the energy absorbed by the fragmentation and pulverization of the rocks as they impacted the valley floor. A third and crucial factor not considered fully by these early investigators was the duration of the landslide, which we show greatly exceeded the probable rupture propagation duration of an Mw > 7.5 earthquake.
The length of the rocks and debris of the Usoy slide measures 5,780 m along the valley, with a width of 3,800 m. Its maximum height is almost 760 m and consists of ≈ 6 × 10⁹ metric tons of debris and broken masses of carboniferous quartzites and schists with quantities of limestone and shales, in places including a matrix of loam moraine. It has an average downstream slope of about 1:7 and upstream of about 1:3, and the lake drains by discharging through the upper part of the body of the dam at rates of 30–90 m3/sec, which has prevented the lake water from overtopping the barrier. It is very probable, as Shpilko first suggested, that the water of the lake discharges only through the upper part of dam because the fill there was much more pervious, something that he depicts as reproduced in Figure 8A. The exact composition and internal layering of the rockslide is not known.
The steep slopes and exceptional relief in the epicentral region of the Sarez earthquake (Figure 6) renders the region susceptible to continual rockslides, landslides, and rock falls that may be triggered by many transient factors, earthquakes among them. For the environmental conditions in the Pamirs and for its geology, mechanical weathering is an important fac tor controlled by the range of prevailing temperatures. South-facing slopes experience prolonged daily insolation and consequently are exposed to a larger range of diurnal temperatures that enhances freeze-thaw weathering. This phenomenon is clearly seen in the upper reaches of the Indus River, where the east- and south-facing slopes are less steep and hence have longer and deeper incised tributary streams than those on north- and west-facing slopes (Ambraseys 1976; Ambraseys et al. 1975). The same effects appear to apply to the Sarez slides, the largest of which occurred on south-facing slopes. Currently, InSAR methods are used to monitor active slides bordering Lake Sarez; these slides also lie on south-facing slopes (Schuster and Alford 2004).
Landslides develop in two dynamic stages. At first, gravity, inertia, and co-seismic forces cause instability and permanent displacements of the slope along existing or new slip surfaces. These deformations are typically small and are controlled by the magnitude and duration of the earthquake accelerations, by the geometry of the slope, and by the undrained strength of the material mobilized during the earthquake. The second stage occurs post-seismically and follows if the residual undrained strength on the slip surface is less than that required to maintain static equilibrium. This reduction in resisting forces permits an accelerated movement of the mass downward. The resulting down-slope displacements, initiated by the earthquake, will continue with an outward movement of the mass of the slope and toe, their velocity providing the kinetic energy necessary for further transport of slide material.
The original location and shape of the slide material and its final average cross-section when it came to rest are given by Shpilko (1915), Preobrazhenski (1920), and Gaziev (1984) as shown in Figures 8A–D. These figures show that during sliding, the center of gravity of the detached mass of rocks was lowered by 725 m and displaced horizontally by about 2.3 km. The potential energy resulting from the fall of 6.0 109 metric tons of rock is large (4.3 1023 ergs, Table 4), but not all of this energy was converted to elastic waves (Jeffreys 1923, 1924; Bolt et al. 1975, 178–179; Srbulov 2008). The cushioning effect of turbulent flow at the base of the slide, which is known to accompany highly energetic events (Vardoulakis 2002), permitted the slide to rise part of the way up the opposing hillside.
Although little information is available about the material properties of the slide fill, it would appear that this was a rockslide in relatively brittle underlying material, and in the process of sliding the rock was pulverized and crushed, leading to consolidation. The existence of thin compact layers of fine, non-plastic silt in the slide material is mentioned by Gaziev (1984). Such material would be expected to show low values of residual internal friction (φres). In places the layers were found to be so impermeable as to prevent the saturation of the under lying material (Shpilko 1914, 1915). Also, the fact that seepage appeared on the downstream face only above 350 m from the base of the dam suggests that its lower part has an extremely low permeability in the form of crushed and pulverized material (Hanisch and Söder 2000; Ischuk 2006, 192). The slide may be considered, therefore, as a mass of rock debris that moved as a fluid mass. A first order back-analysis of the kinematics of the detached rock mass from its original to its final cross-section, in which internal deformations were allowed to occur during sliding, gives a residual value of the average effective angle of friction during rapid sliding of φres = 9°–20°, values that correspond to dry rock-flour. The actual average residual value of res depends on whether the sliding mass traveled over permafrost terrain and a frozen river, whether the slide occurred in retrogressing stages, and what the actual length of the bulk of the slide was that traveled outward. Angles of friction of 9°–20° correspond to a maximum velocity of sliding of about 31 m/sec and to a travel time to equilibrium of 107 s (Ambraseys and Srbulov 1995), similar to the 24 m/sec and 120s obtained by Lim et al. (1997; see Schuster and Alford 2004). At its final position the factor of safety against sliding of the rock mass is evaluated as 2.1 (Srbulov 2008, 217–219).
We estimate that the duration of strong ground movements at Usoy (Da5%–95% ), more than 20 km from the earthquake source, would have been approximately 30 s (Kempton and Stewart 2006), in which case the duration of sliding would have exceeded the duration of severe ground shaking by approximately a factor of four.
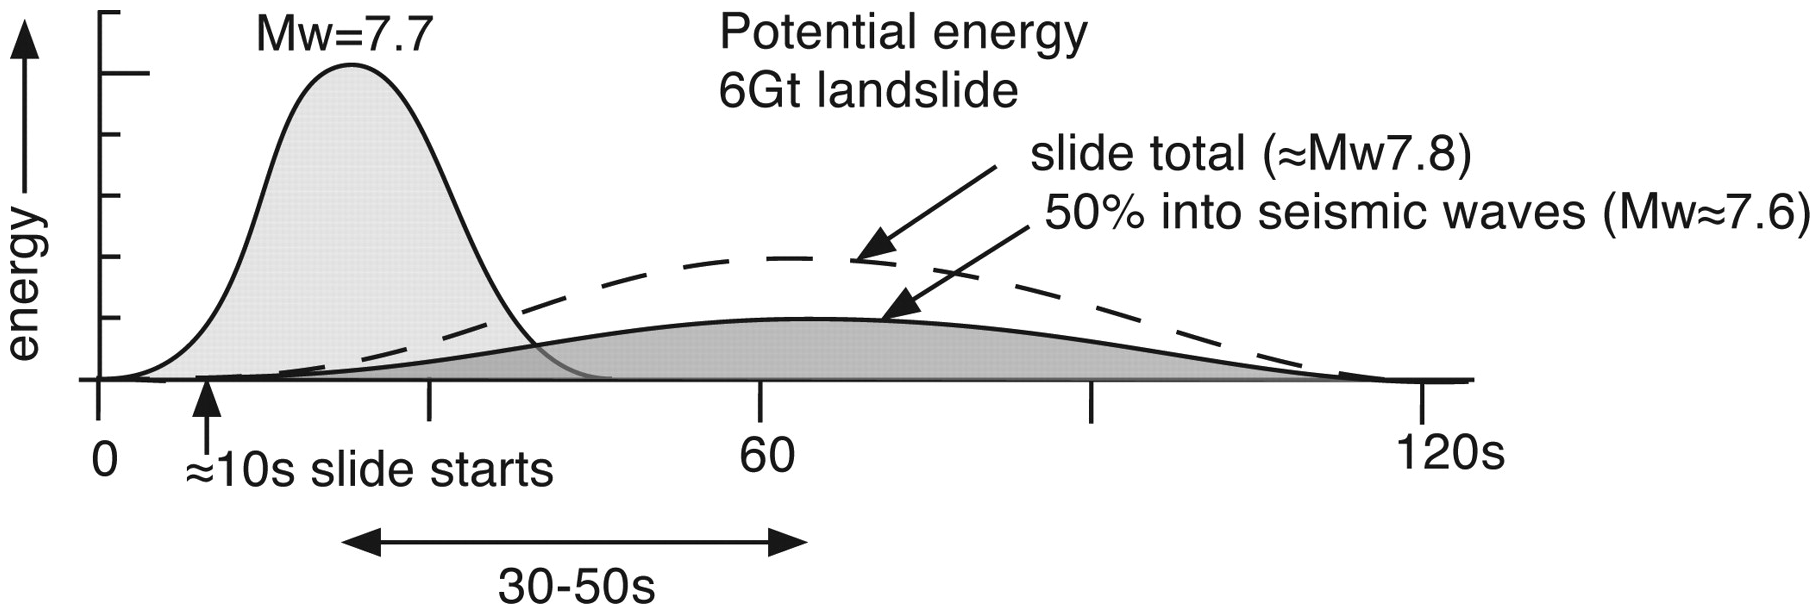
▲ Figure 9. Schematic source time functions for the 1911 earthquake and landslide. Although the areas under the Gaussian source functions are similar, the instantaneous peak energy from the landslide is four to six times lower than the peak energy from the earthquake. In this figure we assume that half of the energy from the slide was dissipated in fragmentation. Comminution may have absorbed a yet greater part of the potential energy of the slide; Jeffreys (1923) estimated >90%. Assuming 30-s and 107-s durations for the earthquake and the slide respectively, and a 25-km epicentral distance to the Usoy slide, peak earthquake wave amplitudes would have been recorded in distant seismograms 30–50 s earlier, and an order of magnitude larger, than the waves produced by the landslide.
THE IMPACT CONTROVERSY
From the observations published by Shpilko (1914, 1915), Galitzin calculated that the energy from the landslide was approximately similar to the energy inferred from the particle motions at Pulkowa (Table 3). This being the case, he proposed that his seismometers had recorded the unique case of an earthquake of zero focal depth, with coincidence between epicenter and hypocenter (Galitzin 1915). Galitzin died in 1916 (Klotz 1917b), but the Russian text of his original article had been translated into English the previous year by Klotz (1916, 1917a), who discussed the importance of the earthquake as a calibration event for the world’s growing array of seismometers. Yet apart from short, irrelevant comments (e.g., Ballore 1916), it was not until 1923 that the issue was revived in the seismological literature, and Klotz died later that year.
In 1923 Jeffreys reviewed the seismic energy calculations of Galitzin (1915) and reduced them by a factor of ≈300 to account for the downward attenuation of Raleigh wave particle motions. He supplemented these calculations using new observations based on his own energy calculations from seismograms recorded at Eskdalemuir. He also revised Galitzin’s calculation of the landslide energy to account for comminution, reducing Galitzin’s estimate of potential energy coupled to the ground by a factor ≈250. Notwithstanding these significant adjustments, the ratio of Jeffreys’s new energy estimates remained similar, leading him to concur with Galitzin that the seismic wave energy recorded in seismograms was indeed close to the potential energy released by the landslide (Jeffreys 1923, 1924). Thus Jeffreys, Galitzin, and Klotz were all in agreement that the energy released by the landslide was equal to that radiated as seismic waves as recorded at distant observatories. Had an earthquake occurred, its hypocenter would have to have been coincident in time and place with the landslide, and it would have to have been of relatively small magnitude. If this coincidence had not occurred, they reasoned, surely there should have been evidence in the seismograms for the separate signature of an earthquake.
Oldham (1923), however, who had studied Preobrazhenski’s 1920 field report, was reluctant to accept this interpretation. Both Oldham and Jeffreys had been present at a 1922 Royal Geographical Society meeting in London where the Pamir landslide had been discussed, and both left the meeting thinking about the issue from obviously different perspectives. Oldham’s 1923 article came out slightly later than Jeffreys’s, and Oldham clearly had Jeffreys’s article before him as he wrote. Oldham argued that the existence of aftershocks was indicative of a causal earthquake, since these would not be anticipated from a landslide. Oldham further argued that the ratio of the felt area to the area of maximum intensity shaking, as judged from the destruction to buildings and bridges, was typical of earthquakes rather than a shallow source. He noted that shallow earthquakes are associated with a rapid attenuation of felt intensity with epicentral distance, unlike that reported for the 1911 event, which was felt 400 km from the epicenter. His experience with the 1897 Shillong earthquake (Oldham 1899), moreover, led him to suggest that the large area of felt intensity was typical of a deep earthquake. (He believed, erroneously, as it turned out, that the depth of the 1897 Shillong mainshock exceeded 100 km.) Finally, he noted that numerous other landslides had occurred, but neither the mega-slide nor the numerous secondary slides were centered on the region of maximum macroseismic shaking as indicated by the reported epicentral damage.
In his first edition of The Earth (1924), Jeffreys noted that Turner’s hypocentral depths (Turner 1922) in the Pamir were inconsistent with a zero depth calculated for the 1911 Pamir earthquake, but in a footnote Jeffreys airs Oldham’s arguments for a causal earthquake at significant depth. In 1929, in his second edition of The Earth, Jeffreys had apparently been persuaded by Oldham’s article, for he omits his 1924 discussion of the 1911 earthquake in favor of describing Turner’s evidence for deep earthquakes. He favored Turner’s methods because they were less dependent on good absolute times than on the measurement of relative P-S arrival times.
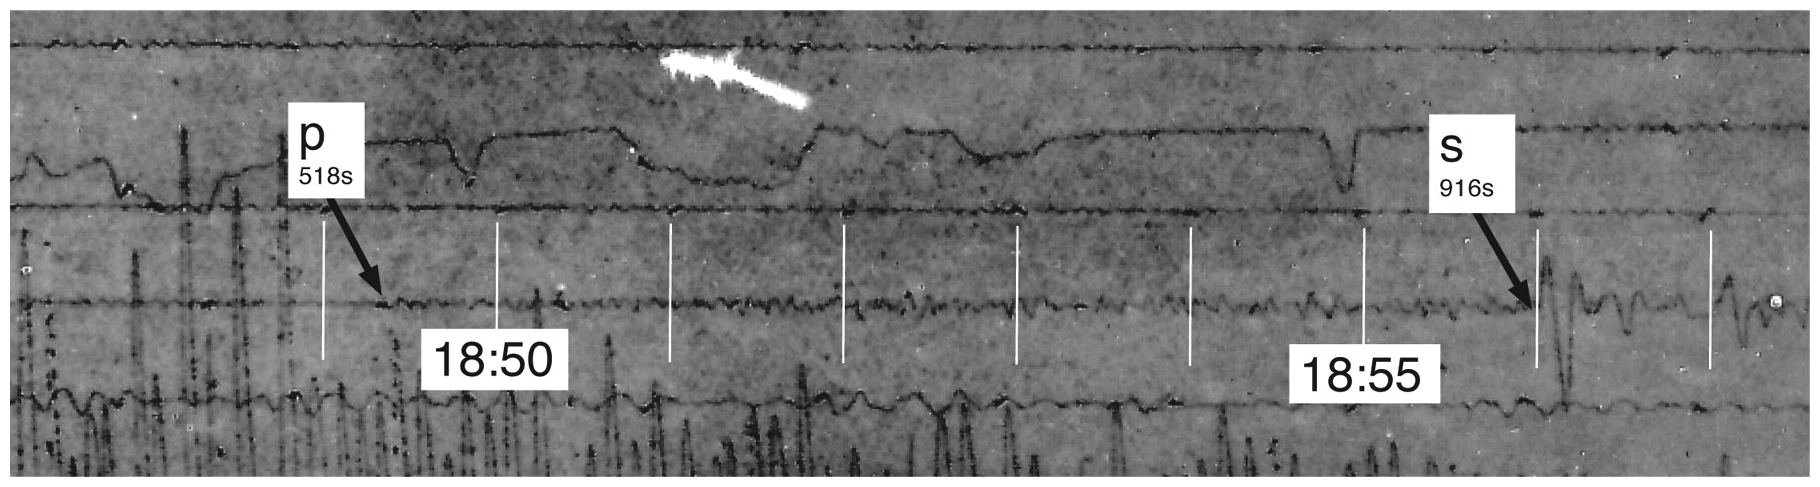
▲ Figure 10. The first several minutes of the Göttingen north-south seismogram for 18 February 1911 reveals an emergent continuous signal following the P phase (11.8 s WIN Δ = 44.8°). White lines are minute marks. The P and S elapsed time of arrival were read as 518 s and 916 s by Gutenberg (Figure 7) assuming an origin time of 18:40:43 GMT (Galitzin 1915).
His comments were prompted by the publication of the second edition of August Sieberg’s second-edition book on earthquakes (Sieberg 1904, 1923) in which Sieberg had expanded his Einsturzbeben (collapse-shaking) section from his 1904 first edition, invoking cave implosion and landslides as a potential source of seismic waves. In his article Macelwane repeats nonjudgmentally the arguments for and against the Pamir landslide being solely responsible for the teleseimic recordings of the 1911 Pamir event, but he also repeats the unresolved contradiction that recurs in the earlier discussions—the absence of two shocks in the seismograms. Had a substantial earthquake below or near Usoy triggered the landslide, there should have been two pulses of energy in the dozen or so seismograms of the event, not the single burst of seismic energy apparently present. Macelwane discussed new evidence in the form of large landslides in North America that had not produced felt earthquakes or double-energy pulses in the seismograms recorded by these collapse events. In conceding that Oldham was probably correct, and that one should be skeptical of gravitational collapse as a significant source of seismic energy, he was implicitly questioning the calculations associated with the coupling of landslide potential energy to the Earth, although he stopped short of stating his doubts directly.
Thus, the controversy had apparently ended, but it was not until 1933, in a short chapter titled “Impact Earthquakes,” that Macelwane emphatically refutes the notion that the Pamir landslide was solely responsible for seismograms of the event. Here he assumes that an earthquake must have triggered the slide. He recounts cumulative evidence for the several North American landslides that had failed to be detected by seismom eters (Macelwane 1933). He invokes, as an explanation for the absence of double phases in the Pamir seismograms, new findings that the Usoy landslide was of finite duration—i.e., a slide rather than a rock fall. The last word written on the subject came from Jeffreys (1937) a year after Oldham’s death, when he acknowledged Macelwane’s explanation as valid. He notes that his 1923 calculations were based on the energy of vertical descent, not a slide with a much extended duration of energy release. In his 1937 article he restated that the geographical offset between the Usoy landslide and the instrumental epicenter cannot be inferred from the poor-quality seismograms of the event, apparently forgetting that Oldham’s argument for this absence of coincidence was based on macroseismic data alone.
Had the earthquake occurred in the present day, the availability of broadband seismometers and the ≥25 km offset between epicenter and landslide would have permitted their relative contributions to be distinguished in worldwide seismograms. The energy released by the landslide, though equivalent to that associated with an Mw ≤7.9 earthquake (Table 4), was dissipated over 107 s, with at least half of the energy being absorbed by cracking and heating of the rocks at the base of the landslide. In contrast, the rupture duration of an Mw ≈ 7.7 earthquake with a rupture dimension of 50–80 km would not have much exceeded 30 s and would have started 5–10 s earlier depending on its depth and epicentral distance (Figure 9). Assuming that the landslide was associated with an approximately Gaussian time history of seismic energy release implies that the maximum amplitude surface waves from the landslide would have arrived 30–50 s after the long-period waves from the earthquake with an amplitude about an order of magnitude smaller. Not only did the amplitude of the surface waves from the earthquake dominate the teleseismic records available to seismologists in 1911, the surface waves from the landslide were at periods that early seismometers recorded somewhat poorly, and were further obscured by the poor dynamic range of these early recordings. As an example, one of the Göttingen seismograms is reproduced in Figure 10. It shows weak arrivals between the P and S phases that are possibly attributable to the shaking energy released by the landslide. We were unsuccessful in finding a recent seismogram from a shallow earthquake in the Pamir recorded near Göttingen to compare with the 1911 record.
CONCLUSIONS
We deduce that the 18 February 1911 Usoy landslide was triggered by an earthquake with magnitude Mw = 7.7 ± 0.2 in the shallow crust beneath the Pamir near 38.3°N, 72.30°E. Coincidentally, the potential energy released by a 2.4 km3 landslide triggered by this earthquake was almost identical, equivalent in energy to an Mw = 7.8 ± 0.1 earthquake, but its energy was released over almost two minutes, about four times longer in duration than the time it took for the earthquake to rupture. As a result, although seismograms in 1911 recorded the waves from the earthquake, the long duration pulse from the landslide was recorded close to, or below, the noise level of early seismometers.
In contrast to this finding, contemporary seismologists were unaware of the long duration of the landslide pulse and formed a different opinion. They compared the radiated seismic energy with the potential energy released by the landslide and concluded that since the two were almost identical the world’s seismograms had recorded a landslide, and not an earthquake. Galitzin (1915) presented the interesting notion that the seismograms were the result of a coincidence between hypocenter and epicenter. His ideas were championed by Klotz (1916), who translated Galitzin’s article from the Russian with comments on its potential utility as a unique calibration event.
Had not Oldham in 1923 pointed out that epicentral damage was typical of an earthquake at moderate depth with aftershocks, an absence of rapid attenuation, and an offset between the landslide and the region of maximum epicentral damage, the matter would probably not have puzzled seismologists for the next decade. Oldham (1923) was responding to Jeffreys (1923), who had also concluded that the energy from the landslide was apparently entirely responsible for the radiated energy. Jeffreys (1937) was eventually persuaded by Macelwane (1933) that the long duration of the landslide must be responsible for its apparent absence in seismograms.
Though the earthquake and the controversy are now only of historical interest, the effects of the landslide persist to this day (CECD 2007; Droz et al. 2008). The causal fault may have been normal or strike-slip in mechanism, and although it is likely to have been shallow, no known surface fault has been associated with its rupture. The Usoy landslide remains the largest natural or manmade dam in the world, and the volume of water confined in Lake Sarez is seven times greater than the volume of the rock holding it back (Schuster and Alford 2004). A breach in the dam would be catastrophic to many thousands of people downstream.
ACKNOWLEDGMENTS
We thank Dr. J. Ebel for his meticulous reviews of this manuscript. Dr. J. Dewey kindly helped us retrieve the Göttingen record from the USGS historical archive in Golden, Colorado. We are most grateful for the facilities afforded by many libraries, notably the Royal Geographical Society, Geological Society in London, the Public Record Office in Kew, University of Colorado at Boulder, and the Lenin Library, Moscow. RB was supported by NSF EAR3473959.
REFERENCES
Abdrachmatov, K. E., K. D. Djanuzakov, and D. Delvaux (2002). Active tectonics and seismic hazard of the Issyk-Kul basin in the Kyrgyz Tian-Shan. In Lake Issyk-Kul: Its Natural Environment, ed. J. Klerkx and B. Imanackunov, 147–160. Dordrecht and Boston: Kluwer Academic Publishers.
Agakhanjanz, O. E. (1989) Sarez. Leningrad: Leningrad Press, 110 pp.
Agakhanjanz, O. E. (1996). A night in the Year of the Pig. In Around the Roof of the World, ed. N. Shoumatoff and N. Shoumatoff, 122–143. Ann Arbor, Michigan: University of Michigan Press.
Alford, D., and R. Schuster eds. (2000a). Usoi Landslide Dam and Lake Sarez. U.N. Publication ISDR Prevention Series 1E.00.III.M.1, ISBN 92-1-132022-4, 101 pp.
Alford, D., and R. Schuster (2000b). An Assessment of Hazard and Risk in the Pamir Mountains, Tajikistan. In Usoi Landslide Dam and Lake Sarez: U.N. Publication ISDR Prevention Series 1E.00. III.M.1, ISBN 92-1-132022-4,
Ambraseys, N. (1976). The Stability of Slope along the Indus River Gorge North of Palas. UNESCO Field Mission Report Publication no.199/FMR. UNESCO: Paris, 36 pp.
Ambraseys, N. (2001). Reassessment of earthquakes, 1900 to 1999, in the eastern Mediterranean and the Middle East. Geophysical Journal International 145, 471–485.
Ambraseys, N., and R. Bilham (2009). The tectonic setting of Bamiyan and the seismicity in and near Afghanistan for the past 12 centuries. In The Destruction of the Giant Buddha Statues in Bamiyan, chapter 7, 67–94. Paris: UNESCO.
Ambraseys, N., and J. Douglas (2000). Reappraisal of surface-wave magnitudes in the eastern Mediterranean and Middle East. Geophysical Journal International 141, 357–373.
Ambraseys, N., and J. Douglas (2004). Magnitude calibration of north Indian earthquake. Geophysical Journal International 159, 165– 206.
Ambraseys, N., G. Lensen, and A. Moinfar (1975). The Pattan Earthquake of 28 December 1974. UNESCO Field Mission Report Publication no.134/FMR, Paris, 53 pp.
Ambraseys, N., and C. Melville (1982). A History of Persian Earthquakes. Cambridge: Cambridge University Press, 219 pp.
Ambraseys, N., and M. Srbulov (1995). Earthquake induced displacements of slopes. Soil Dynamics & Earthquake Engineering 14, 59–71.
Ballore, M. (1916). Basis of the geologic theory of earthquakes. Annales de Geographie 25 November 1916 (in French). Translated and reprinted in 1919 in Bulletin of the Seismological Society of America 9, 8–19.
Berg, L. (1915). Pamirskoi katastrof 1911 g. Prirod 7, 182–183.
Bogdanovich, K., I. Kark, B. Koraliakov, and D. Mushketov (1914). Zemletryasenie v severn’ikh tsepyakh Tien’shania 22 dekabria 1910 g (4.1.1911g). Trudi Geologisk Kommisia, Novaya seria 89, 140 pp.
Bogdanovich, K. I. (1911). Zemletryasenie 22 dekabria 1910 g. v severn’ikh tsepyakh Tien’shania mezdu Vernim i Issik-Kulem. Izvvestiya Geololgisk Kommisia 39 (4).
Bolt, B., W. Horn, and S. R. Macdonald (1975). Geological Hazards. Berlin and New York: Springer.
Bukinist, D. D. (1913). Usoiskoe zemletriasenie i ego posliedstvia. Russaye viedomostu 187. 14 August 1913 (newspaper article).
Burtman, V. S., and P. Molnar (1993). GeologicalandGeophysicalEvidence for Deep Subduction of Continental Crust beneath the Pamir. Geological Society of America Special Paper 281. Washington, DC: GSA.
Committee on Emergencies and Civil Defence (CECD), Government of Tajikistan (2007). United Nations International Strategy for Disaster Prediction Report (August). Dushanbe: CECD.
Chatelain, J. L., S. W. Roecker, D. Hatzfeld, and P. Molnar (1980). Microearthquake seismicity and fault plane solutions in the Hindu Kush region and their tectonic implications. Journal of Geophysical Research 85, 1,365–1,387.
Chuenko, P. P. (1936). K geologii bassenya Sareskogo Ozera. Trudi Tadzhiksko Pamiroskaya ekspeditsia 1934 62, . Leningrad: Tsentralnaya Nauchno-issledonke Geograficheskago Razvedit Institut.
Delvaux, D., K. Abdrakhmatov, I. Lemzin, and A. Strom (2001). Landslides and surface breaks of the 1911 Ms 8.2 Kemin earthquake, Kyrgystan. Geology and Geophysics 42, 1,583–1,592.
Droz, P., A. Fumagalli, F. Novali, and B. Young (2008). GPS and InSAR technologies: A joint approach for the safety of Lake Sarez. Fourth Canadian Conference on Geohazards Université Laval, 20–24 May 2008.
Engdahl, E. R., R. van der Hilst, and R. Buland (1998). Global teleseismic earthquake relocation with improved travel times and procedures for depth determination. Bulletin of the Seismological Society of America 88, 722–743.
Engdahl, E. R., and A. Villaseñor (2002). Global seismicity: 1900– 1999. In International Handbook of Earthquake and Engineering Seismology, Part A, ed. W. H. K. Lee, H. Kanamori, P. C. Jennings, and C. Kisslinger, chapter 41, 665–690. Amsterdam and Boston: Academic Press.
Fan, G., J. F. Ni, and T. C. Wallace (1994). Active tectonics of the Pamirs and Karakorum. Journal of Geophysical Research 99, 7,131–7,160.
Galitzin, P. B. (1915). Sur le tremblement de terre du 18 de février 1911. Comptes Rendus de l’Academie des Sciences de Paris 160, 810–813.
Gaziev, E. (1984). Study of the Usoy landslide in Pamir. Proceedings of the Fourth International Symposium on Landslides, 511–515. Toronto.
Goodbred, S. L., S. A. Kuehl, M. S. Steckler, and M. H. Sarker (2002). Controls on facies distribution and stratigraphic distribution in the Ganges-Brahmaputra delta sequence. Sedimentary Geology 155, 301–316.
Gorshkov, G. P., V. Spesivchsev, and V. Popov (1941). Katalog zemletriasenii na territori SSSR. Trudi Seism. Inst. Akad. Nauk (Moscow) 95, 28–29.
Gubin, N. E. (1960). Zakonomernosti seismicheskikh proiavlenii na territorii Tadzhikistana. Moscow: Izdatelstvo Akademia Nauk SSR.
Gutenberg, B., and C. Richter (1965). Seismicity of the Earth and Associated Phenomena. New York: Hafner
Hanisch, J., and C.-O. Söder (2000). Geotechnical assessment of the Usoi landslide dam and the right bank of Lake Sarez. In Usoi Landslide Dam and Lake Sarez, 23–41. Geneva: U.N. Publication
Huang, R. Q., and W. L. Li ( 2009). Analysis of the geo-hazards triggered by the 12 May 2008 Wenchuan earthquake, China. Bulletin of Engineering Geology and the Environment 68 (3), 363–371.
Ischuk, A. R. (2006). Usoy natural dam: Problem of security; Lake Sarez, Pamir Mountains, Tadjikistan. Italian Journal of Engineering Geology and the Environment, special issue 1, 189–192.
Jeffreys, H. (1923). The Pamir earthquake of 18 February 1911, in relation to the depths of earthquake foci. Monthly Notices of the Royal Astronomical Society Geophysical Supplement 1, 22–31.
Jeffreys, H. (1924). The Earth. 1st ed. Cambridge: Cambridge University Press, 278 pp.
Jeffreys, H. (1929). The Earth. 2nd ed. Cambridge: Cambridge University Press, 346 pp.
Jeffreys, H. (1937). On the materials and density of the earth’s crust. Monthly Notices of the Royal Astronomical Society Geophysical Supplement 4, 50–61.
Kalmetieva, Z. A., A. V. Mikolaichuk, B. D. Moldobekov, A. V. Meleshko, M. M. Jantaev, and A. V. Zubovich (2009). Atlas of Earthquakes in Kyrgystan. Bishek, Kyrgyzstan: Central Asian Institute of Applied Geosciences.
Kanamori, H. (1977). The energy release in great earthquakes. Journal of Geophysical Research 82, 2,981–2,997.
Keefer, D. K. (1984). Landslides caused by earthquakes. Geological Society of America Bulletin 95 (4), 406–421.
Keefer, D. K., and R. C. Wilson (1989). Predicting earthquake-induced landslides, with emphasis on arid and semi-arid environments. In Landslides in a Semi-Arid Environment with Emphasis on the Inland Valleys of Southern California, vol. 2, ed. P. M. Sadler and D. M. Morton, part I, 118–149. Riverside, CA: Inland Geological Society of Southern California Publications.
Kempton, J., and J. Stewart (2006). Prediction equations for significant duration of earthquake ground motions considering site effects. Earthquake Spectra 22, 985–1,013.
Kingdon-Ward, F. (1953). The Assam earthquake of 1950. The Geographical Journal 119 (2), 169–182.
Klotz, O. (1916). Earthquake of February 18, 1911. Bulletin of the Seismological Society of America 5, 206–213.
Klotz O. (1917a). Prince Boris Galitzin. Bulletin of the Seismological Society of America 7, 49–50.
Klotz O. (1917b). Some memoranda from the Chairman of the Scientific Committee. Bulletin of the Seismological Society of America 7, 97–105.
Kondorskaya, N., and N. Shebalin (1982). New Catalogue of Strong Earthquakes in the USSR. Washington, DC: World Data Centre A, U.S. Department of Commerce.
Kondorskaya, N., and N. Shebalin, eds. (1977). Novii katalog silnikh zemletriaseniii na territorii CCCP s drevnishikh vremen do 1975. Moscow: Izdatelstvo Nauka.
Koulakov, I., and S. V. Sobolev (2006). A tomographic image of Indian lithosphere break off beneath the Pamir-Hindukush region. Geophysical Journal International 164, 425–440.
Kudriavcheva, P. (1915), Opisanie puti ot’st. Muzi-kol do vpadeniye v’gunti riekaLiangasar. Izvestia Turkestantskoe Otdelenie Imperator Russkog Geograficheskikh Obchesta 11 (2), 63–69.
Lim, V. V., U. Akdodov, and S. Vinnichenko (1997). Sarez Lake Is a Threatening Dragon of Central Asia: Committee on Extreme Situations and Cases of Civil Defence of Government of Republic of Tajikistan. Main Geological Management of Government of the Republic of Tajikistan, Dushanbe, 54 pp.
Macelwane, J. B. (1926). Are important earthquakes ever caused by impact? Bulletin of the Seismological Society of America 16, 15–18.
Macelwane, J. B. (1933). Impact or rockfall earthquakes. In Seismology, vol. 4 of Physics of the Earth, by the subsidiary Committee on Seismology, 37–40. Washington, DC: National Research Council
Mason, K. (1914). Completion of the link connecting the triangulations of India and Russia, 1913. Records of the Survey of India 4, Dehra Dun: Survey of India, 121 pp.
Medvedev, E.G. (1952). Seismicheskoe rayonirovania gorodov. Moscow: Instit Fizika Zemli USSR.
Mohadjer, S., R. Bendick, A. Ischuk, S. Kuzikov, A. Kostuk, U. Saydullaev, S. Lodi, D. M. Kakar, A. Wasy, M. A. Khan, P. Molnar, R. Bilham, and A. V. Zubovich (2010). Partitioning of India–Eurasia convergence in the Pamir–Hindu Kush from GPS measurements. Geophysical Research Letters 37, L04305; doi:10.1029/2009GL041737.
Negredo, A. M, A. Replumaz, A. Villaseñor, and S. Guillot (2007). Modeling the evolution of continental subduction processes in the Pamir–Hindu Kush region. Earth and Planetary Science Letters 259, 212–225.
Nikiforov, P. M. (1912). 1911 Bulletin de la Commission Centrale Sismique Permanente. St. Petersburg, Russia.
Nikonov, A. A. (1992). Induced seismicity due to reservoir impounding: Two typical examples from the Pamirs. Acta Montana, Series A (3), 133, 46.
Obruchev, V. A. (1922). Zeitschr. Gesellsch.f. Erdkunde, p. 47 in Stein 1933.
Oldham, R. D. (1899). Report on the Great Earthquake of 12 June 1897. Memoirs of the Geological Survey of India 29, 1–379.
Oldham, R. D. (1923). The Pamir earthquake of 18th February 1911. Quarterly Journal of the Geological Society 79, 237–245.
Parker, N. R., A. L. Densmore, N. J. Rosser, M. de Michele, Y. Li, R. Huang, S. Whadcoat, and D. N. Petley (2011). Mass wasting triggered by the 2008 Wenchuan earthquake is greater than orogenic growth. Nature Geoscience 4, 449–452.
Preobrazhenski, I. A. (1915). Usoyskii zaval. Napechatano po Rasporiazhenigo Komiteta Dekemvir.
Preobrazhenski, I. A. (1920). Usoiskii zaval. Trudi Geologiska Kommitte Materiali po Obshchei Prikladnoi Geologis 4, Petrograd.
Pultov, INITIAL (1913). Transactions Geograph. Soc., Tashkent. In Stein 1933.
Schultz, A. von (1914). Die Pamirtadschik. Giessen, Germany: Verlag von Alfred Töppellman, 96 pp.
Schultz, A. von (1916). Ländeskudliche Forschungen rschungen im Pamir. Abhandlungen Hamburischen Kolonialinstituts 33, 45–64,. Hamburg: Hamburischen Kolonialinstituts, 158 pp.
Schuster, R., and D. Alford (2004). Usoi landslide dam and Lake Sarez, Pamir Mountains, Tajikistan. Environmental & Engineering Geoscience 10 (2), 151–168.
Shpilko, G. A. (1914). Zemletrasenie 1911 goda na Pamire i ego posledsrvanie Izv. Russkago Geograficheskago Obshchestva. (24 February 1914) 1–2, 68–94.
Shpilko, G. A. (1915). Novie svedenia ob Usoiskom zavile i Serezskom ozere. Izvestia Turkenstanskogo Otdelenia Russkovo Geograficheskago Obshchestva 2, (2) 2 September 1914 and 7 October 1914.
Sieberg, A. (1904). Handbuch der Erdbebenkunde. Braunschweig, Germany: Friedrich Vieveg & Sohn. 362 pp.
Sieberg, A., (1923). Handbuch der Erdbebenkunde: Geologische, Physikalische und Angewandte, 572 pp. Jena: G. Fisher.
Sobell, E. R., L. R. Schoenbohm, J. Chen, R. Thiede, D. R. Stockli, M. Sudo, and M. R. Strecker (2011). Late Miocene deceleration of dextral slip between Pamir and Tarim: Implications for Pamir orogenesis. Earth and Planetary Science Letters 304, 369–378.
Spesivcheva, V. (1933). Istoriko-statisticheskie materiali po seismichnosti Srednei Azii. Trudi Seismologiska Institut 34, Leningrad: Izdateltsvo Akademia Nauk.
Srbulov, M. (2008). Geotechnical Earthquake Engineering. New York: Springer.
Stein, M. A. (1916). A third journey of exploration in Central Asia 1913– 1916. The Geographical Journal 48, 97–130.
Stein, M. A. (1933). On Ancient Central-Asian Tracks: A Brief Narrative of Three Expeditions in Innermost Asia and North-western China. London: MacMillan & Co.
Stein, M. A. (1928) Innermost Asia (volume 2). Oxford: Clarendon Press, 1,123 pp.
Strecker, M., M. Frisch, M. Hamburger, L. Ratschbacher, S. Semiletkin, A. Zamoruyev, and N. Sturchio (1995). Quaternary deformation in the eastern Pamirs, Tadzhikistan and Kyrgyzstan. Tectonics 14, 1,061–1,079.
Szeliga, W., S. Martin, S. Hough, and R. Bilham (2010). Intensity, magnitude, location and attenuation in India for felt earthquakes since 1762. Bulletin of the Seismological Society of America 100 (2), 570–584.
Turner, H. H. (1922). Monthly Notices of the Royal Astronomical Society Geophysical Supplement 1, 1–13.
Turner, H., and J. Milne (1912). Seismological Committee of the British Association for the Advancement of Science circular no. 24, 48–98, for 1911.
Vardoulakis, I. (2002). Dynamic thermo-poro-mechanical analysis of catastrophic landslides. Geotechnique 52 (3), 157–171.
Veber, V. (1915). Po povodu obvala na Pamire v 1911 godu. Geologiska Vestnik 11. Petrograd.
Wang, Z. (2008). Avalanches, Landslides and Quake Lakes induced bythe Wenchuan Earthquake on May 12, 2008. Beijing: International Research and Training Center on Erosion and Sedimentation (IRTCES).
Zarubin, I. I. (1917). Materialy i zametki po etnografii gornyh tadzhkov: Dolina Bartanga. Sbornik Muzeâ Antropologii i Ètnografii pri Rossijskoj Akademii nauk 5 (1), 97–148.
Historical Records
Newspapers:
tv = Turkestanskie Vedomosti, 21.12.1910 o.s.
zo = Zakaspiskoe Obozrenie, 21–23.12.1910 o.s.
pa = Pamirskoi katastrof’ 1911 g., Prirod, no. 7
iz = Izvest. Turk. Otd. Imper. Geogr. Obch. 1915, vol. 11, no.2, pp.63–69
nv = Novoe Vremia 1911
cmg = The Civil and Military Gazette, Simla. Lahore (Various letters from readers refer to earthquakes in the North-West Frontier Province during January and February 1911.)
cmg1 = The Civil and Military Gazette, Simla, Lahore (2–27.01.1911)
cmg2 = The Civil and Military Gazette, Simla, Lahore (21–29.02.1911)
British Library India Office List: Political & Secret [L/P&S] records:
IO1 = I.O.L/P&S.7/248 Gilgit Political Agency Diaries February 1911
IO2 = I.O.L/P&S.7/249 Mashhad Military Attache Diaries no. 21.w/e 20.5.1911
IO3 = I.O.L/P&S.7/250 Mashhad Military Attache Diaries no. 23.w/e 03.6.1911
IO4 = I.O.Cal. 118F and 118G/1911
IO5 = I.O.L./P&S.7/249 Kashgar Diaries British Consul, 1911
IO6 = I.O.L/P&S no. 3–no. 6, Mashhad, Military Attache Reports, 28.1.191
[Back]
Posted: 1 March 2012