There are 12 tables and 23 figures in this electronic supplement. Table S1 contains a brief summary of ground motion prediction equations (GMPEs) parameters. Table S2 gives a statistical summary (mode, skewness and kurtosis) of the NGA-East database. The color-coded results of the residual (bias) analysis are presented in Tables S3–S6 for all sites combined, rock, soil, and deep soil sites. Tables S7–S10 summarize the results of normality tests (skewness and kurtosis) for all sites and rock-only sites and for distances within the first 100 km. Results of the log-likelihood (LLH) technique are given in Tables S11 and S12 for rock and all sites for distances within the first 100 km.
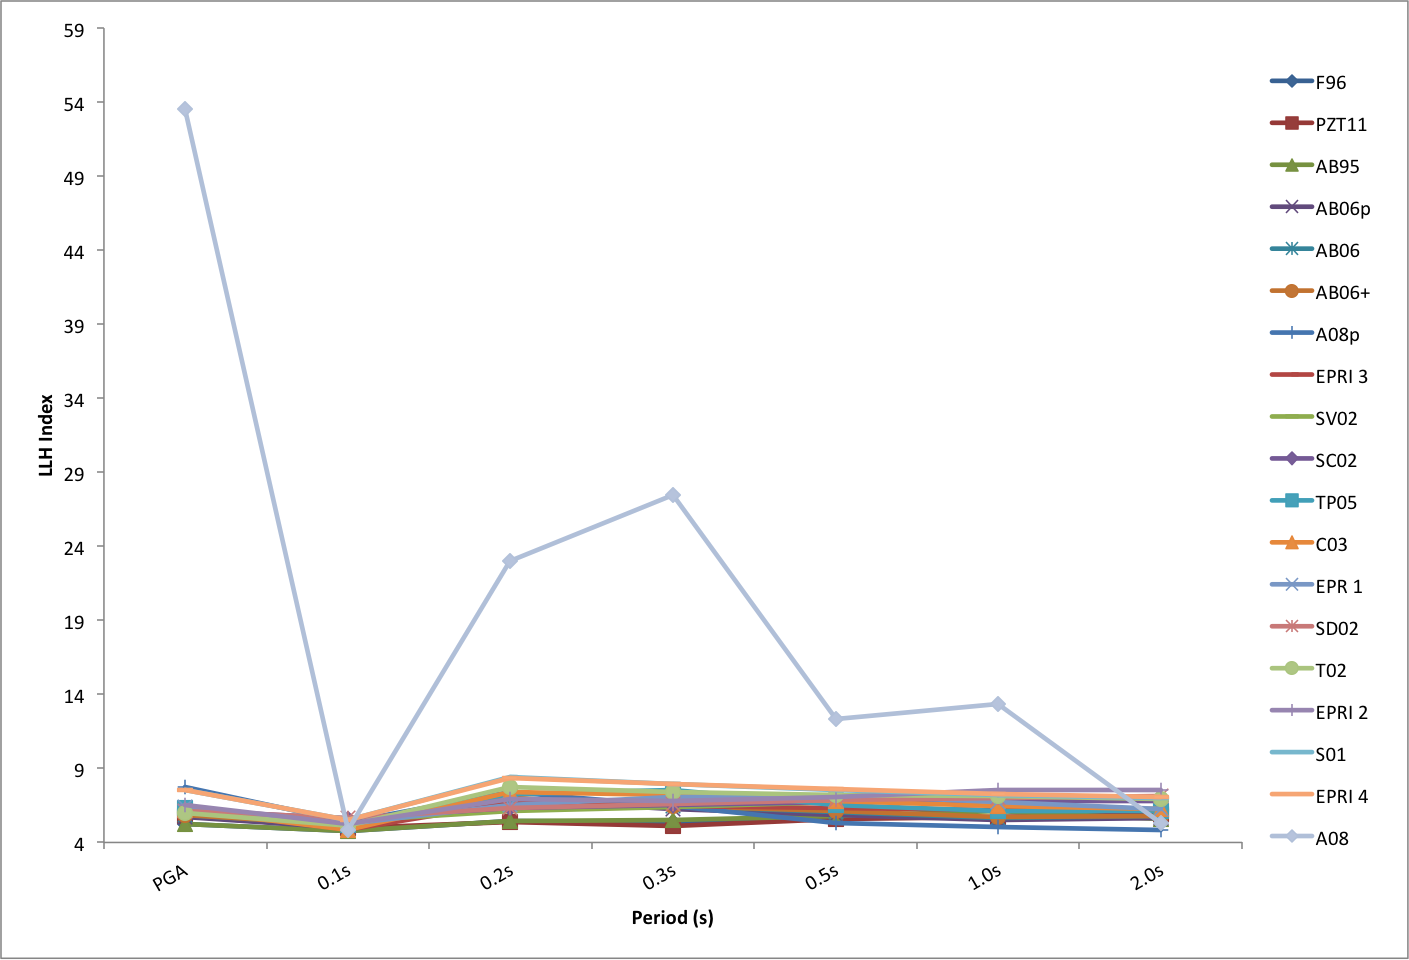
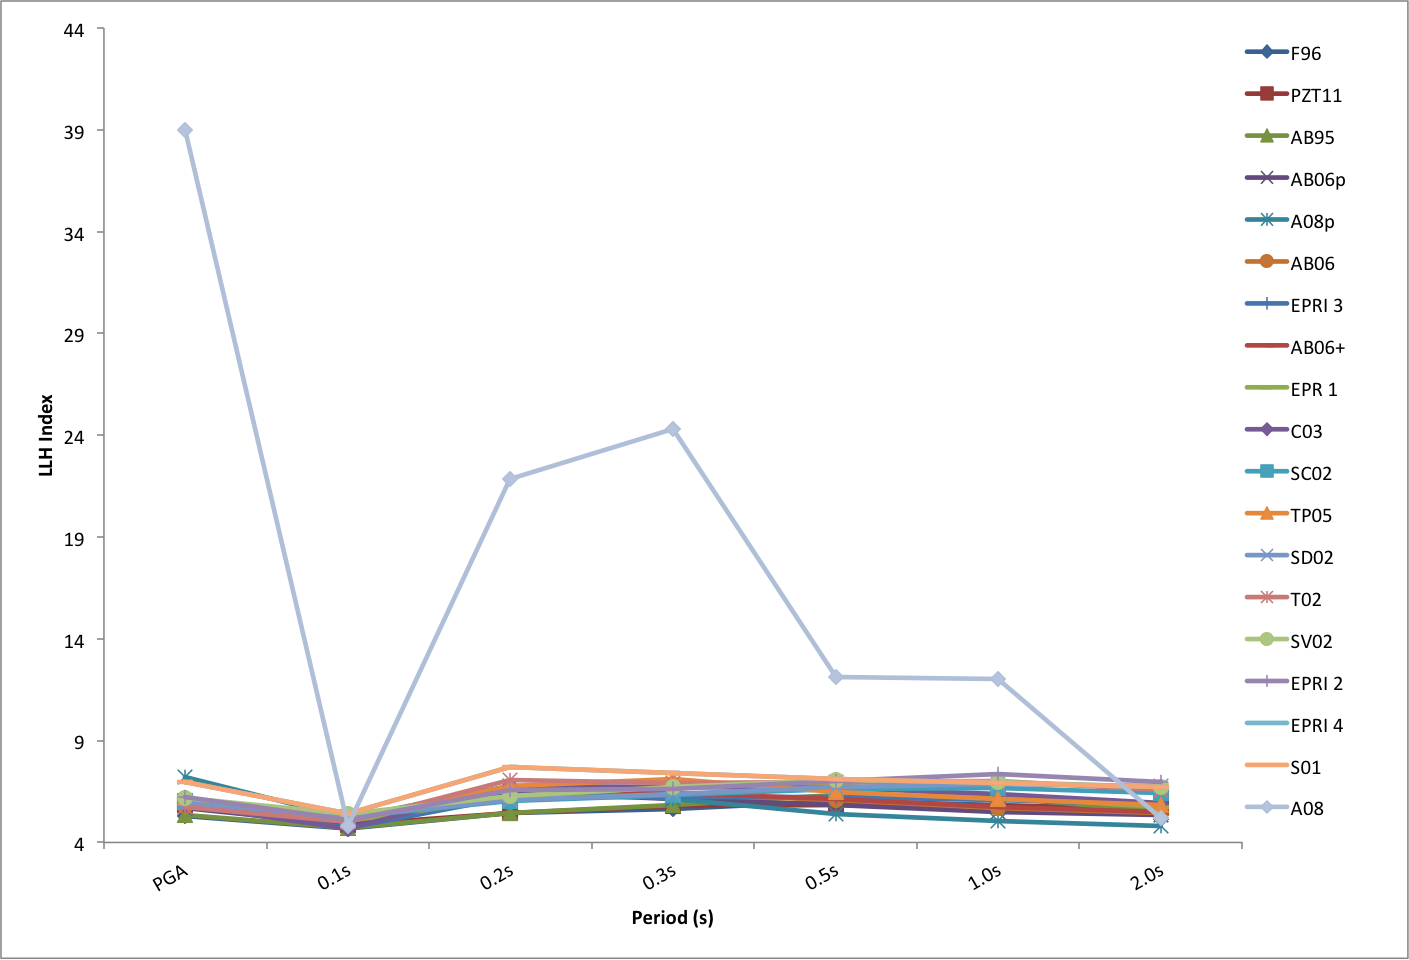
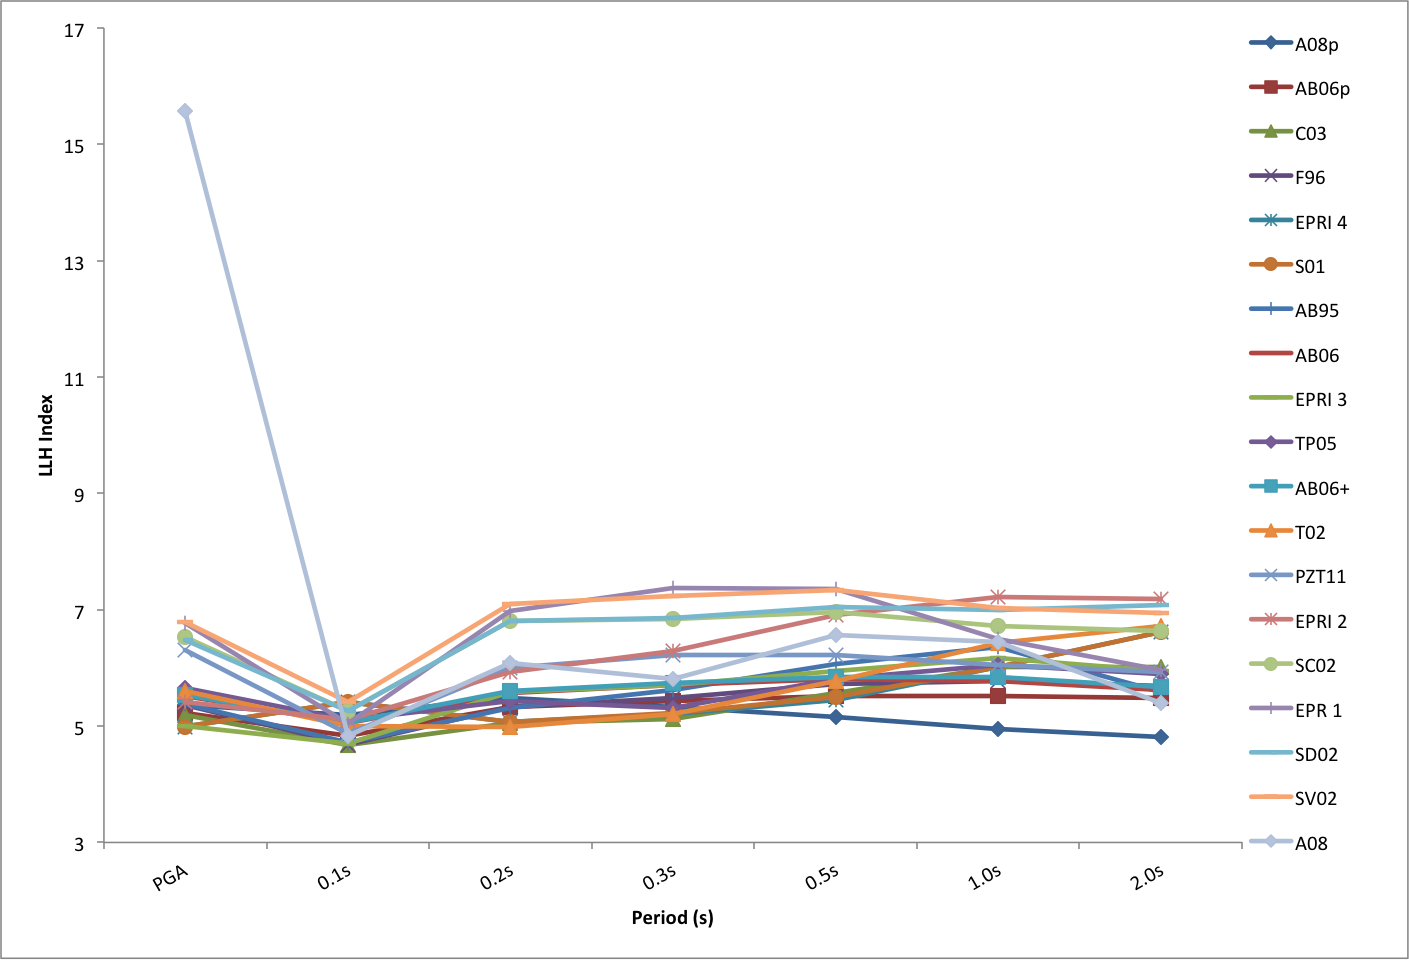
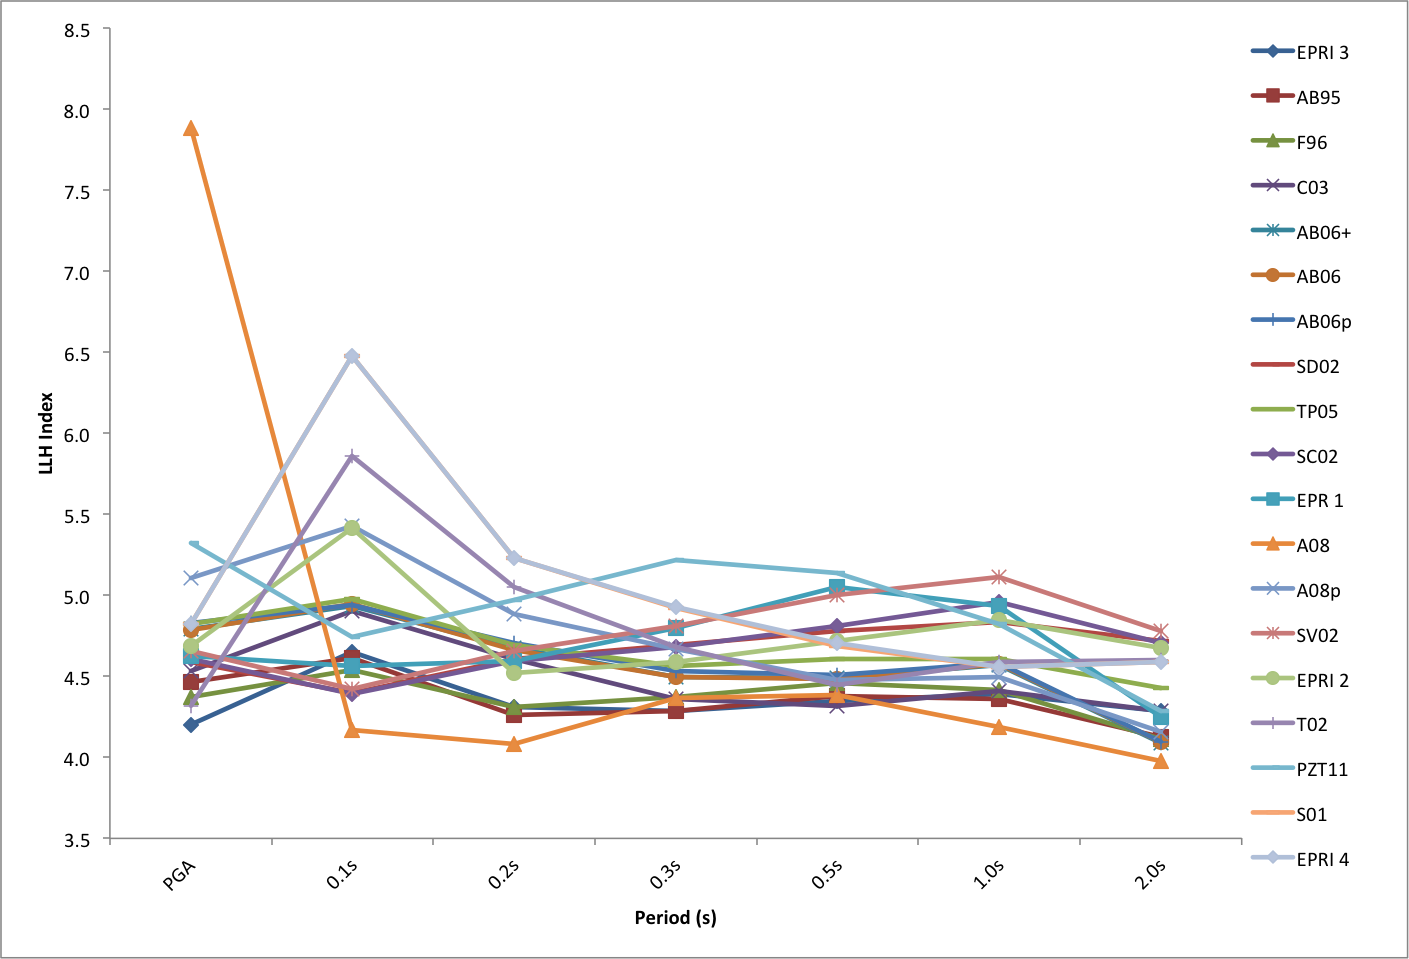
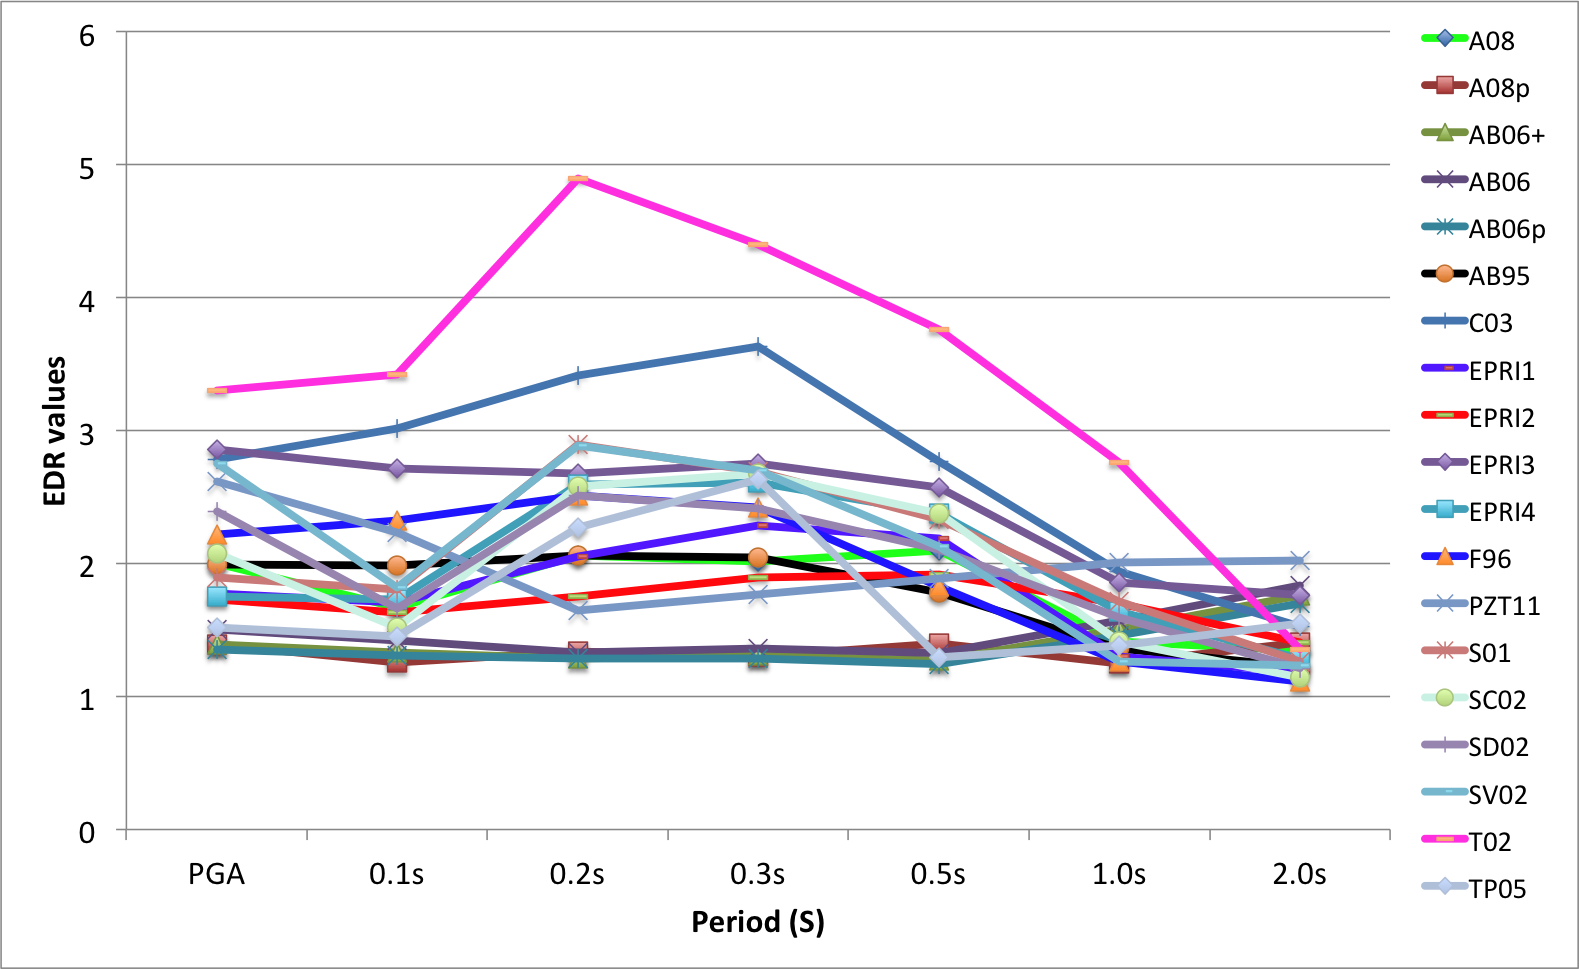
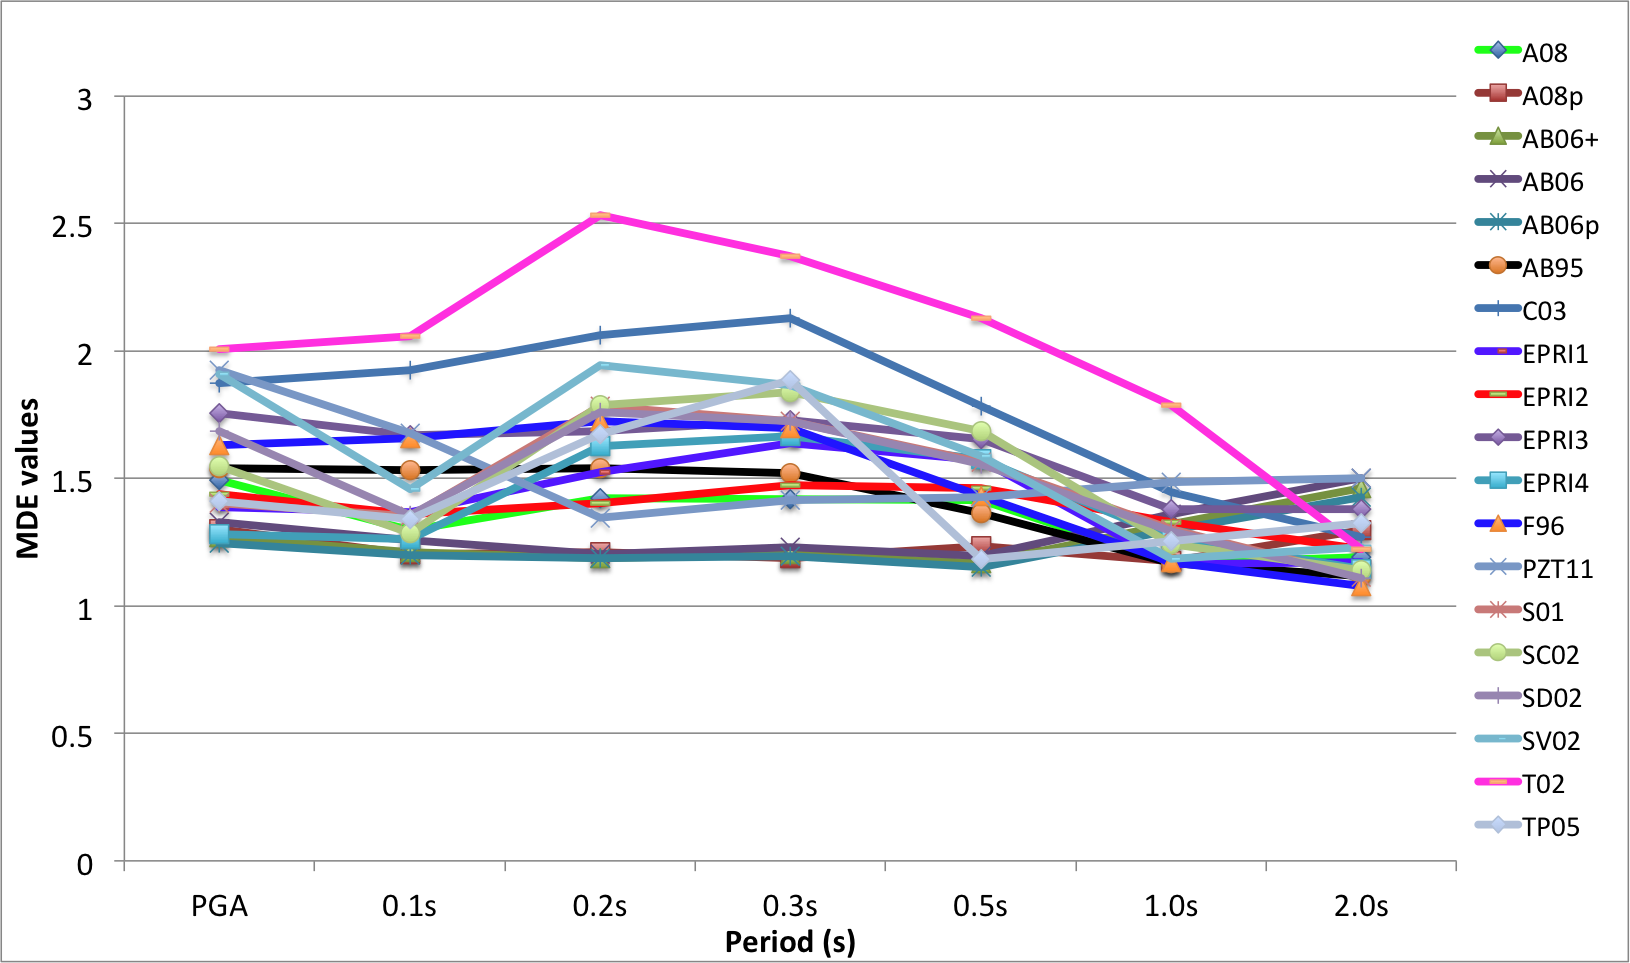
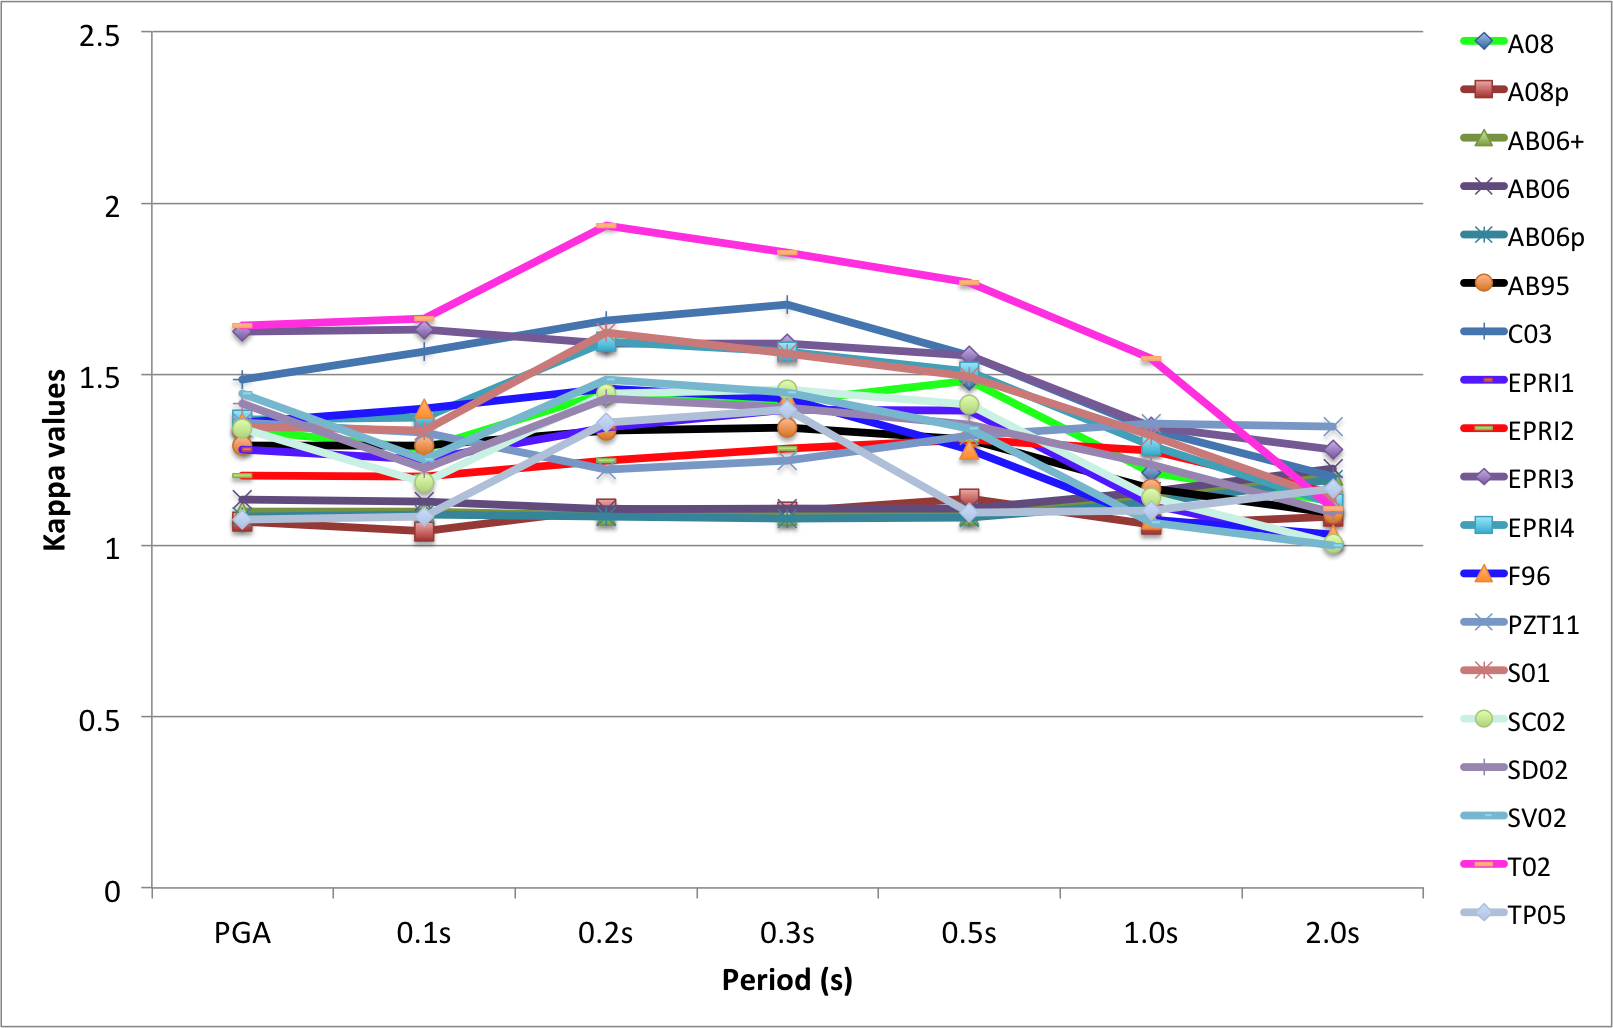
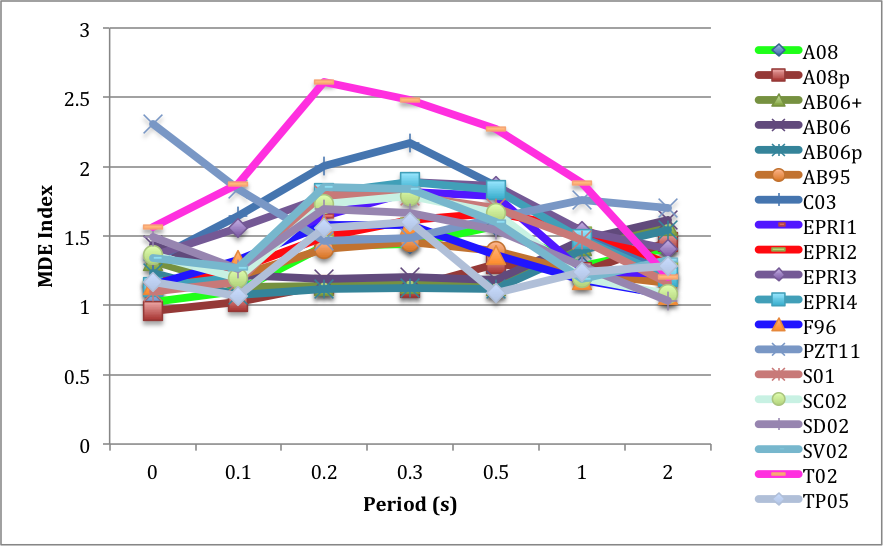
Figures S1–S4 summarize the same results of LLH for all sites combined, rock, soil, and deep soil sites. (The legend to the right of each figure indicates the GMPEs used in the study.) Results of the Euclidean distance-based ranking (EDR) are presented in Figures S5–S16. The EDR figures contain the results for modified Euclidean distance (MDE), results for the bias analysis (kappa), and the overall ranking (EDR) for all sites combined and for each of the three types of sites. Finally, Figures S17–S23 are boxplots for each of the different spectral periods studied for the rock sites.
Table S1. Summary of ground-motion prediction equation (GMPE) parameters.
Table S2. NGA-East database summary statistics.
Table S3. Results of classical residual analysis for all sites.
Table S4. Results of classical residual analysis for rock sites.
Table S5. Results of classical residual analysis for soil sites.
Table S6. Results of classical residual analysis for deep soil sites.
Table S7. NGA-East database skewness test results for all sites.
Table S8. NGA-East database skewness test results for rock sites.
Table S9. NGA-East database kurtosis test results for all sites.
Table S10. NGA-East database kurtosis test results for rock sites.
Table S11. Summary of log-likelihood results for rock sites and within 100 km.
Table S12. Summary of log-likelihood results for all sites and within 100 km.
Figure S1. Quantifying the fit between observed spectral acceleration and corresponding predictions from the GMPEs using the log-likelihood (LLH) technique for all sites.
Figure S2. Quantifying the fit between observed spectral acceleration and corresponding predictions from the GMPEs using the LLH technique for rock sites.
Figure S3. Quantifying the fit between observed spectral acceleration and corresponding predictions from the GMPEs using the LLH technique for soil sites.
Figure S4: Quantifying the fit between observed spectral acceleration and corresponding predictions from the GMPEs using the LLH technique for deep soil sites.
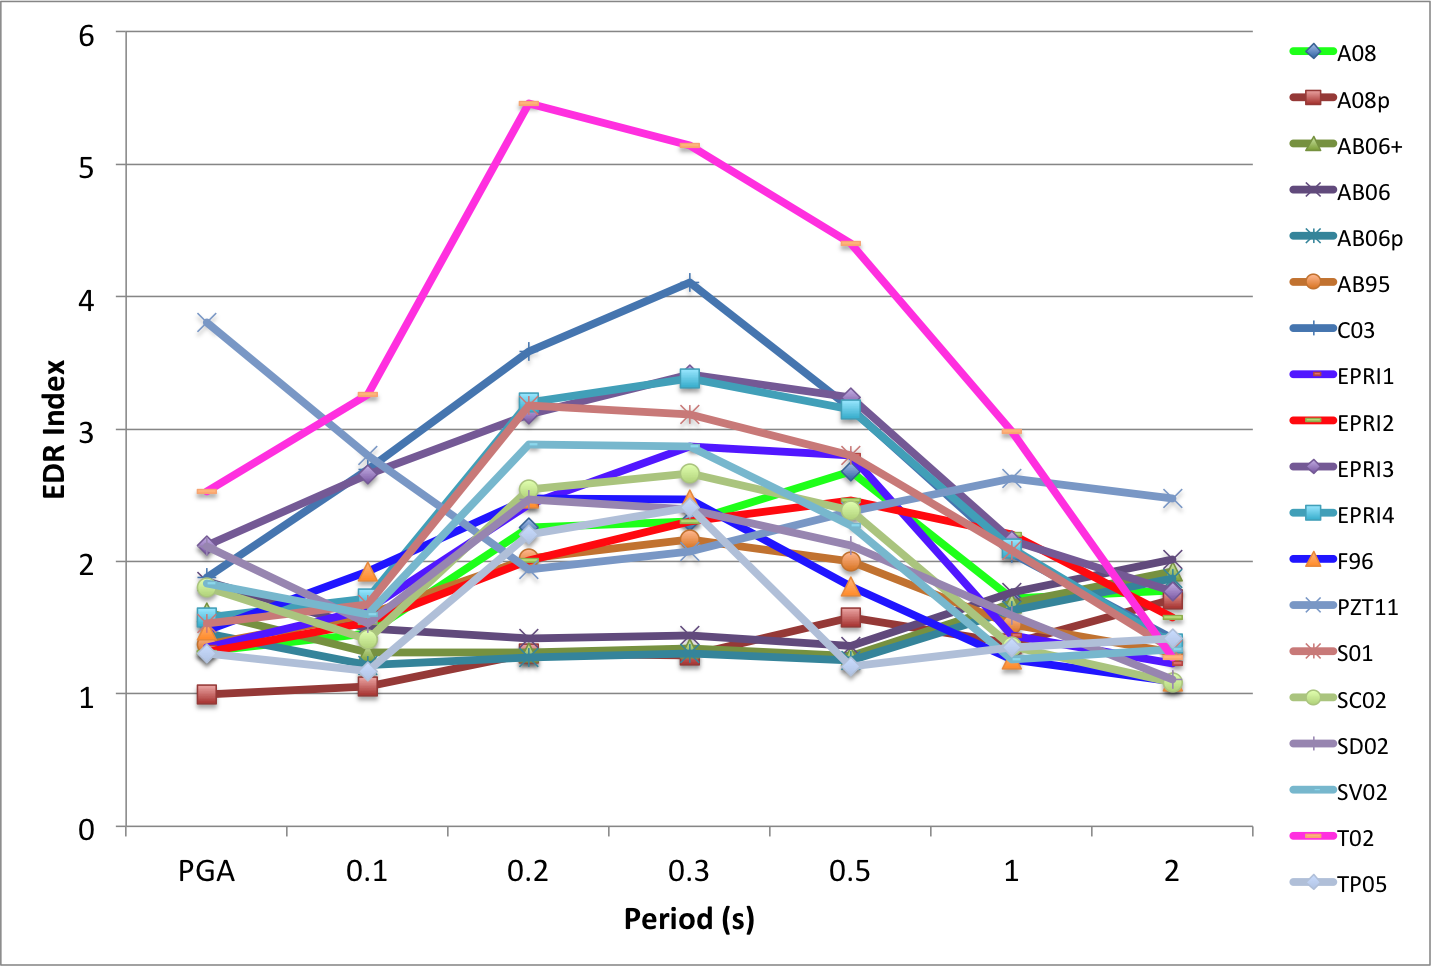
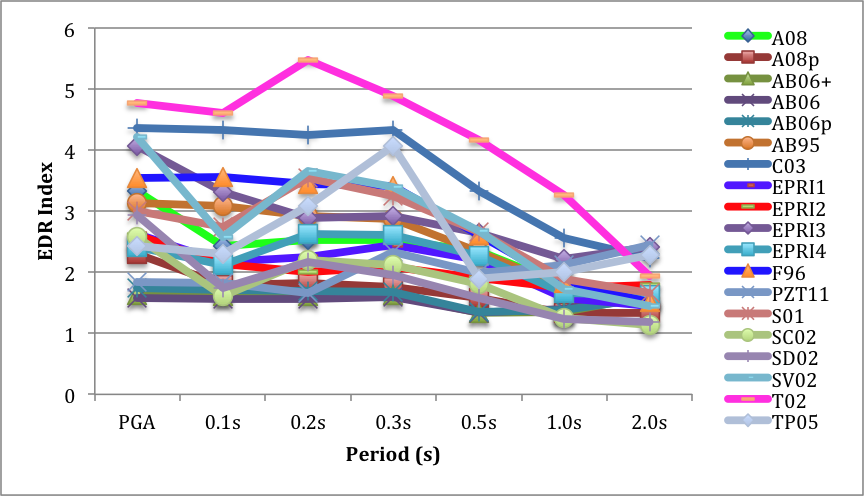
Figure S5. Euclidean distance-based ranking (EDR) for all sites.
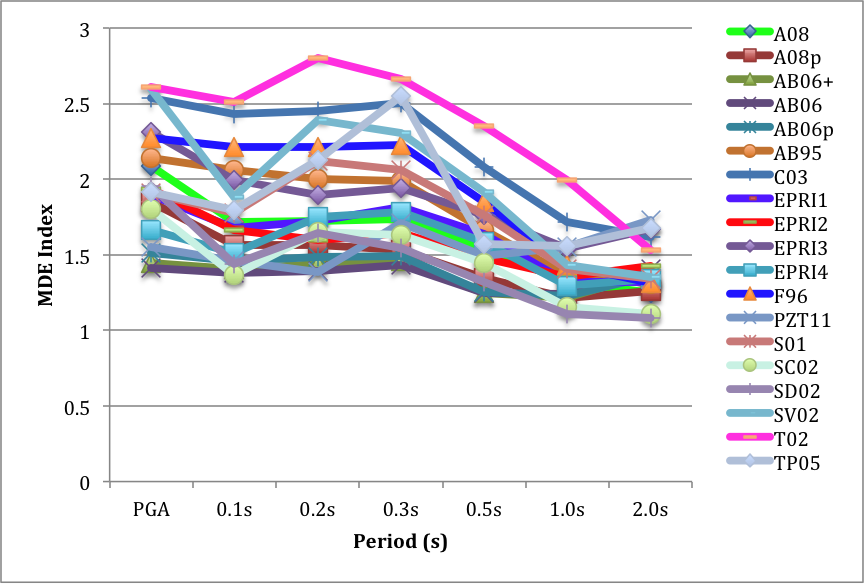
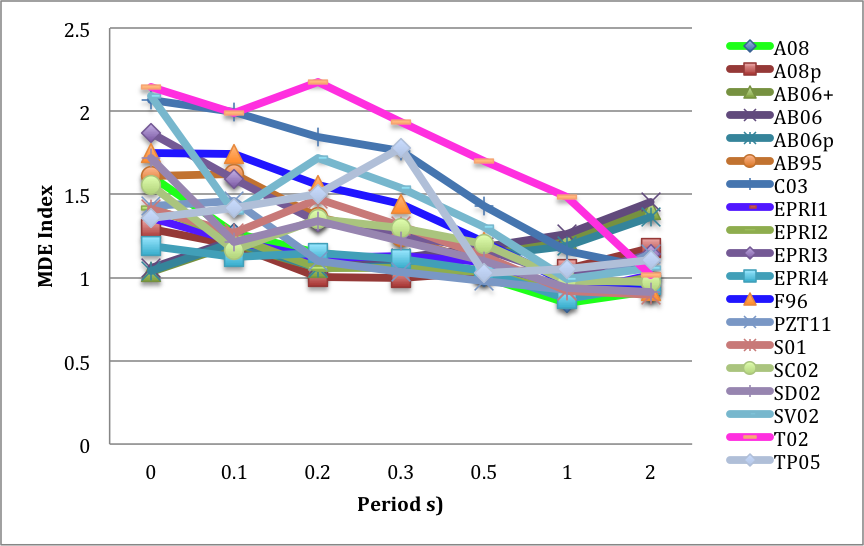
Figure S6. Modified Euclidean distance (MDE) ranking for all sites.
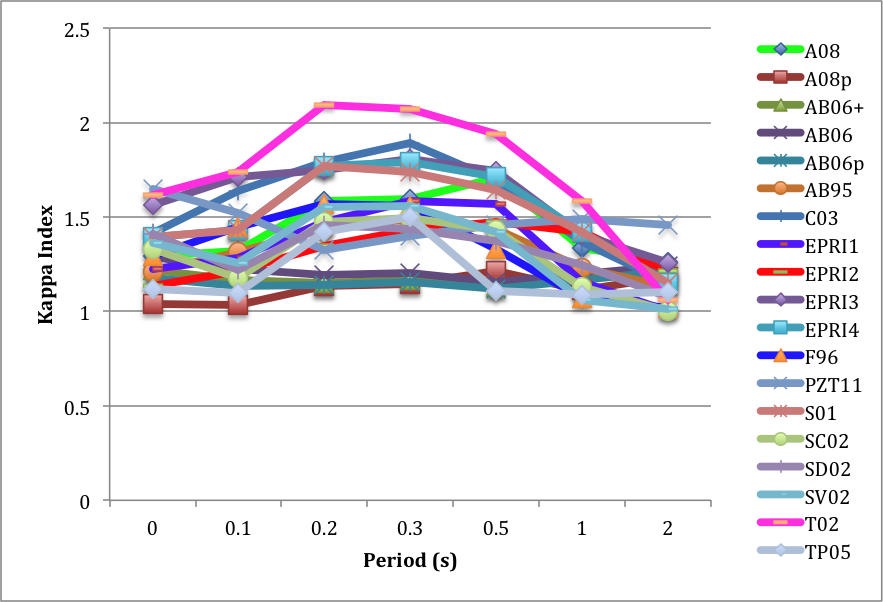
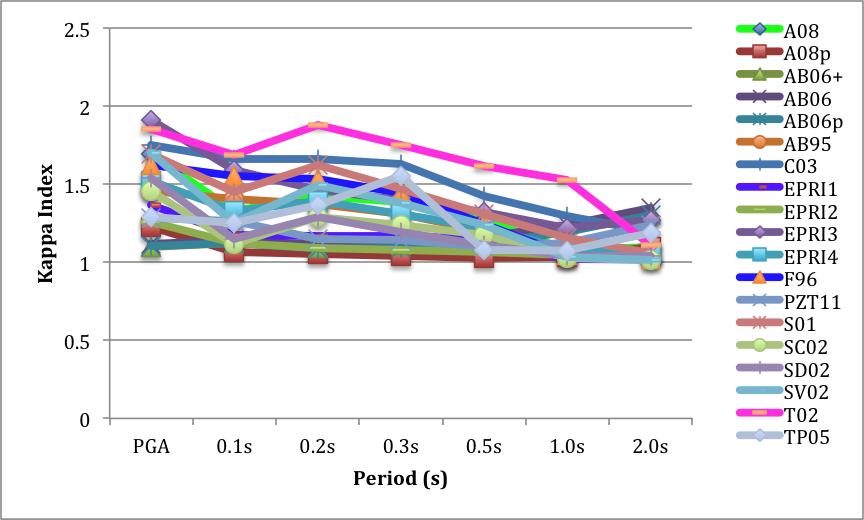
Figure S7. Kappa ranking for all sites.
Figure S8. MDE ranking for rock sites.
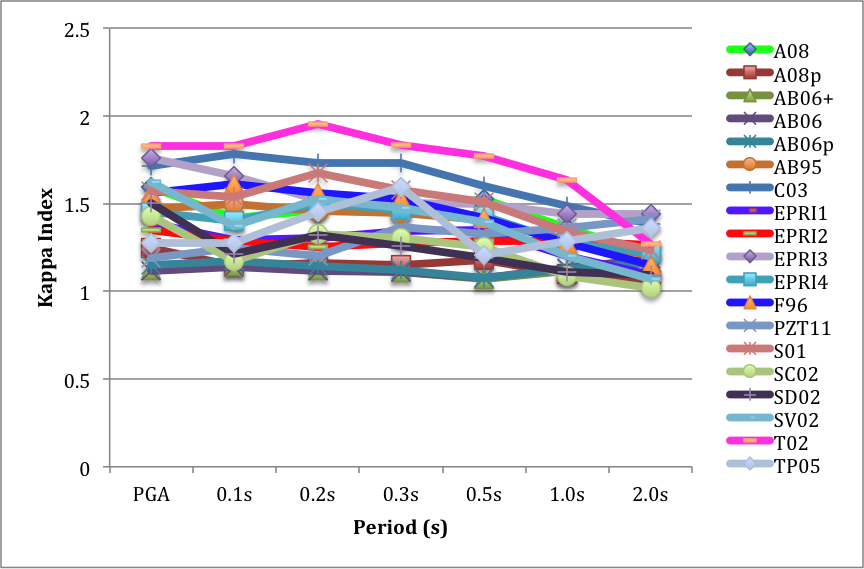
Figure S9. Kappa ranking for rock sites.
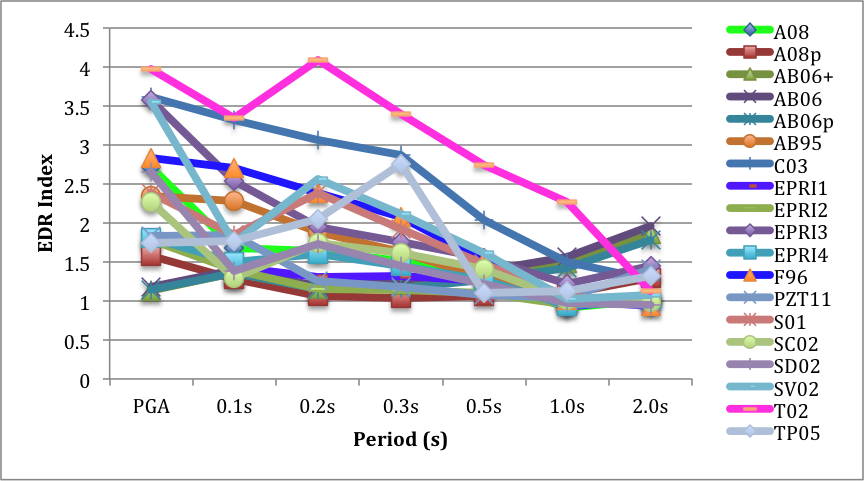
Figure S10. EDR for rock sites.
Figure S11. MDE ranking for soil sites.
Figure S12. Kappa ranking for soil sites.
Figure S13. EDR for soil sites.
Figure S14. MDE ranking for deep soil sites.
Figure S15. Kappa ranking for deep soil sites.
Figure S16. EDR for deep soil sites.
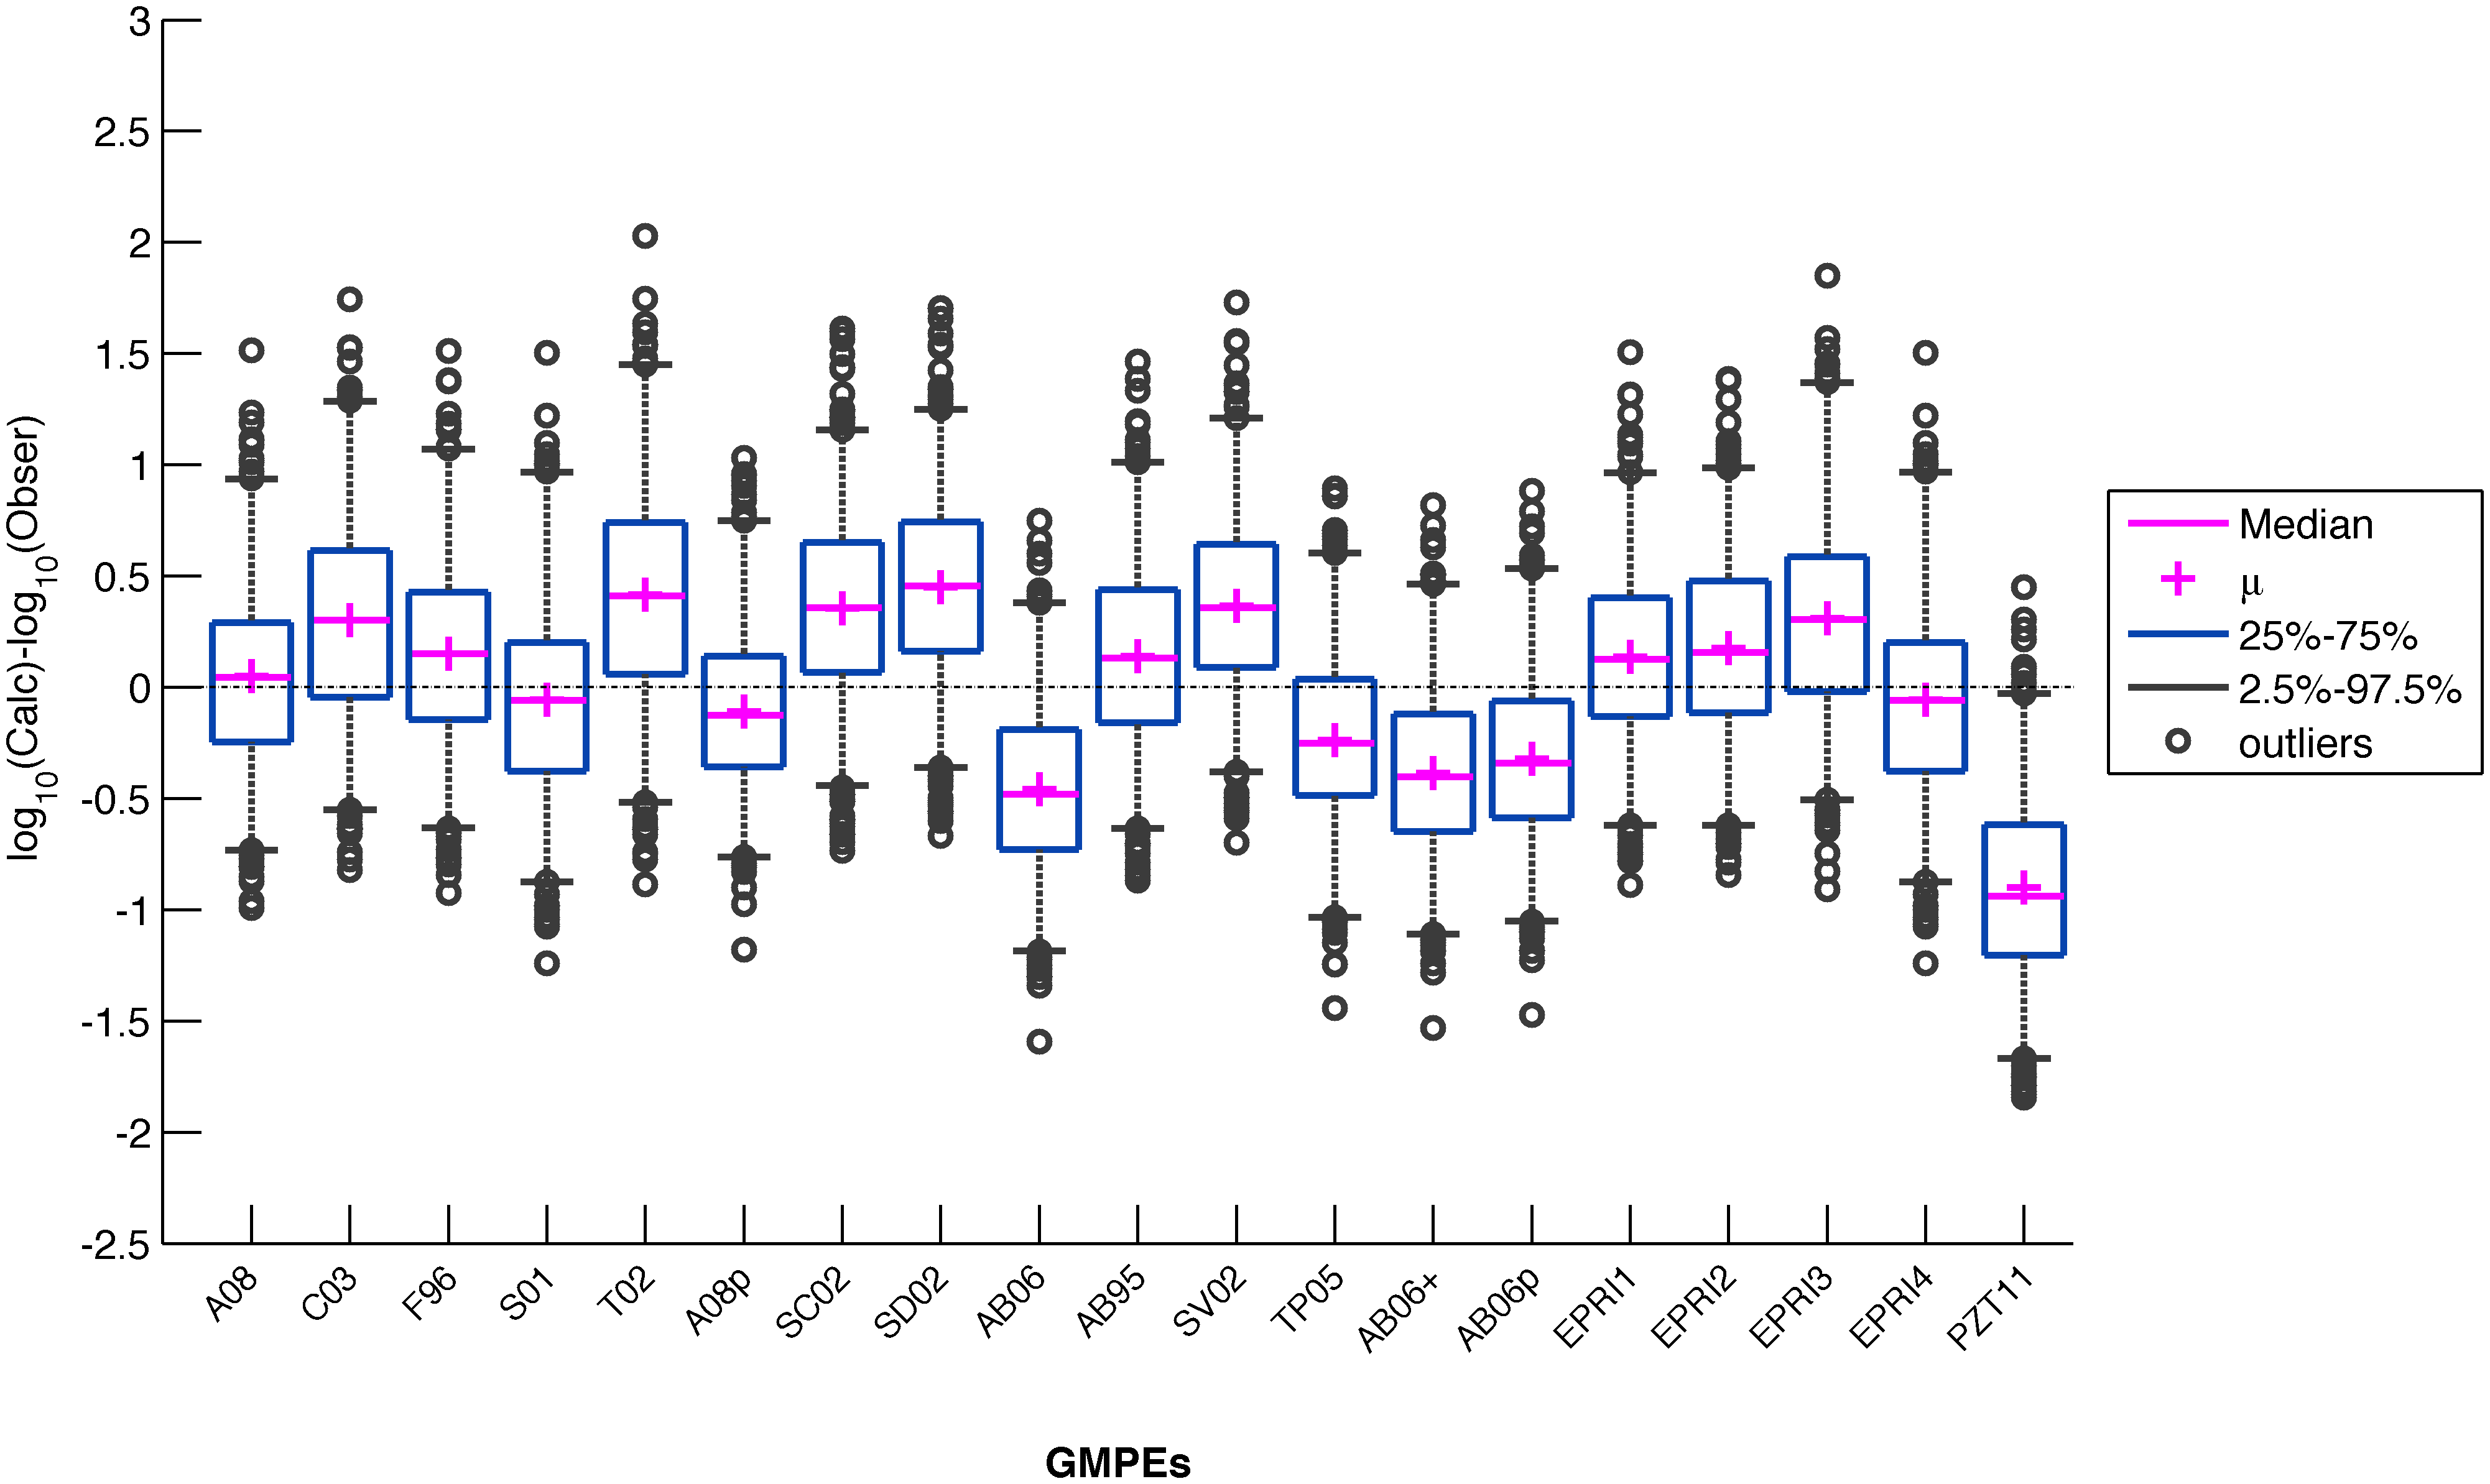
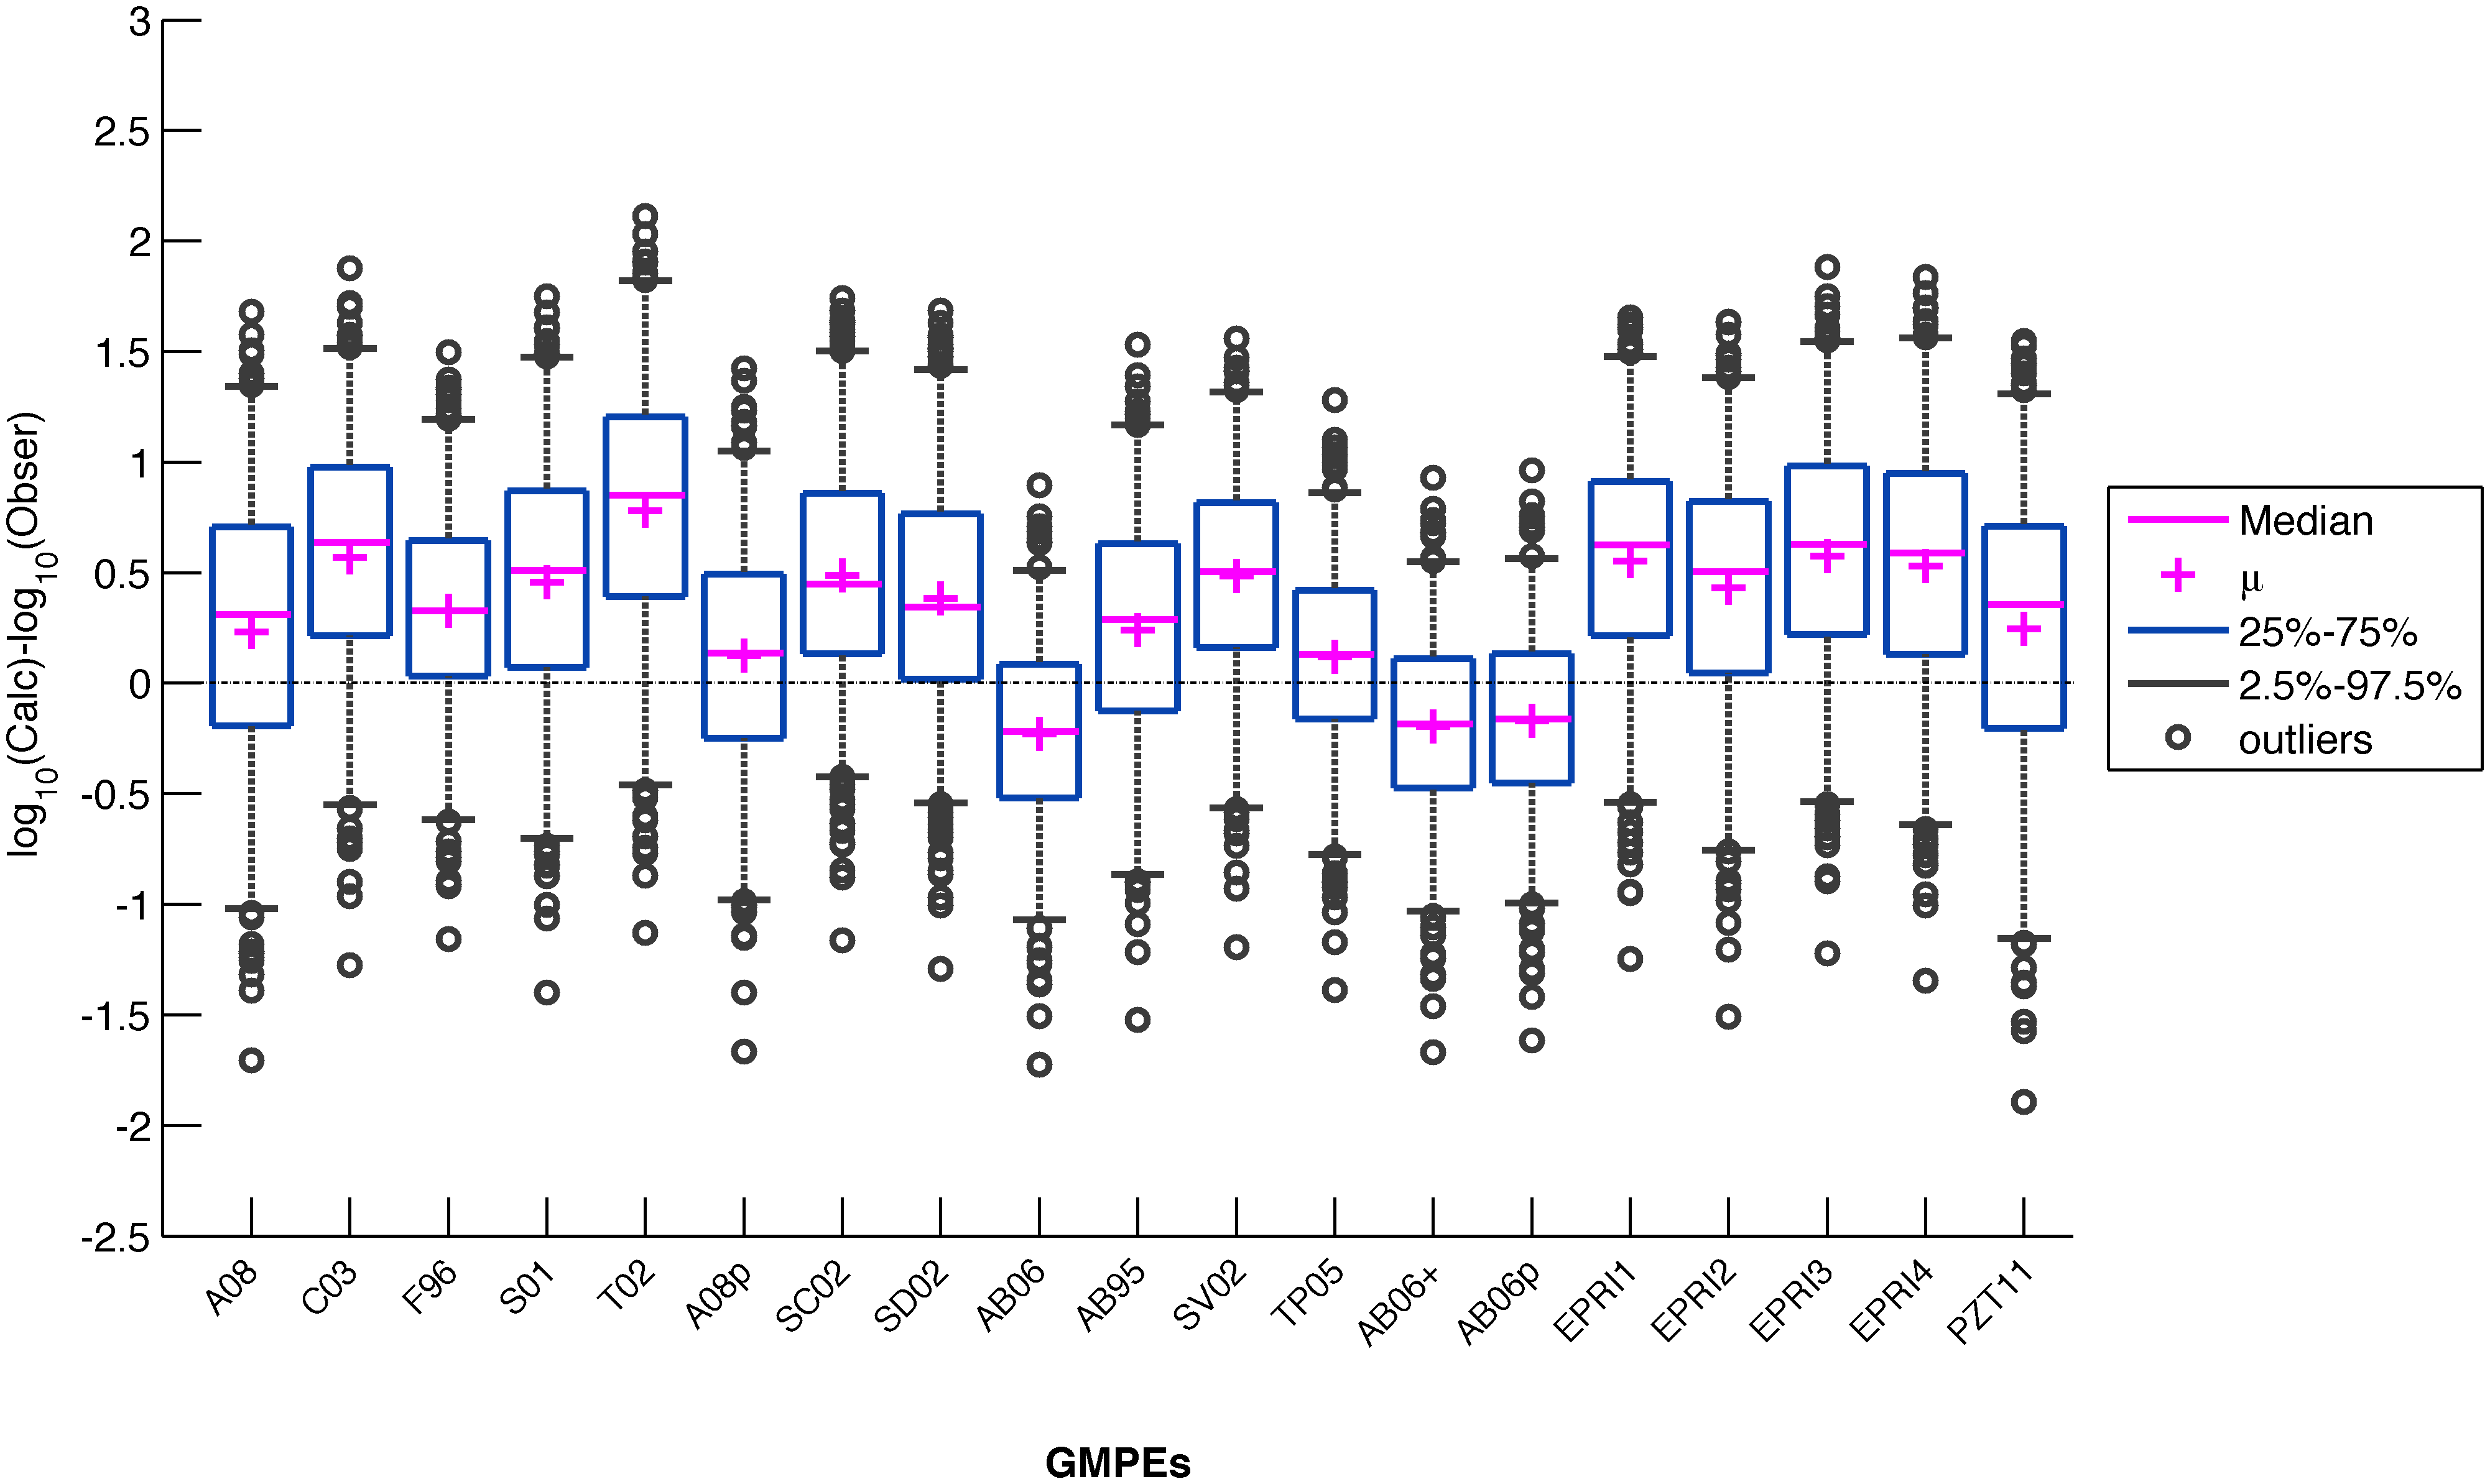
Figure S17: Boxplot of the GMPEs bias for Peak Ground Acceleration (PGA) for rock sites. Note: Positive value indicates over-prediction whereas a negative value indicates under-estimation by the model. Also the longer whisker above 75% indicates a big spread in the residual values of the top 25% of the GMPEs and vice versa. If the distribution is normal, the mean is about the same as the median and the boxplot looks symmetrical. If the distribution is skewed to the right, most values are ‘small’ with a few exceptionally large ones and the mean is greater than the median i.e., right tail is longer. If the distribution is skewed to the left, most values are ‘large’ with a few exceptionally small ones and the mean is less than the median i.e., left tail is longer.
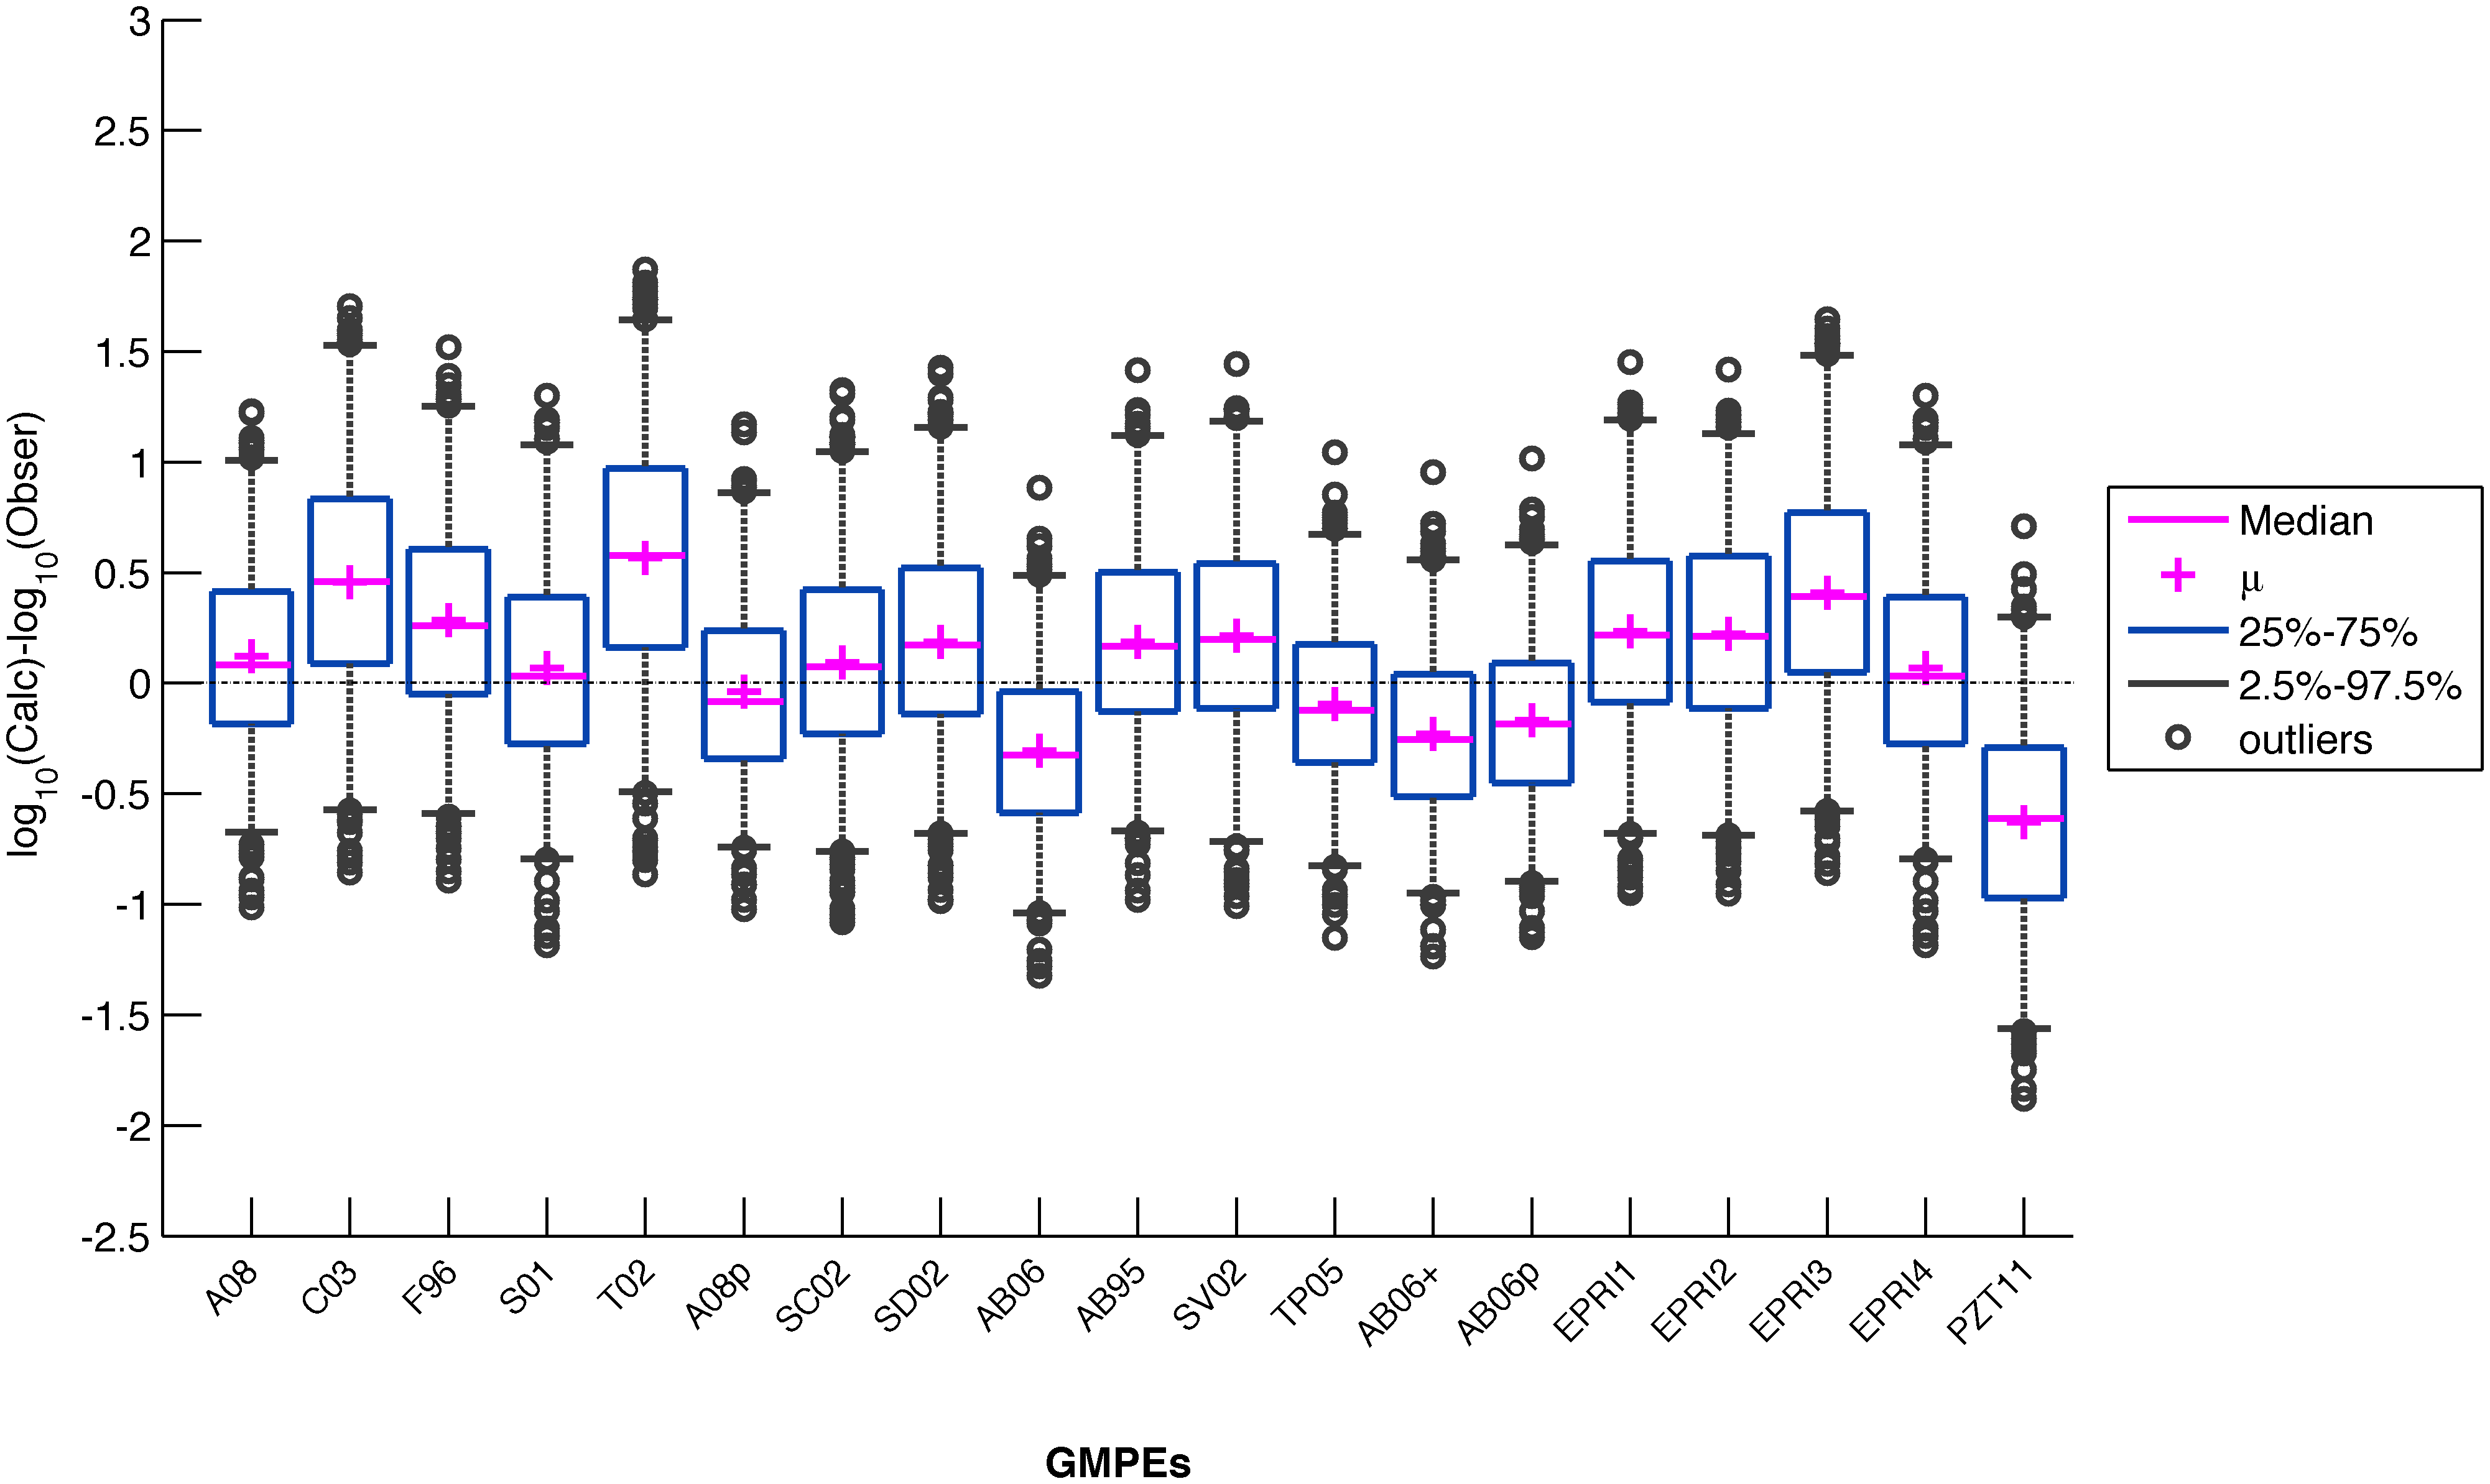
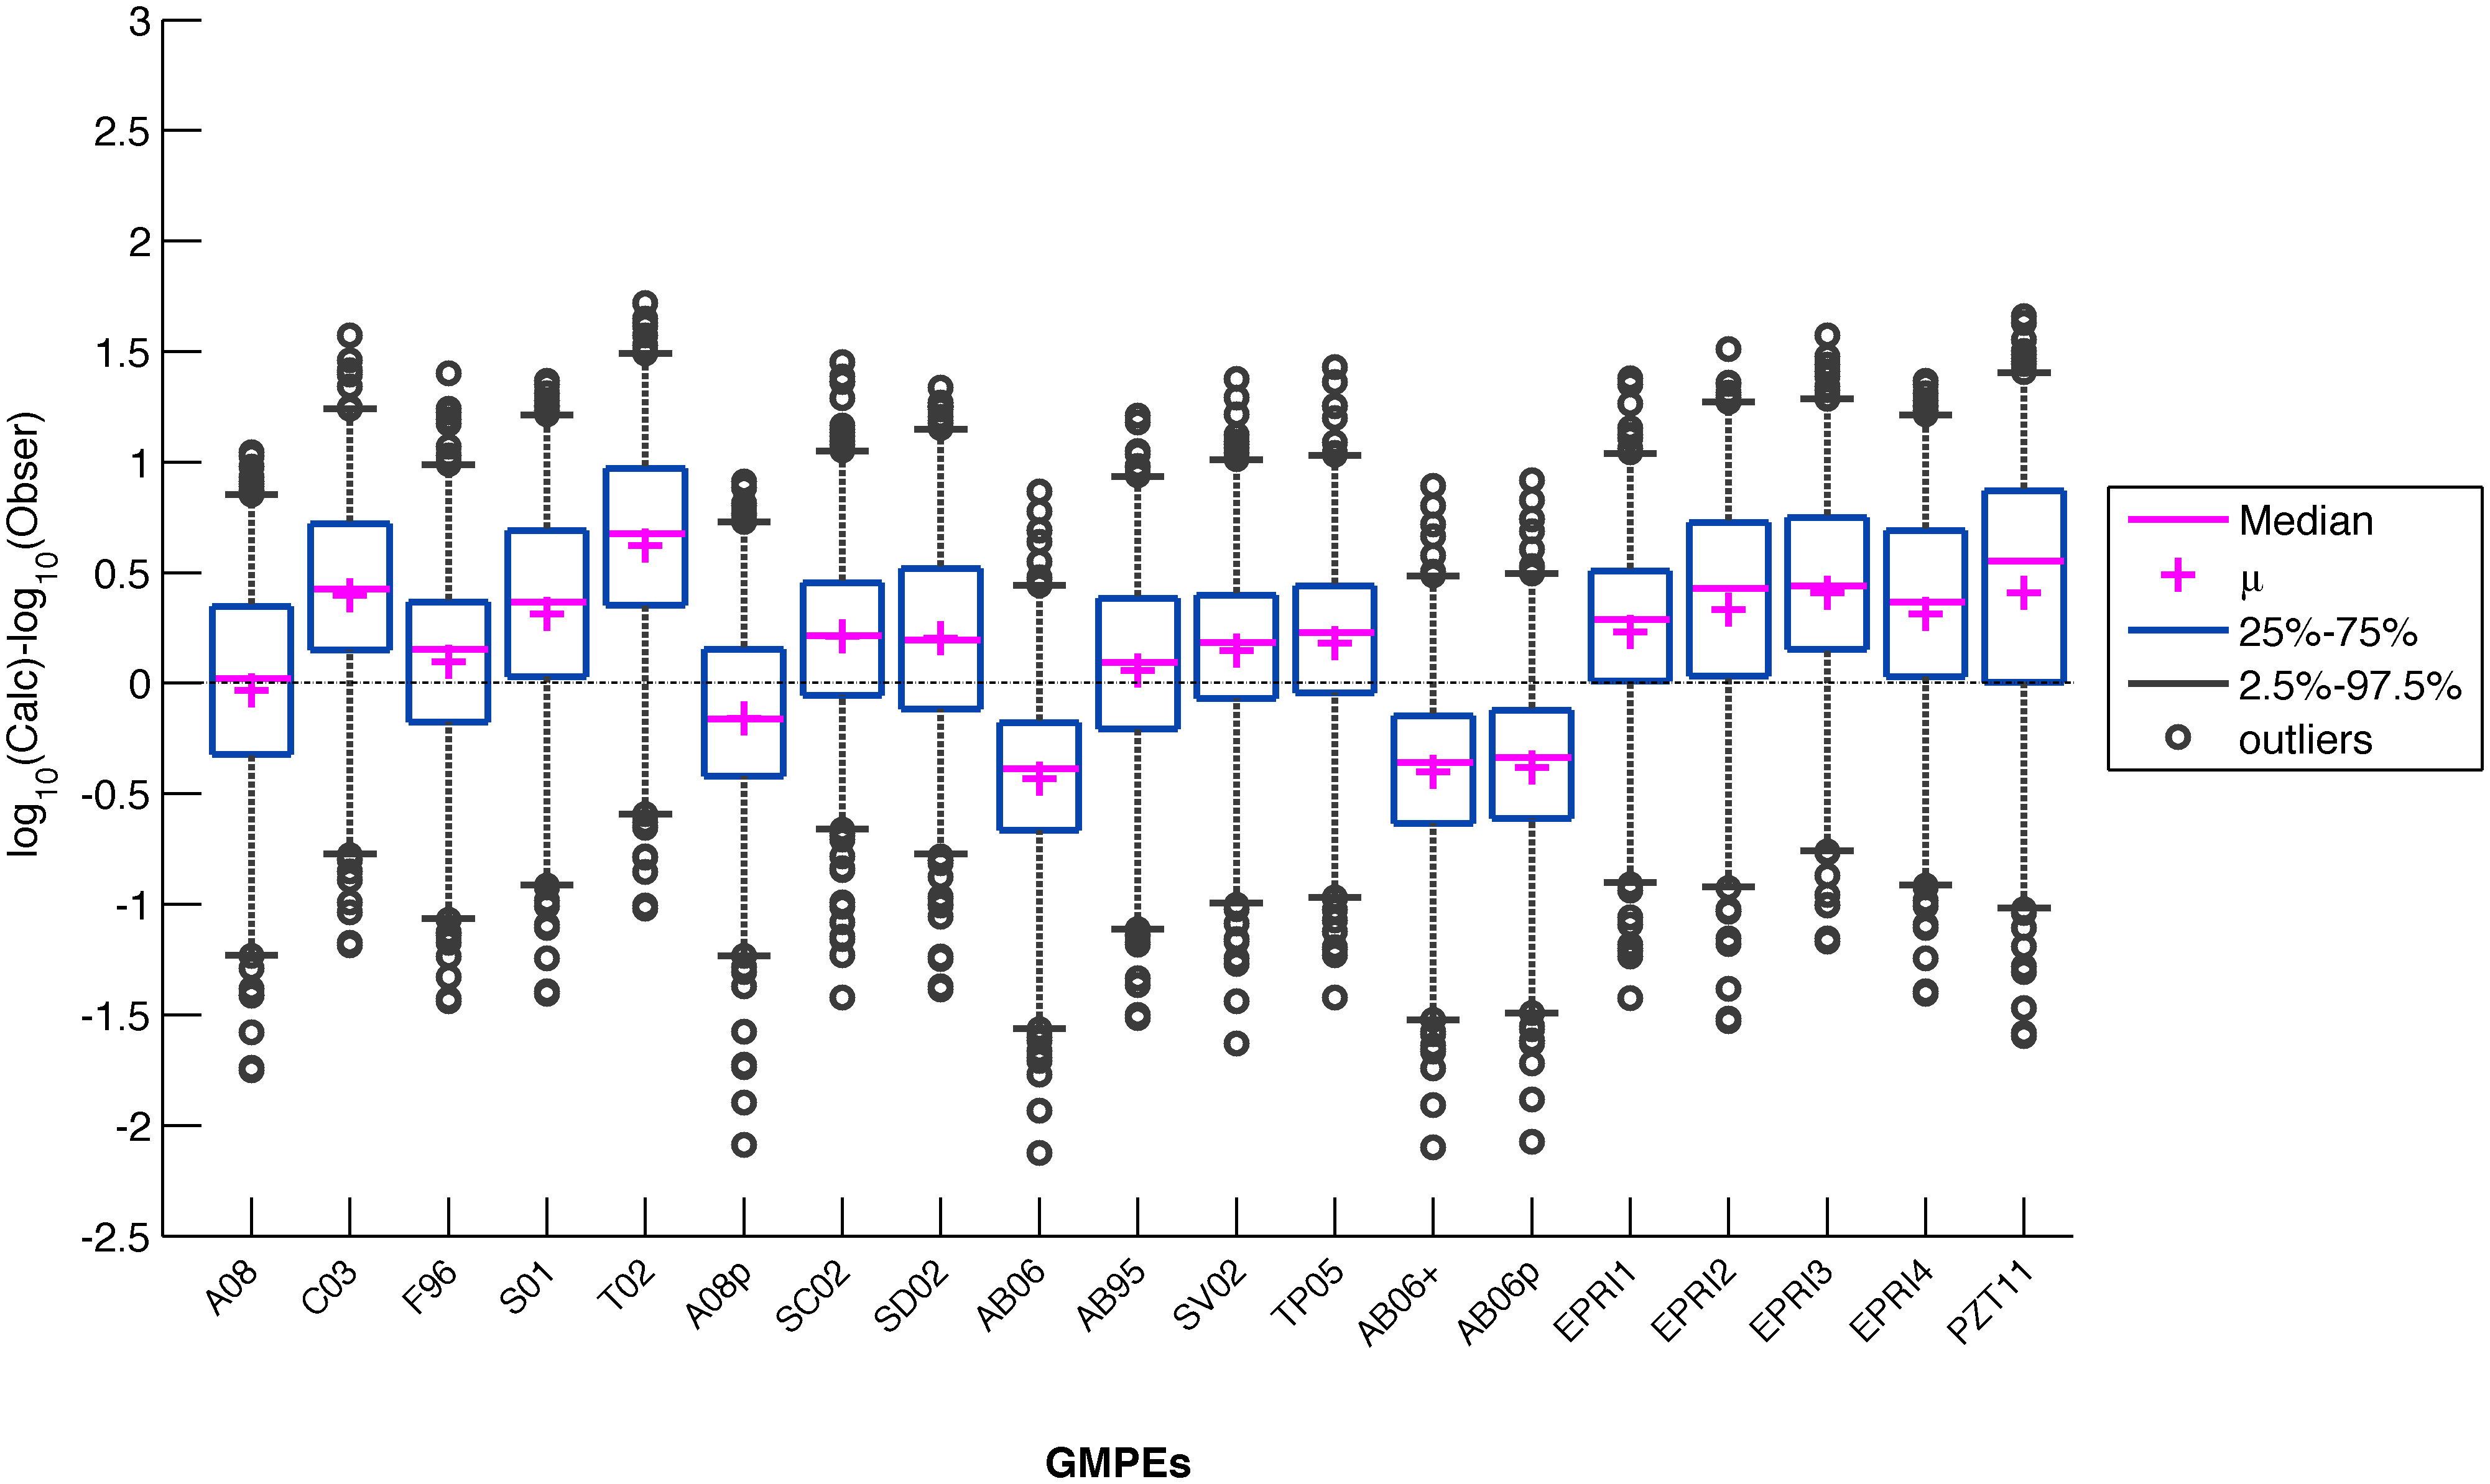
Figure S18: Boxplot of the GMPEs bias for rock sites at 0.1 s
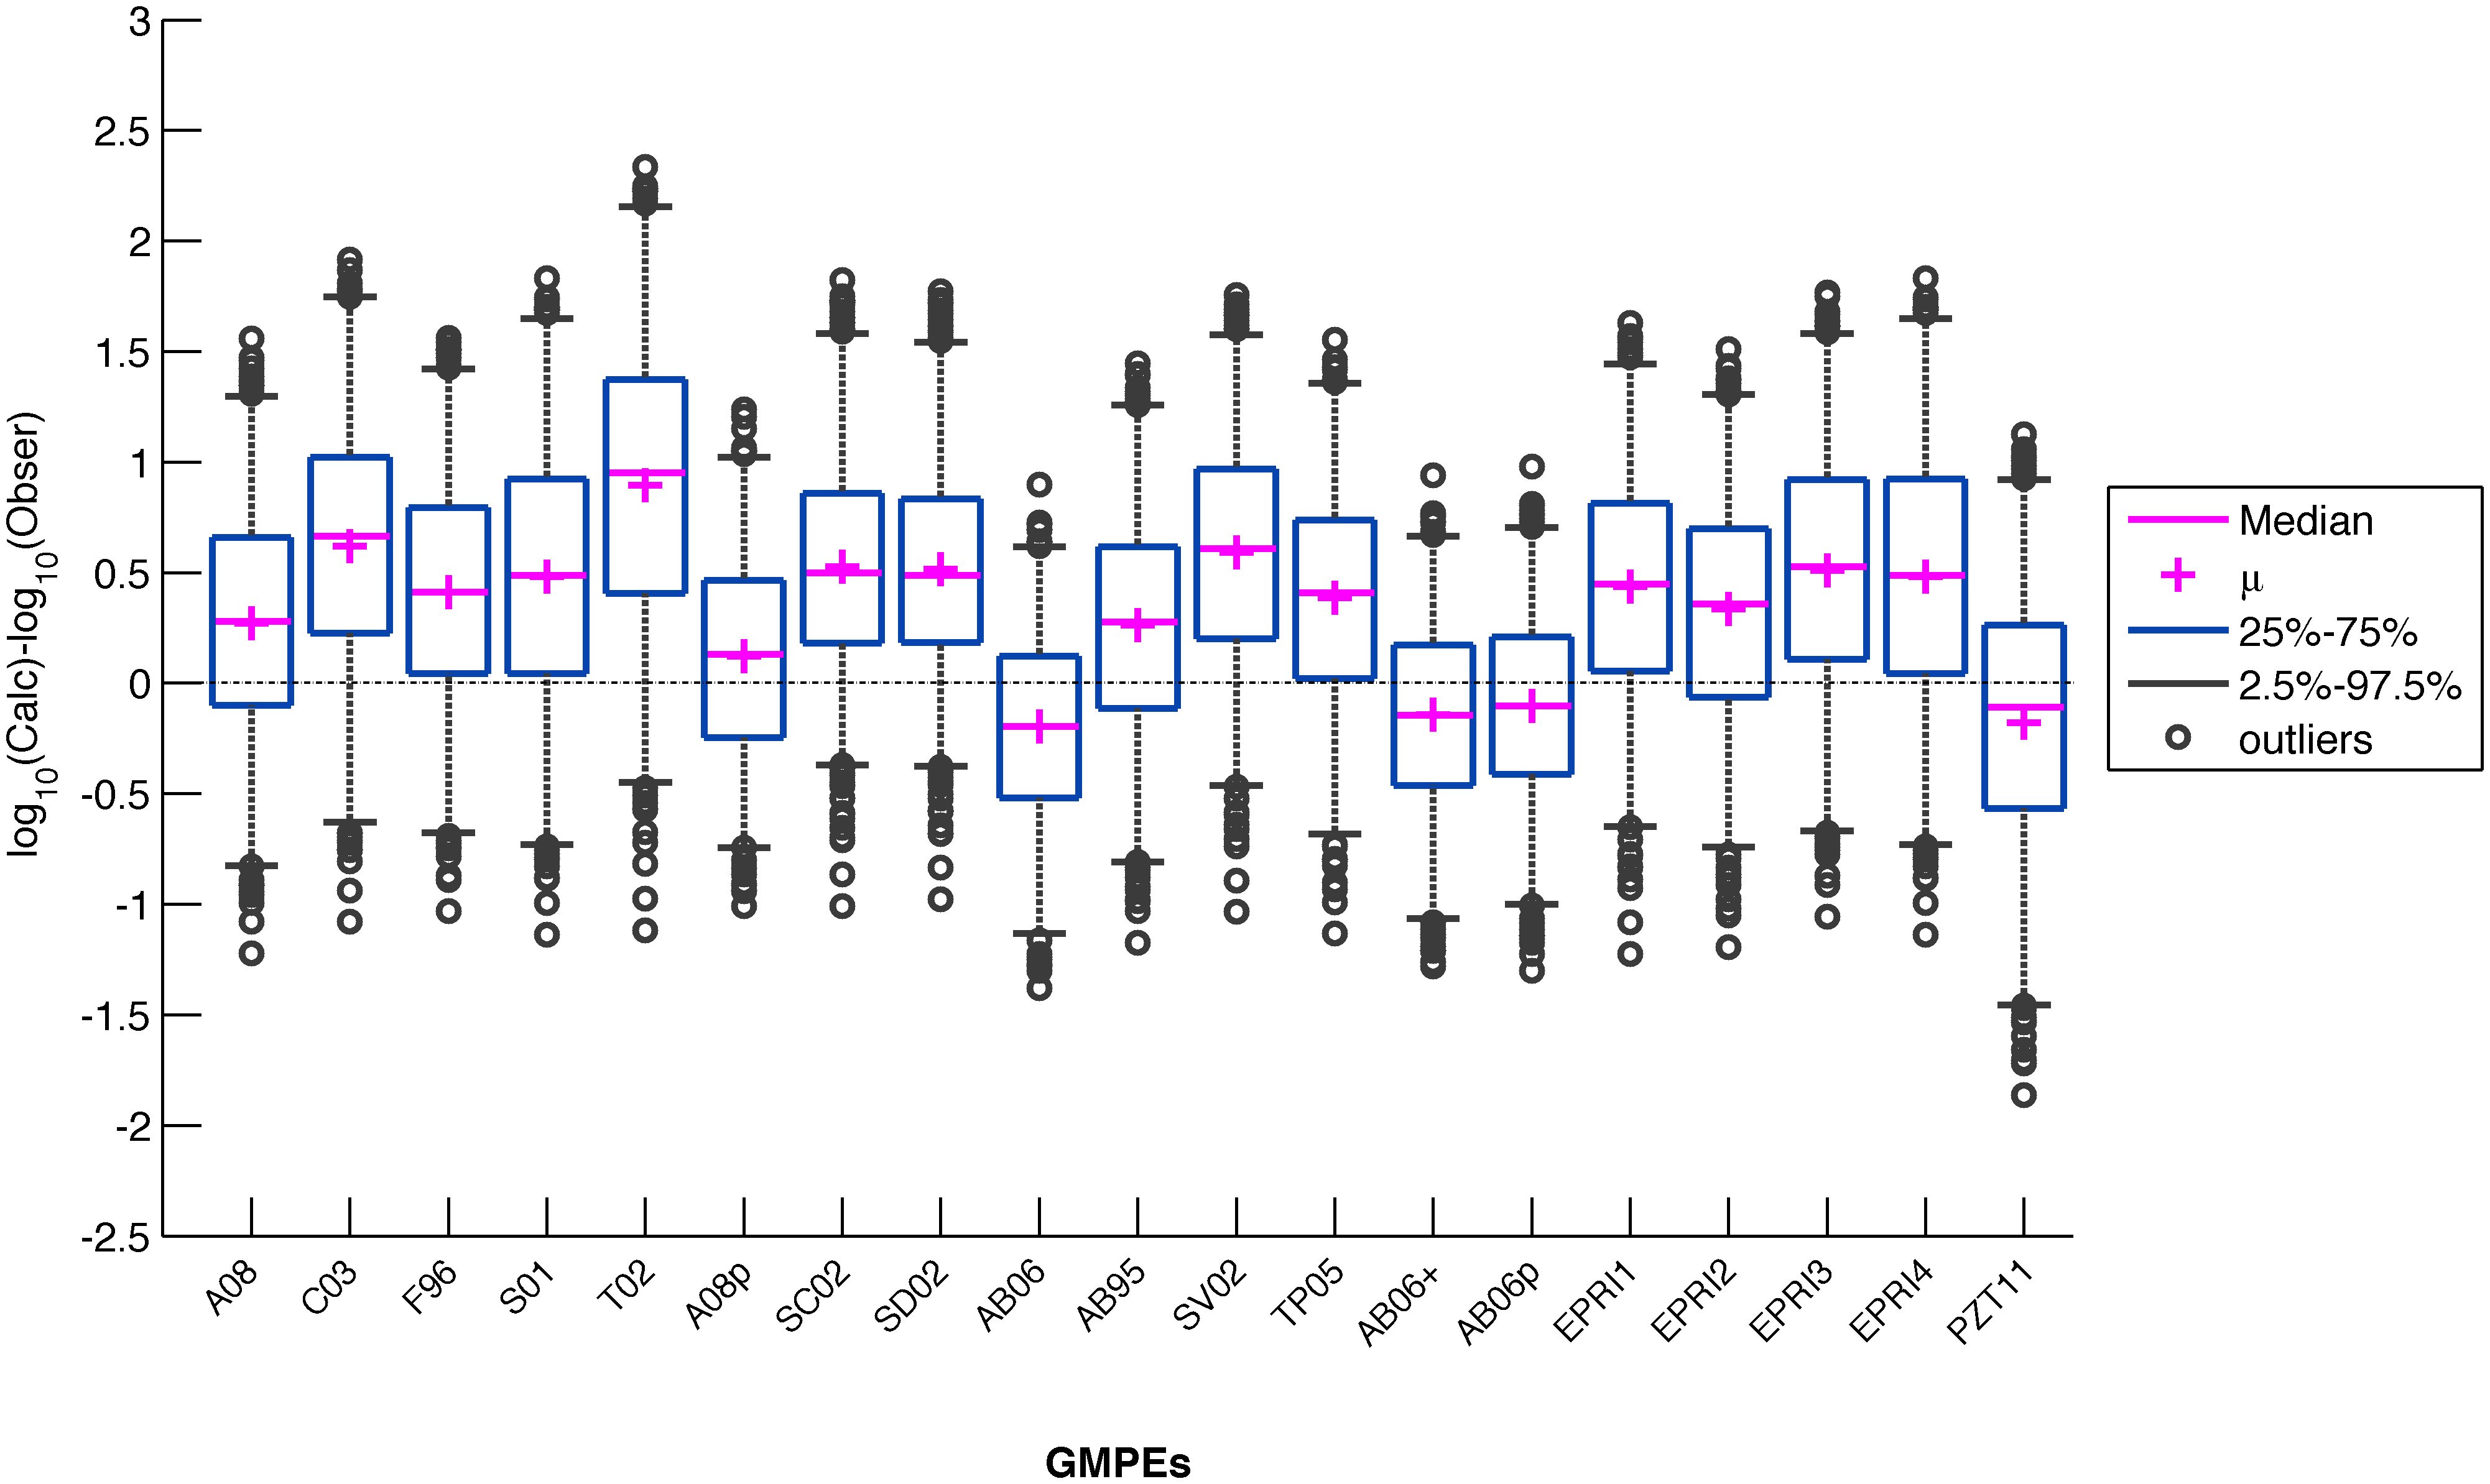
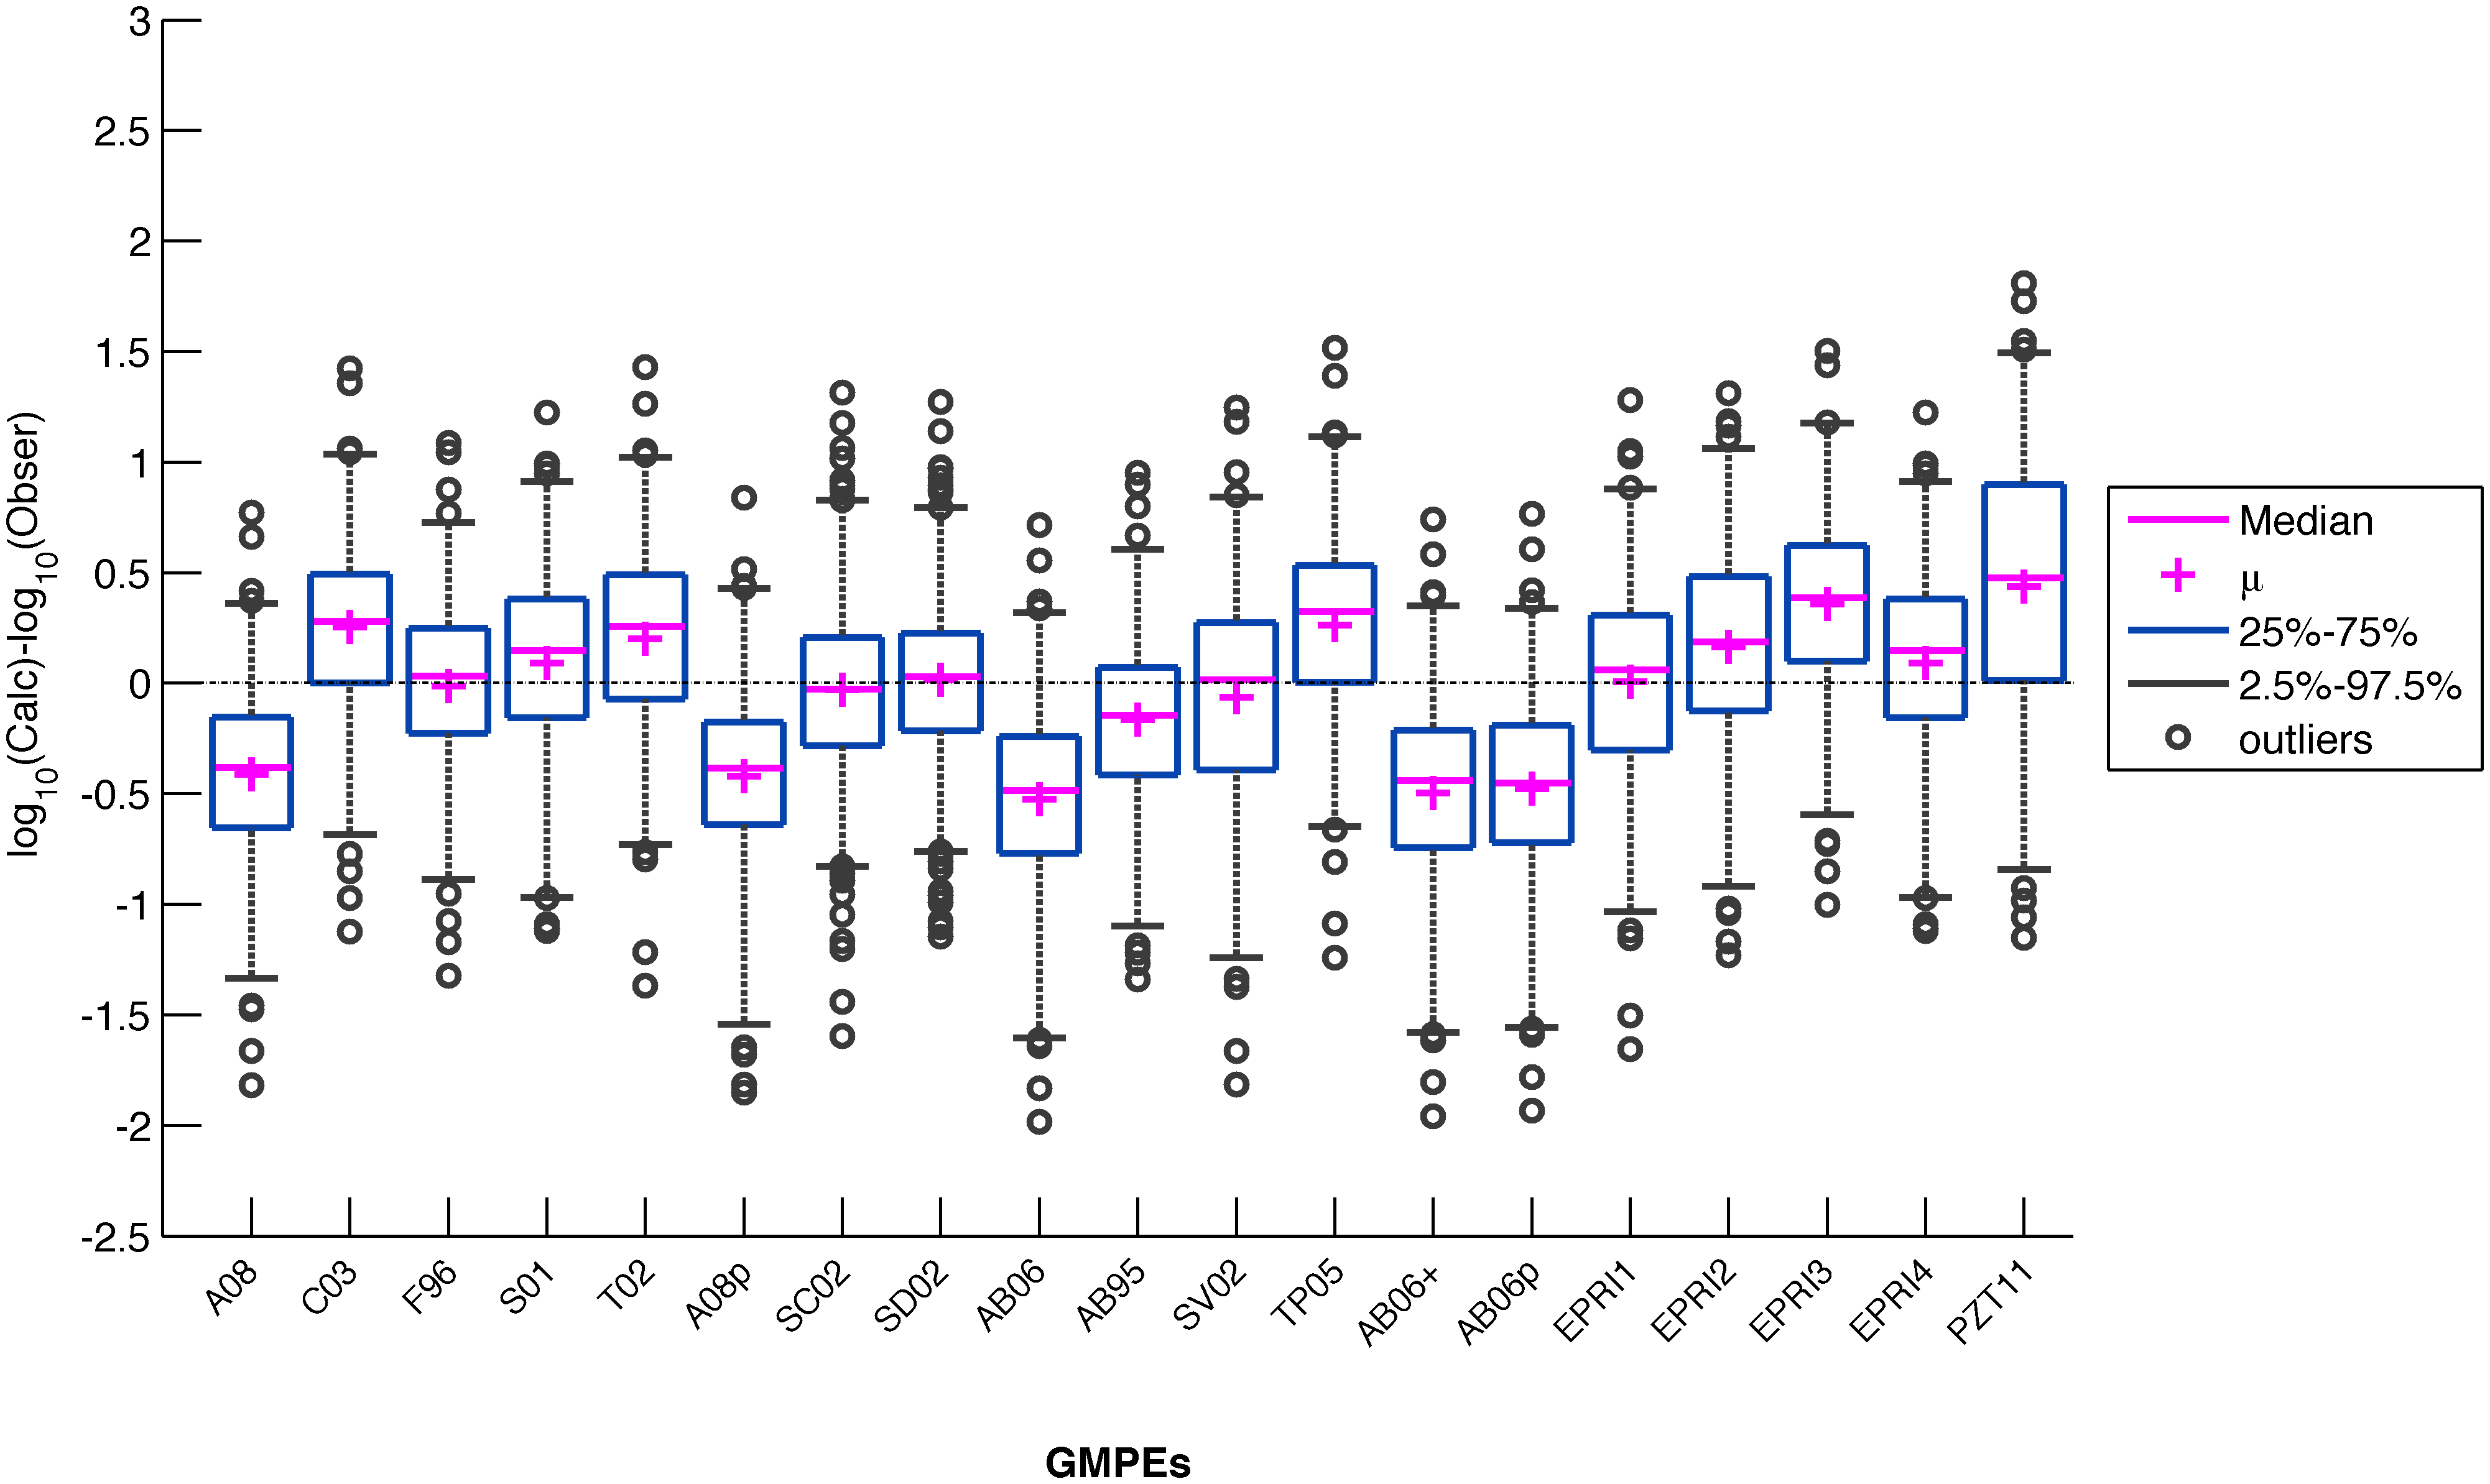
Figure S19: Boxplot of the GMPEs bias for rock sites at 0.2 s
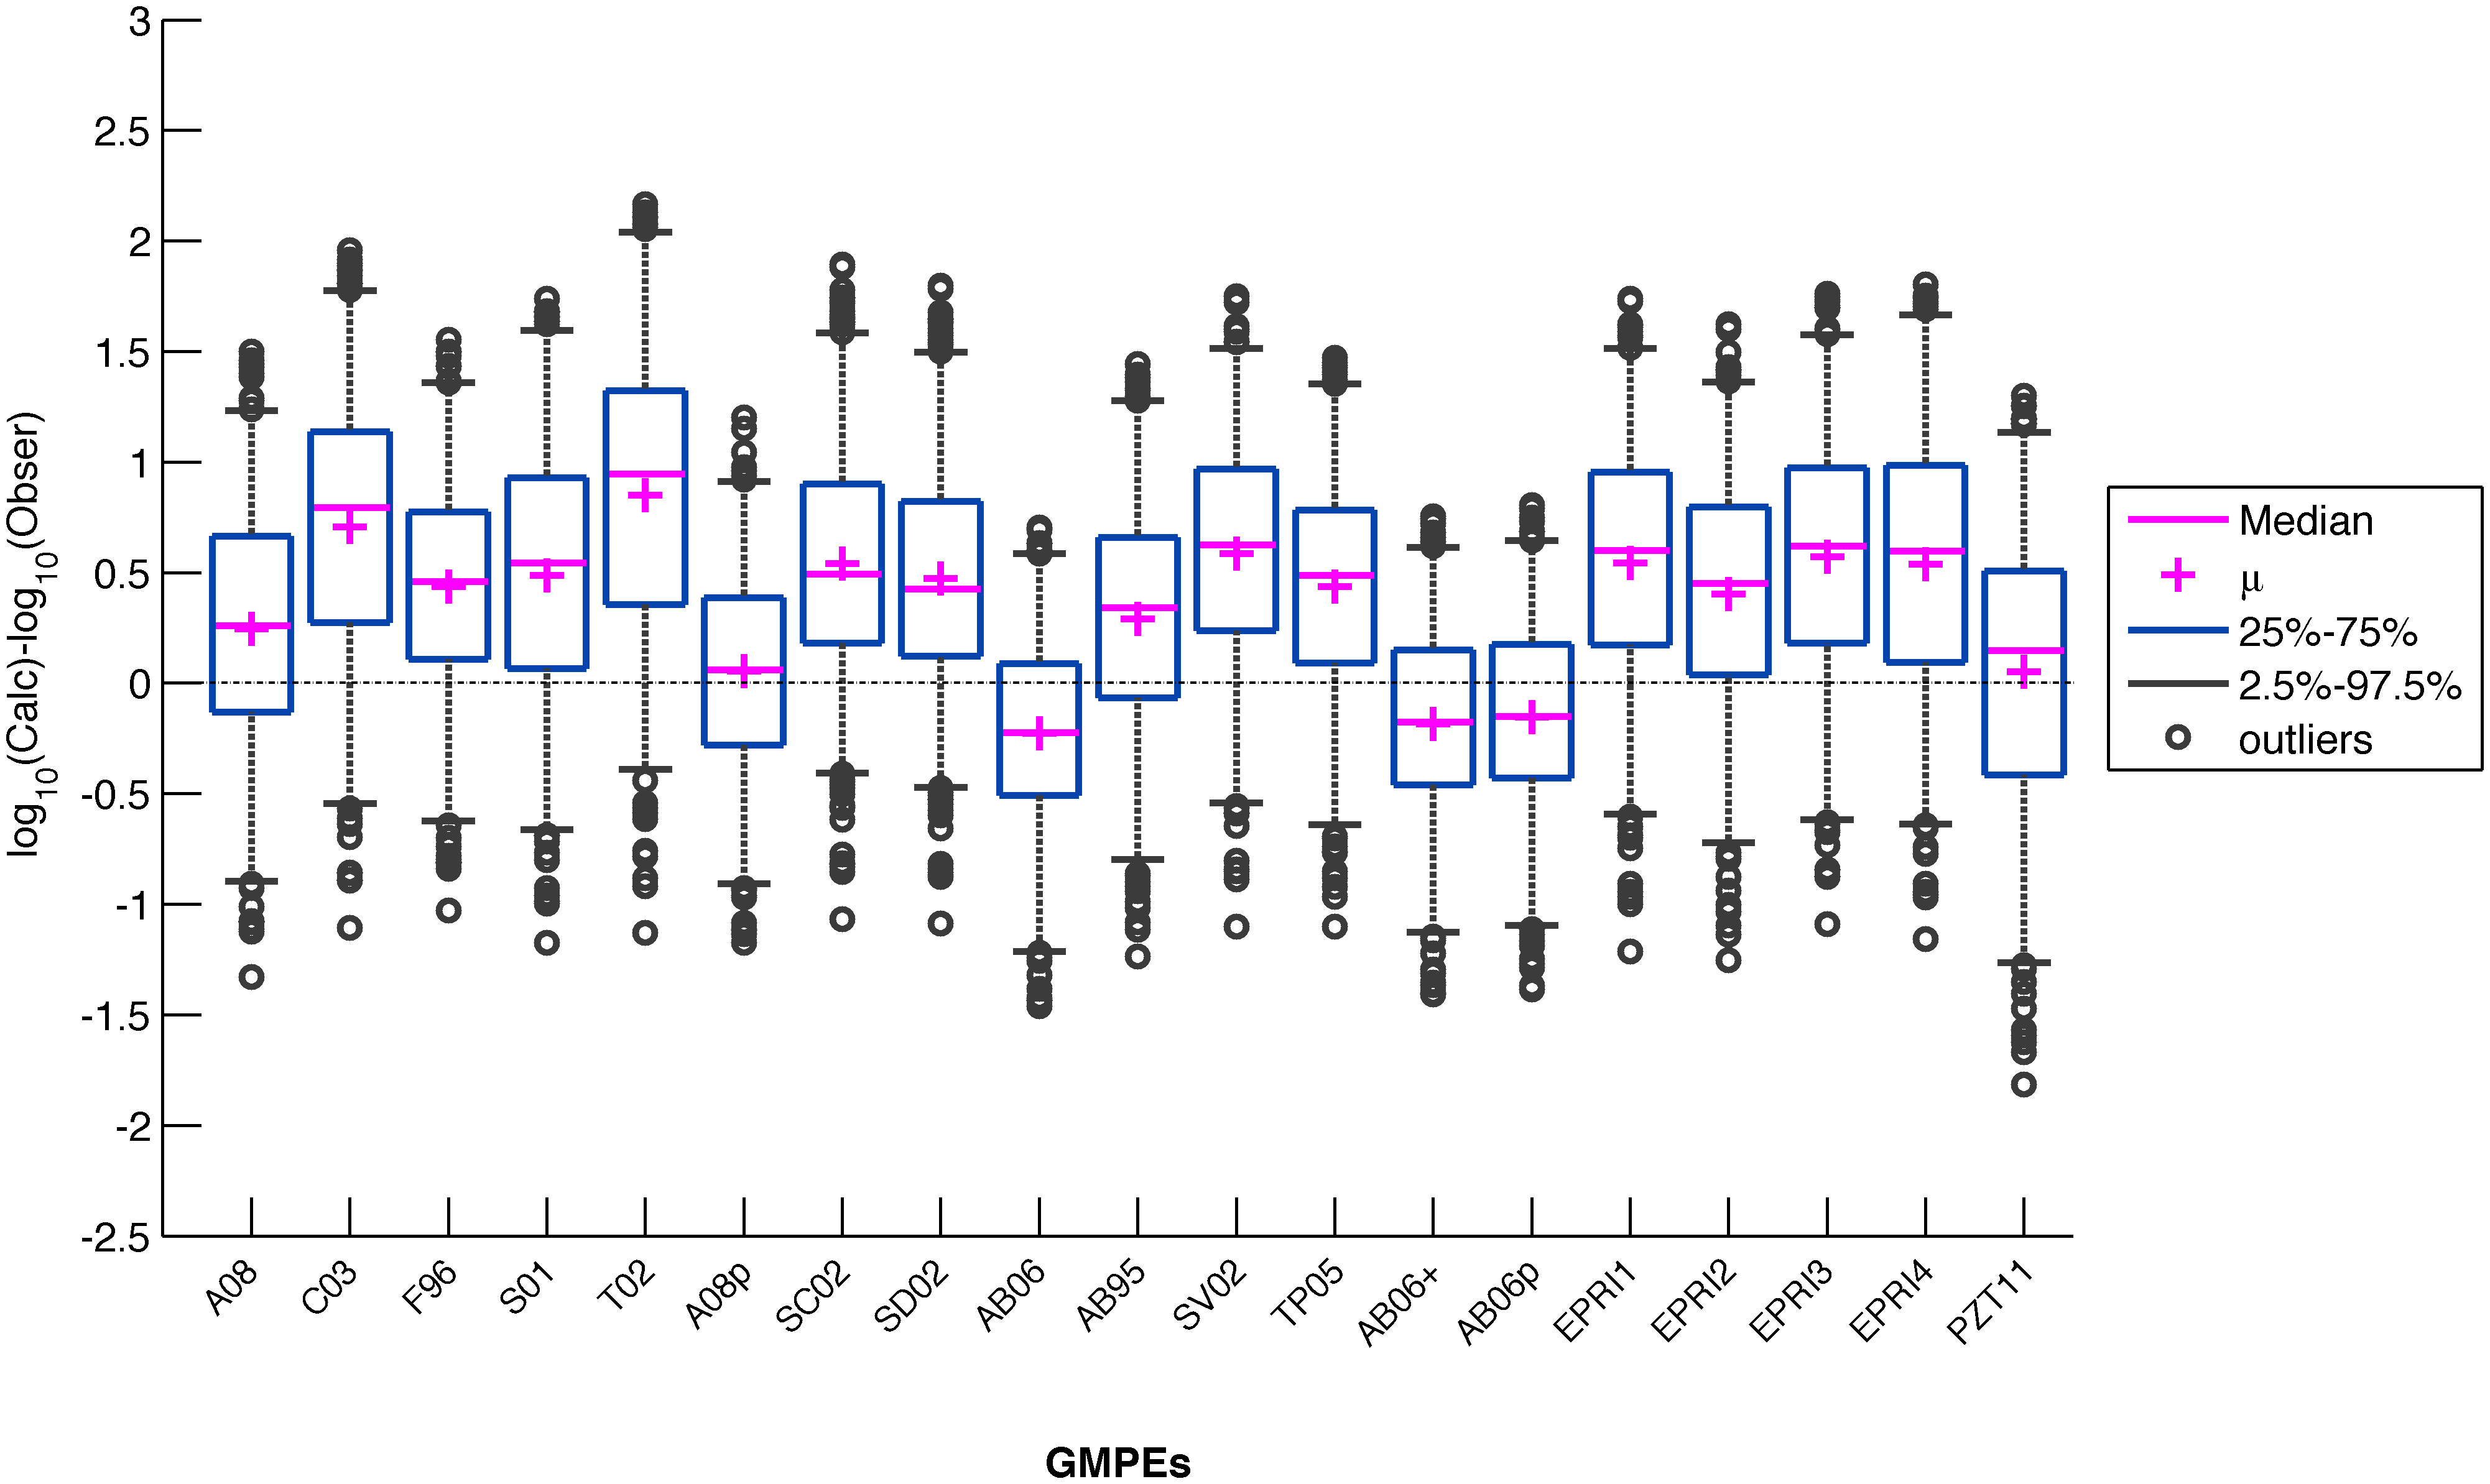
Figure S20: Boxplot of the GMPEs bias for rock sites at 0.3 s
Figure S21: Boxplot of the GMPEs bias for rock sites at 0.5 s
Figure S22: Boxplot of the GMPEs bias for rock sites at 1.0 s
Figure S23: Boxplot of the GMPEs bias for rock sites at 2.0 s
Atkinson G.M., (2008). Ground motion prediction equations for eastern North America from a referenced empirical approach: Implications for epistemic uncertainty, Bull. Seismol. Soc. Am., 98, 1304–1318.
Atkinson G., and D. Boore (1995). New ground motion relations for eastern North America. Bull. Seismol. Soc. Am., 85, 17–30.
Atkinson G., and D. Boore (2006). Earthquake ground motion prediction equations for eastern North America, Bull. Seismol. Soc. Am., 96, 2181–2205.
Atkinson, G. M., and D. M. Boore (2011). Modifications to existing ground-motion prediction equations in light of new data, Bull. Seismol. Soc. Am. 101, 1121–1135, doi: 10.1785/0120100270.
Campbell, K. W. (2003). Prediction of strong ground motion using the hybrid empirical method and its use in the development of ground motion (attenuation) relations in eastern North America, Bull. Seismol. Soc. Am. 93, 1012–1033.
Electric Power Research Institute (2004). CEUS Ground Motion Project, Final Report, 1009684, Electric Power Research Institute, Palo Alto, California.
Frankel, A., C. Mueller, T. Barnhard, D. Perkins, E. Leyendecker, N. Dickman, S.Hanson, and M. Hopper, (1996). National seismic hazard maps: documentation June 1996, U.S. Geol. Surv. Open-File Rept. 96–532 (available at http://earthquake.usgs.gov/hazmaps/publications/hazmapsdoc/Junedoc.pdf; last accessed October 2013).
Petersen, M. D., A. D. Frankel, S. C. Harmsen, C. S. Mueller, K. M. Haller, R. L. Wheeler, R. L. Wesson, Y. Zeng, O. Boyd, D. M. Perkins, N. Luco, E. H. Field, C. J. Wills, and K. S. Rukstales (2008), Documentation for the 2008 update of the United States National Seismic Hazard Maps, U.S. Geol. Surv. Open-File Rept. 2008–1128, 61 pp.
Pezeshk, S., A. Zandieh, and B. Tavakoli (2011). Hybrid empirical ground motion prediction equations for eastern North America using NGA models and updated seismological parameters, Bull. Seismol. Soc. Am. 101, no. 4, 1859–1870, doi: 10.1785/0120100144.
Silva, W., N. Gregor, and R. Darragh, (2002). Development of regional hard rock attenuation relations for central and eastern North America, in Pacific Engineering and Analysis, El Cerrito, California, 57 pp.
Somerville, P., N. Collins, N. Abrahamson, R. Graves, and C. Saikia, (2001). Ground motion attenuation relations for central and eastern United States, U.S. Geol. Surv., Final Report.
Tavakoli, B., and S. Pezeshk (2005) Empirical-stochastic ground motion prediction equations for eastern North America, Bull. Seismol. Soc. Am., 95, no. 6, 2283–2296, doi: 10.1785/0120050030.
Toro, G. R., N. A. Abrahamson, and J. F. Schneider (1997). A model of strong ground motions from earthquakes in central and eastern North America: Best estimates and uncertainties, Seismol. Res. Lett. 68, no. 1, 41–57.
[ Back ]