This electronic supplement contains a summary table (Table S1) for the three sensitivity cases and tables listing estimated annualized earthquake losses (AELs) and percent annualized earthquake losses (APELs) for all California counties (Table S2), metropolitan statistical areas (MSAs; Table S3), and incorporated cities with estimated AEL greater than $1000 (Table S4). It contains distribution of AEL and APEL by census tract (Figs. S1 and S2, respectively). All results are based on sensitivity case 1, that is, using VS30 groups for site condition approximation. It also contains ArcGIS shapefiles for metropolitan statistical area and for incorporated city boundary polygons.
Table S1. Summary of site condition approximation and ground-motion amplification method used for the three sensitivity cases.
Table S2. Estimated AELs for all California counties (in alphabetic order), county AEL as a percentage of the statewide AEL, and APELs.
Table S3. Estimated AELs for MSAs, MSA AEL as a percentage of statewide AEL, and MSA APELs.
Table S4. Estimated AELs for California incorporated cities with estimated AEL greater than $1000 (in alphabetic order), city AEL as a percentage of the statewide AEL, and city APELs.
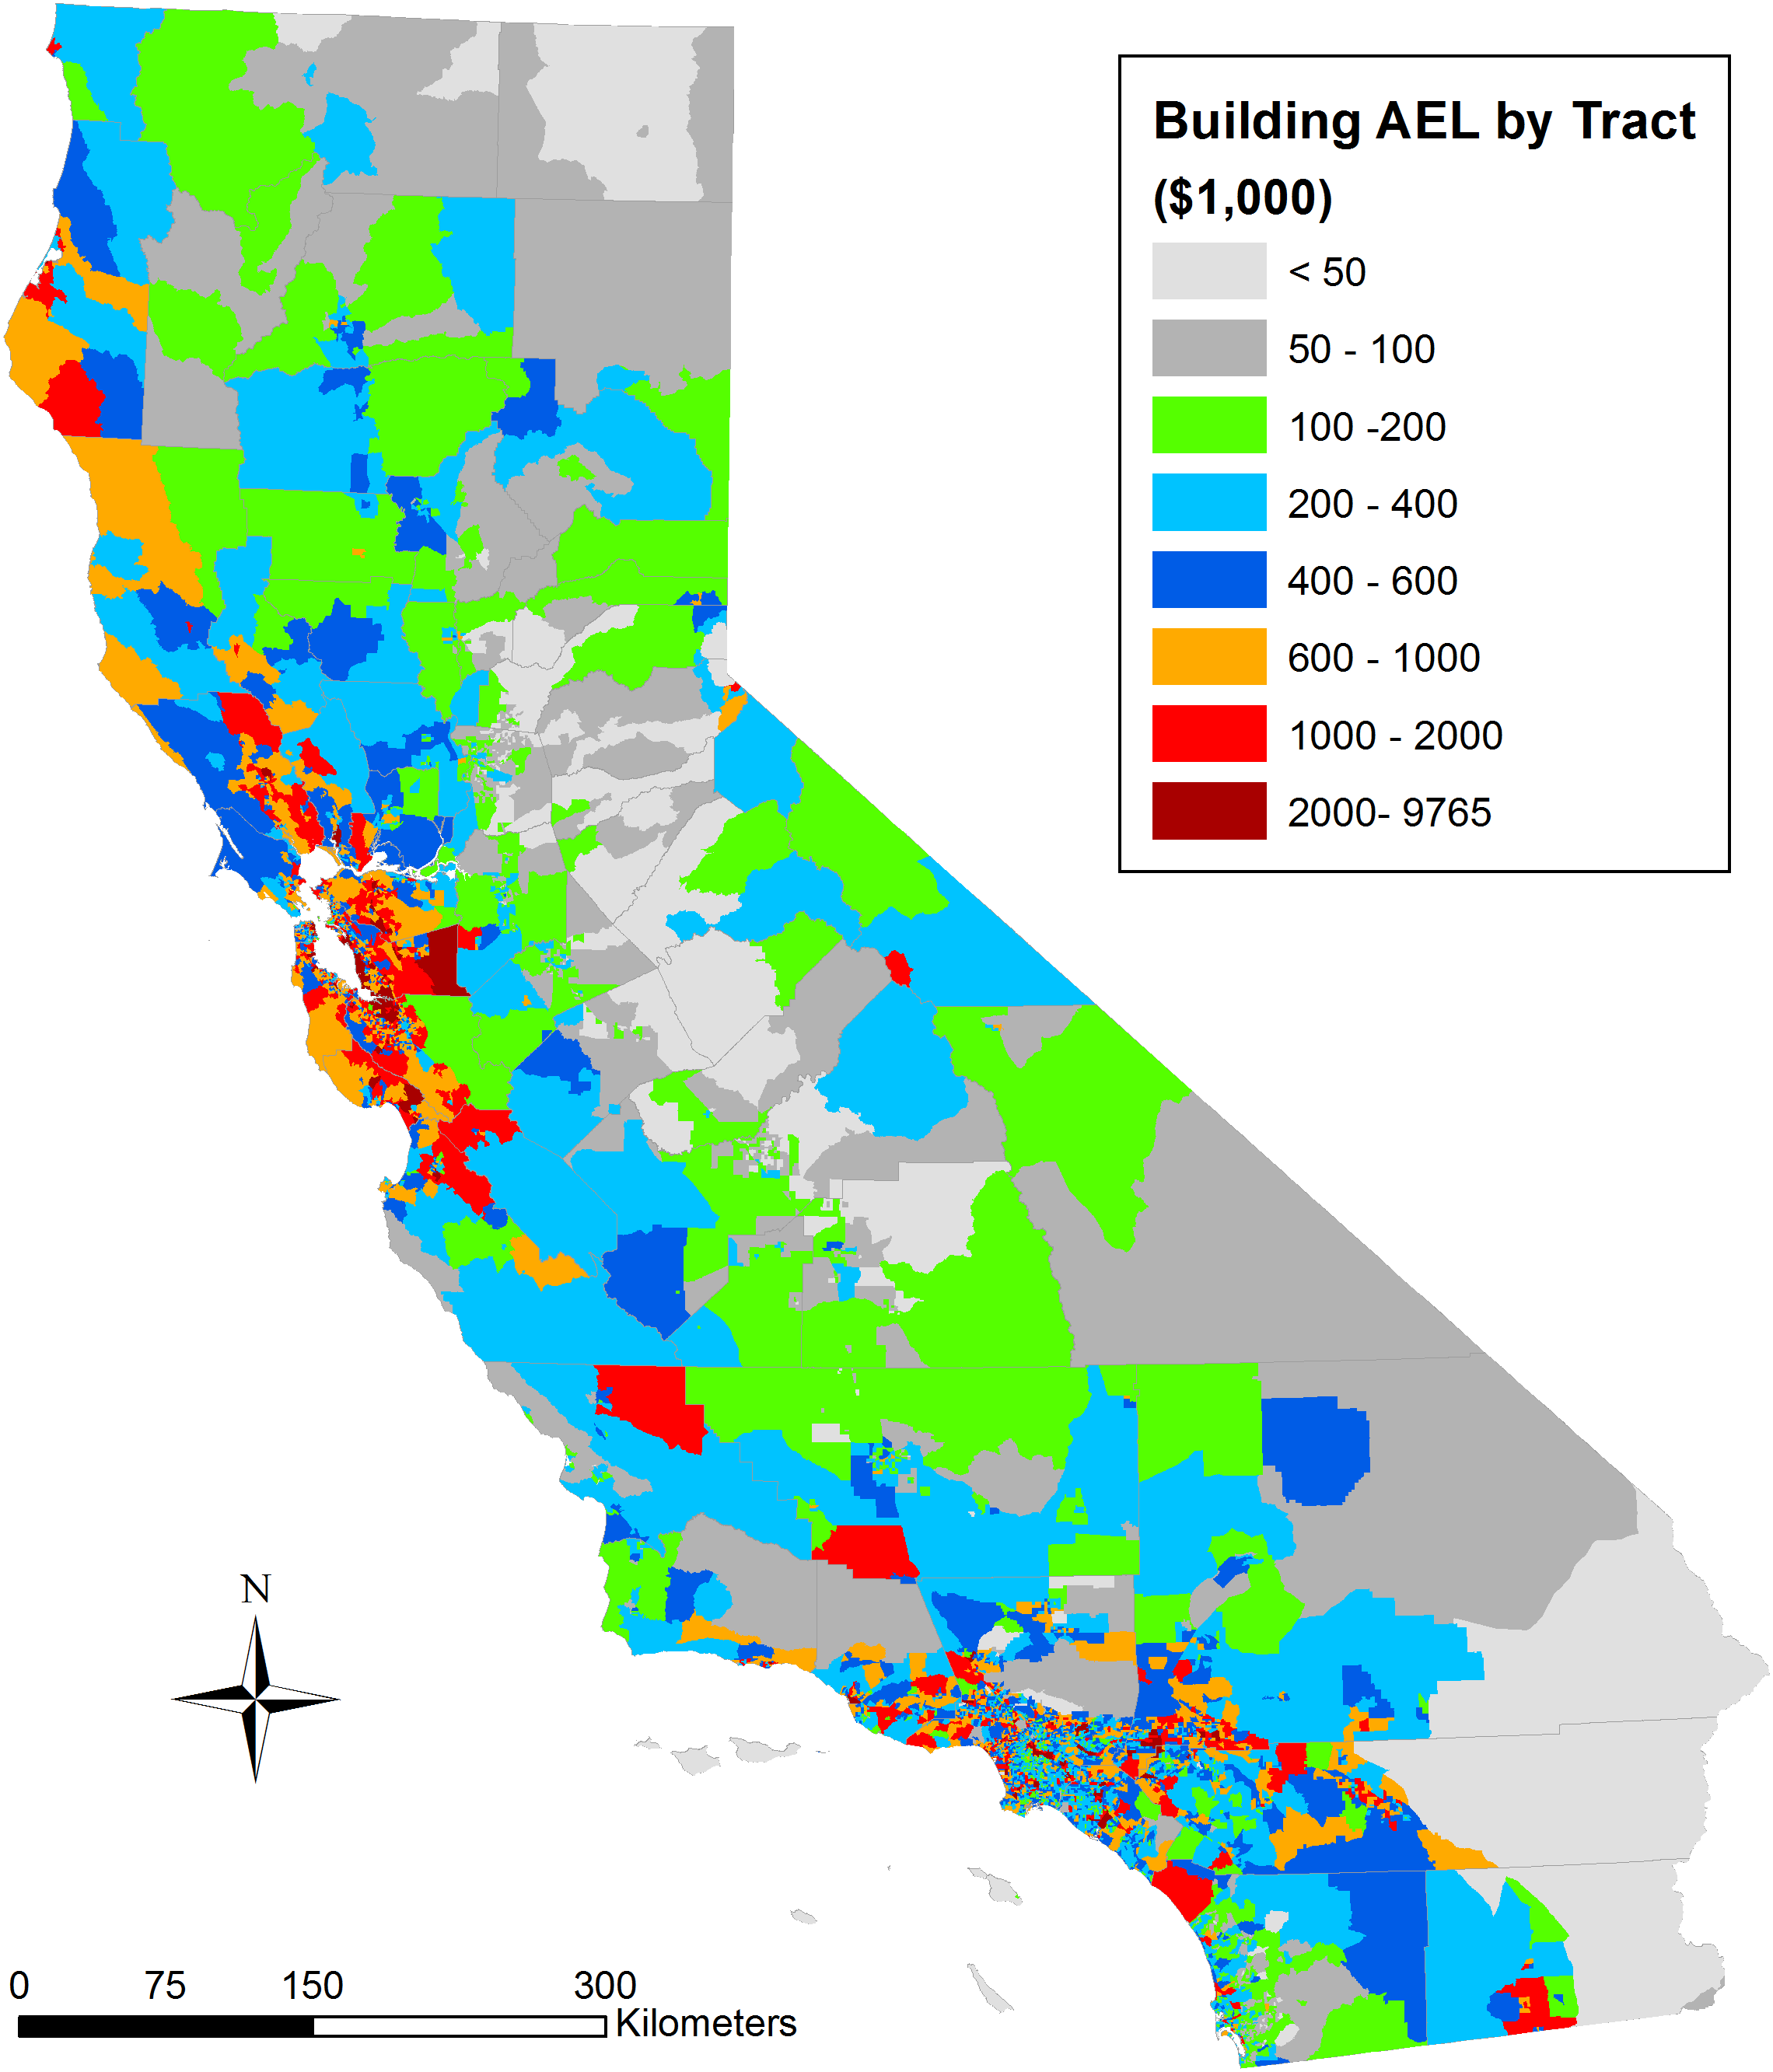
Figure S1. Distribution of building AEL in California by census tract (based on sensitivity case 1—site condition approximated using VS30 groups).
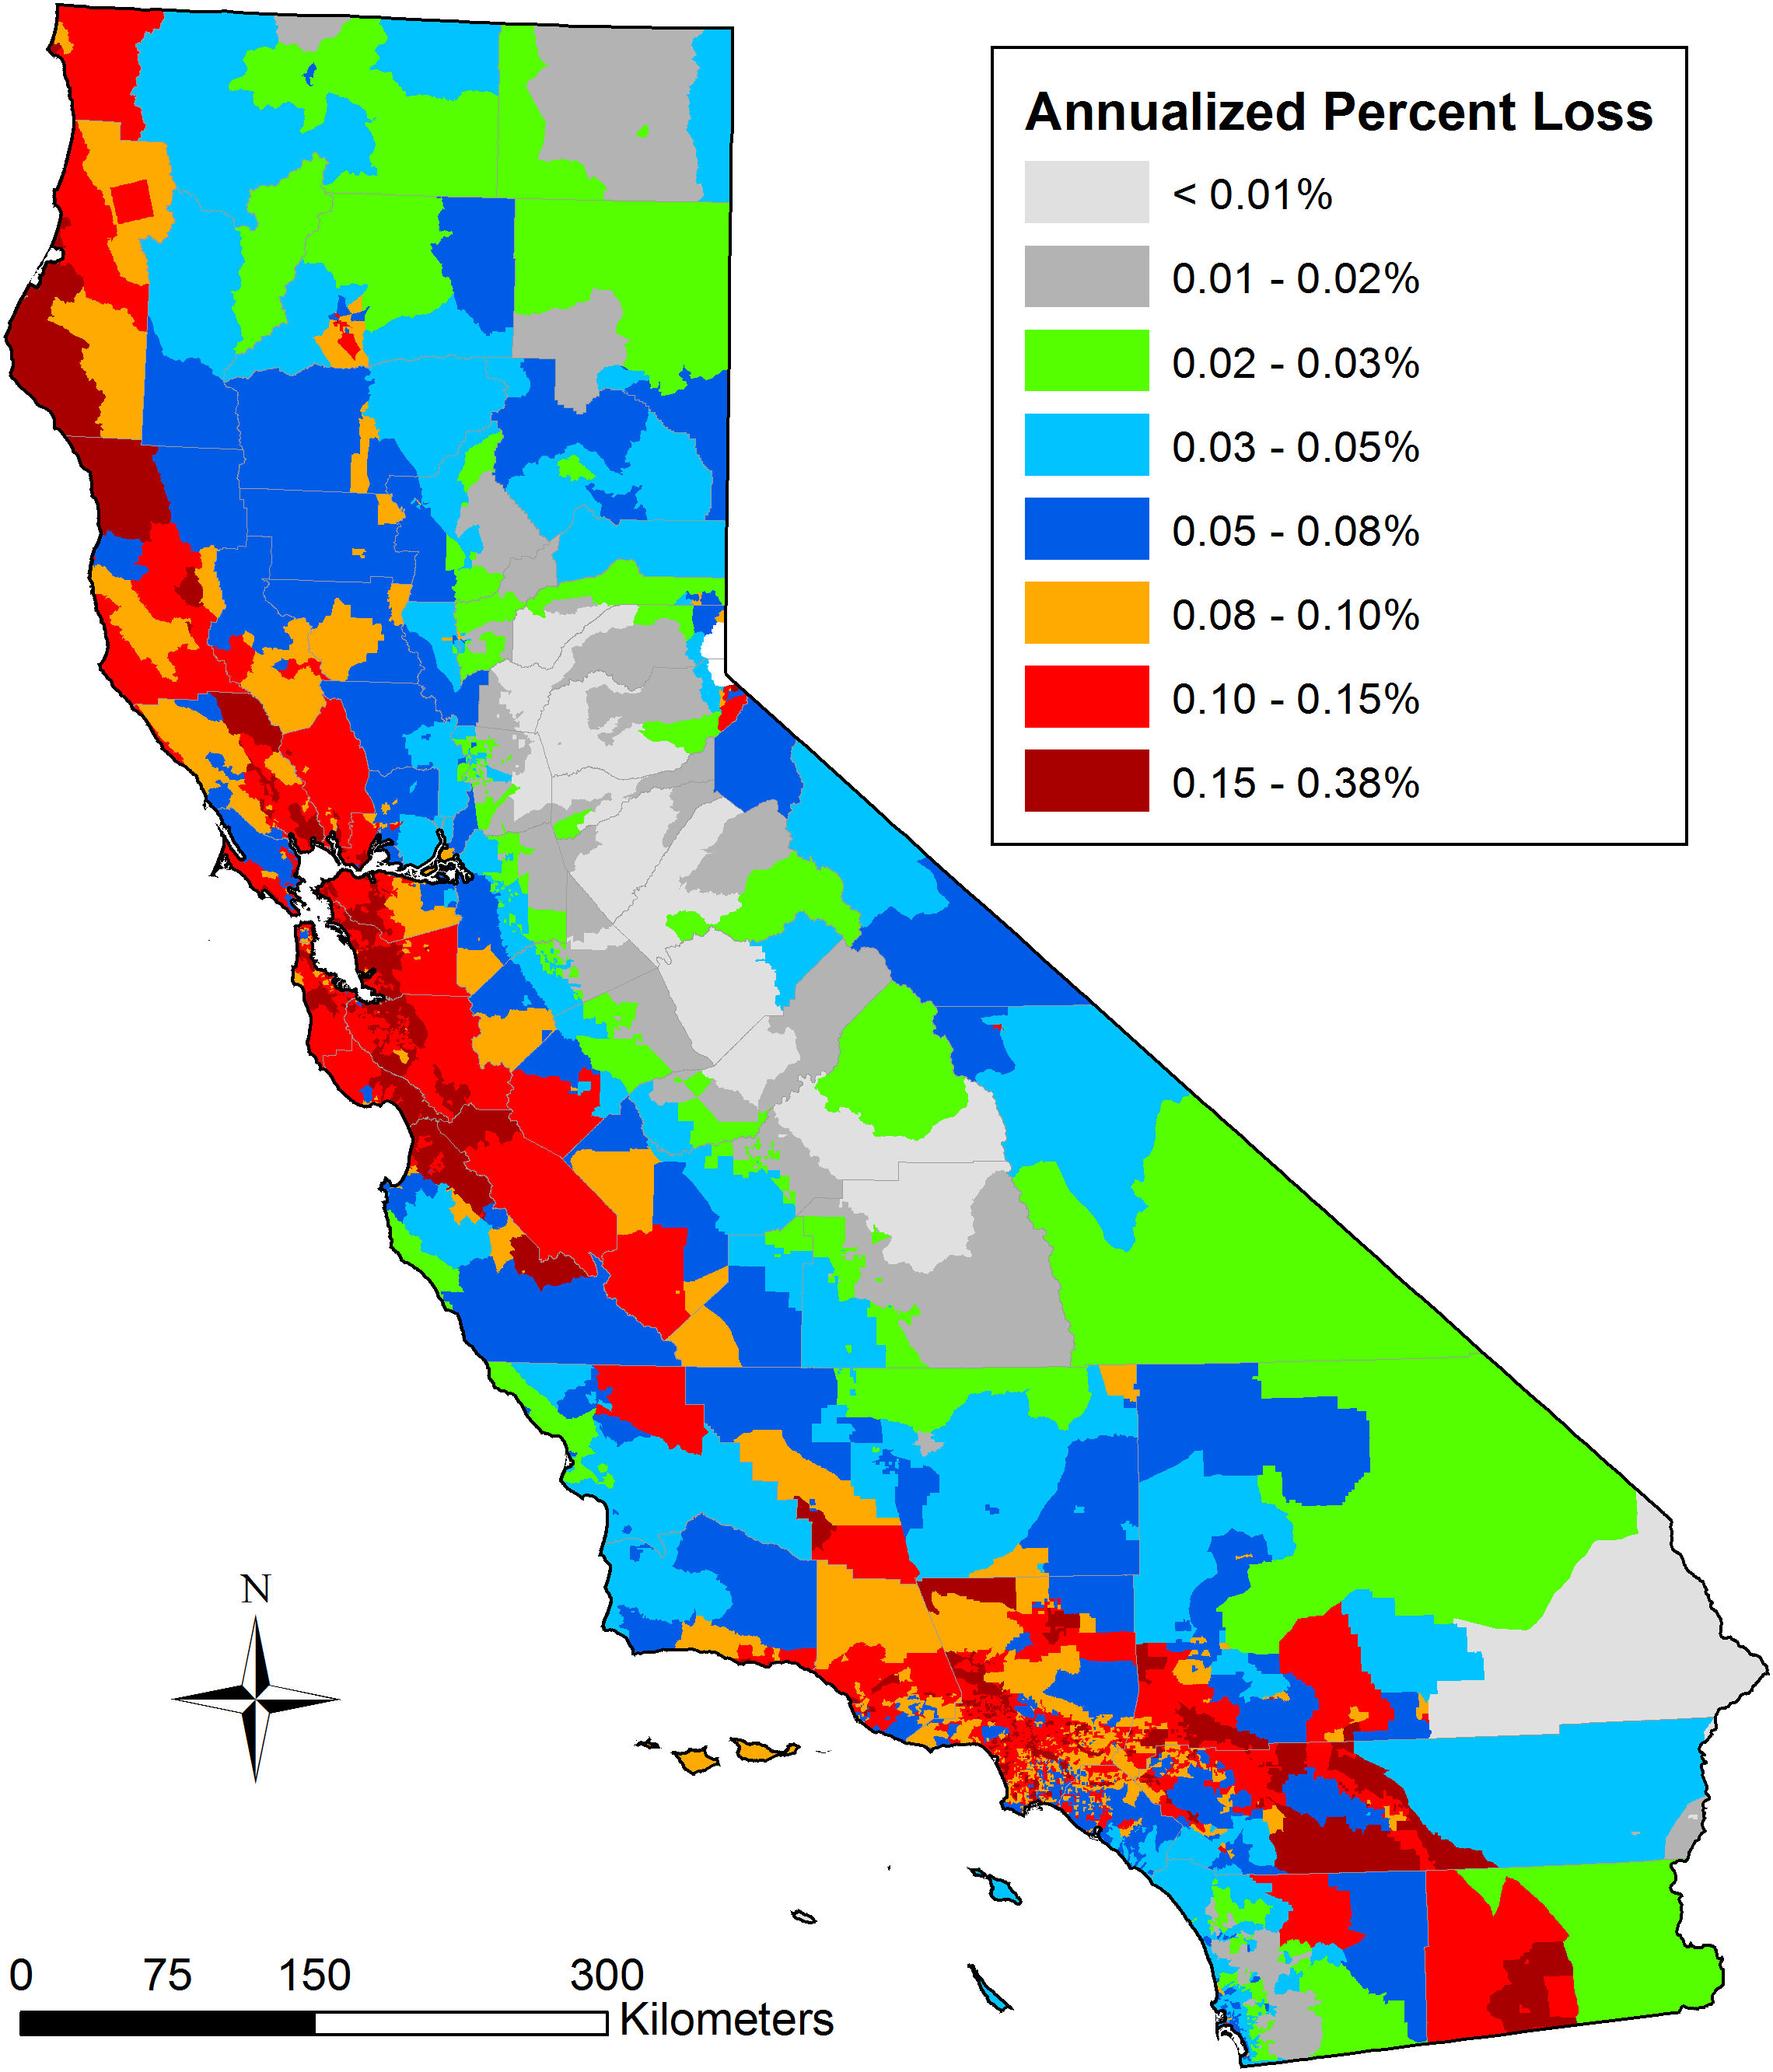
Figure S2. Distribution of APEL in California by census tract (based on sensitivity case 1—site condition approximated using VS30 groups).
Download: Metropolitan Statistical Areas.zip [Zipped ArcGIS Files; ~1.8 MB] ArcGIS shapefile for boundary polygons.
Download: Incorporated Cities.zip [Zipped ArcGIS Files; ~7.9 MB] ArcGIS shapefile for boundary polygons.
ArcGIS (http://www.arcgis.com/, last accessed May 2016) was used to aggregate loss results for counties, metropolitan statistical areas (MSAs), and cities. County boundary polygon shapefiles were from Hazus. Boundary polygon shapefiles for MSAs and cities were downloaded from U.S. Census Bureau’s TIGER/Line collections (https://www.census.gov/geo/maps-data/data/tiger-line.html, last accessed May 2016).
Seyhan, E., and P. S. Stewart (2014). Semi-empirical nonlinear site amplification from NGA-West2 data and simulations, Earthq. Spectra 30, no. 3, 1241–1256, doi: 10.1193/063013EQS181M.
Wills, C. J., C. I. Gutierrez, F. G. Perez, and D. M. Branum (2015). A next-generation VS30 map for California based on geology and topography, Bull. Seismol. Soc. Am. 105, no. 6, 3083–3091, doi: 10.1785/0120150105.
[ Back ]