This electronic supplement contains five figures, mentioned in the main article, which show data for intensity prediction equation (IPE) evaluation, figures for additional residual analyses, and figures showing evaluations based on other performance metrics. It contains eight tables that list the events and details of the earthquakes used in the analysis and the means, standard errors, and the standard deviations of modified Mercalli intensity (MMI)/community Internet intensity (CII) values of the selected ground-motion parameters (GMPs).
Table S1. Earthquakes used in this study.
Table S2. Seismic station distances and the assigned intensities.
Table S3. Mean of log10 (peak ground motions [PGMs]) at different macroseismic intensities for converted MMI data.
Table S4. Mean of log10 (PGMs) at different macroseismic intensities for both unconverted MMI and unconverted data (hereafter, CII).
Table S5. Standard error of log10 (PGMs) at different macroseismic intensities for converted MMI data.
Table S6. Standard error of log10 (PGMs) at different macroseismic intensities for both unconverted MMI and unconverted CII.
Table S7. Standard deviations of log10 (PGMs) at different macroseismic intensities for converted MMI data.
Table S8. Standard deviations of log10 (PGMs) at different macroseismic intensities for both unconverted MMI and unconverted CII.
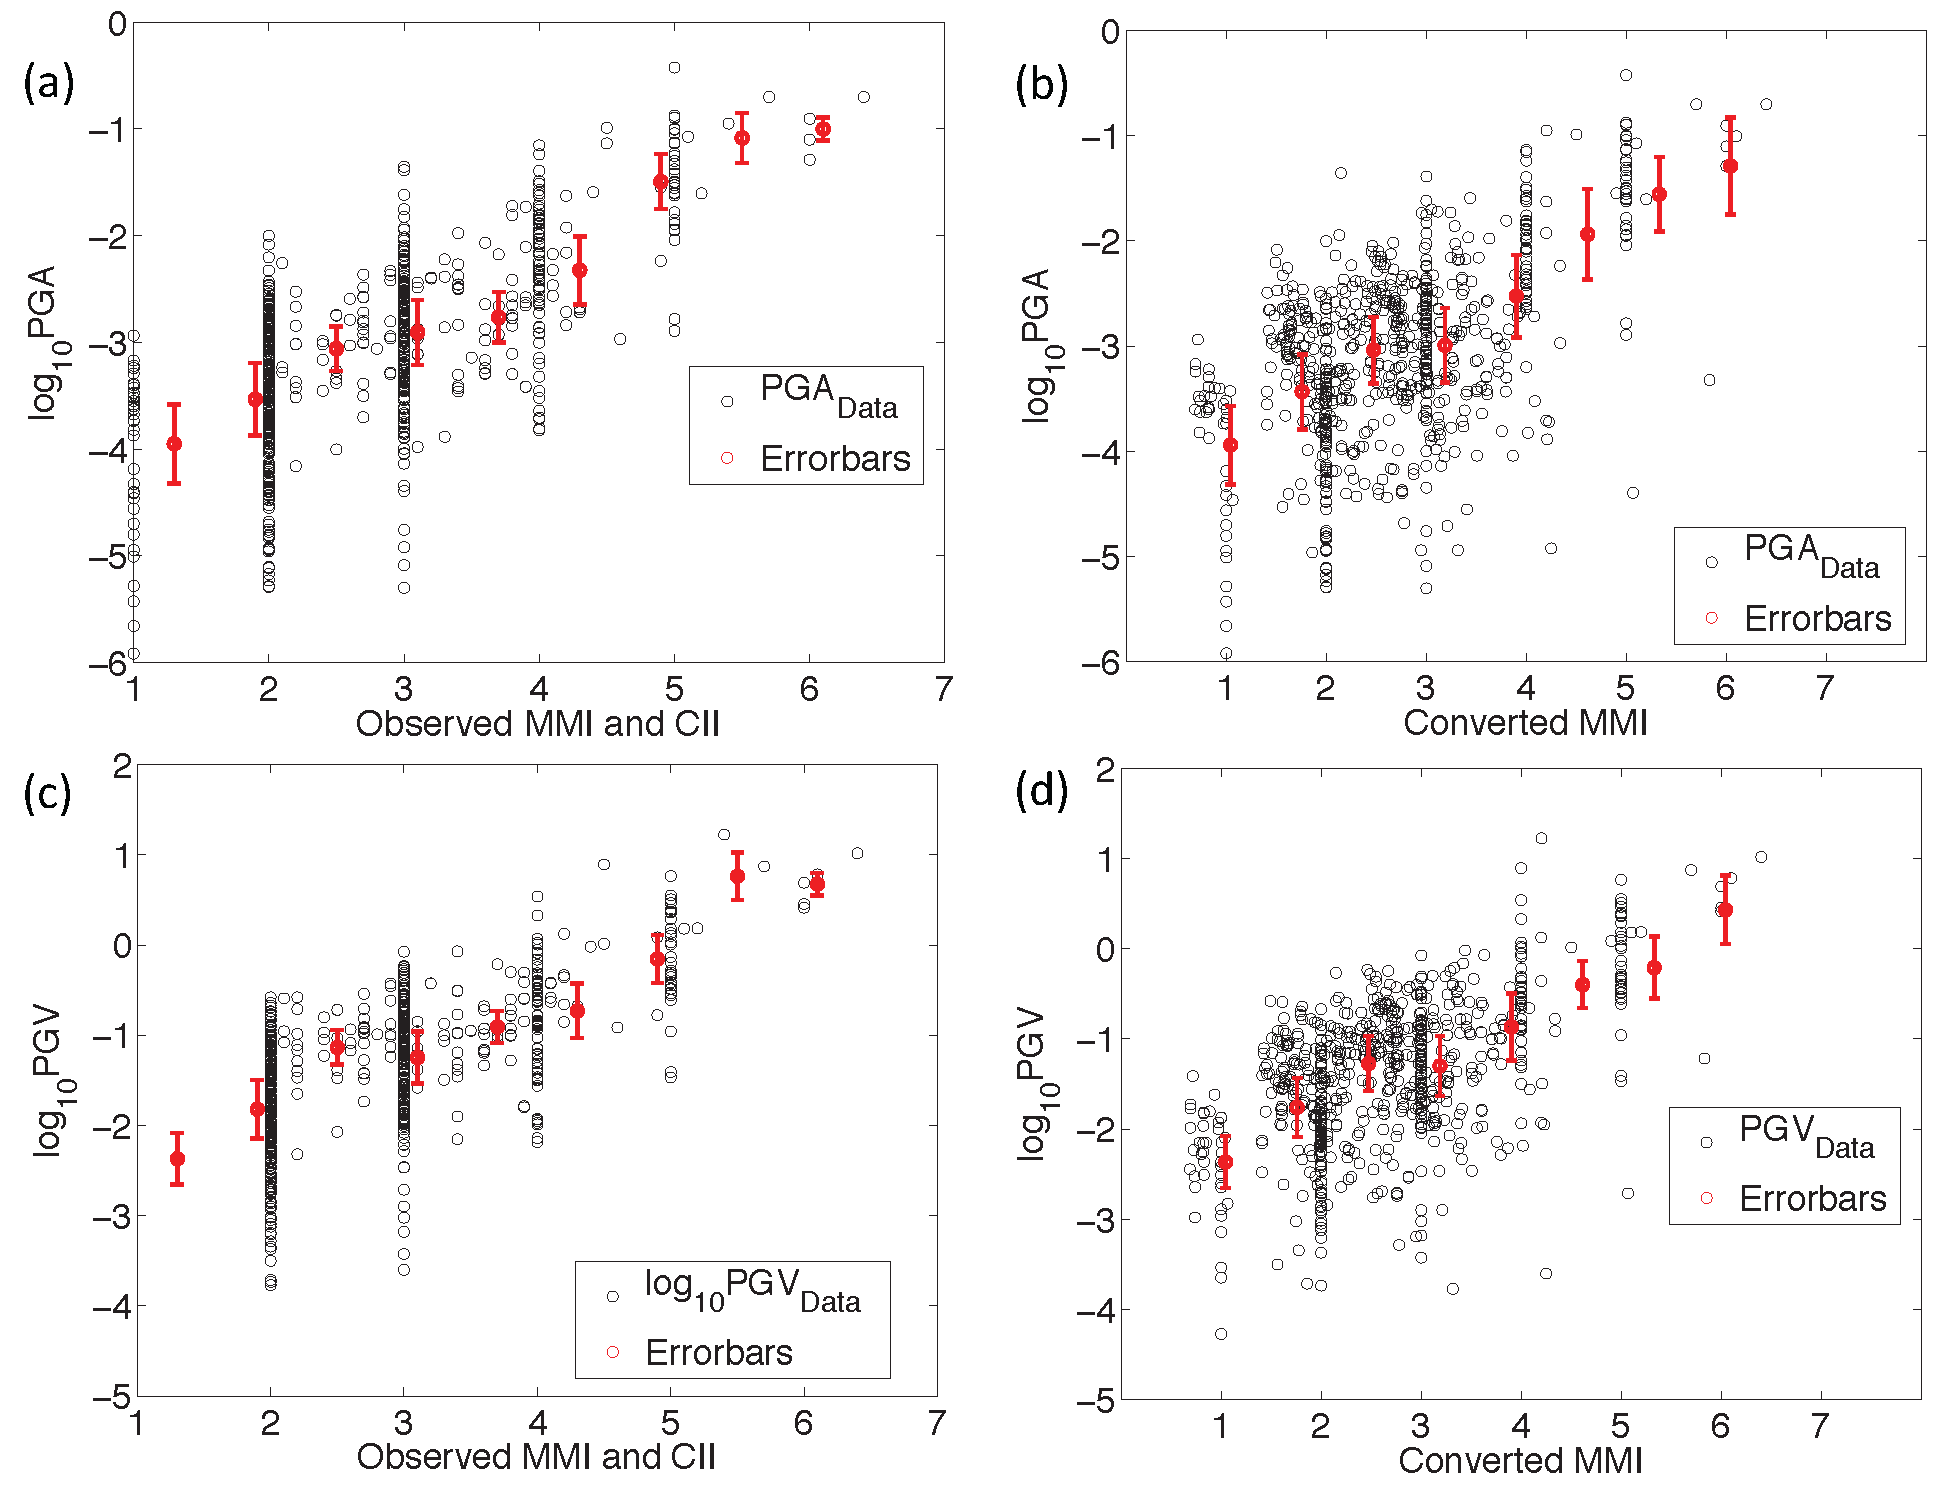
Figure S1. Observed relationships between MMI and PGMs before and after conversion of intensity data. (a) and (c) are plots for peak ground acceleration (PGA) and peak ground velocity (PGV) before conversions and (b) and (d) are for the same plots after conversions. The error bars represent the 95% confidence interval (CI) of the binned MMI/CII values in increment of 0.5 units of intensity.
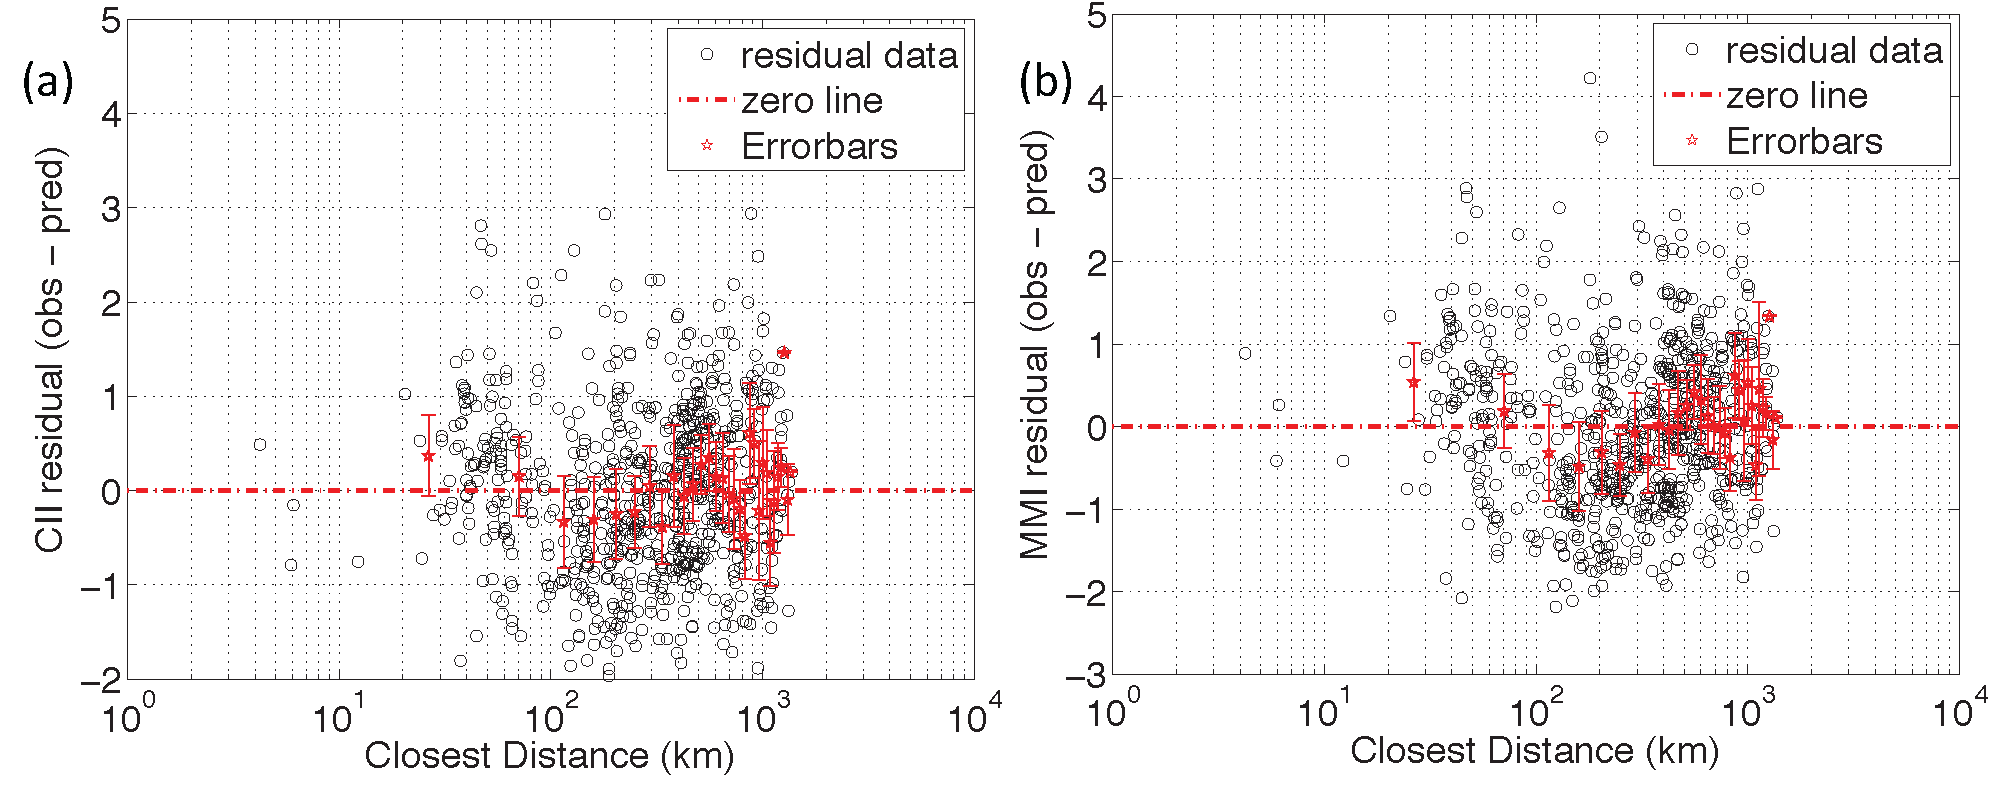
Figure S2. Residuals (observed MMI/CII − predicted MMI/CII) for predicted CII from the GMPs using the developed equation (equation 7 of the main article) as a function of epicentral distance for PGA where (a) is for CII and (b) is for converted MMI. The error bars represent the 95% CI of the binned MMI/CII values in 25 bins of distance.
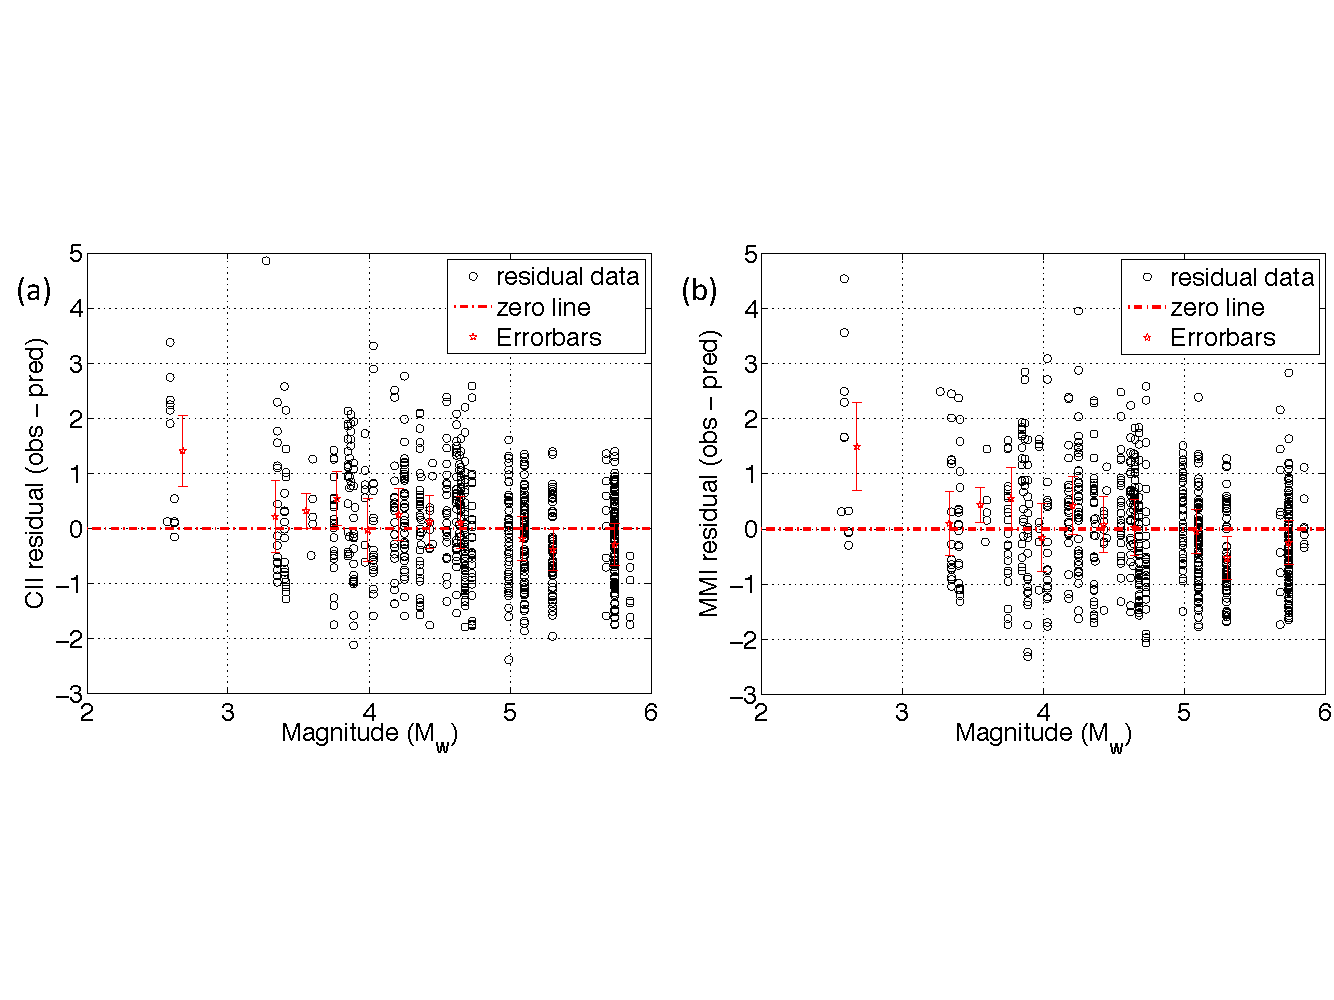
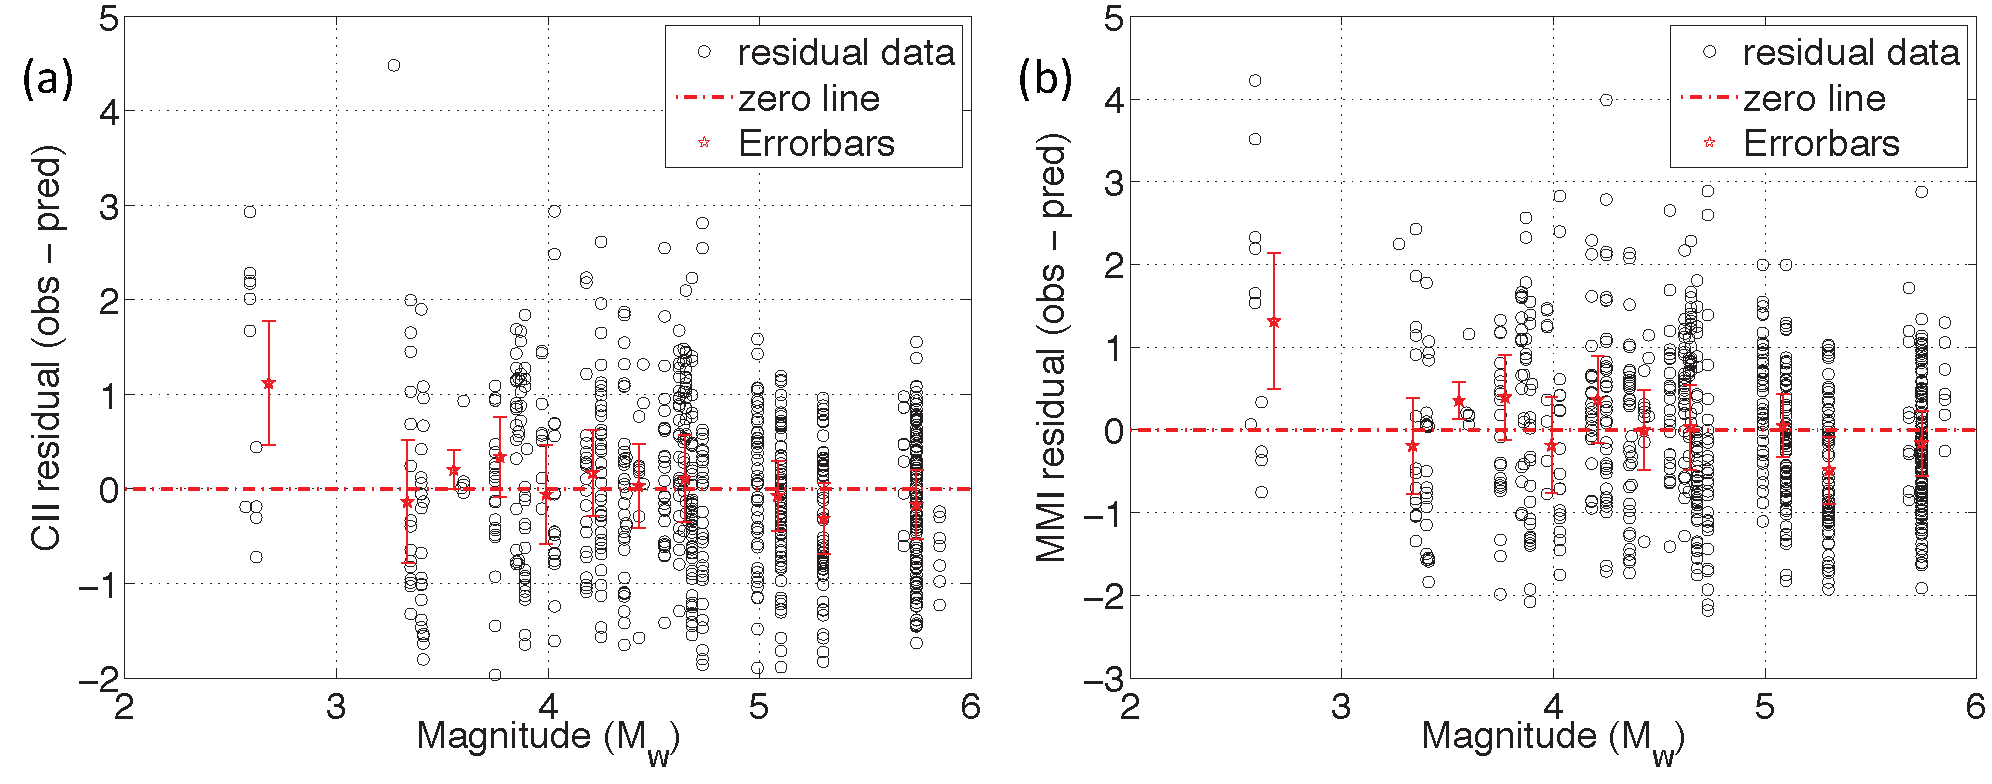
Figure S3. Residuals (observed MMI/CII − predicted MMI/CII) for predicted CII from the GMPs using the developed equation (equation 7 of the main article) as a function of magnitude for PGA where (a) is for CII and (b) is for converted MMI. The error bars represent the 95% CI of the binned MMI/CII values in 16 bins of magnitude.
Figure S4. Residuals (observed MMI/CII − predicted MMI/CII) for predicted CII from the GMPs using the developed equation (equation 7 of the main article) as a function of epicentral distance for PGV where (a) is for CII and (b) is for converted MMI. The error bars represent the 95% CI of the binned MMI/CII values in 25 bins of distance.
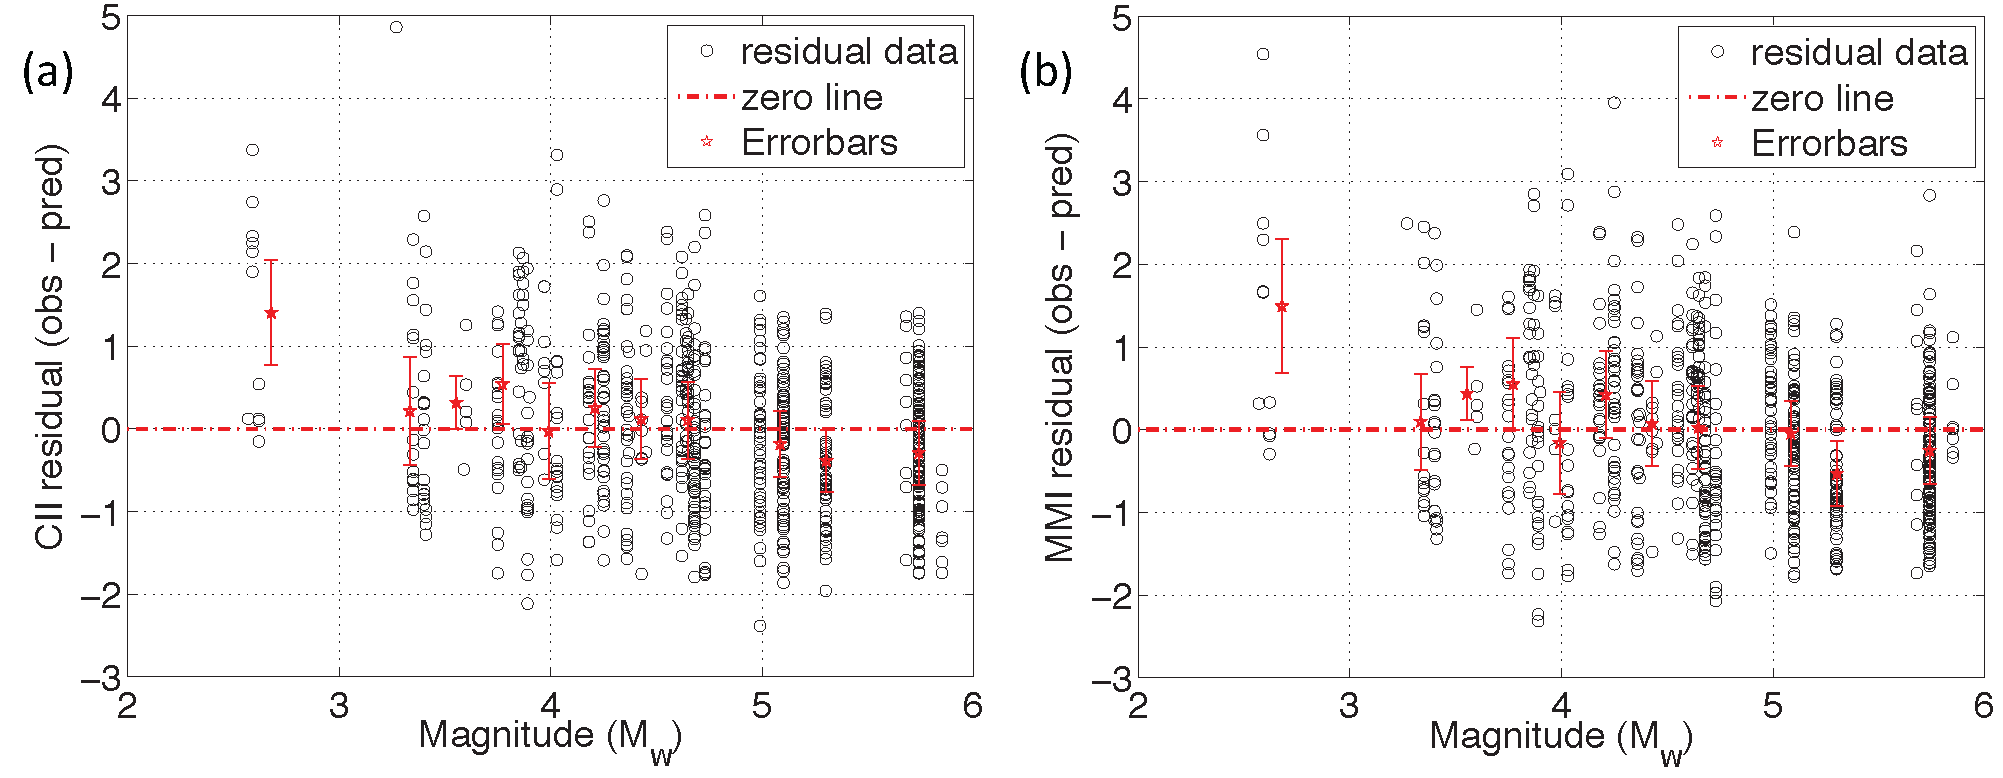
Figure S5. Residuals (observed MMI/CII − predicted MMI/CII) for predicted CII from the GMPs using the developed equation (equation 7 of the main article) as a function of magnitude for PGV where (a) is for CII and (b) is for converted MMI. The error bars represent the 95% CI of the binned MMI/CII values in 16 bins of magnitude
Macrointensity data of “Did You Feel It?” (DYFI) were downloaded from http://earthquake.usgs.gov/data/dyfi/ (last accessed October 2016) and some historical earthquake data from Canada were obtained from National Oceanic and Atmospheric Administration (NOAA) website at https://www.ngdc.noaa.gov/hazard/earthqk.shtml (last accessed April 2016). The NGA-East_RotD50_5pct_Flatfile_Public_20141118 was obtained from http://peer.berkeley.edu/publications/peer_reports/reports_2014/reports_2014.html (last accessed April 2016). The figures were prepared using MATLAB (http://www.mathworks.com, last accessed October 2016).
[ Back ]