A few past studies noted a possible association between oil exploration activities and twentieth-century seismicity (Nicholson and Wesson, 1990; Nicholson and Wesson, 1992), but no previous comprehensive investigations have been done. To investigate past earthquake rates in Oklahoma, it is necessary to consider briefly the historical context of the state. The present-day state was designated as Indian lands in the early nineteenth century. On 23 March 1889, President Benjamin Harrison signed legislation opening much of present-day Oklahoma for settlement, effective 22 April 1889. A land run ensued immediately. By the end of the first day, the populations of a number of cities had grown from zero to over 10,000 (Howard, 1889). According to U.S. Census data, the population of Oklahoma grew from 790,391 in 1900 to 1,657,155 in 1910 and to 2,028,283 in 1920. Between 1920 and 1950, the population grew slowly, reaching 2,233,351 in 1950. Under a series of homestead acts, previously unassigned lands were divided into 160-acre (1/4 square mile) homesteads, resulting in an even distribution of population throughout the state. (We preserve the nonmetric units on which the system was designed.) U.S. Census data reveal that the population grew rapidly after 1900, with at least 10,000 people residing in each county by 1910 (5–30 people per square mile, or 1–8 people per homestead) (Fig. 1 in the main article).
Newspapers were published in late nineteenth-century Oklahoma, providing a potential source of archival accounts of felt earthquakes. The earliest earthquake in Oklahoma in a recently compiled Central and Eastern United States Seismic Source Characterization (CEUS-SSC) catalog (see Data and Resources) occurred on 22 October 1882, with estimated moment magnitude of Mw 5.6 and a location in eastern Oklahoma. The catalog also includes an estimated Mw 4.2 event located in southern Kansas in 1897 and an estimated Mw 3–3.5 event on 10 September 1918 in central Oklahoma. Searching available online archives of historical newspapers in Oklahoma, we found accounts of four additional events: on 2 March 1898, 14 December 1900, 19 July 1908, and 9 April 1914, as well as additional information for the 1882 events (Fig. S1, Table S1) and 1897 events (Fig. S2, Table S2). No damage was reported for the events in 1898, 1900, and 1908; the 1914 event reportedly broke dishes and toppled chimneys in the town of Hobart. All four of the events were reportedly felt in only single locations, implying small magnitudes. A consideration of “Did You Feel It?” (DYFI) data (Wald et al., 1999) for recent small-to-moderate earthquakes reveals that Mw 4 earthquakes in the CEUS are commonly felt to a distance of ∼100 km and weakly felt to ∼200 km, whereas Mw 3.5 events are commonly felt to ∼50 km, and Mw 3.0 events are barely felt at all. Guided by DYFI data, we estimate rough magnitudes for the earthquakes in 1898, 1900, 1908, and 1914.
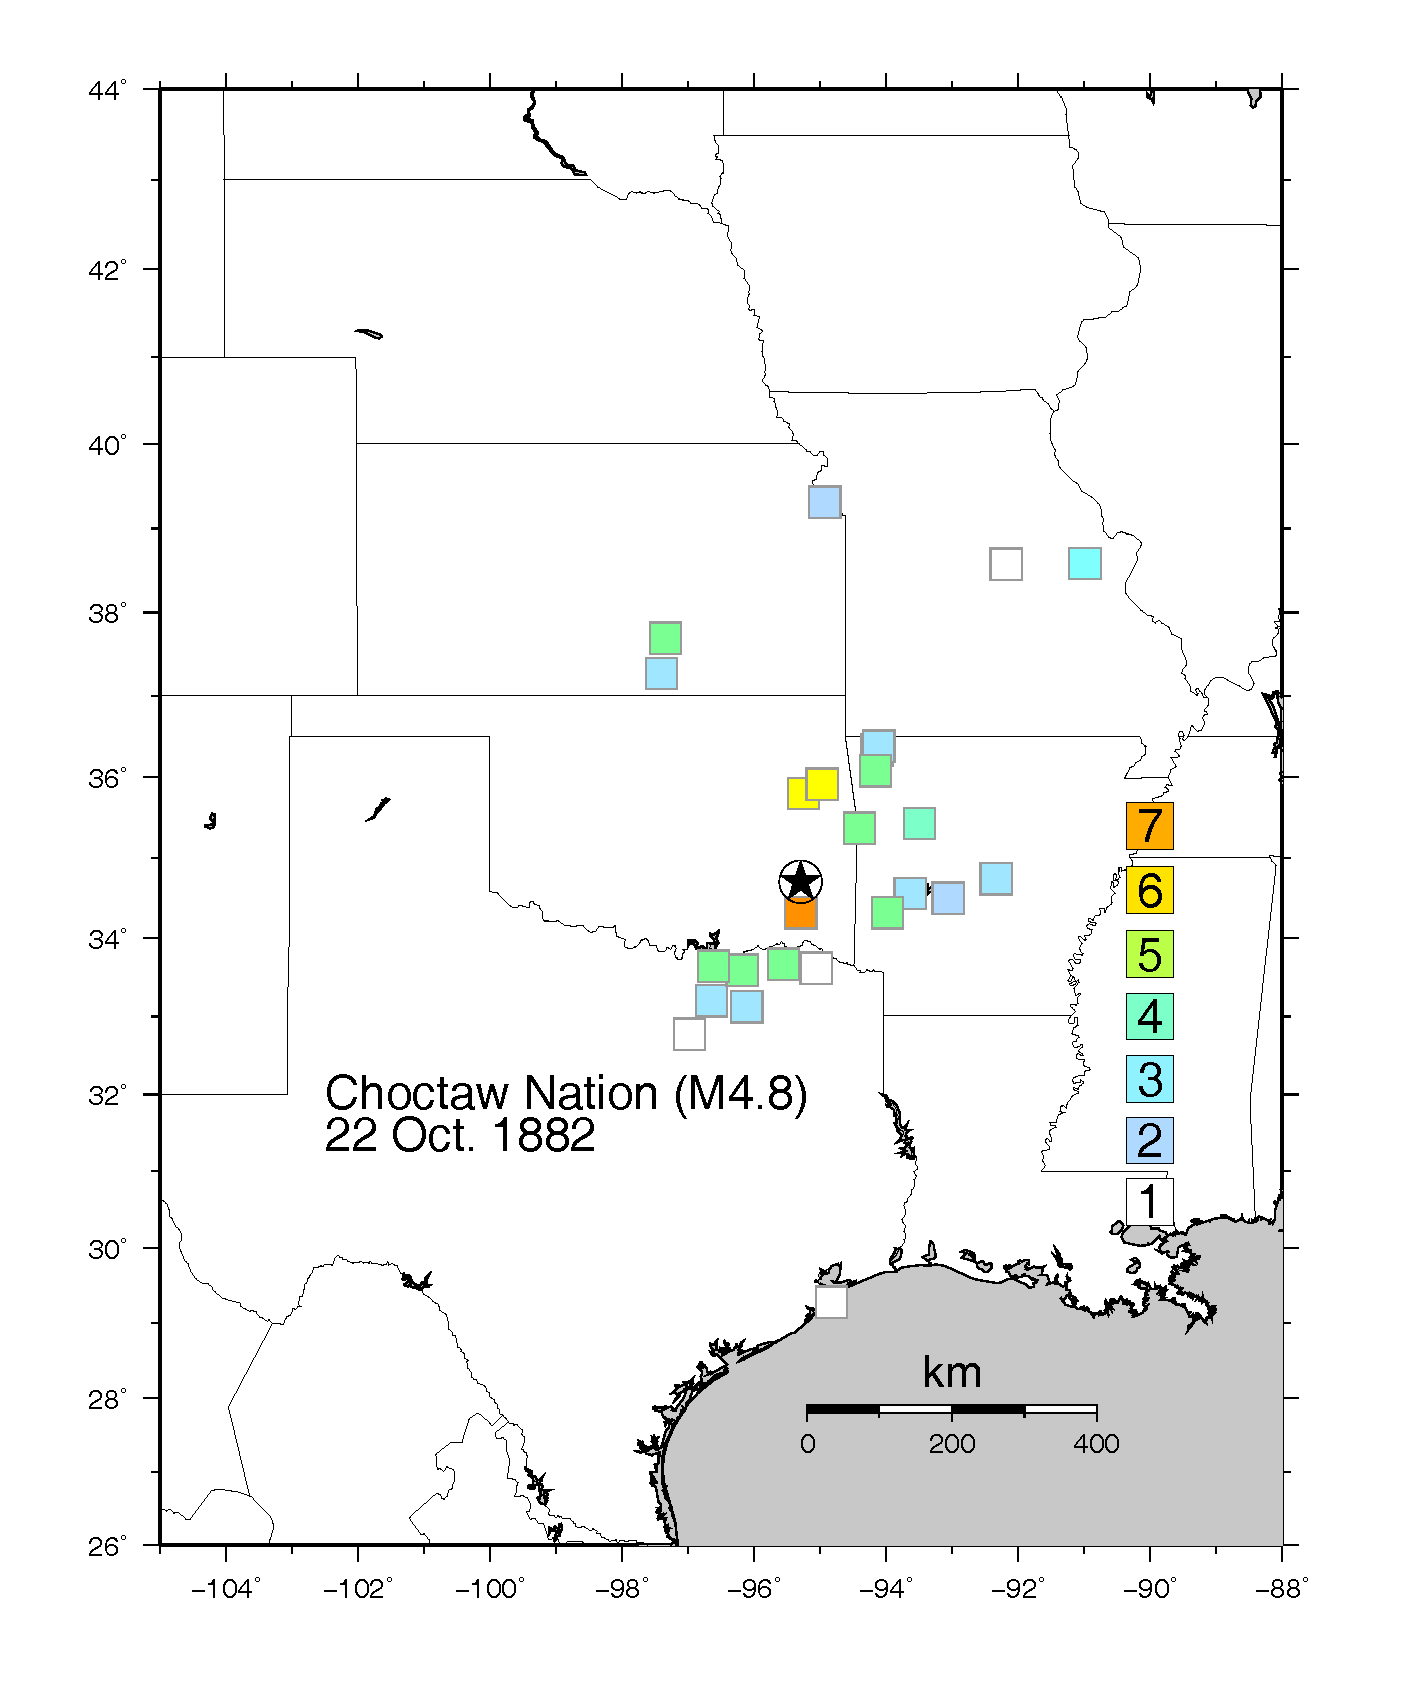
The 1882 event is sometimes called the Fort Gibson earthquake because of relatively severe effects documented at Fort Gibson, then in Indian Territory (Frohlich and Davis, 2002). Its preferred CEUS-SSC catalog magnitude estimate is Mw 5.6. Reviewing archival sources we generally confirm the interpretations summarized recently by Frohlich and Davis (2002). We conclude, however, that extant accounts describe, at most, a modified Mercalli intensity (MMI) of 6 near Fort Gibson (Table S1). We also consider an additional account that to our knowledge has not been considered previously, from an individual who traveled from Arkansas to Texas shortly after the earthquake. He describes effects in Venetia Grove (now Athens), Arkansas, commensurate with MMI 5. He also notes that, in the Choctaw Nation, about 70 miles west of Venetia Grove, chimneys fell, and a “general turning over of things took place.” Based on this account, we conclude the account occurred within the then-Choctaw Nation, now southeastern Oklahoma (Fig. S1). The earthquake was weakly felt to distances of ∼500 km. According to an established intensity-prediction equation for CEUS events (Atkinson and Wald, 2007), a felt extent of 500 km implies a magnitude of approximately Mw 4.8. We therefore estimate Mw 4.8 for what we propose should be known as the Choctaw Nation earthquake. We note that, while all magnitude estimates in this study are preliminary and could potentially be refined with more detailed analysis, the overall felt extent is not as large as expected for Mw 5.5, given established intensity-prediction equations for tectonic CEUS earthquakes (e.g., Atkinson and Wald, 2007).
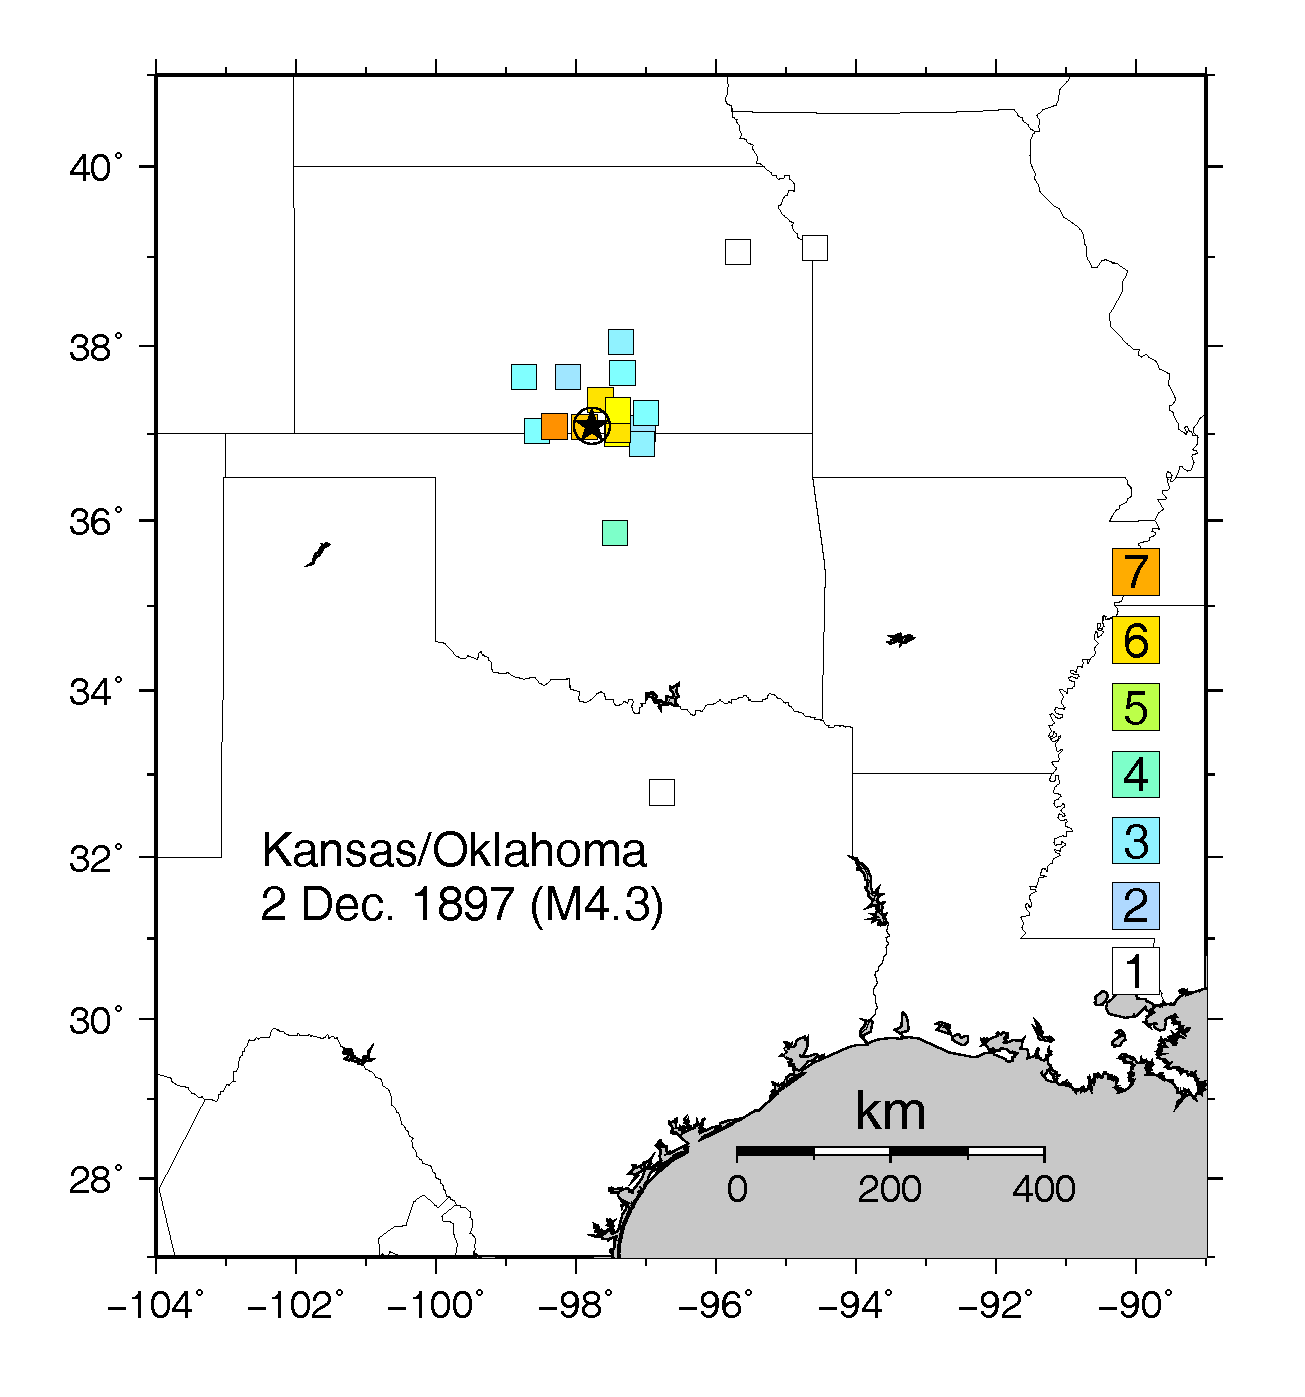
We also consider accounts of the 1897 event to refine its magnitude and location (Table S2, Fig. S2). In this case, the event is weakly felt to distances of 150–200 km. We conclude the event was located nearly on the border between Oklahoma and Kansas, with an estimated Mw 4.3, although both the location and magnitude estimates remain imprecise. The magnitude estimate is again preliminary, although in this case our estimate is close to the preferred CEUS-SSC catalog magnitude of Mw 4.2. Interestingly, this location, while imprecise, is close to the locations of recent earthquakes in Kansas that are suspected to be injection induced (Petersen et al., 2014). The event also occurred less than eight months after the first commercial well in Oklahoma struck oil; however, the inferred location is over 100 km west of the well, so no causal relationship is proposed.
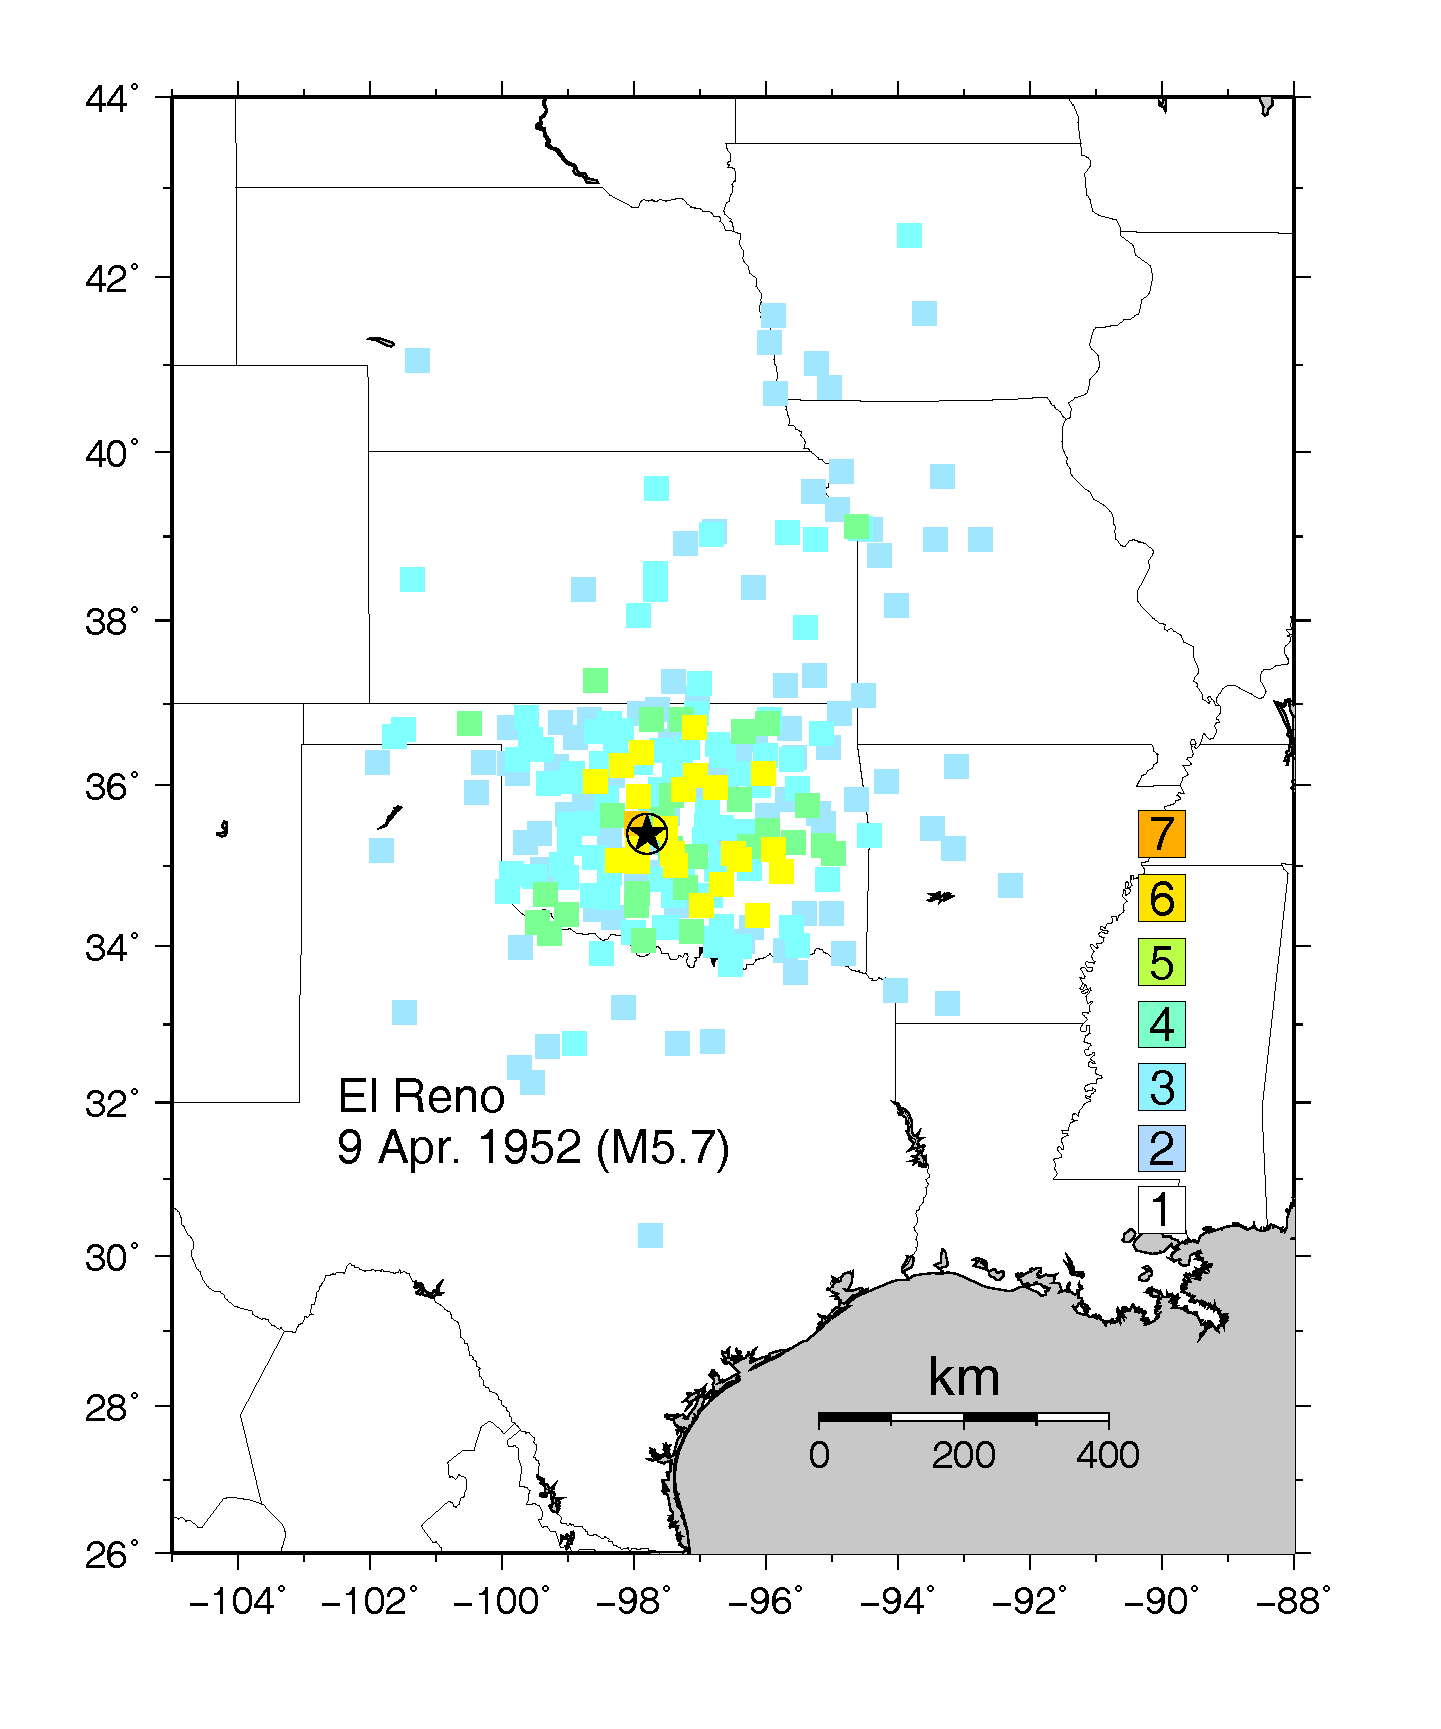
Seismicity rates remained low through the first half of the twentieth century (Fig. 1), with only six events larger than Mw 3.5 between 1900 and 1940 and no events as large as Mw 3.5 between 1940 and 1950. On 9 April 1952, an earthquake of estimated Mw 5.5 occurred in central Oklahoma. This event was recorded by a few seismometers in the region, and an intensity survey was carried out by the U.S. Coast and Geodetic Survey, using postcard questionnaires sent to postmasters. The survey revealed that felt shaking extended to over 1000 km (Stover and Coffman, 1993). In Table S3 we summarize some representative newspaper accounts of this event, which we discuss in more detail in the text of the main paper. For this event, we do not reassesss intensities because the postcard questionnaires used to determine the intensity distribution are no longer available. Of note, while the accepted location is in the city of El Reno, about 50 km from the center of Oklahoma City, newspaper accounts document light damage to the State Capitol building and other buildings in Oklahoma City.
Table S1. Accounts of 22 October 1882 Choctaw Nation earthquake.
Table S2. Felt reports of 2 December 1897 Earthquake (12:55 a.m. local time).
Table S3. Newspaper accounts of 9 April 1952 earthquake.
Figure S1. Intensity map of 22 October 1882 earthquake. The modified Mercalli intensity (MMI) values (color scale as indicated) were assigned from archival accounts given in Table S1. Location and magnitude were determined in this study.
Figure S2. Intensity map of 2 December 1897 earthquake. MMI intensity values (color scale as indicated) were assigned from archival accounts given in Table S2. Location and magnitude were determined in this study.
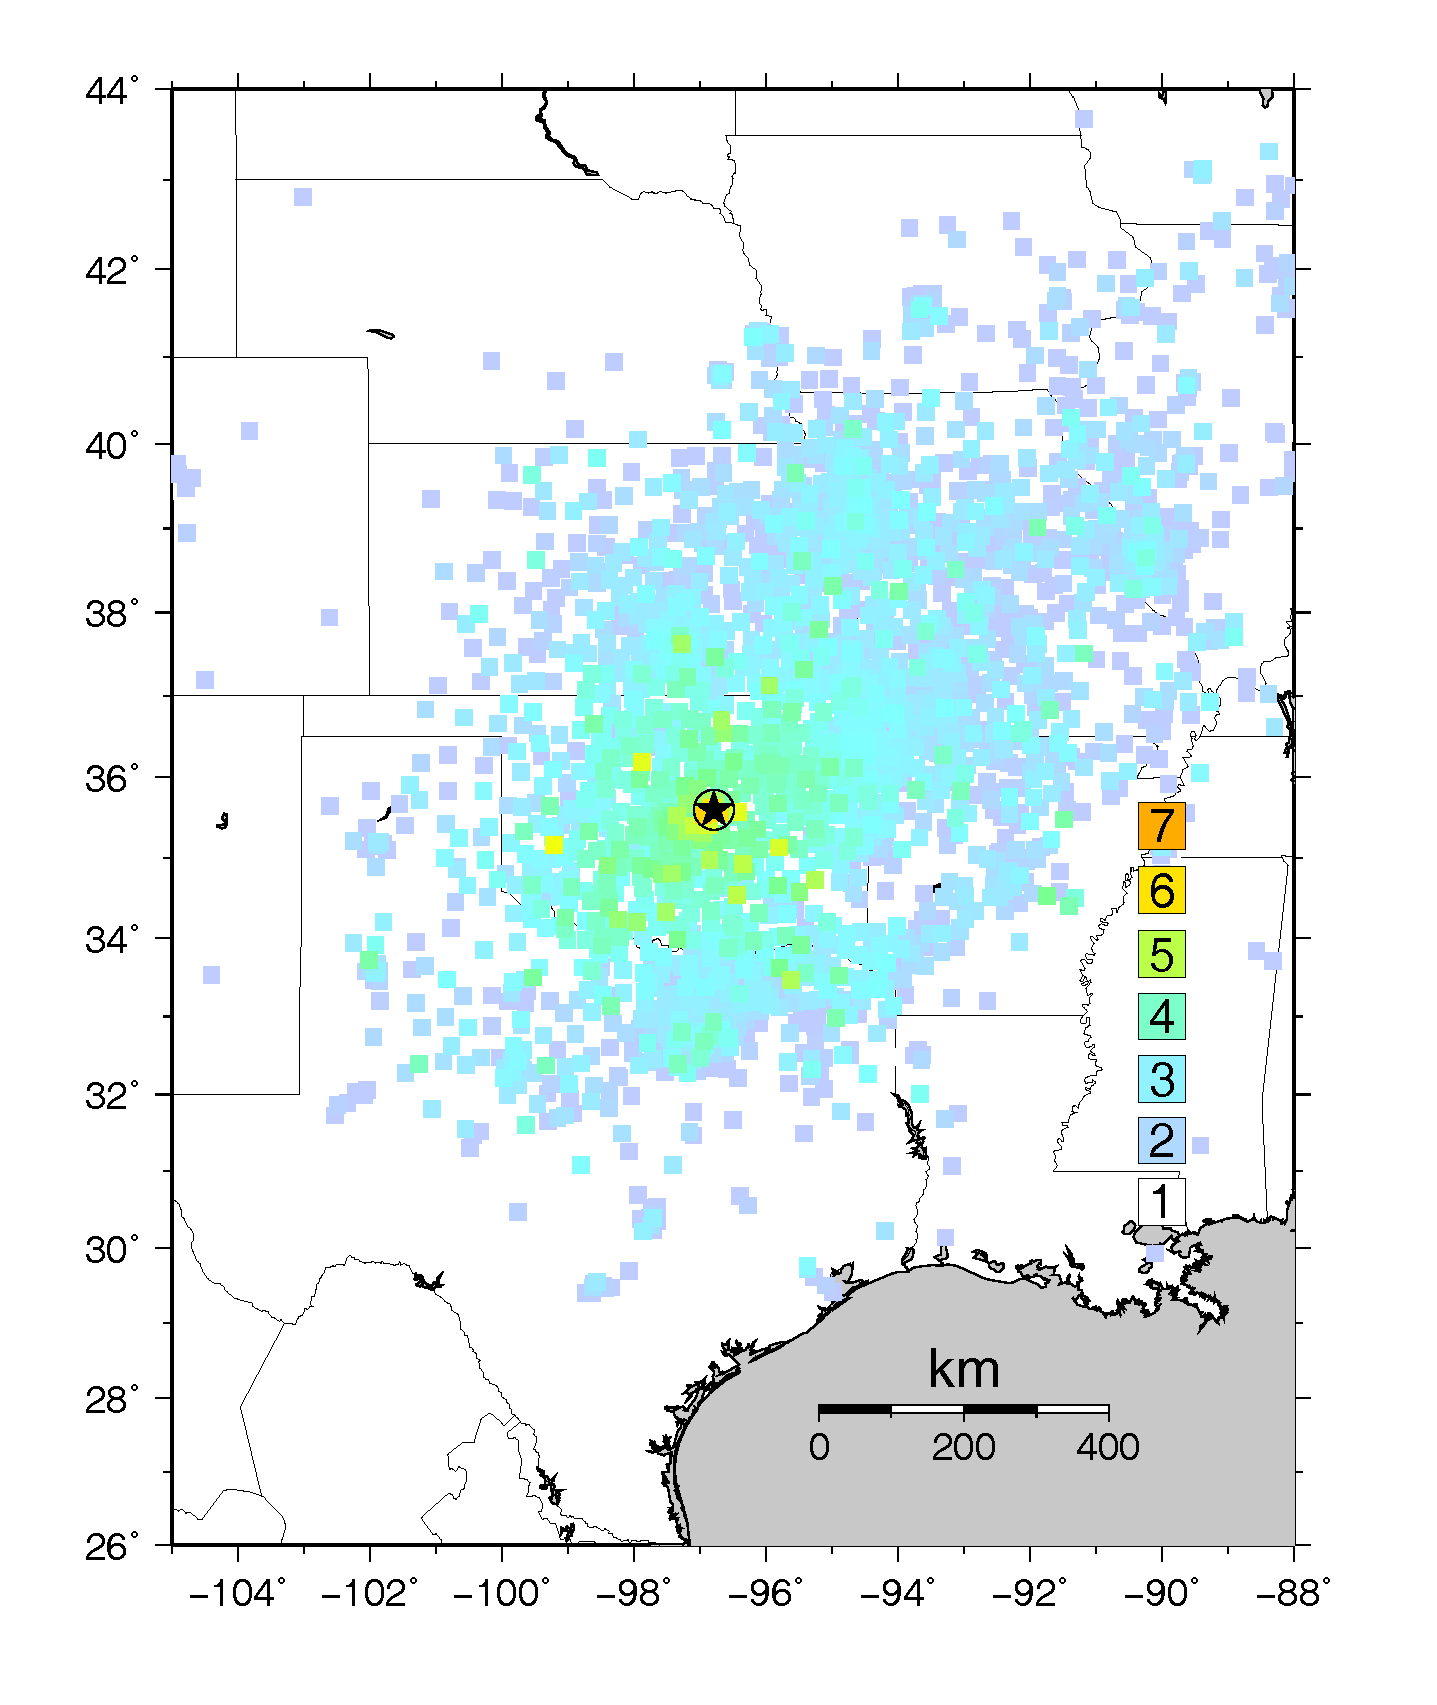
Figure S3. (a) Intensity map for the 9 April 1952 El Reno earthquake determined from National Oceanic and Atmospheric Administration (NOAA) data and (b) DYFI map for the November 2011 Prague, Oklahoma, earthquake (right). (MMI intensities are shown on the color scale.)
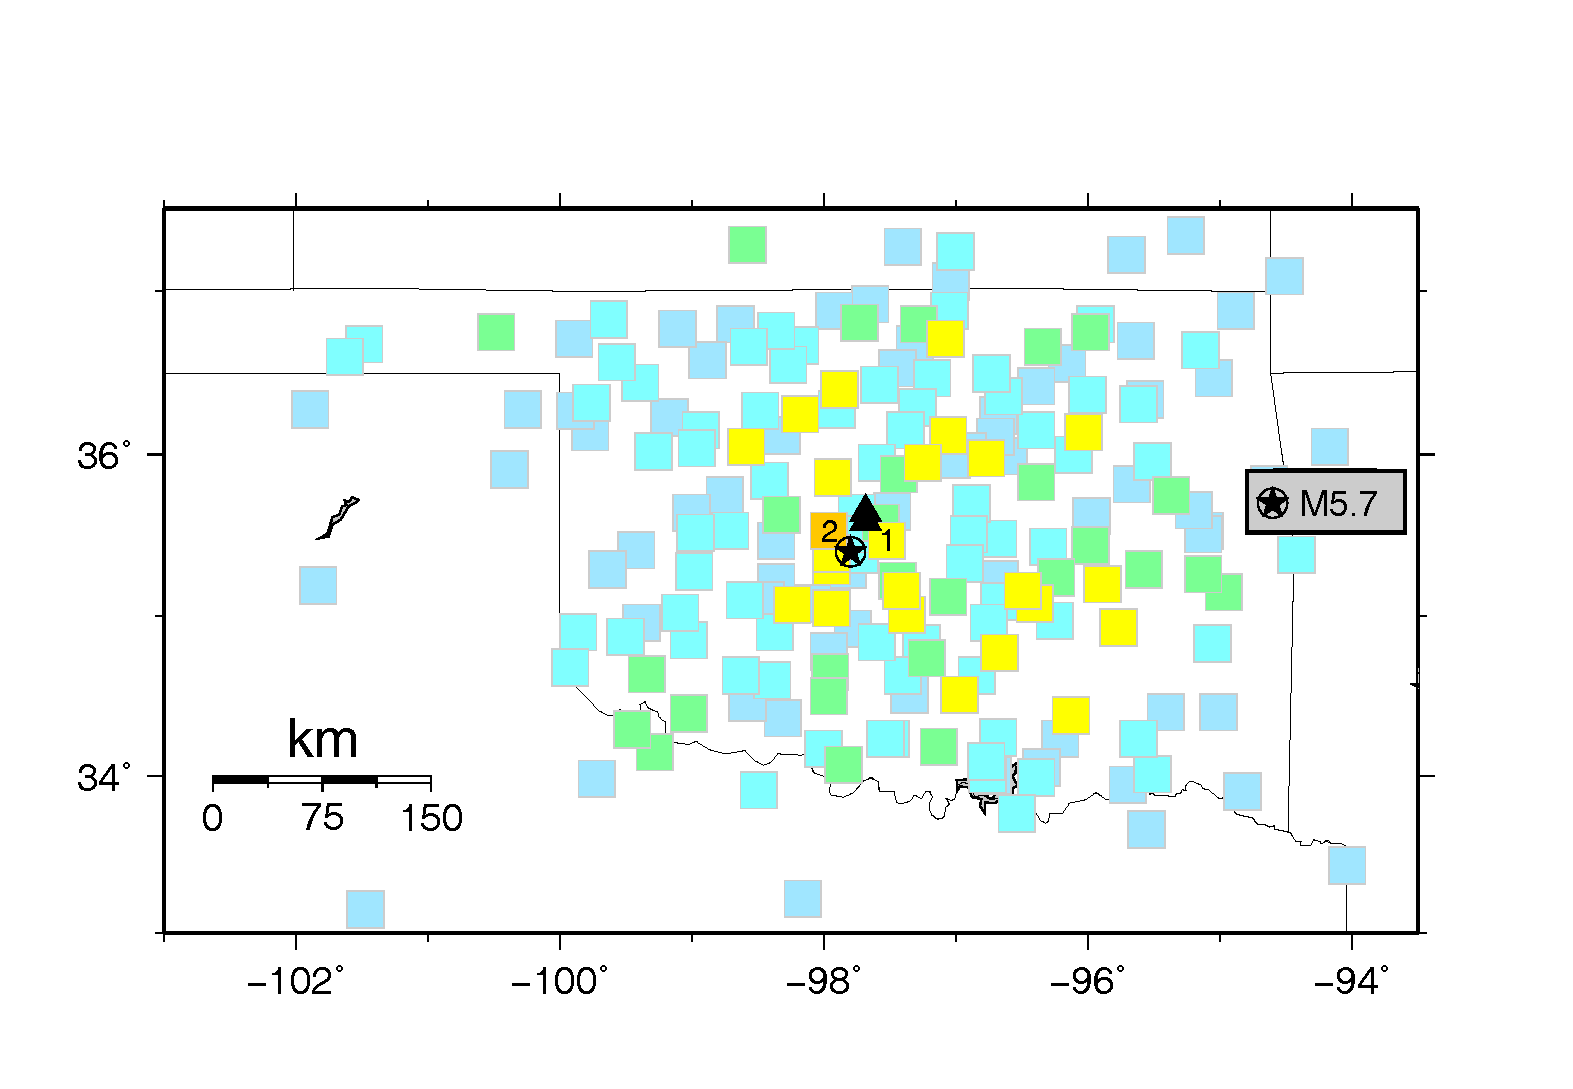
Figure S4. Map showing estimated location (circled star) and intensity values (colored squares; same scale as Figs. S1–S3) for the 9 April 1952 El Reno earthquake, along with locations of two wastewater injection wells that were permitted in 1945 and 1946 (black triangles). Both wells were reported plugged on 8 May 1952, a month nearly to the day after the earthquake. Locations of Oklahoma City and El Reno, where the most severe damage occurred, are indicated by (1) and (2), respectively.
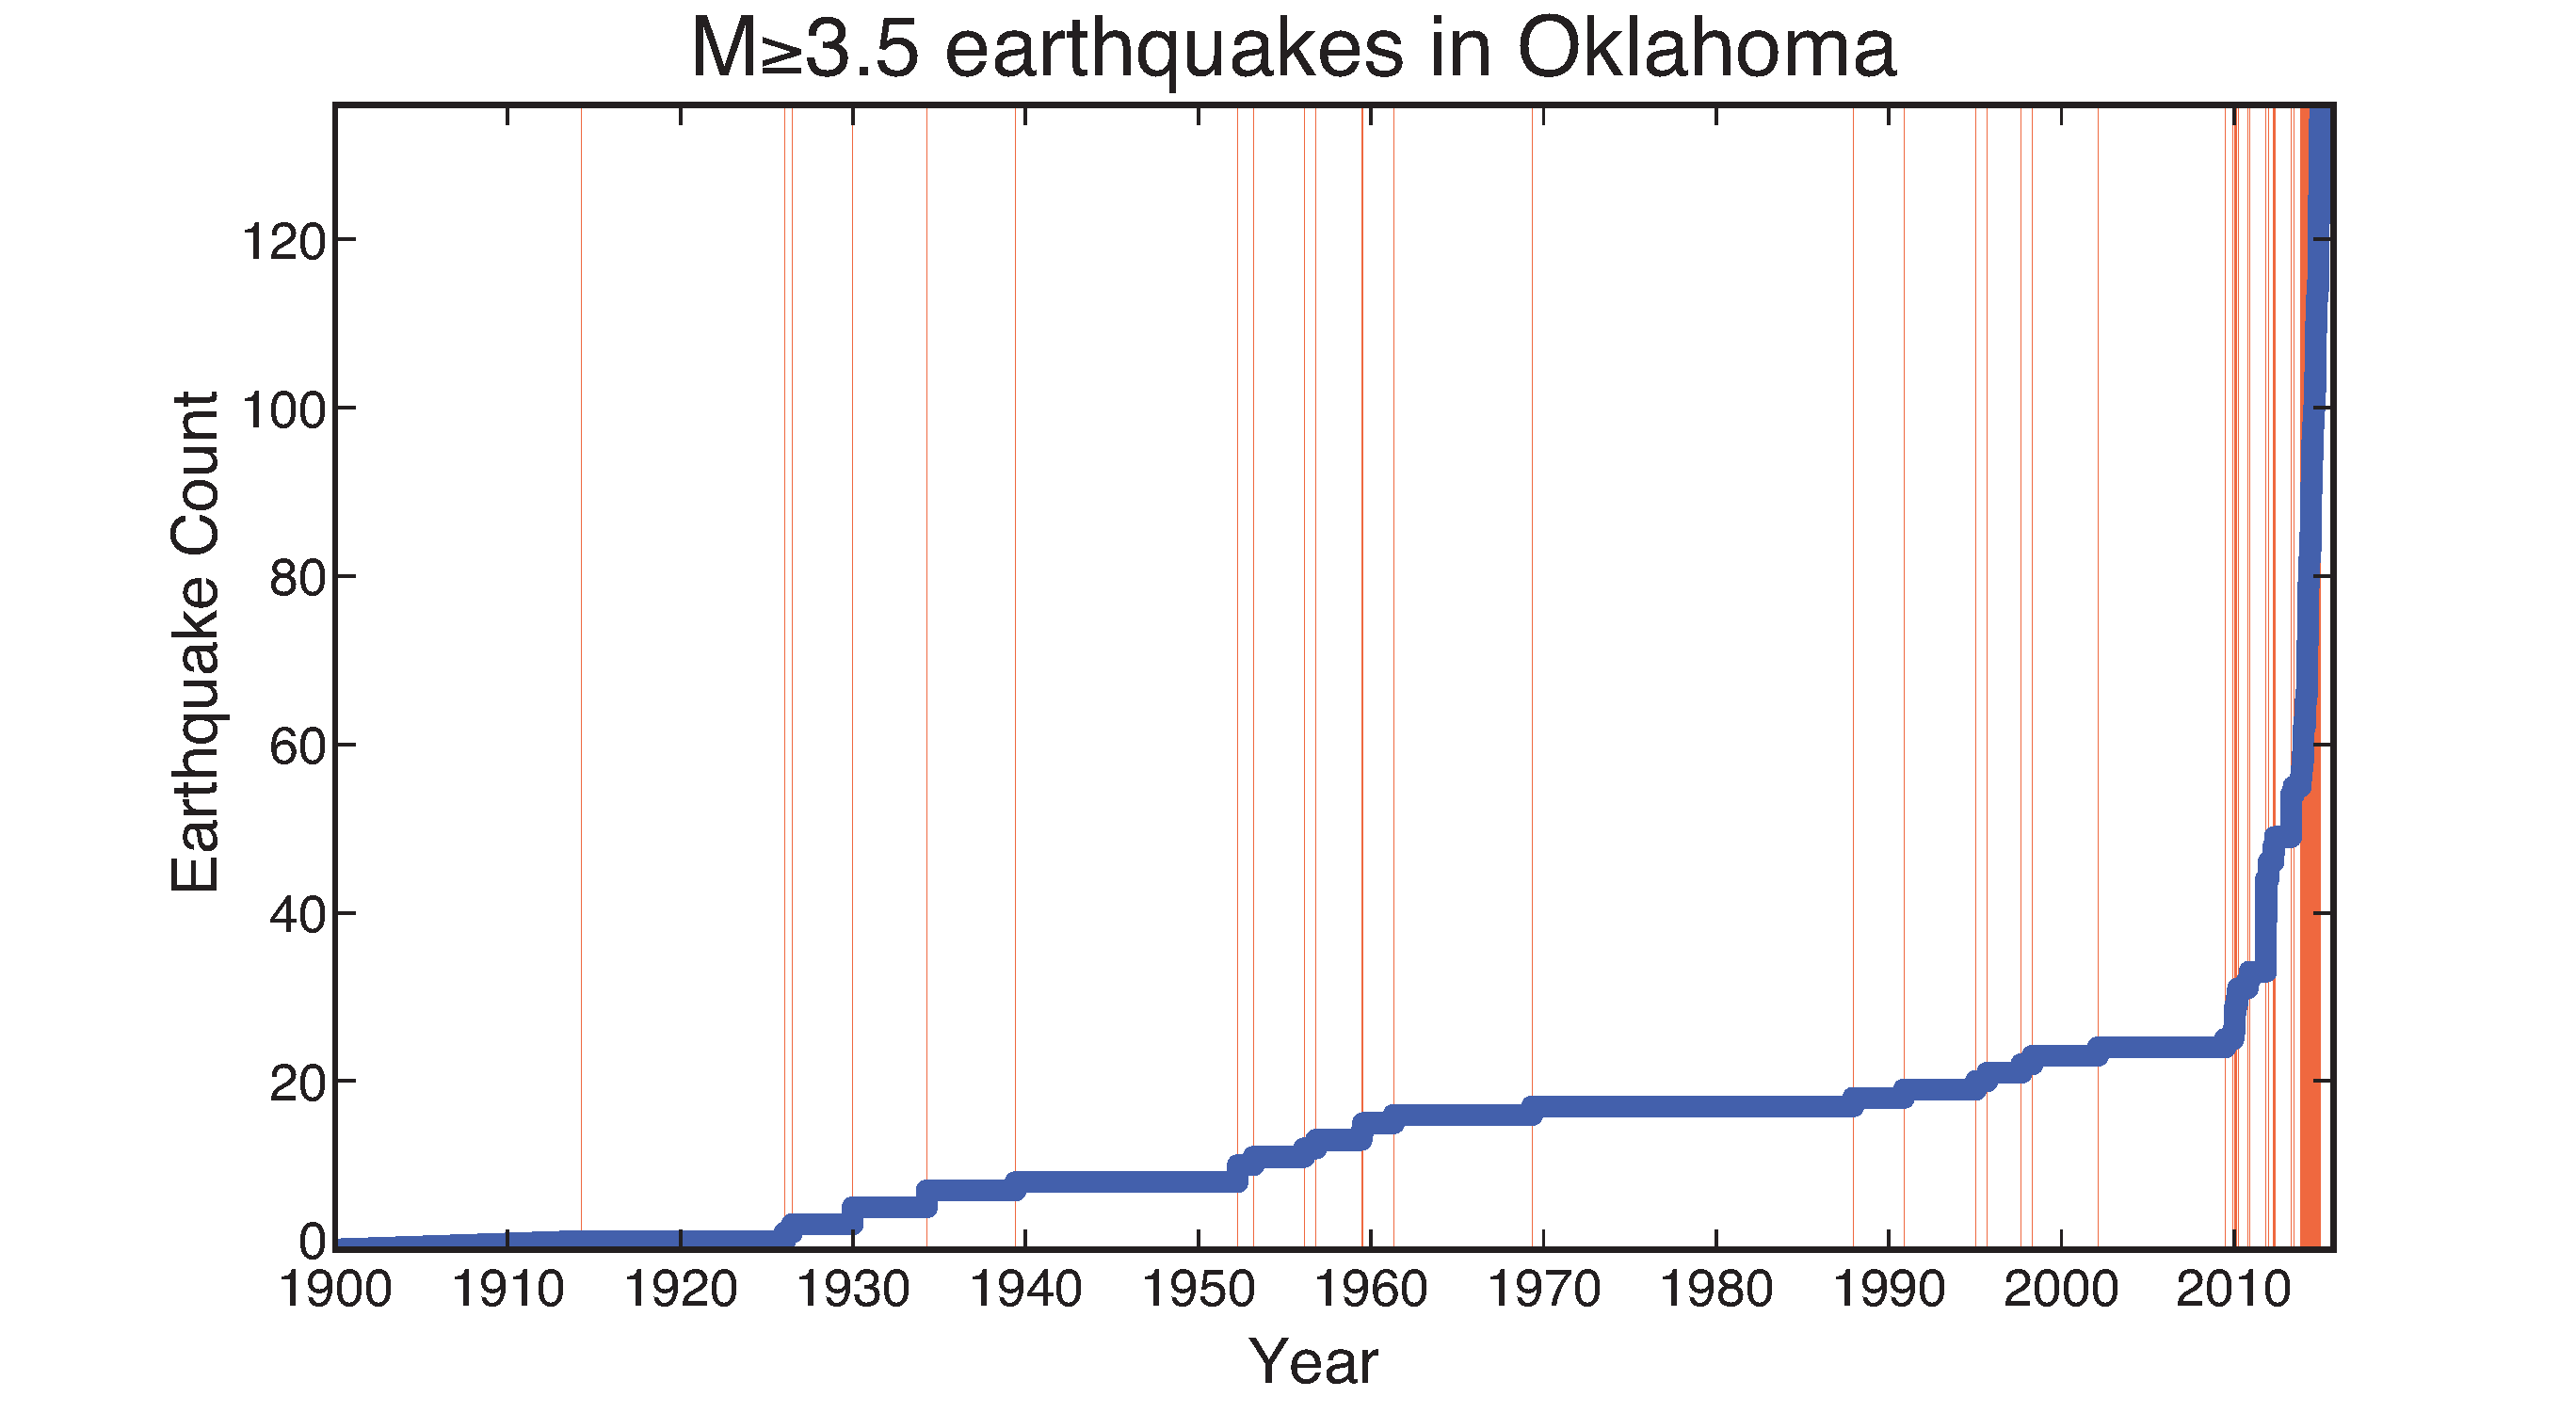
Figure S5. Cumulative count of earthquakes in Oklahoma from 1900 to 2014 (blue line), with dates of the Mw ≥3.5 earthquakes indicated (thin red lines). The observed rate between 2010 and early 2015 is more than a factor of 100 higher than the rate between 1900 and 2009.
The Central and Eastern United States Seismic Source Characterization (CEUS-SSC) catalog and documentation is available at http://www.ceus-ssc.com/ (last accessed February 2015).
Atkinson, G. M. and D. J. Wald (2007). “Did You Feel It?” intensity data: A surprisingly good measure of earthquake ground motion, Seismol. Res. Lett. 78, 362–368.
Frohlich, C., and S. D. Davis (2002). Texas Earthquakes, University of Texas Press, Austin, Texas, 275 pp.
Howard, W.W. (1889). The rush to Oklahoma, Harpers Weekly 33, 391–394.
Nicholson, C., and R. L. Wesson (1990). Earthquake hazard associated with deep well injection—A report to the U.S. Environmental Protection Agency, U.S. Geol. Surv. Bull. 1951.
Nicholson, C., and R. L. Wesson (1992). Triggered earthquakes and deep well activities, Pure Appl. Geophys. 139, 561–578.
Petersen, M. D., M. P. Moschetti, P. M. Powers, C. S. Mueller, K. M. Haller, A. D. Frankel, Y. Zeng, S. Resaeian, S. C. Harmsen, O. S. Boyd, et al. (2014). Documentation for the 2014 update of the United States National Seismic Hazard Maps, U.S. Geol. Surv. Open-File Rept. 2014–1091.
Stover, C. W., and J. L. Coffman (1993). Seismicity of the United States, 1568–1989 (revised), U.S. Geol. Surv. Prof. Paper 1527, 418 pp.
Wald, D. J, V. Quitoriano, L. A. Dengler, and J. W. Dewey (1999). Utilization of the Internet for rapid community intensity maps, Seism. Res. Lett. 70, 680–697.
[ Back ]