The order of the Movies, Figures and Tables below correspond to the order in which they are mentioned in main section of this publication. We have included the section headings.
Movie S1 [H.264-encoded MP4; 8.6 MB]. USArray deployment movie (to November 2013) showing the rolling view of the array. Other formats may be downloaded at http://anf.ucsd.edu/stations/deployment_history.php
Movie S2 [H.264-encoded MP4; 8.6 MB]. USArray deployment movie (to November 2013) showing the cumulative view of the array. Other formats may be downloaded at http://anf.ucsd.edu/stations/deployment_history.php
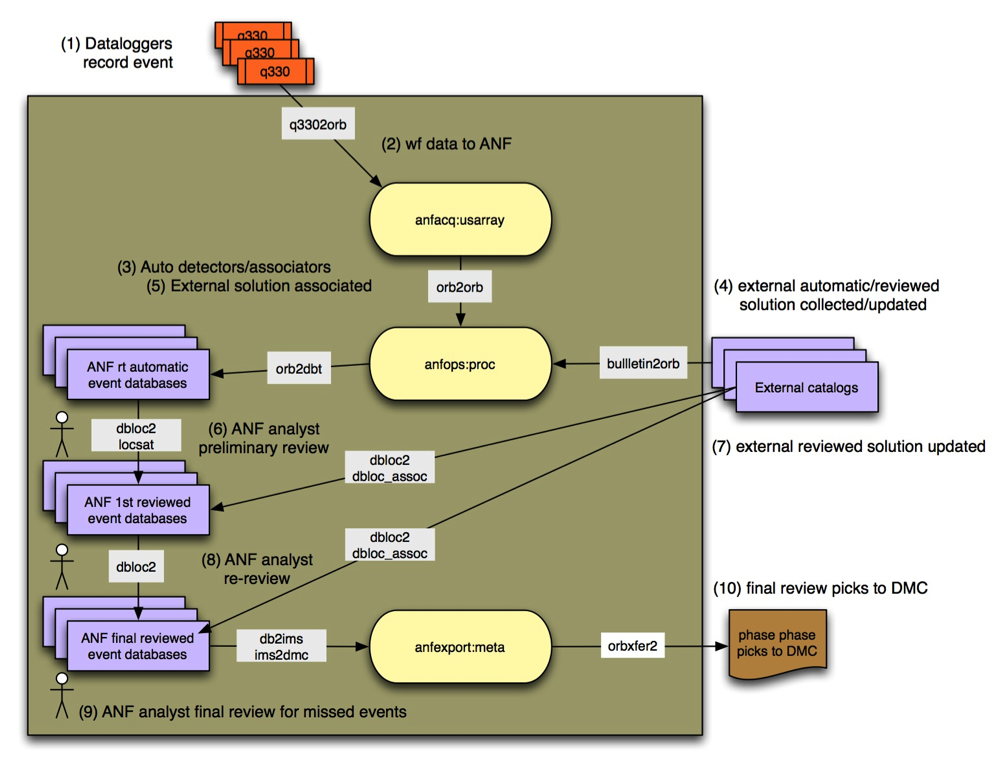
Figure S1. Event processing flow chart performed at ANF using Antelope environmental monitoring software package developed by BRTT. Input/Output processes are displayed outside the green box. Steps 1, 5, 7 and 10 are continuous automatic processes. ANF analysts perform steps 6, 8, and 9 manually. Antelope routines are shown inside white boxes. Yellow boxes display names of computers in which processes occur. Violet boxes indicate processes used to locate seismic events. ANF picks are sent after final analyst review to the DMC (step 10); from there they are forwarded to the ISC (International Seismological Center).
Table S1. Great earthquakes (M ≥ 8.0) occurred between April 2004 and November 2013
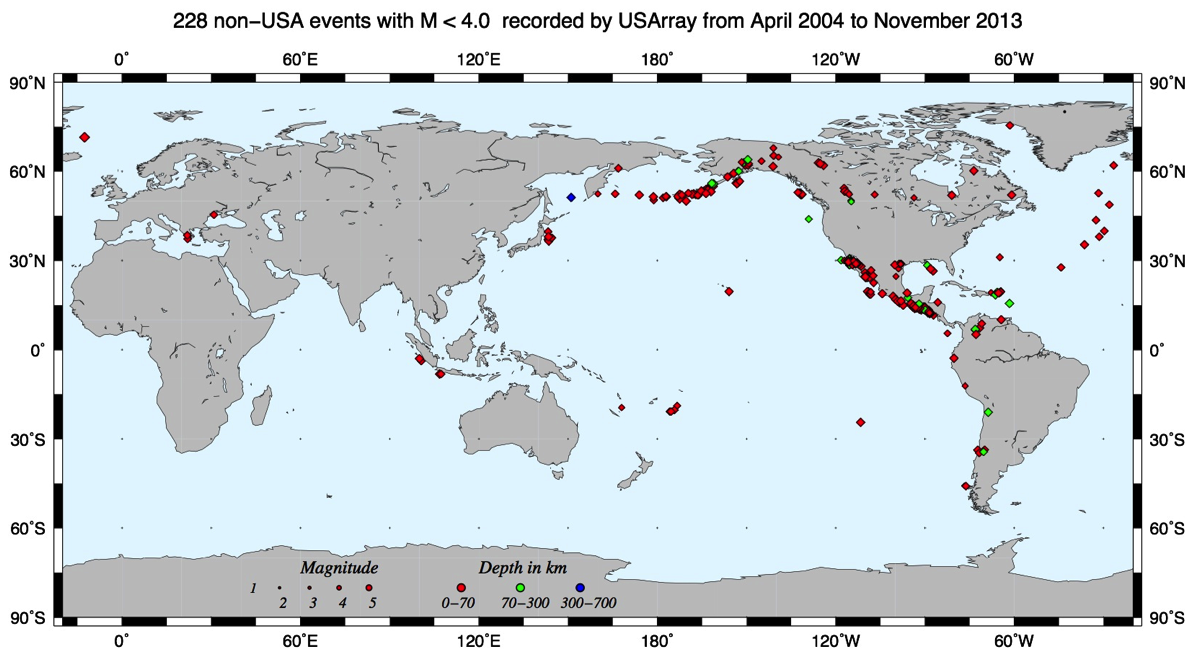
Figure S2. Location of moderate seismicity outside the conterminous US as defined by the red box in Figure 7. Symbol size is proportional to event magnitude and color indicates depth. (Figure S2a) Location map showing 8,820 earthquakes with 4.0 ≤ M < 5.0. (Figure 2b) USArray recorded 228 teleseismic events with all magnitudes M < 4.0 between April 2004 and November 2013.
Table S2. Summary of arrivals picked by ANF analysts for M ≥ 5.0 earthquakes between April 2004 and November 2013
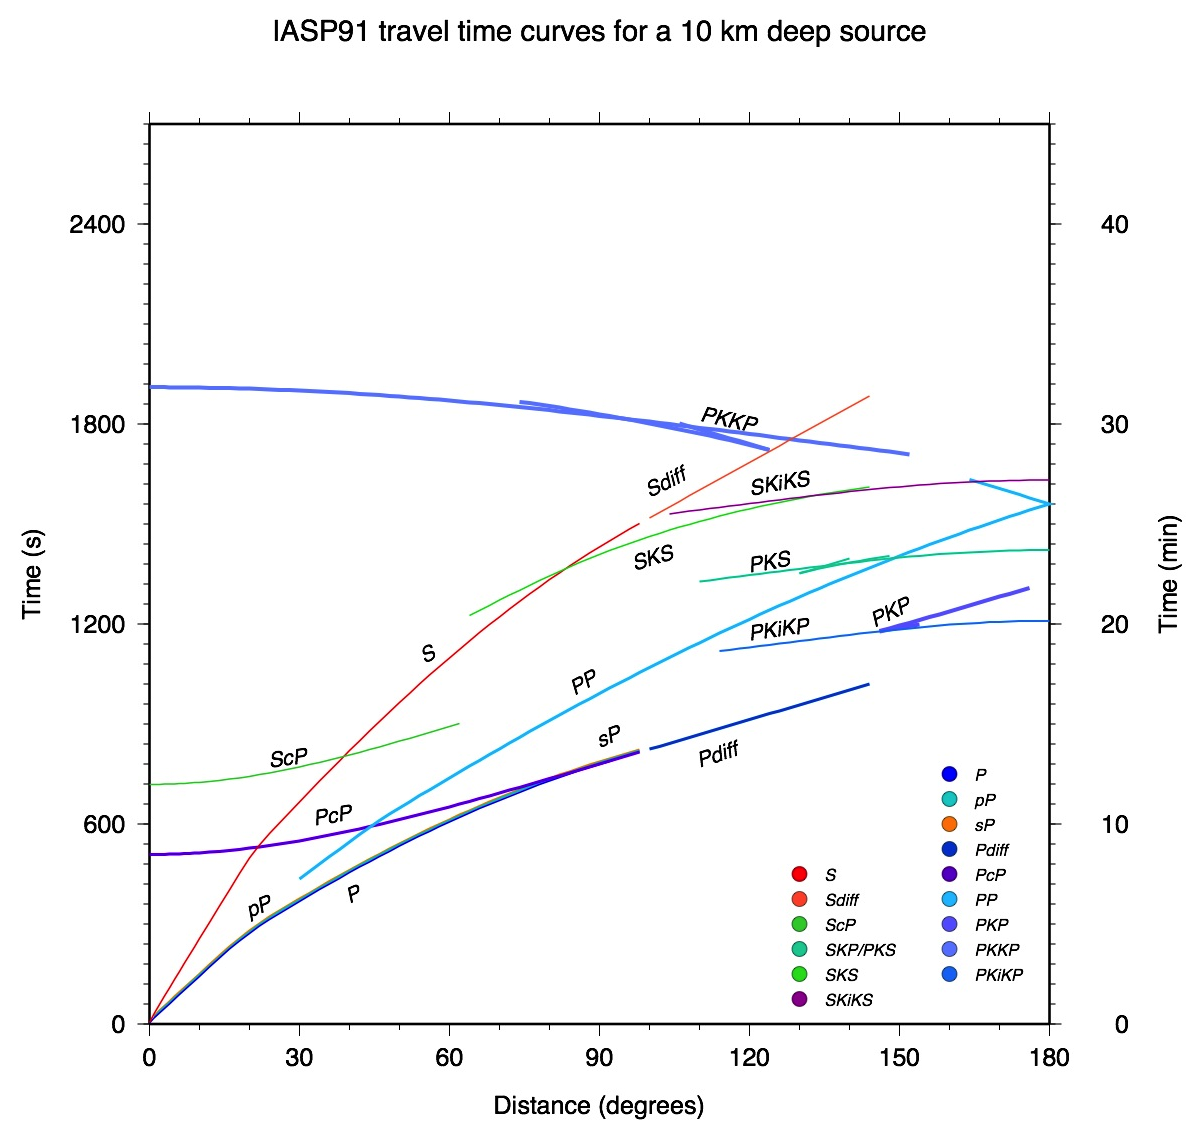
Figure S3. IASP91 theoretical travel-time phase arrivals for a 10 km depth source showing only the phases in Figure 5. The color code for each phase is shown to the lower right.
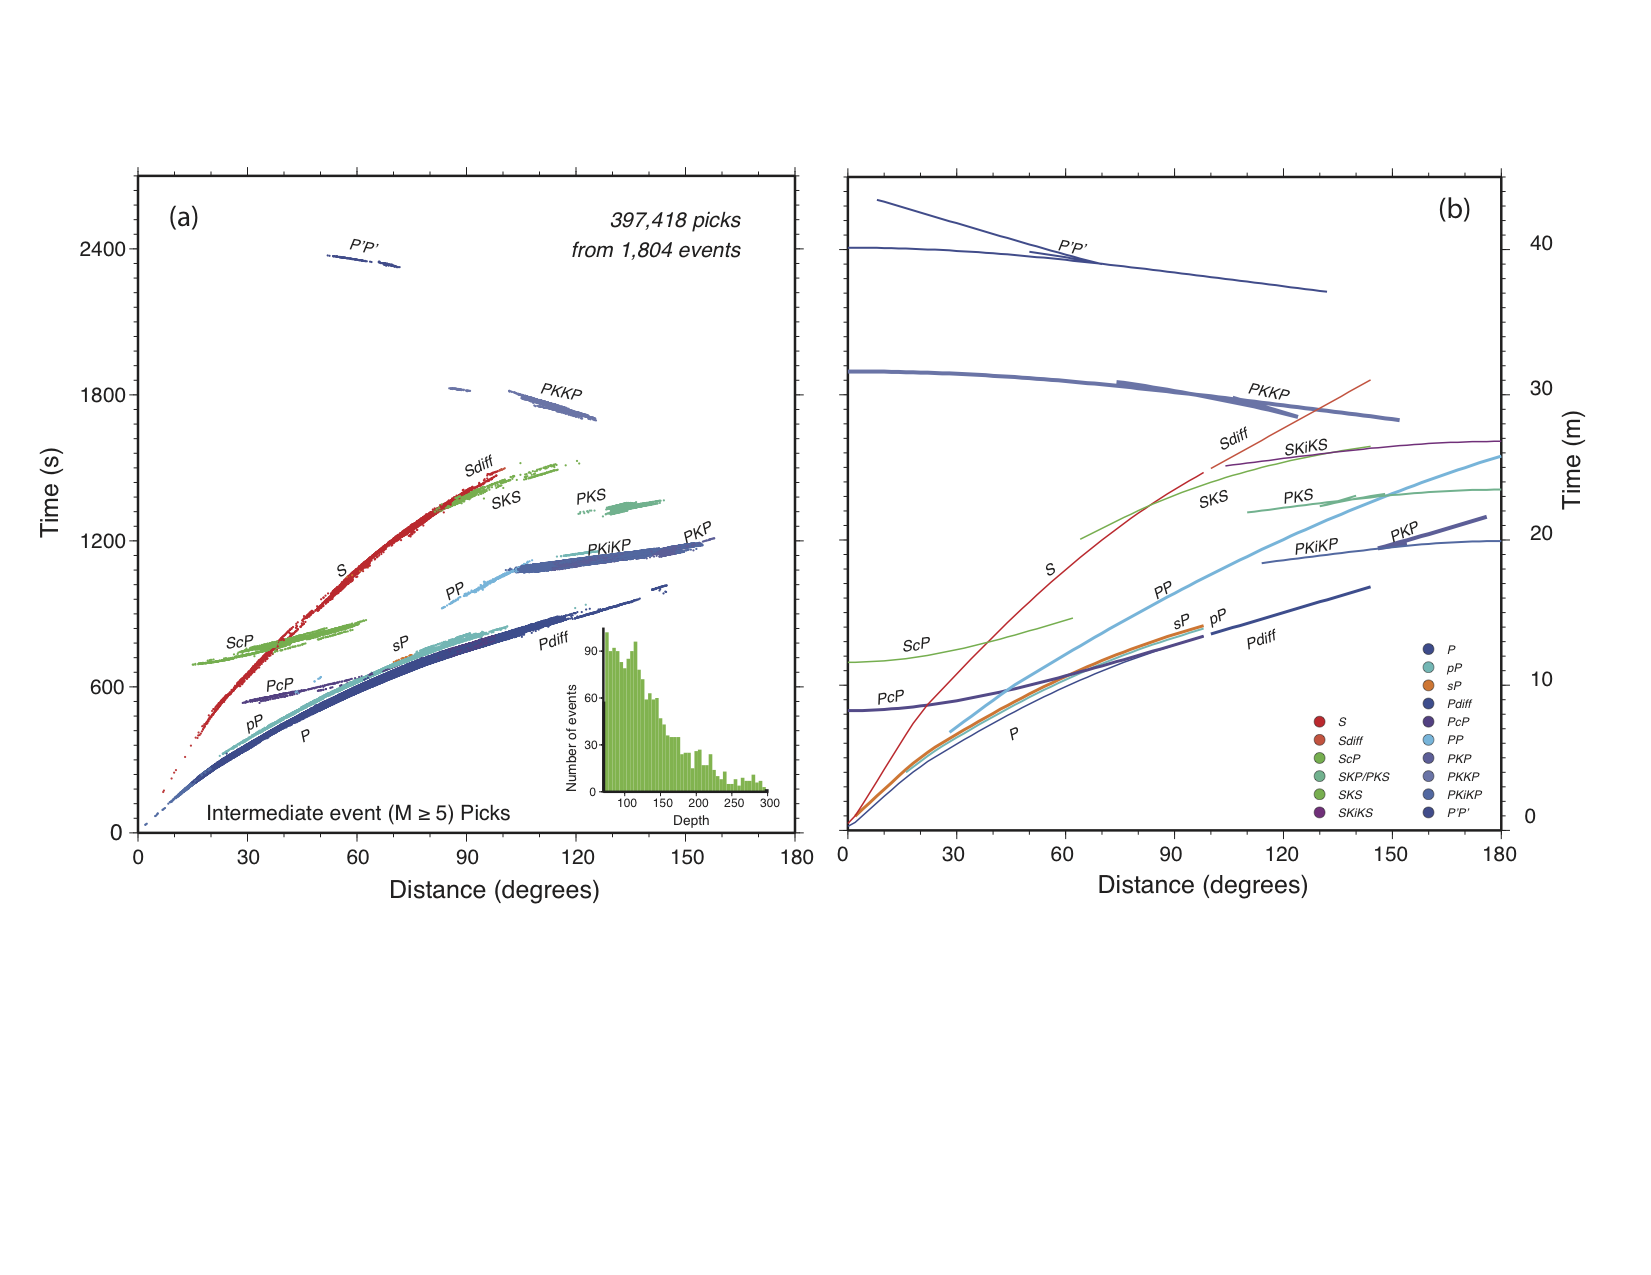
Figure S4. (a) Travel-time plot of ANF picks for intermediate-depth events (70 to 300 km), shown in Figure 3 by green circles. The histogram in the lower right shows the depth distribution in 5-km increments, with about 100 events per bin at shallower depths. The number of associated phase picks for each seismic phase is listed in Table S2. (b) IASP91 theoretical travel-time phase arrivals for a 120 km depth event. Associated phase picks in the ANF Seismic Bulletin are color-coded.
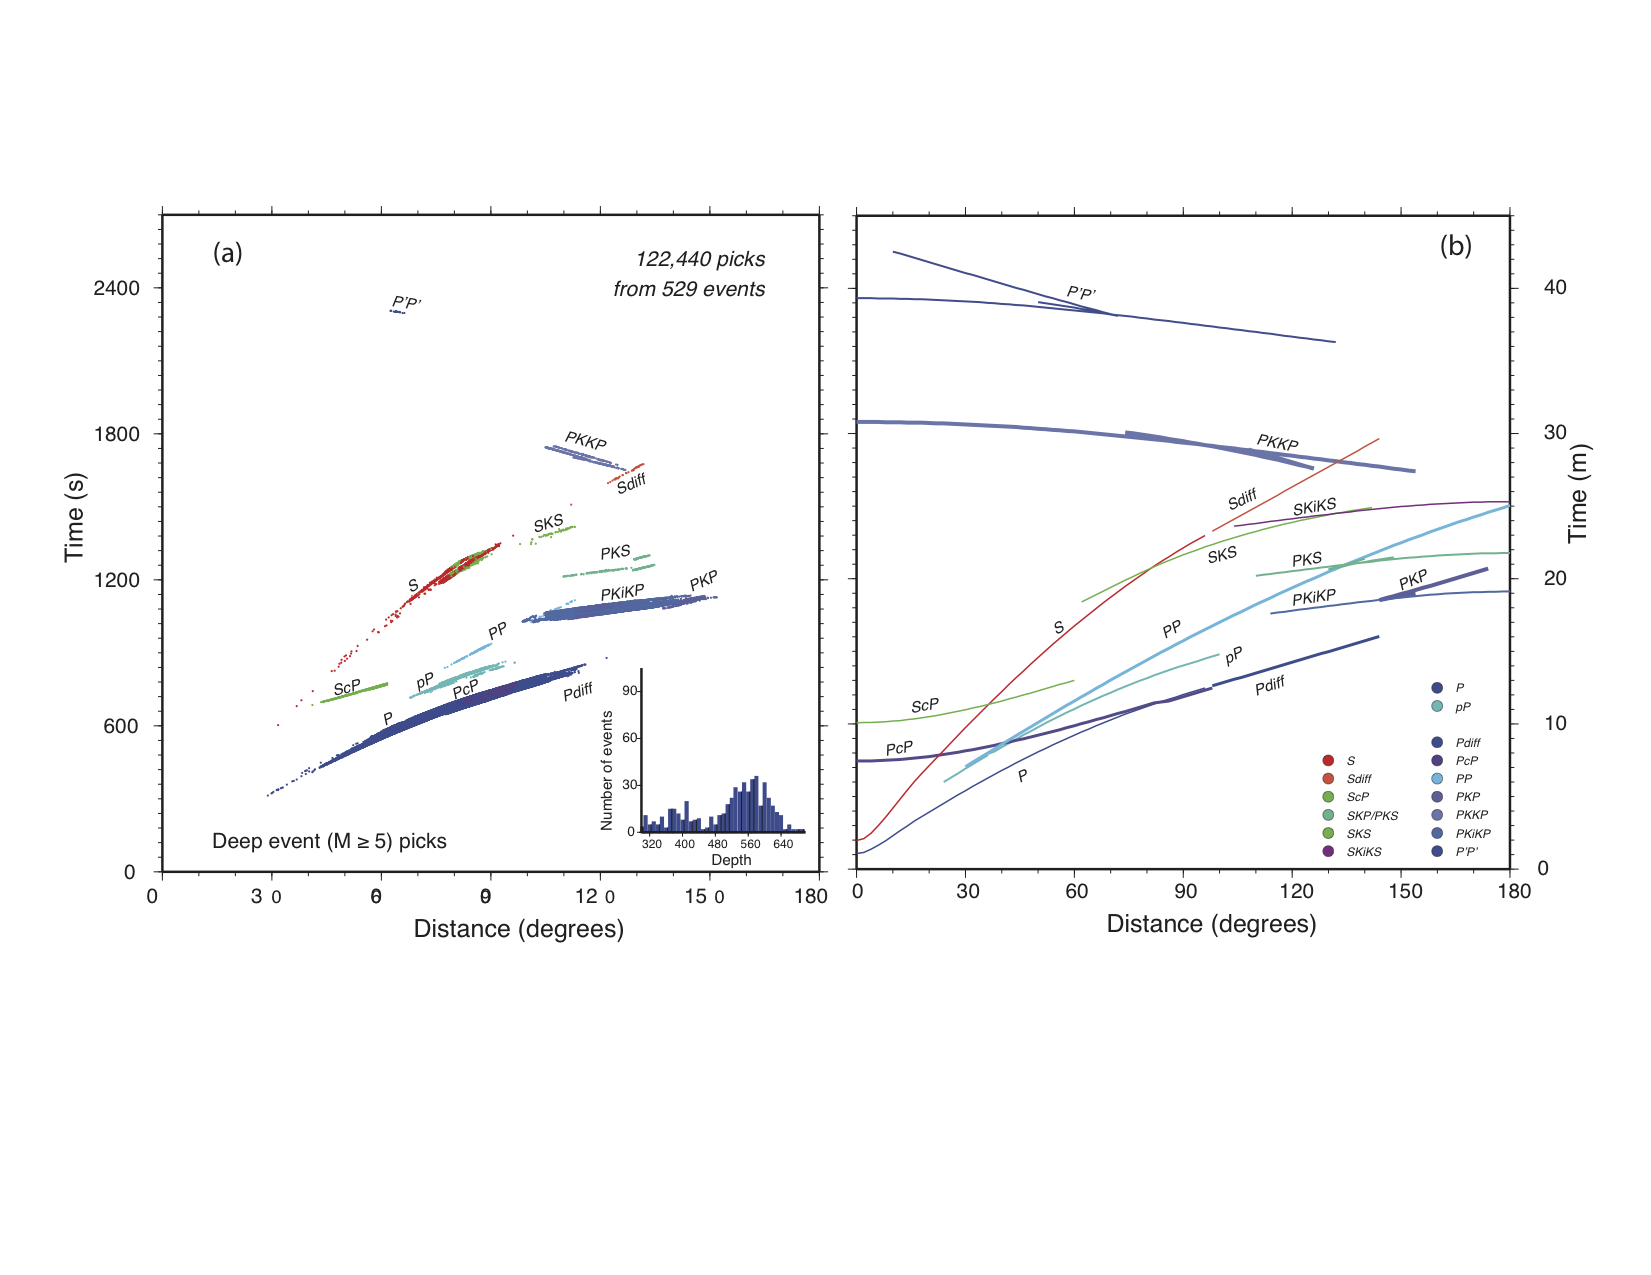
Figure S5. (a) Travel-time plot of ANF picks for deep events (depth ≥ 300 km) shown in Figure 3 in blue circles. The depth distribution in 10 km increments of the NEIC hypocenters is shown in the histogram in the lower right. The vertical scale in the histogram is the same as for the intermediate-depth events, (Figure S4a), with bins around 600 km containing approximately 30 events. The number of associated phase picks for each seismic phase is listed in Table S2. (b) IASP91 theoretical travel-time phase arrivals for a 550 km depth.
Table S3. Statistical Summary of ANF origin time standard deviation error (sdobs)
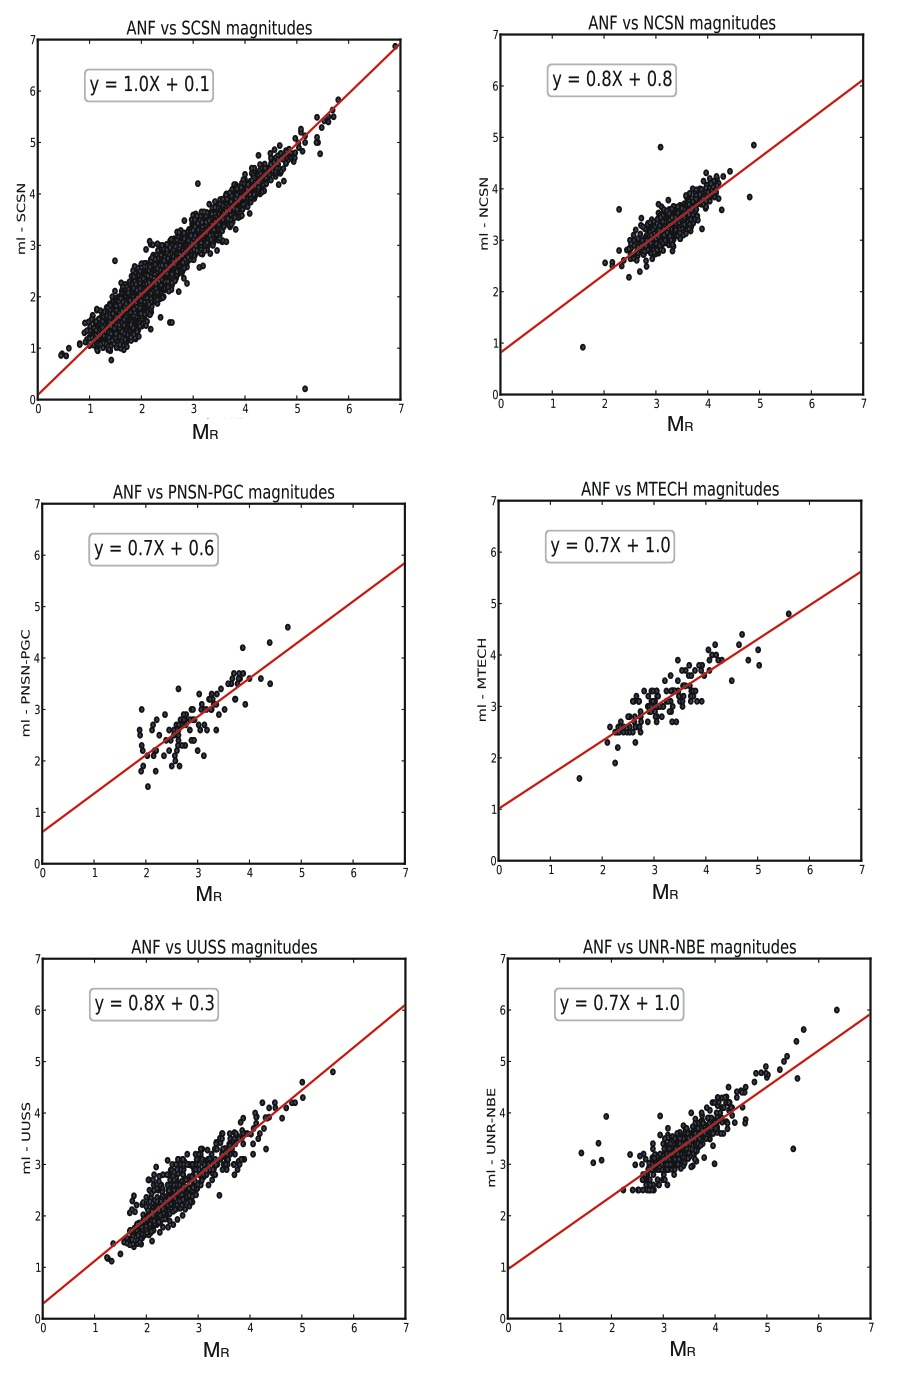
Figure S6a. Relationship local magnitude determined by regional networks in the western U.S to Richter local magnitude (MR) as determined by ANF. The best least square fitting line to the data is shown in red with the corresponding equation
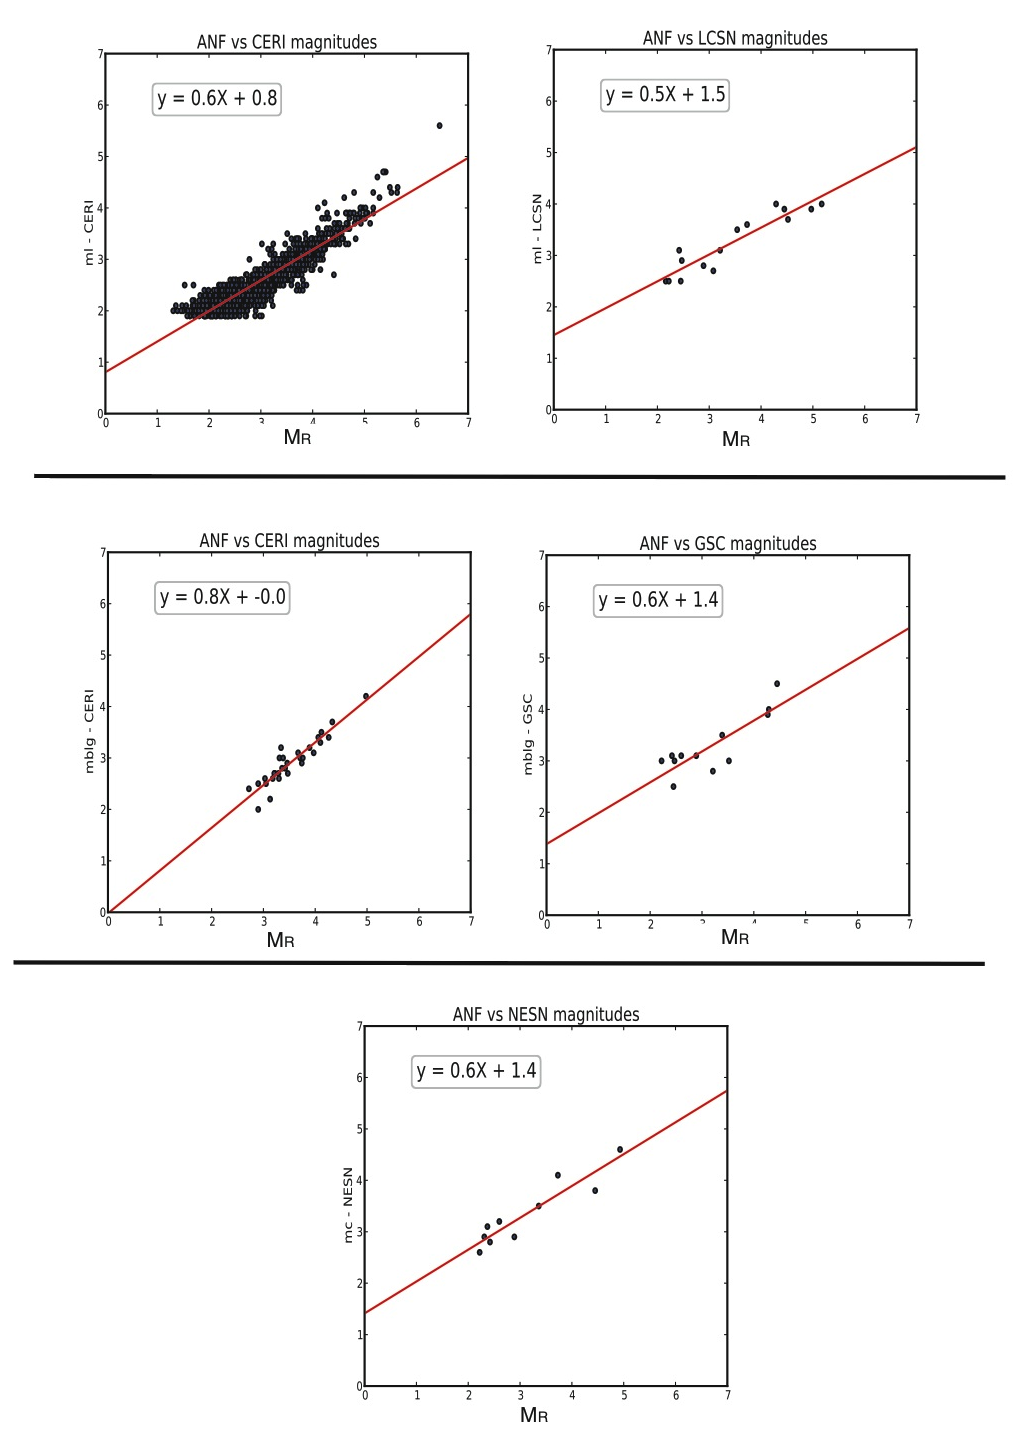
Figure S6b. The top two panels show the relationship between MR determined at ANF to the local magnitude determined by regional networks in the central (CERI) and eastern (LCSN) U.S. The middle panels show the relationship of mblg determined at CERI and GSC, while the lower panel shows the relationship of MR determined at ANF to Mc determined at the NESN. The best least square fitting line to the data is shown in red with the corresponding equation
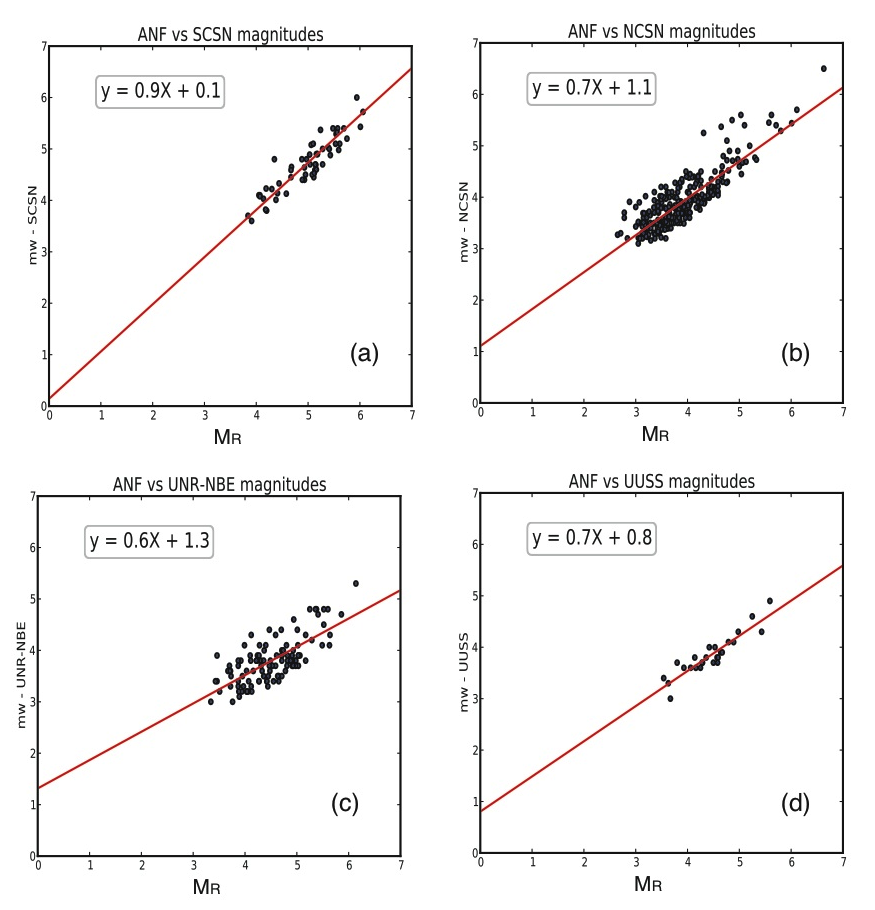
Figure S7. Relationship of Mw determined by regional networks in the western U.S to MR determined at ANF. The best least square fitting line to the data is shown in red with the corresponding equation.
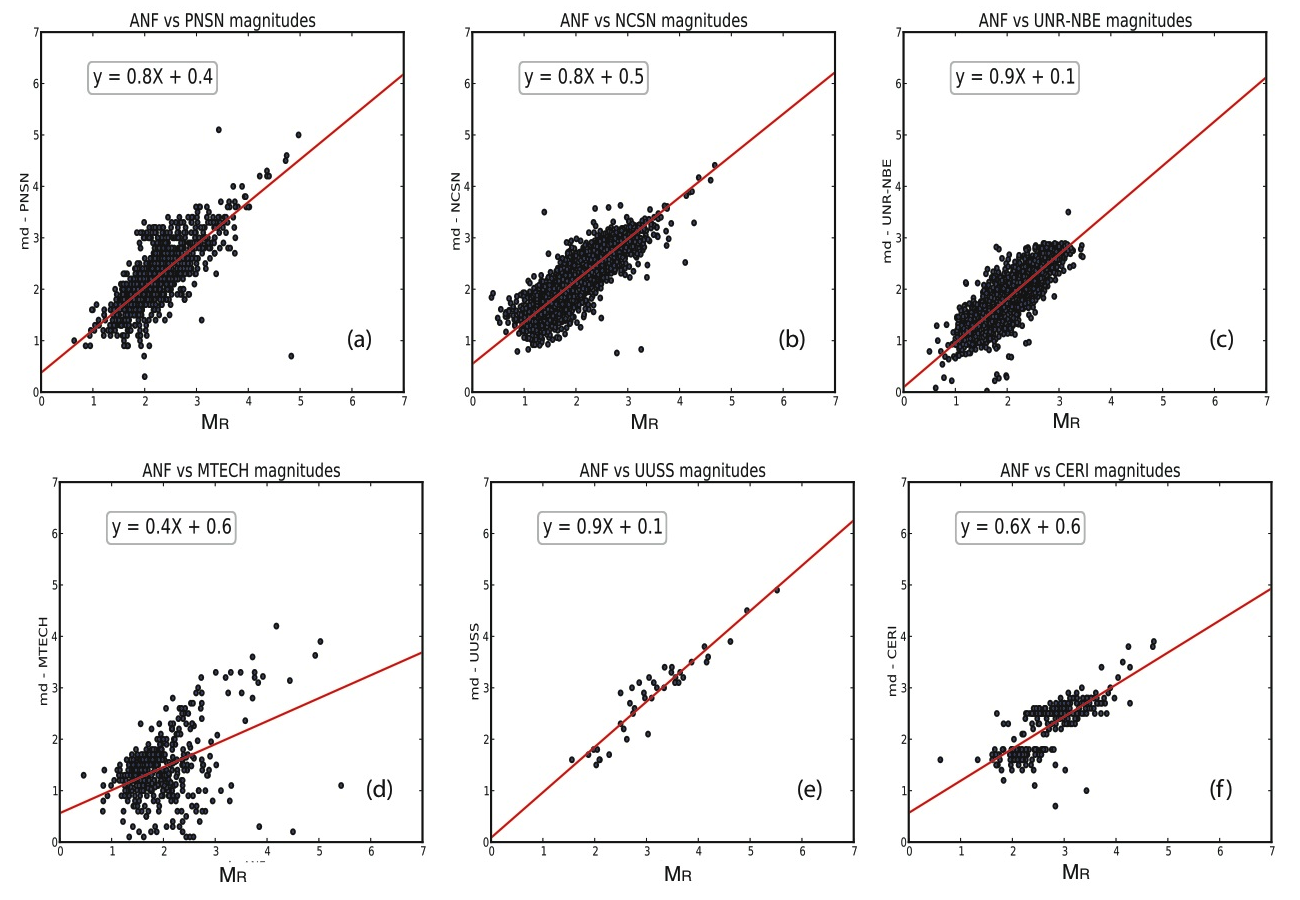
Figure S8. Relationship of md determined by regional networks in the western and central U.S to MR determined at ANF. The best least square fitting line to the data is shown in red with the corresponding equation.
Movie S3 [H.264-encoded MP4; 10.7 MB]. "Virtual day" seismicity movie (to November 2013); time steps are 6-minute long.
[ Back ]